Theranostics
13.3
Impact Factor
- Current Issue
- Advance Articles
- Volume 16; 2026
- Volume 15; 2025
- Volume 14; 2024
- Volume 13; 2023
- Volume 12; 2022
- Archive
- Cover Images
- Cover Suggestion
- Special Issues
Top
INTRODUCTION
MATERIALS AND METHODS
RESULTS
DISSCUSSION
CONCLUSION
SUPPLEMENTARY MATERIAL
Acknowledgements
References
INTRODUCTION
MATERIALS AND METHODS
RESULTS
DISSCUSSION
CONCLUSION
SUPPLEMENTARY MATERIAL
Acknowledgements
References
International Journal of Biological Sciences
International Journal of Medical Sciences
 Global reach, higher impact

Theranostics 2012; 2(8):746-756. doi:10.7150/thno.4762 This issue Cite
Research Paper
Dynamic PET and Optical Imaging and Compartment Modeling using a Dual-labeled Cyclic RGD Peptide Probe
Lei Zhu1,2,*, Ning Guo2,3,*, Quanzheng Li4, Ying Ma2, Orit Jacboson2, Seulki Lee2, Hak Soo Choi5, James R. Mansfield6, Gang Niu2 ![]() , Xiaoyuan Chen2
, Xiaoyuan Chen2 ![]()
1. Center for Molecular Imaging and Translational Medicine, Xiamen University, Xiamen, Fujian, China, 361005
2. Laboratory of Molecular Imaging and Nanomedicine (LOMIN), National Institute of Biomedical Imaging and Bioengineering (NIBIB), National Institutes of Health, Bethesda, MD, 20892
3. Department of Biomedical Engineering, Huazhong University of Science and Technology, Wuhan, Hubei, China, 430074
4. Department of Radiology, Massachusetts General Hospital, Harvard Medical School, Cambridge, MA 02138
5. Division of Hematology/Oncology, Department of Medicine and Department of Radiology, Beth Israel Deaconess Medical Center, 330 Brookline Avenue, SLB-05, Boston, MA 02215
6. Caliper Life Sciences, Inc., 68 Elm Street, Hopkinton, MA 01748
* Lei Zhu and Ning Guo contributed equally.
Received 2012-6-19; Accepted 2012-6-26; Published 2012-8-6
Citation:
Zhu L, Guo N, Li Q, Ma Y, Jacboson O, Lee S, Choi HS, Mansfield JR, Niu G, Chen X. Dynamic PET and Optical Imaging and Compartment Modeling using a Dual-labeled Cyclic RGD Peptide Probe. Theranostics 2012; 2(8):746-756. doi:10.7150/thno.4762. https://www.thno.org/v02p0746.htm
Other stylesAbstract

Purpose: The aim of this study is to determine if dynamic optical imaging could provide comparable kinetic parameters to that of dynamic PET imaging by a near-infrared dye/64Cu dual-labeled cyclic RGD peptide.
Methods: The integrin αvβ3 binding RGD peptide was conjugated with a macrocyclic chelator 1,4,7,10-tetraazacyclododecane-1,4,7,10-tetraacetic acid (DOTA) for copper labeling and PET imaging and a near-infrared dye ZW-1 for optical imaging. The in vitro biological activity of RGD-C(DOTA)-ZW-1 was characterized by cell staining and receptor binding assay. Sixty-min dynamic PET and optical imaging were acquired on a MDA-MB-435 tumor model. Singular value decomposition (SVD) method was applied to compute the dynamic optical signal from the two-dimensional optical projection images. Compartment models were used to quantitatively analyze and compare the dynamic optical and PET data.
Results: The dual-labeled probe 64Cu-RGD-C(DOTA)-ZW-1 showed integrin specific binding in vitro and in vivo. The binding potential (Bp) derived from dynamic optical imaging (1.762 ± 0.020) is comparable to that from dynamic PET (1.752 ± 0.026).
Conclusion: The signal un-mixing process using SVD improved the accuracy of kinetic modeling of 2D dynamic optical data. Our results demonstrate that 2D dynamic optical imaging with SVD analysis could achieve comparable quantitative results as dynamic PET imaging in preclinical xenograft models.
Keywords: dual modality imaging, dynamic imaging, kinetic modeling, Singular value decomposition (SVD), integrin αvβ3, RGD peptide.
INTRODUCTION
Molecular imaging technology accelerates the translation of preclinical research to the clinic by providing physiological, anatomic and metabolic information through interrogating certain targets [1-3]. Among the imaging technologies, positron emission tomography (PET) has been well-established as a clinical molecular imaging modality with high sensitivity and deep tissue penetration [4, 5]. On the other hand, optical imaging, because of its non-radiation property and the relatively low cost, is more suitable for high-throughput preclinical drug evaluations in small animals [6]. Near-infrared (NIR) dyes (700 to 900 nm emission wavelength) are of particular interest due to their low tissue absorption and low autofluorescence [7, 8]. There are also increasing efforts to apply optical imaging in clinical imaging guided surgery, endoscopy and interventional procedures [9, 10].
Integrins are ideal pharmacological targets not only because they play a key role in angiogenesis, leukocytes function and tumor development but also because they are easy to access as cell surface receptors interacting with extracellular ligands [11, 12]. Among the integrin members, the αvβ3 integrin, which binds to arginine-glycine-aspartic acid (RGD)-containing components of the interstitial matrix such as vitronectin, fibronectin and thrombospondin, is expressed in a number of tumor types such as melanoma, late stage glioblastoma, ovarian, breast, and prostate cancer [12]. Preclinical studies and clinical trials showed that RGD containing peptides and RGD peptidomimetics are effective in inhibition of angiogenesis [13, 14]. Some RGD analogs are under clinical trials for tumor imaging [15] or therapy [13]. Therefore, visualization of integrin will be of great benefit for the drug development, early detection and cancer therapy response monitoring [16-18].
Compared with static imaging, dynamic imaging followed by kinetic analysis can be used to quantitatively calculate the perfusion/clearance rates. Furthermore, dynamic imaging facilitates the separation of specific signal from non-specific signal and thus can be applied to accurately measure the binding potential (Bp) of an agent [19]. In addition, parametric mapping of dynamic imaging emphasizes the spatial distribution of the specific signal at the voxel level, and allows interpretation of physiological function, pharmacokinetics, as well as the behavior of a target molecule [20-23]. Dynamic imaging can be applied to both optical and PET data; however, the comparison of PET/optical dynamic imaging is rarely reported. Whether the 2D optical data could mimic 3D PET data and derive similar dynamic parameters is yet unknown.
The quantification of optical imaging is very challenging because of photon scattering and tissue attenuation [6]. With Cy5.5 conjugated RGD peptide, Gurfinkel et al. [24] performed dynamic optical imaging and successfully calculated PK parameters using a three-compartment modeling. In this study, we designed, synthesized and characterized a 64Cu/ZW-1 dual labeled imaging agent, c(RGDyK)-C(DOTA)-ZW-1, for in vivo comparison and correlation of dynamic optical and PET imaging parameters. Singular value decomposition (SVD) model was applied to un-mix 3D optical signal from 2D projection data, and kinetic modeling was used to separate non-specific components from specific binding component for both optical and PET dynamic data. To the best of our knowledge, the results demonstrated for the first time that dynamic optical imaging could provide comparable in vivo kinetic parameters to that of dynamic PET imaging.
MATERIALS AND METHODS
Synthesis of c(RGDyK)-Cys (DOTA)-ZW-1
c(RGDyK) was reacted with Fmoc-Cys (Trt)-COOH (5 eq.) in the presence of 2-(1H-7-azabenzotriazol-1-yl)--1,1,3,3-tetramethyl uronium hexafluorophosphate methanaminium (HATU, 5 eq.) and 2% DIPEA in DMF using the conventional Fmoc chemistry. The reaction lasts for 2 h at room temperature. Peptide was precipitated in cold ether and further dried by vacuum. Before the HPLC purification, Fmoc group on Cysteine was removed by incubating with 20% piperidine for 30 min. For ZW-1 (ex/em; 775/790 nm) conjugation, ZW-1-NHS (1.5 eq.) was reacted with c(RGDyK)-Cys in DMF with 2% DIPEA for 1 hour. After precipitation in cold ether, the protection group on Cysteine side chain was removed by treatment with TFA cocktail (TFA/H2O/TIS/EDT, 85/5/5/5, v/v/v/v) to afford c(RGDyK)-Cys-ZW-1. The compound was purified by reversed phase HPLC. DOTA-maleimide (1.5 eq.) was reacted with c(RGDyK)-Cys-ZW-1 at pH 7.0 in PBS buffer for 1 h. The c(RGDyK)-Cys(DOTA)-ZW-1 (RGD-C(DOTA)-ZW-1) was purified by HPLC under the condition of 10% to 55% acetonitrile containing 0.1% TFA in 30 min. HPLC-ES/MS (m/z) calculated/found: 2173/2173.
Radiolabeling
RGD-C(DOTA)-ZW-1 was dissolved in DMSO to the final concentration of 10 µg/µl. 64Cu-CuCl2 was converted to 64Cu-Cu(OAc)2 by adding 0.98 mL of 0.4 M NH4OAc (pH = 5.5) solution to 20 μL 64Cu-CuCl2. To a clean Eppendorf tube was added 80 µg of RGD-C(DOTA)-ZW-1 solution and an aqueous solution of 64CuCl2 solution (~ 3 mCi). The reaction mixture was then heated at 40ºC in a water bath for 20 min. Thereafter, the radiochemical purity was determined using C-18 TLC plates (KC18F, 60 A, 200 μm, Whatman USA), developed in 2% ethylenediaminetetraacetic acid (EDTA) in water. The purity of the radiolabeled compound was further analyzed using an HPLC system. UV absorbance was monitored at 214 nm, 778 nm and radioactivity was detected by a radiation detector. 64Cu labeled RGD-C(DOTA)-ZW-1 was purified via Sep-Pak C18 Chromatography Cartridge (Waters, USA) by ethanol washing. The final product was then formulated in PBS, sterile filtered, and used for in vitro and in vivo experiments.
Cell culture
MDA-MB-435 cell line was purchased from the American Type Culture Collection (ATCC). The cells were grown in Leibovitz's L-15 medium containing 10% (v/v) fetal bovine serum supplemented with penicillin (100 µg/ml) and treptomycin (100 μg/ml) at 37°C under 100% air atmosphere.
Cell receptor binding assay
Competition cell binding assay was done using integrin αvβ3-specific radioligand, 125I-echistatin. MDA-MB-435 cells were grown up to 80% confluency and then scraped off and resuspended with binding buffer [25 mM 2-amino-2-(hydroxymethyl)-1,3-propanediol, hydrochloride (Tris-HCl), pH 7.4, 150 mM NaCl, 1 mM CaCl2, 0.5 mM MgCl2 and 1 mM MnCl2, 0.1% bovine serum albumin (BSA)]. Incubation was conducted in a 96-well plate with each well containing 2×10⁵ cells, 0.02 μCi (0.74 kBq) 125I-echistatin (Perkin-Elmer), 0-20,000 nM of RGD-C(DOTA)-ZW-1, c(RGDyK)-ZW-1 and c(RGDyK) in 200 μL for 2 h on a shaker at room temperature. After incubation, cells were washed three times with cold PBS containing 0.1% BSA. Thereafter, the plate was heated to 40°C and dried. The dried filter membranes were punched off from the wells, collected in polystyrene culture test tubes (12×75 mm), and counted for cell bound radioactivity (1480 Wizard 3 gamma counter; Perkin-Elmer). The IC50 values were calculated by nonlinear regression analysis using the GraphPad Prism fitting program (GraphPad Software, Inc., San Diego, CA, USA). Each data point is a result of the average of triplicate wells.
Cell fluorescent staining
For cell immunostaining, MDA-MB-435 cells were seeded into eight-well chamber at the concentration of 1×10⁴ cells/well. The next day, cells were fixed by 90% cold ether for 20 min at -20°C. After being blocked by 10% BSA at 37°C, MDA-MB-435 cells were detected using 50 µg/ml integrin αvβ3 primary antibody (Abegrin) for 2 h at room temperature, and then visualized by FITC conjugated goat anti-human secondary antibody (1: 1000 dilution).
Fixed cells were incubated with RGD-C(DOTA)-ZW-1 at room temperature for 1 h. To confirm that RGD-C(DOTA)-ZW-1 binds specifically to integrin αvβ3, fixed MDA-MB-435 cells were blocked with 10% BSA for 1 h and incubated with 10 µM unlabeled c(RGDyK) before RGD-C(DOTA)-ZW-1 (1 µM) was added. After washing steps, cells were mounted with 4′, 6-diamidino-2-phenylindole (DAPI)-containing mounting medium and observed with an epifluorescence microscope (Olympus, X81).
Animal studies
All animal studies were conducted in accordance with the principles and procedures outlined in the National Institutes of Health (NIH) Guide for the Care and Use of Animals, and under protocols approved by the NIH Clinical Center Animal Care and Use Committee (CC/ACUC). The MDA-MB-435 tumor model which expresses medium level of integrin αvβ3 was chosen for dynamic PET and optical imaging. The tumor model was established by injecting 5×10⁶ cells into the left mammary fat pad of each female athymic nude mouse at 5-6 weeks of age (Harlan Laboratories, Frederick, MD). Tumor growth was monitored by caliper measurements three times a week after the tumors are palpable. The mice were used for PET or optical imaging when the tumor volume reached about 300 mm3 (about 14 days after tumor inoculation). The tumor volume was determined as the formula: V=a × (b2)/2, where a and b are the length and width of each tumor in mm respectively.
Acquisition of dynamic images
Optical data acquisition and analysis were done using DyCE function in Maestro 2. 0 in vivo imaging system (Cambridge Research & Instrumentation, Woburn, MA). MDA-MB-435 tumor-bearing mice were each injected via tail vein with 2 nmol of c(RGDyK)-Cys(DOTA)-ZW-1 in 100 µl PBS. The mice were subjected to 1 h in vivo dynamic optical imaging by Maestro 2.0 configured for NIR detection. The dynamic scanning started 20 s ahead of remote probe injection with a catheter. Typically, 10 s per frame was used for the first 900 s, 15 s/frame for the second 900 s, and 25 s/frame for the last 1800 s. During the injection and image acquisition process, the mice were anesthetized with 1.0-2.0 % isoflurane in oxygen delivered at a flow of 1.5 L/min. After completion of the image acquisition, spectral un-mixing yielded the pseudocolored images of the pure spectrum of ZW-1. Image pre-processing and analysis were performed using the DyCE software provided by the manufacturer. For quantitative comparison, regions of interest (ROIs) were drawn over tumors and muscle, and the average signal (x106 photon/cm2/s) for each area was measured. Results were presented as mean ± std (n = 5).
Dynamic PET scans were performed using an Inveon PET scanner (Siemens Preclinical Solutions). Each MDA-MB-435 tumor-bearing mouse was placed at the center of the field of view (FOV) of the scanner. The dynamic PET data acquisition was started instantaneously before the injection of ~3.7 MBq 64Cu-c(RGDyK)-Cys(DOTA)-ZW-1 in 100 µl in PBS via tail-vein. The body temperature of mice was maintained using a thermostat-controlled thermal heater. PET Images were reconstructed by 2-dimensional ordered-subsets expectation maximum (OSEM) algorithm and the frame rates were 10×30s, 20×60s, 5×120s and 5×300s. Results were presented as mean ± std (n = 5).
Kinetic modeling and parameter estimation
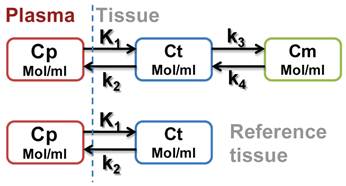
Kinetic analysis of regional time activity curves (TACs) was performed with both two-tissue (three-compartment) model and one-tissue (two-compartment) model. The three-compartment model describes RGD tracer kinetics in the tumor where each compartment represents the concentration of the unmetabolized radiotracer in arterial blood plasma (Cp), that of the free or non-specific binding tracer in interstitial and intracellular space (Ct) and that of the tracers specifically bounded to integrin (Cm). The ROI (t) represents the sum of radioactivity from all compartments and a fraction of plasma concentration. Similarly, the two-compartment model describes RGD tracer kinetics using muscle as a reference tissue and ref(t) represents free (non-specific binding) tracer in the reference tissue (muscle) region as a scheme shown in Figure A.
Figure A
Scheme A.
Based on Logan plot shown in Eq. 1, the ratio between the integral of Cp(t) and the instantaneous value of ROI(t), and the ratio between the integral and the instantaneous value of ROI(t) become linearly related when the exchange between the target tissue and plasma reaches an equilibrium (t > t*).
(1)
Where DV denotes the distribution volume that can be easily calculated using linear regression. It is a measure of the capacity of the tissue to bind the particular tracer and can be regarded as the sum of specific (Vs = K1k3/(k2k4)) and nonspecific (VND = K1/k2) distribution.
(2)
(3)
Total volume of distribution is defined as:
(4)
Where K1, k2, k3, and k4 are calculated by fitting the model to a 60-min dynamic PET data [25].
In this study, muscle is selected as the reference tissue because of its negligible integrin expression. The relationship between muscle uptake and plasma concentration could be established using a two-compartment model as [26-28]:
(5)
where ref(t) refers to uptake in reference tissue region and k2ref refers to the washout rate from interstitial space into blood in reference tissue. Consequently, the integrated activity in the tumor normalized by tumor uptake versus that of the muscle becomes linear according to
(6)
The Logan graphical analysis is used to compute Bp. In Logan plot, the ratio of integrated tumor uptake divided by tumor uptake is set as the y-axis, and the ratio of integrated reference tissue uptake divided tumor uptake is set as the x-axis. The slope of the linear portion of the Logan plot is calculated as distribution volume ratio (DVR). The binding potential is computed as Bp = DVR-1.
Note that binding potential, which is a macro-parameter reflecting the binding affinity, is also defined as
(7)
Optical image compression - SVD analysis
For dynamic optical image analysis, singular value decomposition (SVD) method was performed before kinetic modeling to un-mix the specific signal component of tumor from the 2D optical projection data [29]. First, the TACs of ROIs in tumor, muscle and background were formed as 2-dimention spatial-temporal matrices. After SVD performed on the data matrices, a series of eigenvalues and eigenvectors sorted by the amplitude of energy were generated. We then applied L-curve method to threshold the eigenvalues to identify the meaningful eigenvectors. The L-curve method is usually used to distinguish the signal components from the noise components in a SVD result. This type of application was first introduced by Lawson and Hanson [30] and then Miller [31]. By comparing the resulting eigenvectors in three ROIs, the specific tumor component and muscle component were consequently identified. Finally, the time course of tumor was recovered by projecting the original time course to specific tumor eigenvector. The same method was applied to the reference region and the time course of muscle was obtained. The separated time-intensity curves of tumor and reference tissue were fed to the Logan graphical analysis to compute the kinetic parameters as described above.
Statistical methods
Quantitative data were expressed as mean ± SD. Means were compared using one-way analysis of variance and Student's t test. P value of < 0.05 was considered statistically significant.
RESULTS
Peptide synthesis and characterization
To conjugate both the macrocyclic chelator DOTA and NIR dye ZW-1 on one compound to form a dual functional agent, we designed a RGD analogue containing one Cysteine at ε-amine group of the lysine residue. As shown in Figure 1A, this structure allows specific chemical modifications on either the mercapto group or the amine group. ZW-1 with NHS functional group was introduced onto the cysteine amine group of c(RGDyK)-Cys (red colored), while DOTA was conjugated based on the reaction of Cysteine mercapto group with DOTA maleimide (green colored).
The purity and molecular weight were verified by HPLC and LC-MS. The resulting RGD-C(DOTA)-ZW-1 probe demonstrated long wavelength NIR fluorescence (excitation maximum = 775 nm, emission maximum = 790 nm) as shown in Figure 1B, which is optimal for NIR optical imaging. For PET imaging, 64Cu was labeled with DOTA as reported previously [32].
Figure 1
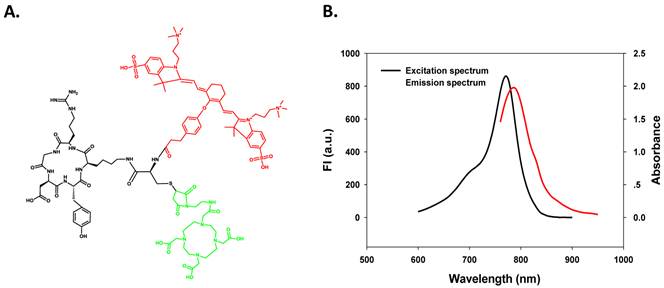
A. Chemical structure of dual-labeling cyclic RGD monomer analog, c(RGDyK)-C(DOTA)-ZW-1. B. Excitation and emission spectra of c(RGDyK)-C(DOTA)-ZW-1.
Competitive cell binding assay
The receptor binding affinity of c(RGDyK) and RGD-C(DOTA)-ZW-1 for integrin αvβ3 was measured and compared using MDA-MB-435 cells, which are known to express medium level of integrin αvβ3 [33, 34]. c(RGDyk) showed an IC50 value of 604.3 nM (Figure 2). After ZW-1 labeling and DOTA conjugation, the resulting compound RGD-C(DOTA)-ZW-1 remained similar binding affinity for integrin αvβ3 (IC50 = 924.5 nM).
Cell staining
As shown in Figure 3, positive integrin αvβ3 expression on MDA-MB-435 cells was confirmed by strong fluorescent signal observed with a specific antibody Abegrin. After incubating RGD-C(DOTA)-ZW-1 with MDA-MB-435 cells, strong signals were observed under the NIR filter by fluorescence microscopy (Olympus). The fluorescent signal from the RGD-C(DOTA)-ZW-1 could be effectively inhibited when the cells were pre-treated with free c(RGDyK) peptide, indicating the specificity of RGD-C(DOTA)-ZW-1 binding to integrin αvβ3.
Figure 2
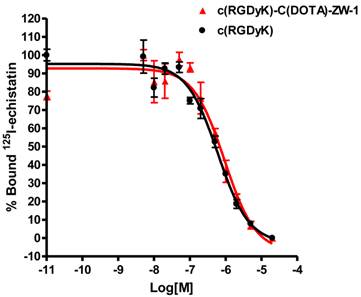
Competition of specific binding of 125I-echistatin with c(RGDyK) (red) and c(RGDyK)-C(DOTA)-ZW-1 (black) to αvβ3 integrin positive MDA-MB-435 cells as determined by receptor binding assay (n = 3).
Figure 3
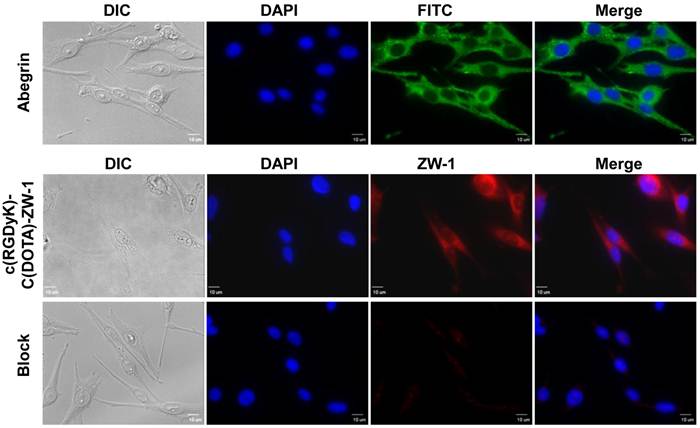
In vitro fluorescence staining of integrin αvβ3 positive cells. Upper panel: integrin αvβ3 was detected using 50 µg/ml integrin αvβ3 primary antibody (Abegrin) and visualized by FITC conjugated goat anti-human secondary antibody (1: 1000 dilution). Middle panel. 1 µM RGD-C(DOTA)-ZW-1 was used for cell labeling. Lower panel. 10 µM c(RGDyK) was used for blocking test. Green color is from FITC for integrin αvβ3, red color is from ZW-1 for RGD-C(DOTA)-ZW-1 and blue color is from DAPI for nuclei visualization (x400, Scale bar = 10 µm).
Dynamic PET and optical scans
The representative coronal section images at different time points were presented in Figure 4A. MDA-MB-435 tumors were clearly visible as early as 10 min after tracer injection. Liver and kidneys were major organs for tracer clearance and consequently showed relatively high radioactivity accumulation. The time activity curves (TACs) of tumor and muscle were presented in Figure 4B. 64Cu-RGD-C(DOTA)-ZW-1 had a reasonable tumor uptake (2.6 ± 0.2 %ID/g) around 5 minutes due to the first pass perfusion. At 1 hour post injection, a high tumor-to-background contrast (4.50 ± 0.18) was observed.
The representative 2D projected optical images at different time points were shown in Figure 4C. Consistent with PET images, high signal intensity was observed in the kidney region. Tumors were distinguishable from surrounding background region with good contrast. There was not much liver signal observed. TACs of tumor and muscle region of the optical images showed similar pattern with PET images (Figure 4D).
Optical image compression - SVD analysis
SVD analysis of the time course of dynamic optical image series was performed on tumor, muscle and background ROIs, as shown in Figure 5A. The resulting eigenvalues of tumor and muscle ROIs were plotted in Figure 5B, and the eigenvalues of background were illustrated in Figure 5C. The eigenvalues were plotted in log scale for better illustration. The first 4 eigenvectors of background, muscle and tumor ROIs sorted by the amplitude of energy were shown in Figure 5 D, E and F, respectively. The log scale eigenvalue curves obviously had L-shape and therefore a threshold was applied to each curve. After thresholding there were three signal components in the tumor ROI, two components in the muscle ROI and one component in the background ROI. The only signal component in the background was due to autofluorescence, which appeared as the first component in the SVD results of all three ROIs because by nature it should be included in all the regions. The other signal component (second in the figure) of muscle ROI was corresponding to the uptake of muscle, which was also the second component in the tumor ROI since the signal in the tumor ROI was a sum of the contribution of tumor and muscle in the overlapped region along the projection direction. In the tumor ROI, there were three signal components. The first two were from autofluorescence and muscle, respectively, and the third one was the specific component of tumor. The original time course of tumor and muscle were then projected to the identified components to recover the pure TACs of tumor and muscle.
Figure 4
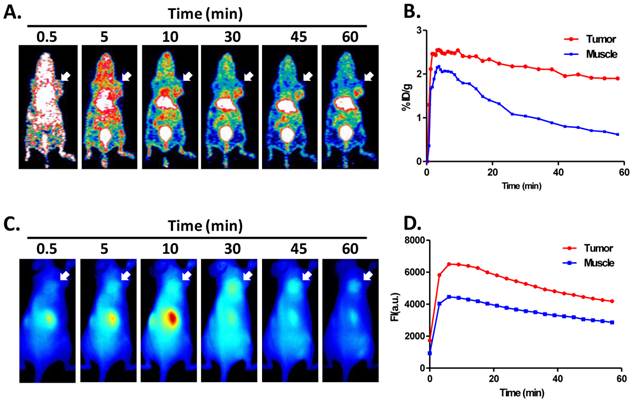
A. Representative coronal PET images of U87MG tumor-bearing mice derived from 1 h dynamic scan with injection of 2 nmol 64Cu-RGD-C(DOTA)-ZW-1 (100 µCi, 3.7 MBq). B. Time activity curve generated from dynamic PET images. C. Representative 2-D projection images of U87MG tumor-bearing mice derived from 1 h dynamic optical scan after injection of 2 nmol RGD-C(DOTA)-ZW-1. D. Time activity curve generated from dynamic optical imaging. Arrows indicate tumor location.
The recovered tumor and muscle time-activity curves which indicate the specific binding and free compound in tumor region were obtained by using eigenvalue projection to original TAC in tumor region, as shown in Figure 6A. To compare the separated optical TACs with PET data, we also calculated the specific and non-specific components in tumor region by kinetic modeling. The specific and free PET TACs shown in Figure 6B showed similar pattern with optical data.
Binding potential
To calculate and compare the binding potential (Bp) from dynamic PET and optical data, Logan graphical analysis were applied and the results are shown in Figure 7. The Logan plots with reference tissue model derived from 60-min dynamic PET data showed excellent linearity (Figure 7A). The Logan plots with reference tissue model derived from 60-min dynamic optical data with and without SVD analysis were shown in Figure 7B. Slopes of fitted lines represent DVRs and Bp = DVR-1. The Bp calculated from PET data was 1.752 ± 0.026. The Bp calculated from original dynamic optical data was 1.507 ± 0.113. With SVD projected data, the calculated Bp was 1.762 ± 0.020, which was improved to be more comparable with the PET result.
Figure 5
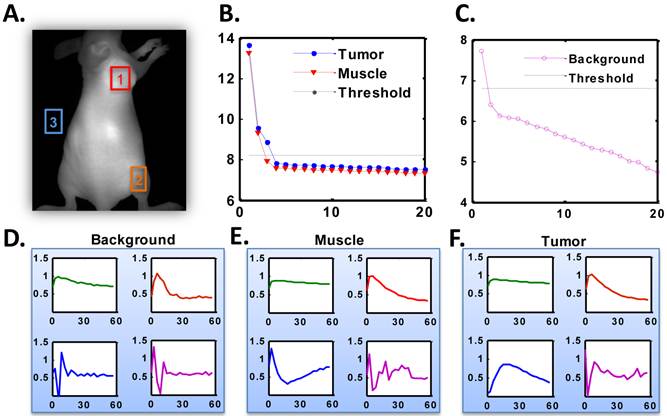
A. Representative optical image indicating ROI locations where ROI-1 refers to tumor, ROI-2 represents muscle and ROI-3 is background. B. log scale eigenvalue curves of dominant singular values from SVD analysis in the tumor and muscle ROI sorted by energy, which illustrate the efficient vectors screened by threshold. C. log scale eigenvalue curves of dominant singular values from SVD analysis in background ROI sorted by energy, which illustrates the efficient vectors screened by threshold. D-F. Representative amplitudes of the dominant eigenvectors in the background (D), muscle (E), and tumor (F) ROI sorted by energy.
Figure 6
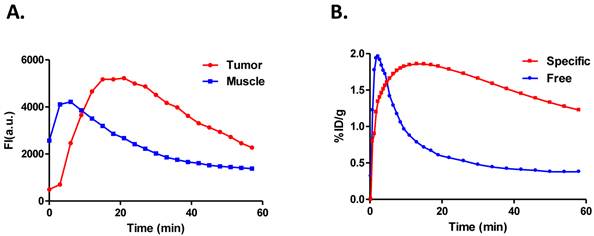
A. PET imaging time-activity curves of specific and free (non-specific) components separated from total tumor uptake by kinetic modeling. B. Projected time-activity curves recovered by SVD analysis from original optical dynamic images.
Figure 7
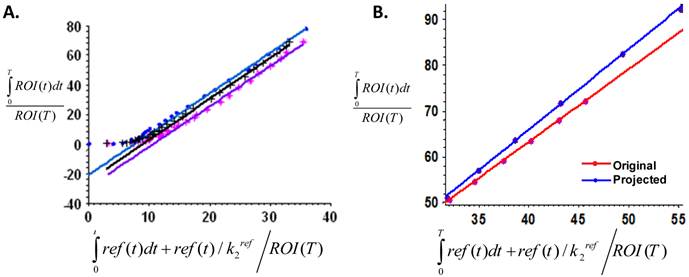
A. Logan plots with reference tissue model derived from 60-min dynamic PET data, which showed excellent linearity of normalized integrated (Int) tumor activity vs. normalized integrated muscle tissue activity effective for equilibrium after 30 min post-injection. B. Representative Logan plots with reference tissue model derived from 60-min dynamic optical data with and without SVD analysis. Red line showed the linear fitting of original optical data and blue line showed the fitted line derived from time courses projected by dominant eigenvectors in SVD analysis. Slopes of fitted lines represent DVRs and Bp=DVR-1. The binding potential calculated from PET data is 1.752 ± 0.026. The Bp calculated from original dynamic optical data is 1.5074 ± 0.113 while that from SVD projected data is 1.7624 ± 0.02 which is improved to be comparable with the PET result.
DISSCUSSION
Due to the photon scattering and tissue attenuation, accurate quantification of optical imaging is very challenging. The ability to localize and quantitatively reconstruct fluorescence parameters in biological tissues is limited, although diffusion-based fluorescence enhanced tomography has been developed for both clinical applications and preclinical experiments [35, 36]. Moreover, quantification based on static images is a simple add-up from tracers specifically bound to the receptors and those from blood perfusion and non-specific retention. Thus, to accurately assess the magnitude of specific binding of a tracer to the receptors, it is necessary to separate the overall signal into perfusion and nonspecific and specific binding components [25]. So far, several preclinical and clinical studies confirmed that dynamic imaging and compartment modeling could delineate specific binding of imaging tracers to the receptors from other components, which allows for more accurate noninvasive quantification of receptor expression [25, 34, 37].
In order to perform a parallel comparison between PET and optical imaging, we conjugated both ZW-1 dye [38] and DOTA on the cyclic RGD peptide. The dual-labeled agent was found to maintain similar integrin αvβ3 binding affinity to that of c(RGDyK) in vitro, suggesting that dye (ZW-1) and chelating agent (DOTA) modification did not affect the biological activity of RGD peptide. To make sure that the same amount of probe is administered for both optical and PET imaging, we purposely mixed unlabeled RGD-C(DOTA)-ZW-1 into the radioactive tracer to make the injected dose of 2 nmol/mouse [39]. It has been reported that the tumor uptake of 18F-Galacto-RGD was only partially blocked by 6 mg/kg of unlabeled RGD peptide, which was around 200 nmol/mouse [40]. Thus the influence of unlabeled c(RGDyK)-C(DOTA)-ZW-1 should be minimal in this study. The same amount of injected probe also facilitated direct comparison of optical imaging with PET results.
With a three compartment modeling, Gurfinkel et al. [24] successfully calculated pharmacokinetic parameters of Cy5.5-c(RGDfK) in a subcutaneous human Kaposi's sarcoma tumor (KS1767) model. They concluded that the value of α + β may correlate to the molecularly specific cellular uptake of the conjugate, in which α + β represents the sum of all the rate constants of the compartmental pharmacokinetic model. In our previous study, we analyzed and compared pharmacokinetic parameters derived from dynamic PET imaging with monomeric, dimeric RGD peptides and control RAD peptide [41]. We found that the binding potential (Bp=k3/k4) is more related to the specific binding within the tumor. Thus, in this study, we adopted Bp as the major parameter for the data modeling.
The optical images are 2-dimensional projection of signals from the whole body while PET images are tomographic sections. Besides, photon scattering and tissue attenuation also affect the accuracy of data quantification from optical imaging. It is thus of no surprise that the Bp value calculated from the original optical data set is significant lower than that from PET data (1.507 ± 0.113 vs. 1.752 ± 0.026, p < 0.05). To un-mix the specific signal component of tumor from the 2D optical projection data, we applied singular value decomposition (SVD) method before kinetic modeling [29]. The signal components from the noise components were distinguished by L-curve method [30, 31]. In fact, after SVD and “L” shape analysis, the TAC curve labeled as “tumor” is more related to the specific binding component from tumor region, while the curve labeled as “muscle” is more related to the non-specific perfusion component of the tracer (Figure 6). Consequently, the resulting TAC over tumor region on optical images showed similar pattern with that from PET images.
CONCLUSION
For the first time, dynamic optical imaging was quantitatively compared with dynamic PET imaging using a dual-labeled tracer. Dynamic optical imaging with SVD analysis could achieve comparable quantitative results as dynamic PET imaging in preclinical xenograft models.
SUPPLEMENTARY MATERIAL
Fig.S1-S4.
Acknowledgements
This work was supported by the Intramural Research Program of the National Institute of Biomedical Imaging and Bioengineering (NIBIB), National Institutes of Health (NIH). S.L. is partially supported by an NIH Pathway to Independence (K99/R00) Award.
COMPETING INTERESTS
The authors have declared that no competing interest exists.
References
1. Cai W, Rao J, Gambhir SS, Chen X. How molecular imaging is speeding up antiangiogenic drug development. Mol Cancer Ther. 2006;5:2624-33
2. Delbeke D. Oncological applications of FDG PET imaging: Brain tumors, colorectal cancer, lymphoma and melanoma. J Nucl Med. 1999;40:591-603
3. Bomanji JB, Costa DC, Ell PJ. Clinical role of positron emission tomography in oncology. Lancet Oncol. 2001;2:157-64
4. La Fougere C, Suchorska B, Bartenstein P, Kreth FW, Tonn JC. Molecular imaging of gliomas with PET: Opportunities and limitations. Neuro Oncol. 2011;13:806-19
5. Phelps ME. PET: The merging of biology and imaging into molecular imaging. J Nucl Med. 2000;41:661-81
6. Cai W, Chen X. Multimodality molecular imaging of tumor angiogenesis. J Nucl Med. 2008;49(Suppl 2):113S-28S
7. Ye Y, Chen X. Integrin targeting for tumor optical imaging. Theranostics. 2011;1:102-26
8. Hoshi Y. Functional near-infrared optical imaging: Utility and limitations in human brain mapping. Psychophysiology. 2003;40:511-20
9. Shah K, Weissleder R. Molecular optical imaging: Applications leading to the development of present day therapeutics. NeuroRx. 2005;2:215-25
10. Ntziachristos V, Bremer C, Weissleder R. Fluorescence imaging with near-infrared light: New technological advances that enable in vivo molecular imaging. Eur Radiol. 2003;13:195-208
11. Zhu L, Niu G, Fang X, Chen X. Preclinical molecular imaging of tumor angiogenesis. Q J Nucl Med Mol Imaging. 2010;54:291-308
12. Niu G, Chen X. Why integrin as a primary target for imaging and therapy. Theranostics. 2011;1:30-47
13. Carter A. Integrins as target: First phase III trial launches, but questions remain. J Natl Cancer Inst. 2010;102:675-7
14. Millard M, Odde S, Neamati N. Integrin Targeted Therapeutics. Theranostics. 2011;1:154-188
15. Schottelius M, Laufer B, Kessler H, Wester HJ. Ligands for mapping αvβ3-integrin expression in vivo. Acc Chem Res. 2009;42:969-80
16. Lee HY, Li Z, Chen K, Hsu AR, Xu C, Xie J. et al. PET/MRI dual-modality tumor imaging using arginine-glycine-aspartic (RGD)-conjugated radiolabeled iron oxide nanoparticles. J Nucl Med. 2008;49:1371-9
17. Cai W, Chen K, Li ZB, Gambhir SS, Chen X. Dual-function probe for PET and near-infrared fluorescence imaging of tumor vasculature. J Nucl Med. 2007;48:1862-70
18. Yang M, Gao H, Sun X, Yan Y, Quan Q, Zhang W. et al. Multiplexed PET probes for imaging breast cancer early response to VEGF/rGel treatment. Mol Pharm. 2011;8:621-8
19. Shoghi KI. Quantitative small animal PET. Q J Nucl Med Mol Imaging. 2009;53:365-73
20. Zhou H, Luby-Phelps K, Mickey BE, Habib AA, Mason RP, Zhao D. Dynamic near-infrared optical imaging of 2-deoxyglucose uptake by intracranial glioma of athymic mice. PLoS One. 2009;4:e8051
21. Keereweer S, Kerrebijn JD, Van Driel PB, Xie B, Kaijzel EL, Snoeks TJ. et al. Optical image-guided surgery--where do we stand? Mol Imaging Biol. 2011;13:199-207
22. Robinson MR, Hutchinson MD. Use of imaging techniques to guide catheter ablation procedures. Curr Cardiol Rep. 2010;12:374-81
23. Hong YT, Beech JS, Smith R, Baron JC, Fryer TD. Parametric mapping of [18F]fluoromisonidazole positron emission tomography using basis functions. J Cereb Blood Flow Metab. 2011;31:648-57
24. Gurfinkel M, Ke S, Wang W, Li C, Sevick-Muraca EM. Quantifying molecular specificity of αvβ3 integrin-targeted optical contrast agents with dynamic optical imaging. J Biomed Opt. 2005;10:034019
25. Ferl GZ, Dumont RA, Hildebrandt IJ, Armijo A, Haubner R, Reischl G. et al. Derivation of a compartmental model for quantifying 64Cu-DOTA-RGD kinetics in tumor-bearing mice. J Nucl Med. 2009;50:250-8
26. Logan J. A review of graphical methods for tracer studies and strategies to reduce bias. Nucl Med Biol. 2003;30:833-44
27. Logan J, Fowler JS, Volkow ND, Wang GJ, Ding YS, Alexoff DL. Distribution volume ratios without blood sampling from graphical analysis of PET data. J Cereb Blood Flow Metab. 1996;16:834-40
28. Logan J, Fowler JS, Volkow ND, Wolf AP, Dewey SL, Schlyer DJ. et al. Graphical analysis of reversible radioligand binding from time-activity measurements applied to [n-11c-methyl]-(-)-cocaine PET studies in human subjects. J Cereb Blood Flow Metab. 1990;10:740-7
29. Hillman EM, Moore A. All-optical anatomical co-registration for molecular imaging of small animals using dynamic contrast. Nat Photonics. 2007;1:526-30
30. Lawson CL, Hanson RJ. Solving least squares problems. Philadelphia: SIAM. 1995
31. Miller K. Least squares methods for ill-posed problems with a prescribed bound. SIAM J Math Anal. 1970;1:52-74
32. Li ZB, Cai W, Cao Q, Chen K, Wu Z, He L. et al. 64Cu-labeled tetrameric and octameric RGD peptides for small-animal PET of tumor αvβ3 integrin expression. J Nucl Med. 2007;48:1162-71
33. Sun X, Yan Y, Liu S, Cao Q, Yang M, Neamati N. et al. 18F-FPPRGD2 and 18F-FDG PET of response to abraxane therapy. J Nucl Med. 2011;52:140-6
34. Zhang X, Xiong Z, Wu Y, Cai W, Tseng JR, Gambhir SS. et al. Quantitative PET imaging of tumor integrin αvβ3 expression with 18F-FRGD2. J Nucl Med. 2006;47:113-21
35. Godavarty A, Thompson AB, Roy R, Gurfinkel M, Eppstein MJ, Zhang C. et al. Diagnostic imaging of breast cancer using fluorescence-enhanced optical tomography: Phantom studies. J Biomed Opt. 2004;9:488-96
36. Solomon M, White BR, Nothdruft RE, Akers W, Sudlow G, Eggebrecht AT. et al. Video-rate fluorescence diffuse optical tomography for in vivo sentinel lymph node imaging. Biomed Opt Express. 2012;2:3267-77
37. Beer AJ, Haubner R, Goebel M, Luderschmidt S, Spilker ME, Wester HJ. et al. Biodistribution and pharmacokinetics of the αvβ3-selective tracer 18F-galacto-RGD in cancer patients. J Nucl Med. 2005;46:1333-41
38. Choi HS, Nasr K, Alyabyev S, Feith D, Lee JH, Kim SH. et al. Synthesis and in vivo fate of zwitterionic near-infrared fluorophores. Angew Chem Int Ed Engl. 2011;50:6258-63
39. Chen X, Conti PS, Moats RA. In vivo near-infrared fluorescence imaging of integrin αvβ3 in brain tumor xenografts. Cancer Res. 2004;64:8009-14
40. Haubner R, Wester HJ, Weber WA, Mang C, Ziegler SI, Goodman SL. et al. Noninvasive imaging of αvβ3 integrin expression using 18F-labeled RGD-containing glycopeptide and positron emission tomography. Cancer Res. 2001;61:1781-5
41. Guo N, Lang L, Gao H, Niu G, Kieswetter D, Xie Q. et al. Quantitative analysis and parametric imaging of 18F-labeled monomeric and dimeric RGD peptides using a three-compartment model. Mol Imaging Biol. 2012 [Epub ahead of print]
Author contact
![]() Corresponding author: Xiaoyuan Chen, e-mail: shawn.chengov, or Gang Niu, e-mail: gang.niugov.
Corresponding author: Xiaoyuan Chen, e-mail: shawn.chengov, or Gang Niu, e-mail: gang.niugov.
Citation styles
APA
Zhu, L., Guo, N., Li, Q., Ma, Y., Jacboson, O., Lee, S., Choi, H.S., Mansfield, J.R., Niu, G., Chen, X. (2012). Dynamic PET and Optical Imaging and Compartment Modeling using a Dual-labeled Cyclic RGD Peptide Probe. Theranostics, 2(8), 746-756. https://doi.org/10.7150/thno.4762.
ACS
Zhu, L.; Guo, N.; Li, Q.; Ma, Y.; Jacboson, O.; Lee, S.; Choi, H.S.; Mansfield, J.R.; Niu, G.; Chen, X. Dynamic PET and Optical Imaging and Compartment Modeling using a Dual-labeled Cyclic RGD Peptide Probe. Theranostics 2012, 2 (8), 746-756. DOI: 10.7150/thno.4762.
NLM
Zhu L, Guo N, Li Q, Ma Y, Jacboson O, Lee S, Choi HS, Mansfield JR, Niu G, Chen X. Dynamic PET and Optical Imaging and Compartment Modeling using a Dual-labeled Cyclic RGD Peptide Probe. Theranostics 2012; 2(8):746-756. doi:10.7150/thno.4762. https://www.thno.org/v02p0746.htm
CSE
Zhu L, Guo N, Li Q, Ma Y, Jacboson O, Lee S, Choi HS, Mansfield JR, Niu G, Chen X. 2012. Dynamic PET and Optical Imaging and Compartment Modeling using a Dual-labeled Cyclic RGD Peptide Probe. Theranostics. 2(8):746-756.
This is an open access article distributed under the terms of the Creative Commons Attribution (CC BY-NC) License. See http://ivyspring.com/terms for full terms and conditions.