Impact Factor
- Issue 13; 2026
- Issue 12; 2026
- Issue 11; 2026
- Issue 10; 2026
- Issue 9; 2026
- Volume 16; 2026
- Advance Articles
- Past Issues
- Cover Images
- Cover Suggestion
- Index & Coverage
- Special Issues
Introduction
Materials and Methods
Results
Discussion and Conclusion
Abbreviations
Aknowledgement
References
International Journal of Biological Sciences
International Journal of Medical Sciences
 Global reach, higher impact

Theranostics 2012; 2(9):817-826. doi:10.7150/thno.4479 This issue Cite
Research Paper
Monitoring Photosensitizer Uptake Using Two Photon Fluorescence Lifetime Imaging Microscopy
Shu-Chi Allison Yeh1, Kevin R. Diamond3, Michael S. Patterson1,3, Zhaojun Nie1, Joseph E. Hayward2,3, Qiyin Fang1,2, ![]()
1. School of Biomedical Engineering, McMaster University, 1280 Main Street West, Hamilton, Ontario, L8S 4K1, Canada;
2. Department of Engineering Physics, McMaster University, 1280 Main Street West, Hamilton, Ontario, L8S 4K1, Canada;
3. Department of Medical Physics and Applied Radiation Sciences, McMaster University, 1280 Main Street West, Hamilton, Ontario, L8S 4K1, Canada.
Received 2012-4-16; Accepted 2012-8-18; Published 2012-9-5
Abstract
Photodynamic Therapy (PDT) provides an opportunity for treatment of various invasive tumors by the use of a cancer targeting photosensitizing agent and light of specific wavelengths. However, real-time monitoring of drug localization is desirable because the induction of the phototoxic effect relies on interplay between the dosage of localized drug and light. Fluorescence emission in PDT may be used to monitor the uptake process but fluorescence intensity is subject to variability due to scattering and absorption; the addition of fluorescence lifetime may be beneficial to probe site-specific drug-molecular interactions and cell damage. We investigated the fluorescence lifetime changes of Photofrin® at various intracellular components in the Mat-LyLu (MLL) cell line. The fluorescence decays were analyzed using a bi-exponential model, followed by segmentation analysis of lifetime parameters. When Photofrin® was localized at the cell membrane, the slow lifetime component was found to be significantly shorter (4.3 ± 0.5 ns) compared to those at other locations (cytoplasm: 7.3 ± 0.3 ns; mitochondria: 7.0 ± 0.2 ns, p < 0.05).
Keywords: Fluorescence lifetime imaging microscopy (FLIM), Photodynamic Therapy (PDT), Photofrin, Segmentation.
Introduction
Photodynamic therapy (PDT) is a cancer treatment for various types of invasive tumors. The main advantages of PDT over traditional cancer treatments are attributed to the localized effects of the photochemical reactions. It involves the administration of a photosensitizer, followed by the activation of the drug by light that initiates the “phototoxic effect” - the coupling of drugs in the triplet excited state with ground state oxygen molecules. This reaction leads to the generation of the highly cytotoxic singlet oxygen (1O2) species, which has an extremely short lifetime and distribution radius, enabling localized therapeutic effects [1]. However, the therapeutic efficacy of PDT depends strongly on the local concentration of the photosensitizer and amount of light it absorbs, thus the current clinical standard of using prescribed drug and light dosages is insufficient. PDT dose is influenced by factors such as different drug uptake rates, tissue optical properties, variable tissue oxygenation, as well as unexpected photophysical and photochemical changes of the photosensitizing agents [2]. As a result, real-time monitoring of the drug distribution and its interactions with surrounding tissue has become a valuable approach in order to determine the dosage more accurately. Some potential dosimetric approaches using the steady-state fluorescence spectra of photosensitizers have been studied to determine the effective PDT dosage. Explicit dosimetry measures each dose factor independently by modeling input parameters (e.g. the photosensitizer concentration, light fluence, and oxygenation within the targets) to retrieve the proper PDT dose. In order to incorporate all of the dose determining factors into a single metric, including PDT pathways that may affect the individual treatment outcome, implicit dosimetry correlating photobleaching and cell viability has also been investigated [2-7]. Although these techniques tackled the underlying photochemistry and photobiology of the excited photosensitizers in the tumor site, the measured steady-state fluorescence intensity still suffered from artifacts arising from the heterogeneity of tissue optical properties [8], local environment, unknown chromophores with overlapped spectra, and the geometry of excitation and detection [9]. That is, the measured intensity does not truly represent what happens inside the tumor and direct measurements of tissue optics are still required. Therefore, under- or over-estimation of the drug concentration may happen due to individual variability if it is estimated by the amplitude of fluorescence signal alone. These problems may be overcome by the addition of time-resolved features (lifetime, fitting coefficients, etc.), which are independent of signal intensity [10]. Fluorescence lifetime, defined as how long a fluorophore remains in its excited state, is sensitive to intermolecular interactions and changes of microenvironment while it is independent of intensity variations and the problems suffered by steady-state fluorescence techniques. Fluorescence lifetime imaging microscopy (FLIM) makes it possible to distinguish these factors and reveal the drug interactions with the cellular environment [11]. Previous studies have shown that photosensitizers' fluorescence lifetimes go through significant changes when bound to intracellular components. For example, the fluorescence lifetimes of photosensitizers such as Photofrin®, 5-ALA, and mTHPC were all shortened in vitro compared to those in solution [12-17]. These changes in lifetime provide opportunities to monitor the binding states of photosensitizers, and the microenvironment. In particular, it is known that drug distribution and its cytotoxicity have a strong correlation [18-21] . Despite this correlation, the relationship between lifetime changes and drug localization has not been well studied. Thus, characterizing the fluorescence decay time of the photosensitizer localized at a specific intracellular component may not only differentiate between different species of photosensitizers (e.g. monomeric or aggregated forms) located in a particular intracellular microenvironment [13], but also reveal the drug-molecular interacting process of PDT drug inside cells. In addition, as the conventional one-photon technique is subject to scattering and out of focus signals that confound fluorescence emission from various intracellular sources, two-photon laser excitation takes advantage of nonlinear optical effects from near-IR ultrafast lasers to confine the imaging spot size to femto-liter volumes with less scattering effect at this spectral window [22,23]. These small volumes enable more accurate data interpretation and analysis. Eventually, it is possible that the combination of steady-state and time-resolved fluorescence could be correlated to cell viability, which may be a valuable tool for real-time PDT dosimetry.
The purpose of this study is to investigate how fluorescence lifetime changes when a photosensitizer is bound to specific intracellular components at specific stages of cellular uptake. Photofrin® (porfimer sodium) was used in this study as it is a photosensitizing agent used widely in PDT to treat solid tumors [1].
Materials and Methods
We characterized the time-lapse fluorescence intensity and lifetime distribution of Photofrin® (Axcan Pharma Inc., Mont-Saint-Hilaire, QC, Canada) in Mat-LyLu (MLL) rat prostate adenocarcinoma cell line. Cells were incubated with Photofrin® at 5 μg/mL for times ranging from 0.5 hour to 18 hours. The confocal microscope was used for visualizing the intracellular drug location and two-photon fluorescence lifetime imaging was performed for tracking fluorescence lifetime changes in vitro. The fluorescence lifetime information was correlated with the subcellular locations of the photosensitizer.
Cell culture
Mat-LyLu is a rat prostate adenocarcinoma cell line used in previous studies [5,14]. The cells were incubated in 25 cm2 sealed vials [35-3108, Becton Dickinson FalconTM, NJ, USA] with 3.5 mL of medium that contains RPMI medium 1640 (11875-093, Gibco-BRL, Gaithersburg, MD, USA) with 2% antibiotic/antimycotic (15240-095, Gibco-BRL), 1% hepes buffer (15630-105, Gibco-BRL), and also supplemented with 10% Fetal Bovine Serum (FBS) (10437-010, Gibco-BRL) at 37 ºC in a water jacketed CO2 incubator (Forma Series II, Thermo Fisher Scientific Inc, Waltham, MA, USA). Cells were passaged every 2 to 3 days until they reached about 60% of confluence.
Experimental preparation
Cells were removed from the original culture vials using 0.5% of 10X Trypsin-EDTA (15400-054, Gibco-BRL), and then seeded on a 25 mm glass coverslip (pre-washed with 99.9% ethanol (34964, Sigma Aldrich) to remove any possible coatings that may affect cell attachment and growth) in culture medium in a 35 × 10 mm dish. After 6 hours of incubation, the medium was replaced by one containing Photofrin® solution. To dilute Photofrin® properly, a stock solution of 2.5 mg/mL of the photosensitizer dissolved in PBS (14200-075, Dulbecco's Phosphate Buffered Saline 10X Gibco-BRL) was diluted in the culture medium to a final concentration of 5 μg/mL. Cells were incubated in the Photofrin® containing medium for the specified periods and then the coverslip was rinsed with PBS twice and placed in a metal chamber for imaging. 1 mL of Hanks buffer solution with Ca2+ was added into the chamber to prevent cells from drying and undergoing apoptosis during imaging.
Confocal imaging and two-photon fluorescence lifetime imaging
The time-dependent Photofrin® fluorescence emission was collected by a laser scanning confocal microscope (TSC SP5 & DMI 6000 B, Leica, Wetzlar, Germany) with a 63X oil-immersed objective lens. A built-in Argon-ion laser operating at 514 nm was used in combination with the emission range from 600 - 750 nm. The FLIM microscope was coupled to a Ti:Sapphire laser (Chameleon-Ultra, Coherent, Santa Clara, CA, USA) emitting at 810 nm with 80 MHz repetition rate. An integrated TCSPC module (SPC-830, Becker & Hickl GmbH, Berlin, Germany) was used to record fluorescence decay kinetics throughout 64 time channels. The fluorescence lifetime system has been described in a previous publication [14]. The average power used for fluorescence lifetime acquisition was around 45 mW with 1.5 ps pulse duration at the objective plane, which yields a peak power density of approximately 1.5 × 10¹¹ W cm-2. The total pixel dwell time for 60 seconds of acquisition was approximately 915 µs, which renders the total fluence of 4350 J/cm2 with the pixel size of 0.96 x 0.96 µm2.
The images were acquired after 1 hour and 18 hours of incubation to characterize initial uptake of Photofrin® and prolonged incubation, respectively. In addition, data were acquired every 30 minutes from 2 hours to 6 hours of incubation to examine the uptake process in vitro in more detail.
Data analysis
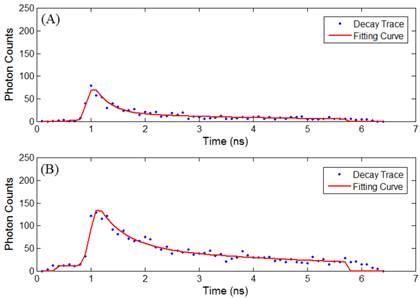
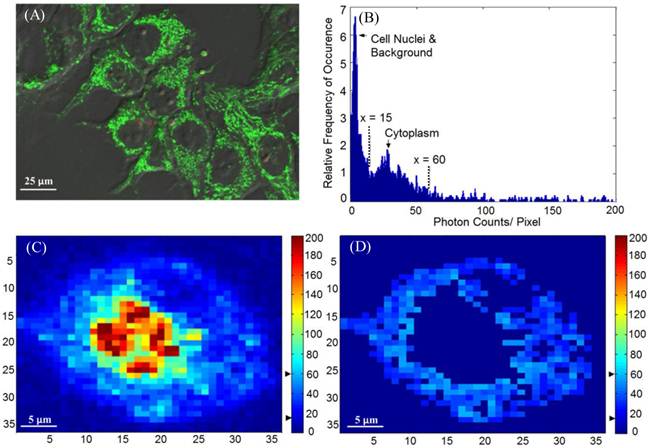
Time-lapse FLIM data were fitted with a bi-exponential model using the vendor supplied software (SPCImage, v3.0.8.0, Becker and Hickl). The sample measured decay trace and its fitting curve from a single pixel were demonstrated in Figure 1. The retrieved individual lifetime and amplitude parameters of every pixel were then imported to Matlab® (Mathworks, Natick, MA) for futher analysis using a program developed in-house. Three repeated trials for each incubation period were acquired, with each trial containing multiple regions of interest. From each lifetime image, the mean value and standard deviation of individual parameters such as the bi-exponential lifetime components (τ2, τ1), and corresponding coefficients (A2, A1) of every pixel in the image were plotted. Using these values, the weighted mean and standard deviation of three repetitive measurements were calculated. The regions of interest, for example, mitochondria or cytoplasm, were segmented based on intensity. The segmentation was only performed on images collected at 4 hours and 4.5 hours of incubation, where the Photofrin® localization was undergoing a “transition” stage, thus the FLIM images showed lifetime values from different locations. The classification of the intracellular components was first visually verified based on preliminary confocal images as shown in Figure 2A, where the cells were stained with MitoTracker® Green (FM 7514, Invitrogen) to reveal the mitochondrial distribution. The segmentation was then done based on thresholding the histogram of pixel intensity (photon counts/ pixel) in the intensity images. Intensity values ranging from 15 - 60 counts per pixel were classified as “cytoplasm”, and greater than 60 counts per pixel were classified as mitochondria. Sample confocal and segmentation images are shown in Figure 2C and 2D. As the signal of Photofrin® is extremely low and comparable with the autofluorescence at the beginning of incubation (less than 1 hour), the cell membrane was selected using the Matlab® built-in periphery detection function (bwperim) instead of segmentation.
(A) Sample measured decay trace (blue dotted line) and the fitting curve (red line) from a pixel in data at 2.5 hours of incubaton. Data were exported from the SPCImage software and plotted in Matlab. Each data point represents the total photon counts collected in that time channel. (B) Sample measured data and fitting curve from a pixel in data at 4.5 hours of incubaton. It is noted that the peak intensity increases with the cellular uptake.
(A) A sample confocal image showing the distribution of mitochondria. MLL cells were stained with 100 nM of MitoTracker® Green, as indicated by the green color. (B) Histogram (photon count per pixel) used for segmentation of FLIM images. Based on the morphological features shown in confocal images, the main peak corresponds to the lower pixel intensities from the cell nuclei, and the minor peak corresponds to the intensities from the cytoplasmic region, as indicated by the arrows and the range covered by the dashed lines. (C) Original intensity image of a single cell. The cell was stained with Photofrin® for 4.5 hours, when Photofrin® presented at both mitochondrial and cytoplasm regions. Note the image was from a small area of a field of view, therefore the image seems pixelated. The thresholds used to segment the cytoplasmic region were marked by the black arrows on the color bar (D) The segmentation was performed based on the morphological features and histogram, where signals with intensity > 60 counts/pixel (mitochondria) and < 15 counts/ pixel (cell nucleus and background) were eliminated.
Results
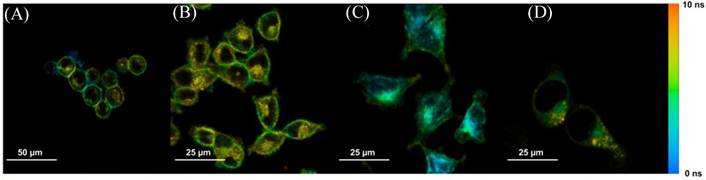
Steady-state confocal images showed the location and cellular uptake rate of Photofrin® matched the literature, where Photofrin® first binds to the plasma membrane, then moves towards cytoplasm, and finally targets the inner membrane of the mitochondria [20,24,25]. These confocal results were also consistent with the FLIM images when cells were stained with 20 µg/mL of Photofrin® as shown in Figure 3.
Sample time-lapse average lifetime images of Photofrin® (20 µg/mL) uptake by MLL cells between 1-18 hours. The color legend illustrates the corresponding lifetime values ranging from 1 ns (red) to 10 ns (blue). The pixels corresponding to the photosensitizer in the lifetime images are co-localized with the signal of the steady-state fluorescence images (data not shown). (A) The image shows Photofrin® uptake by the cell membrane at 1 hour of incubation; (B) 2 to 4 hours of incubation. This image was acquired at 2.5 hours of incubation when Photofrin® started to migrate into the cytoplasm; (C) Photofrin® has localized at the peri-nuclear region after 6 hours of incubation; and (D) After 18 hours of incubation, granular spots have appeared in the cells and the redistribution of the drug after prolonged incubation was observed.
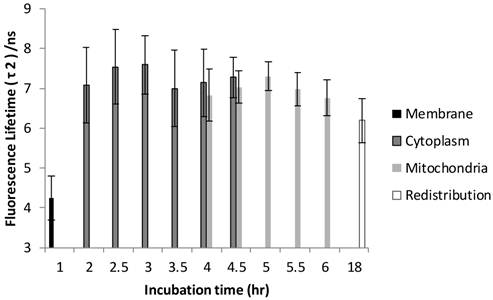
The FLIM datasets acquired at different incubation times were then classified into four categories based on the intracellular distribution: namely membrane, cytoplasm, mitochondria, and redistribution groups. Various sources of fluorescence may contribute to the total exponential decay signal, such as photoproducts, different molecular constituents of Photofrin®, and autofluorescence. Rather than use the average fluorescence lifetime to monitor the Photofrin® uptake process, the fluorescence lifetimes and amplitudes were plotted separately. Figure 4 shows the slow lifetime component of Photofrin® when it is localized at different intracellular components over various incubation periods. The values of the longer lifetime component (τ2) are consistent with previous spectral-resolved FLIM studies, where the fluorescence signals of photoproducts and aggregated Photofrin® (emission range at 651 nm - 687 nm) increased after irradiation and exhibited long lifetime components of approximately 8 ns [13,16]. In Figure 4, τ2 did not change significantly from 2 hours to 18 hours of incubation. The individual standard deviation of τ2 , however, was reduced from around 1 ns to 0.4 ns after 4.5 hours of incubation, when Photofrin® was localized in the mitochondrial regions. The overlap of cytoplasmic and mitochondria groups at 4 hours and 4.5 hours of incubation was analyzed based on the segmentation technique. At the transition stage, the values of fluorescence lifetime and standard deviation between two groups were similar. It should be noted that Photofrin® exhibited the slow decay time (τ2) of 4.3 ± 0.5 ns when it was bound to the cell membrane. The significant lifetime change compared to all other incubation periods (p < 0.01 except for redistribution group where p < 0.05) suggested that the differences between the cell membrane microenvironment and other regions may result in more quenching of the fluorescence.
Distribution of τ2 (slow component) as a function of different incubation times. The four different locations (cell membrane, cytoplasm, mitochondria, and redistribution) were determined based on the preliminary results from confocal images. Image segmentation was performed at 4 hours and 4.5 hours of incubation when Photofrin® localized at the mitochondria and cytoplasm. Significant short τ2 was observed (4.3 ± 0.5 ns) in the cell membrane group (p < 0.05), while Photofrin® exhibited the mean lifetime of 7.1 ± 0.3 ns for the remaining intracellular locations. It was observed that the standard deviation was reduced when Photofrin® localized at the mitochondria.
The time-lapse τ1 (short lifetime component) of Photofrin® was plotted in Figure 5. It should be noted that all values of τ1 are less than 1.0 ns and mostly at 0.5 ± 0.1 ns when Photofrin® localized at the mitochondrial region. Although τ1 was found to be significantly shorter when comparing data at 1 hour and 3 hours of incubation (p < 0.01), it was also observed that the lifetime values in the cytoplasm group fluctuated more than other groups. The relatively small variations of short lifetime components over incubation time suggested that τ1 may not be a good option for monitoring cellular uptake of Photofrin®.
Distribution of τ1 as a function of different incubation times. All values of τ1 are less than 1.0 ns and at 0.5 ± 0.1 ns when Photofrin® localized at the mitochondrial region.
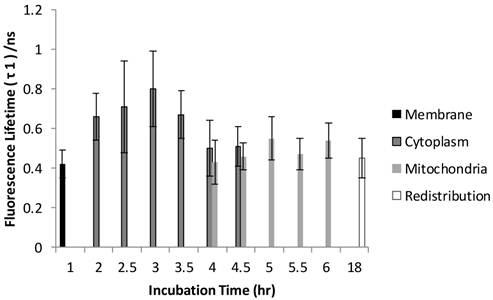
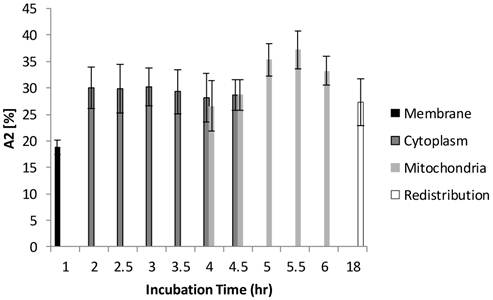
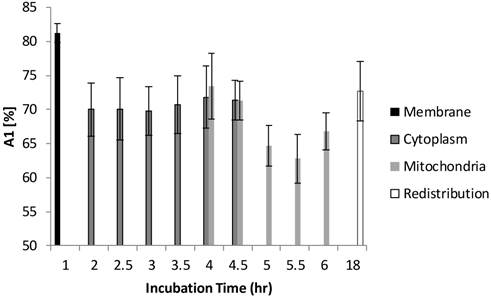
Figure 6 and Figure 7 show the normalized coefficients, A1 and A2, of the short and long lifetime components. As seen in Figure 6, the significant increase of A2 from 19% to 35% (p < 0.01) was observed when cells are taking up more Photofrin® over time, supporting the assertion that more aggregates and photoproducts of Photofrin® are formed after irradiation. At 18 hours, however, the images showed depolarization and swelling of mitochondria, therefore the Photofrin® might be released and redistributed throughout the cells again. At early incubation times when intracellular concentrations of Photofrin® were low, the autofluorescence, mainly short component of porphyrin species that exhibit 1.7 ns of average fluorescence lifetime in the non-stained control group (with 70 % of τ1 centered at 0.8 ns, and 30 % of τ2 centered at 3.5 ns, data not shown), contributed more to the short lifetime component than Photofrin® itself. Therefore, as the τ1 is very close to the system response (0.2 ns), it may contain contributions from short autofluorescence signals and estimation uncertainties, especially in the case of low signal from Photofrin®. This can be seen in Figure 7, where the short lifetime component contributed the most at the beginning of the incubation, and as the intracellular Photofrin® concentration increased, the relative amplitude A1 decreased from 81% to 65%.
Distribution of A2 as a function of different incubation time. A2 was increased from 19% to 35% as cells took up more Photofrin® as the incubation time increased, suggesting contribution of τ2 (mostly from photoproducts of Photofrin® under strong irradiation) increased. However, at the time of 18 hours, the images showed depolarization and swelling of mitochondria, therefore the Photofrin® may have been released and redistributed throughout the cells.
Distribution of A1 as a function of different incubation time. At 1 hour of incubation, because only trace of Photofrin® was taken up by the cells, short lifetime components such as autofluorescence and system response may contribute more signal than Photofrin® itself. As the intracellular Photofrin® concentration increased, the short component decreased from 81% to 65%. It should be noted that the A1 increased after prolonged incubation.
Discussion and Conclusion
The hypothesis of this study is that FLIM is a potential complementary tool for dosimetry, that not only demonstrates the location and intensity of the drug, but also reveals the drug-cell interaction status. The changes in lifetime at different intracellular locations may then be correlated with cell viability in the future PDT studies. Using a two-photon FLIM system, fluorescence lifetimes of Photofrin® in MLL cells decay bi-exponentially, with a slow component (τ2) that was found to be significantly shorter when localized at the cell membrane, and then increase when reaching their intracellular targets, all with a large amount (70%) of fast component (τ1) ranging from 0.3 - 1.0 ns.
The measured τ2 of Photofrin® agrees well with the reported values (8.0 ± 0.6 ns) of its photoproduct and aggregates at various subcellular locations [13]. Based on the spectrally-resolved studies done by Rueck et al., Photofrin® monomer in human HepG2 cells exhibited a slow decay time of 13.3 ± 0.3 ns; however, this was not observed in the present study. The measured values of τ1 are also consistent with previous studies, which correspond to extremely short-lived components of Photofrin® aggregates that exhibited 0.1 to 1.2 ns fluorescence lifetimes under strong irradiation [16,26], and autofluroescence of porphyrins [14,27].
In general, there are some factors that have an impact on the measured τ2 and τ1. For example, the drug concentration could yield different dark toxicity and phototoxicity. It has been reported that dark toxicity would exist when the Photofrin® concentration was more than 2µg/mL [28]. Moreover, the relatively high laser fluence (6500 J/cm2 and 4350 J/cm2 for membrane and other groups, respectively) used to increase acquired photon counts may increase photodestruction of the monomers and photoproduct formation, which explains why monomer fluorescence lifetime was not observed in this study. The influence of phototoxicity was also discussed in another in vitro study of localized Photofrin®, where reduced cell viability was demonstrated using the two-photon fluence from 1600 J/cm2 to 6300 J/cm2 [29]. Therefore, in the present study, potential dark toxicity and the phototoxicity could lead to earlier onset of apoptosis, which was reported to be correlated with higher amounts of autofluorescence signal at the peri-nuclear regions [30,31]. As a result, the increased autofluorescence (the short lived porphyrin species [27]), and the photoproducts all potentially result in shortened lifetimes and large A1 values [16] compared to the previous report [13]. In addition, due to the limitation of photon counts, only bi-exponential analysis was performed; therefore, the measured individual parameters are the average of a range of lifetimes distributed in the cell [13,14,16,26]. The localized lifetime values are discussed in the following sections.
When Photofrin® was bound to the plasma membrane, the increase of the short lifetime component (which can also be seen in Figure 7) might be due to: (i) the binding of Photofrin® to specific receptors on the cell membrane, and more likely, (ii) photobleaching of the monomers, formation of photoproduct, and consequently the increase of the short components due to increased light exposure (over 90 s imaging, which correspond to 6500 J/cm2). The shortening of the fluorescence lifetimes at this stage of uptake could be particularly interesting because the plasma membrane-based regime might also play an important role in cell killing during PDT. This was also revealed in a previous study, where immediate ROS generation and fast activation of cascade apoptosis signalling were observed when Photofrin® targeted the cell membrane of the A431 cell line. However, the cell morphology seemed to be more necrotic than apoptotic [21,32]. The effect on cell viability of membrane-localized Photofrin® should be investigated further in future studies.
The individual standard deviation of the fluorescence lifetime measured in the cytoplasmic group was large compared to other groups. The variability exists for a variety of reasons. First, Photofrin® was still under the uptake process so the distribution and concentration of drug would be variable and low. In other words, the measured lifetimes of Photofrin® will be more affected by other contributions such as autofluorescence, which may lead to large variations of τ2 and τ1. The contribution of Photofrin® was also reflected in the A1 and A2 plots, where A1 decreased over time whereas A2 increased as more Photofrin® was taken by the cells. Second, cytoplasm is a relatively more hydrophilic environment than the cell membrane and mitochondria. Photofrin® in this environment tends to form various kinds of aggregates, which is reflected by the large standard deviation observed in the cytoplasm group in both Figure 4 and Figure 5. When looking at the lifetime values after segmentation, as observed from the datasets at 4 and 4.5 hours of incubation, there was not much difference between cytoplasmic and mitochondrial groups. This may have been a result of Photofrin® not being bound stably to mitochondrial inner membrane at 4 hours of incubation, which increased the standard deviation of the fluorescence lifetime of the mitochondrial group. In contrast, there was very little Photofrin® in the cytoplasm at 4.5 hours of incubation, which reduced the variations of the cytoplasm group. Although mitochondria location was confirmed by the MitoTracker Green, visual determination may also pose a source of error. In addition, the non-linear curve fitting process with lower signal-to-noise ratio (SNR) could also pose intrinsic inaccuracy in lifetime estimation. To tackle this issue, the SNR values were calculated by taking the ratio of the peak intensity of the decay curve to the root mean square of the noise before the rising edge of the decay curve. Average values from multiple cells of the four groups were compared in Table 1. It is noted that the values increase with the cellular uptake process when Photofrin® moved towards mitochondria (from 24.5 to 32.2), then drop back to 24.9 after prolonged incubation and redistribution of the drug. Therefore, in terms of the possible contributions to differences of standard deviation between cytoplasmic and other groups, we would still consider the variability of microenvironment more than the discrepancy in SNR.
The SNR values from different intracellular groups.
| Intracellular Groups | SNR |
|---|---|
| Cell Membrane | 24.5 |
| Cytoplasm | 26.9 |
| Mitochondria | 32.2 |
| Redistribution | 24.9 |
Measurements taken at the redistribution time point (18 hours of incubation) were inconclusive due to effects of Photofrin® dark toxicity. Photofrin® was redistributed throughout the cells at this stage, as seen in the confocal and lifetime images, where the cytoplasmic granularity suggests that cell damage had also occurred [33]. Therefore, as observed in all figures, the standard deviation of individual lifetimes increased slightly. Although the dying cells may have exhibited higher autofluorescence signal, the individual lifetimes were not shortened significantly, likely due to an elevated intracellular Photofrin® concentration after prolonged incubation [29,34]. However, the reciprocal changes of A1 (autofluorescence) and A2 (Photofrin) after the drug arrived its intracellular target (mitochondria) can still be seen in Figure 6 and Figure 7, where the increased contribution of A2 and decrease of A1 were observed after 5 hours of incubation.
In conclusion, we investigated the time-lapse fluorescence lifetime changes of Photofrin® and studied the location-wise differences based on segmentation of the regions of interest. This study provided a different approach of assessing photobiology and photochemistry of the photosensitizer in vitro, and also rendered a potential application of using the plasma membrane-based FLIM as an indicator of cell apoptotic or necrotic responses. Current results showed the measured fluorescence lifetimes were significantly shorter when Photofrin® localized to the plasma membrane, while no significant difference was observed between the cytoplasm and mitochondria. Other photosensitizers may exhibit similar fluorescence lifetime characteristics in vitro, but it is necessary to be further verified. Future work may include: verifying the current study using Photofrin® in highly controlled, simulated plasma membrane environment; studying the effects of plasma membrane-mediated PDT in three dimensional cell cultures; investigation of cell line and photosensitizer variability; and combining the current work with an endomicroscopy technique, bringing FLIM-based PDT dosimetry towards tissue level.
Abbreviations
PDT: photodynamic therapy; FLIM: fluorescence lifetime imaging microscopy; TCSPC: time correlated single photon counting; MLL: Mat-LyLu; ROS: reactive oxygen species; SNR: signal-to-noise ratio.
Aknowledgement
The authors would like to thank Dr. Tony Collins for his assistance in the two-photon microscopy experiment. This project is supported by funding from the Natural Sciences & Engineering Research Council, the Canadian Institutes of Health Research, and the Canadian Foundation of Innovation/Ontario Research Fund. QF holds the Canada Research Chair in Biophotonics.
Competing Interests
The authors have declared that no competing interest exists.
References
1. Wilson BC, Patterson MS. The physics, biophysics and technology of photodynamic therapy. Phys Med Biol. 2008;53:R61-109
2. Wilson BC, Patterson MS, Lilge L. Implicit and Explicit Dosimetry in Photodynamic Therapy : a New Paradigm. Laser Med Sci. 1997;3:182-99
3. Wilson BC, Patterson MS. The physics of photodynamic therapy. Phys Med Biol. 1986;31:327-60
4. Dysart JS, Patterson MS, Farrell TJ. et al. Relationship between mTHPC fluorescence photobleaching and cell viability during in vitro photodynamic treatment of DP16 cells. Photochem Photobiol. 2002;75:289-95
5. Dysart JS, Patterson MS. Characterization of Photofrin photobleaching for singlet oxygen dose estimation during photodynamic therapy of MLL cells in vitro. Phys Med Biol. 2005;50:2597-616
6. Sheng C, Hoopes PJ, Hasan T. et al. Photobleaching-based dosimetry predicts deposited dose in ALA-PpIX PDT of rodent esophagus. Photochem Photobiol. 2007;83:738-48
7. Georgakoudi I, Foster TH. Singlet oxygen- versus nonsinglet oxygen-mediated mechanisms of sensitizer photobleaching and their effects on photodynamic dosimetry. Photochem Photobiol. 1998;67:612-25
8. Diamond KR, Patterson MS, Farrell TJ. Quantification of fluorophore concentration in tissue-simulating media by fluorescence measurements with a single optical fiber. App Opt. 2003;42:2436-42
9. Cormier JF, Fortin M, Fréchette J. et al. The effects of self-absorption and detection geometry on fluorescence intensity and decay lifetime. Proc SPIE. 2005;5702:123
10. Diamond KR, Pawel PM, Hayward JE. et al. Quantification of fluorophore concentration in vivo using two simple fluorescence-based measurement techniques. J Biomed Opt. 2005;10:024007-1 -10
11. Suhling K, French PMW, Phillips D. Time-resolved fluorescence microscopy. Photochem Photobiol Sci. 2005;4:13-22
12. Rueck A. FLIM and SLIM for molecular imaging in PDT. Proc SPIE. 2005;5700:182-7
13. Rueck A, Huelshoff CH, Kinzler I. et al. SLIM : A New Method for Molecular Imaging. Microsc Res Techniq. 2007;492:485-92
14. Russell JA, Diamond KR, Collins TJ. et al. Characterization of Fluorescence Lifetime of Photofrin and Delta-Aminolevulinic Acid Induced Protoporphyrin IX in Living Cells Using Two-Photon Excitation. IEEE J Quantum Elect. 2008;14:158-66
15. Connelly JP, Botchway SW, Kunz L. et al. Time-resolved fluorescence imaging of photosensitiser distributions in mammalian cells using a picosecond laser line-scanning microscope. J Photochem Photobiol A Chem. 2001;142:169-75
16. Koenig K, Wabnitz H, Dietel W. Variation in the fluorescence decay properties of haematoporphyrin derivative during its conversion to photoproducts. J Photochem Photobiol B Biol. 1990;8:103-11
17. Lassalle H-P, Wagner M, Bezdetnaya L. et al. Fluorescence imaging of Foscan and Foslip in the plasma membrane and in whole cells. J Photochem Photobiol B Biol. 2008;92:47-53
18. Saczko J, Mazurkiewicz M, Chwiłkowska A. et al. Intracellular distribution of Photofrin in malignant and normal endothelial cell lines. Folia Biol. 2007;53:7-12
19. Morgan J, Oseroff AR. Mitochondria-based photodynamic anti-cancer therapy. Adv Drug Delv Rev. 2001;49:71-86
20. Hilf R. Mitochondria are targets of photodynamic therapy. J Bioenerg Biomembr. 2007;39:85-9
21. Hsieh Y-J, Wu C-C, Chang C-J. et al. Subcellular localization of Photofrin determines the death phenotype of human epidermoid carcinoma A431 cells triggered by photodynamic therapy: when plasma membranes are the main targets. J Cell Physiol. 2003;194:363-75
22. Karotki A, Khurana M, Lepock JR. et al. Simultaneous two-photon excitation of photofrin in relation to photodynamic therapy. Photochem Photobiol. 2006;82:443-52
23. Zipfel WR, Williams RM, Webb WW. Nonlinear magic: multiphoton microscopy in the biosciences. Nat Biotechnol. 2003;21:1369-77
24. Oleinick NL, Morris RL, Belichenko I. The role of apoptosis in response to photodynamic therapy: what, where, why, and how. Photochem Photobiol Sci. 2002;1:1-21
25. Morgan J, Potter WR, Oseroff a R. Comparison of photodynamic targets in a carcinoma cell line and its mitochondrial DNA-deficient derivative. Photochem Photobiol. 2000;71:747-57
26. Schneckenburger H, Steiner R, Rueck A. In vivo photoproduct formation during PDT with ALA-induced endogenous porphyrins. J Photochem Photobiol B: Biol. 1993;18:287-90
27. Koenig K, Schneckenburger H. Laser-induced autofluorescence for medical diagnosis. J Fluoresc. 1994;4:17-40
28. Singh G, Jeeves WP, Wilson BC. et al. Mitochondrial photosensitization by Photofrin II. Photochem Photobiol. 1987;46:645-9
29. Khurana M, Collins HA, Karotki A. et al. Quantitative in vitro demonstration of two-photon photodynamic therapy using photofrin and visudyne. Photochem Photobiol. 2007;83:1441-8
30. Levitt JM, Baldwin A, Papadakis A. et al. Intrinsic fluorescence and redox changes associated with apoptosis of primary human epithelial cells. J Biomed Opt. 2006;11:064012-1 -10
31. Dittmar R, Petier E, Zandvoort M. et al. Assessment of cell viability in three-dimensional scaffolds using cellular auto-fluorescence. Tissue Eng Pt C-Meth. 2012;18:198-204
32. Kessel D, Luo Y, Deng Y. et al. The role of subcellular localization in initiation of apoptosis by photodynamic therapy. Photochem Photobiol. 1997;65:422-426
33. Biesele JJ, Goldhaber P. A study of cytoplasmic lipid granularity in tissue culture cells. Cancer Res. 1955;15:767-73
34. Kabe Y, Ohmori M, Shinouchi K. et al. Porphyrin accumulation in mitochondria is mediated by 2-oxoglutarate carrier. J Biol Chem. 2006;281:31729-35
Author contact
![]() Corresponding author: qiyin.fangca.
Corresponding author: qiyin.fangca.