Theranostics
13.3
Impact Factor
- Current Issue
- Advance Articles
- Volume 16; 2026
- Volume 15; 2025
- Volume 14; 2024
- Volume 13; 2023
- Volume 12; 2022
- Archive
- Cover Images
- Cover Suggestion
- Special Issues
Top
Introduction
Materials and methods
Results
Discussion
Conclusion
Supplementary Material
Acknowledgements
References
Introduction
Materials and methods
Results
Discussion
Conclusion
Supplementary Material
Acknowledgements
References
International Journal of Biological Sciences
International Journal of Medical Sciences
 Global reach, higher impact

Theranostics 2013; 3(8):532-543. doi:10.7150/thno.5369 This issue Cite
Research Paper
Labeling Human Mesenchymal Stem Cells with Gold Nanocages for in vitro and in vivo Tracking by Two-Photon Microscopy and Photoacoustic Microscopy
Yu Shrike Zhang1, Yu Wang2, Lidai Wang2, Yucai Wang1, Xin Cai2, Chi Zhang2, Lihong V. Wang2 ![]() , Younan Xia1
, Younan Xia1 ![]()
1. The Wallace H. Coulter Department of Biomedical Engineering, Georgia Institute of Technology and Emory University, Atlanta, GA 30332, USA;
2. Department of Biomedical Engineering, Washington University in St. Louis, One Brookings Drive, St. Louis, MO 63130, USA.
Received 2012-10-11; Accepted 2012-11-13; Published 2013-7-19
Citation:
Zhang YS, Wang Y, Wang L, Wang Y, Cai X, Zhang C, Wang LV, Xia Y. Labeling Human Mesenchymal Stem Cells with Gold Nanocages for in vitro and in vivo Tracking by Two-Photon Microscopy and Photoacoustic Microscopy. Theranostics 2013; 3(8):532-543. doi:10.7150/thno.5369. https://www.thno.org/v03p0532.htm
Other stylesAbstract

Stem cell tracking is a highly important subject. Current techniques based on nanoparticle-labeling, such as magnetic resonance imaging, fluorescence microscopy, and micro-computed tomography, are plagued by limitations including relatively low sensitivity or penetration depth, involvement of ionizing irradiation, and potential cytotoxicity of the nanoparticles. Here we introduce a new class of contrast agents based on gold nanocages (AuNCs) with hollow interiors and porous walls to label human mesenchymal stem cells (hMSCs) for both in vitro and in vivo tracking using two-photon microscopy and photoacoustic microscopy. As demonstrated by the viability assay, the AuNCs showed negligible cytotoxicity under a reasonable dose, and did not alter the differentiation potential of the hMSCs into desired lineages. We were able to image the cells labeled with AuNCs in vitro for at least 28 days in culture, as well as to track the cells that homed to the tumor region in nude mice in vivo.
Keywords: gold nanocages, nanoparticles, human mesenchymal stem cells, U87 glioblastoma, blood vessels, stem cell therapy.
Introduction
Mesenchymal stem cells (MSCs) are multipotent progenitor cells that can differentiate into tissue-specific cell types, promote vascularization [1], and enhance immunosuppressive effects [2], among other capabilities. They are capable of migrating to diseased tissues naturally after injuries to accelerate the regeneration process [3, 4], and to tumor regions to participate in angiogenesis and metastasis of these tumors [5, 6]. Because of these remarkable capabilities, MSCs have recently become a platform for the emerging stem cell therapy that seeks to heal damaged tissues [7, 8], alleviate inflammation responses [9], and treat cancers [10, 11]. In spite of the enormous therapeutic potential of MSCs, it remains a challenge to monitor these cells in an effort to determine their regenerative abilities, retention, and bio-distribution post-transplantation. While conventional methods relying on destructive means such as histology can be used to follow the trafficking of the infused MSCs, there is an increasing demand for non-invasive stem cell tracking technologies.
Nuclear imaging techniques, such as positron emission tomography (PET) and single-photon emission computed tomography (SPECT), provide deep, three-dimensional (3D) imaging with high sensitivity [12-14]. Nevertheless, the capabilities of these two modalities are limited in terms of the requirement for genetic modifications of the cells, the cost of radionuclides with short half-lives, and relatively poor resolution [15]. Along with the tremendous progress of nanotechnology in recent years, great efforts have been made to develop techniques based on nanoparticle-labeling of stem cells. To this end, superparamagnetic iron oxide (SPIO) nanoparticles and gadonanotubes have been used to label MSCs for magnetic resonance imaging (MRI) [16, 17] or X-ray micro-computed tomography (micro-CT) [18, 19]; and quantum dots have been used to label hematopoietic stem cells (HSCs) or MSCs for fluorescence imaging [20, 21]. However, these contrast agents and/or imaging modalities suffer from several limitations. For example, MRI has relatively low sensitivity and therefore requires a high dose of contrast agents [22-24], quantum dots are troubled by their potential toxicity to cells and tissues [25, 26], and micro-CT utilizes ionizing irradiation which may cause adverse side effects to the cells or the body [27, 28].
In this study, we demonstrated the feasibility of labeling human MSCs (hMSCs) with a novel class of contrast agents based on gold nanocages (AuNCs). The two- and three-photon luminescence capabilities and strong optical absorption of AuNCs enabled us to quantitatively track the labeled cells using two-photon microscopy and photoacoustic microscopy, respectively. In addition to imaging hMSCs labeled with AuNCs in vitro, we could also locate the cells that migrated to glioblastoma regions formed by subcutaneous injection in nude mice in vivo. Labeling with AuNCs did not compromise the functions of hMSCs, and the nanoparticles could remain in the cells for at least 4 weeks post labeling, potentially enabling long-term monitoring of the cells.
Materials and methods
Materials
All chemicals and solvents were obtained from Sigma-Aldrich (Saint Louis, MO) and used as-received unless otherwise noted.
Synthesis of gold nanocages (AuNCs)
The AuNCs were prepared through a galvanic replacement reaction between silver nanocubes and chloroauric acid (HAuCl4) in an aqueous solution according to our previously published protocol [29]. The samples were characterized using a transmission electron microscope (TEM, FEI Spirit, Hillsboro, OR) operated at 120 kV. The UV-visible (UV-vis) extinction spectra were recorded using a Cary 50 spectrometer (Varian, Palo Alto, CA).
Cell culture and labeling
The hMSCs were obtained from Lonza (Walkersville, MD), and maintained in a Dulbecco's Modified Eagle Medium (DMEM, Invitrogen, Carlsbad, CA) supplemented with 20 vol.% fetal bovine serum (FBS, American Type Culture Collection, ATCC, Manassas, VA) and 1 vol.% penicillin-streptomycin (P/S, Invitrogen) at 37 °C and 5 vol.% CO2. To label with AuNCs, the cells were seeded into the wells of 6-well plates at a density of 5 × 10⁵ cells per well. When confluent, the medium in each well was aspirated and 2 mL of fresh culture medium containing AuNCs was added. The cells were incubated with AuNCs for a pre-determined period of time, and the medium was then removed, followed by washing with fresh medium 3 times. The cells were detached and dissociated by treatment with trypsin (Invitrogen) for further experiments.
Inductively coupled plasma mass spectrometry (ICP-MS)
The hMSCs were seeded in the wells of 6-well plates at a density of 5 × 10⁵ cells per well and allowed to grow to confluence. The cells were then incubated with a culture medium (2 mL per well) containing AuNCs at a particle concentration of 25 pM. At different time intervals, the cells were washed 3 times with cold phosphate buffered saline (PBS, Invitrogen), detached by treating with trypsin and the cell number was counted using a hemocytometer. The cell pellets were collected by centrifugation, lyophilized, and placed in centrifuge tubes (one pellet per tube). Then 400 µL of aqua regia was added to each tube to completely dissolve the cells and the AuNCs. The amount of Au was measured by Elan DRC II ICP-MS (Perkin Elmer, Waltham, MA), and combined with the geometric dimensions of AuNCs to calculate the number of AuNCs, which was then normalized to the number of cells.
Measurement of cytotoxicity
The cells were seeded into the wells of a 96-well plate at a density of 1 × 10⁴ cells per well, incubated with AuNCs at various concentrations for different periods of time, and cell viability was measured using the 3-(4,5-dimethylthiazol-2-yl)-2,5-diphenyltetrazolium bromide (MTT) assay. Briefly, 10 µL of 5 wt.% MTT (Invitrogen) in PBS was added to each well, and incubated for 1 h. The medium was then withdrawn, and 100 µL of isopropanol was added to each well to completely dissolve the formazan crystals. To avoid possible interference from the absorption of AuNCs, the solution in each well was centrifuged at 11,000 rpm for 10 min, and the supernatant was added into the wells of a new 96-well plate. The absorbance was measured at 562 nm using a spectrophotometer (Infinite 200, TECAN, Durham, NC).
Membrane integrity was measured using the Vybrant® Cytotoxicity Assay Kit (Invitrogen) according to the manufacturer's instructions, which detects glucose-6-phosphate dehydrogenase (G6PD) released into the surrounding medium from the damaged cells.
TEM of cells
The hMSCs were seeded in the wells of 6-well plates at a density of 5 × 10⁵ cells per well and allowed to grow to confluence. The cells were then incubated with a culture medium (2 mL per well) containing AuNCs at a particle concentration of 25 pM. The cells were collected by trypsin treatment after 24 h of incubation, and centrifuged at 1000 rpm for 5 min in a 1.5 mL Eppendorf tube. The cell pellet was then fixed in 4 wt.% paraformaldehyde and 2.5 wt.% glutaraldehyde in 0.1 M sodium cacodylate buffer for 2 h, followed by 3 washes with 0.1 M sodium cacodylate buffer and then dehydration in a graded ethanol series. The sample was placed in pure propylene oxide for 30 min, a mixture of propylene oxide and Embed-812 resin (1:1 volume ratio) overnight, pure Embed-812 resin overnight, and then cured in a rectangular mold at 60 °C for 12 h. The sample was sectioned at a thickness of 50-100 nm using a Leica Ultramicrotome EMUC7 (Leica Microsystems Inc., Buffalo Grove, IL), stained in sequence with 4 wt.% uranyl acetate aqueous solution for 10 min and 2 wt.% lead citrate aqueous solution for 2 min, and then observed under a TEM at 80-120 kV. All the chemicals used in this section were obtained from Electron Microscopy Sciences (Hatfield, PA).
Adipogenesis and osteogenesis of hMSCs
To induce adipogenesis, the hMSCs were cultured in a regular medium supplemented with 0.5 mM 3-isobutyl-1-methylxanthine, 1 µM dexamethasone, 5 µg/mL insulin, and 50 µM indomethacin. Osteogenesis was induced by culturing the hMSCs in a regular medium supplemented with 10 mM β-glycerol phosphate, 300 µM L-ascorbic acid, and 100 nM dexamethasone. The medium was changed every other day up to a total of 28 days.
In vitro two-photon microscopy
The two-photon laser scanning confocal microscope was based on Zeiss LSM 510 Meta NLO system with a Coherent Chameleon Ti:Sapphire laser, coupled to an upright Zeiss Axioskop 2 microscope (Carl Zeiss Microscopy, Thornwood, NY).
The hMSCs labeled with AuNCs (incubation condition: 25 pM for 24 h) were seeded onto sterile cover glasses, and re-passaging was performed if necessary when the cells had reached high density. The cells were fixed using 3.7 vol.% formaldehyde in PBS at days 1, 3 and 7 post seeding, and subjected to two-photon imaging at an excitation wavelength of 800 nm. The photoluminescence intensity of the cells at each time point was obtained by averaging at least 20 cells from multiple images. The laser power at different time points did not show variations larger than 1%.
In vitro photoacoustic microscopy
The hMSCs labeled with AuNCs were prepared the same way as those for two-photon microscopy. The integrated optical-resolution photoacoustic and fluorescence confocal microscopy system employed a dye laser (CBR-D, Sirah) with a wavelength tunable in the range of 560-590 nm (Rhodamine 6G, Exciton), pumped by a 523-nm Nd:YLF laser (INNOSLAB, Edgewave) [30]. The laser beam (excitation wavelength: 570 nm) was focused onto the sample by an objective lens (NA: 0.2; magnification: 13.3). The photoacoustic waves were detected using a 50-MHz ultrasonic transducer (V214-BB-RM, Olympus NDT, Kennewick, WA). The lateral resolution was measured to be approximately 5 µm in water. The amplified photoacoustic signals were digitized and saved along with the laser fluence signals by a DAQ instrument (CS 14200, Gage Applied Technologies, Canada). Two-dimensional (2D) en face photoacoustic images were rendered by raster scanning of the sample on the x-y transverse plane.
The subwavelength-resolution photoacoustic system utilized an Nd:YVO4 laser as the irradiation source [31]. The laser generated 532-nm pulses with 1.5-ns duration, which were transmitted to the optical objective through a single-mode optical fiber. The objective lens had an NA of 0.60, providing a lateral resolution of approximately 0.4 µm. The samples irradiated by focused laser pulses generated photoacoustic waves, which were detected in transmission mode by an ultrasonic transducer with a central frequency of 40 MHz and an NA of 0.5. The photoacoustic signals were then amplified, digitized at a sampling rate of 1 GHz, and processed by a computer for image processing. 2D en face photoacoustic images were rendered by raster scanning of the objective and the transducer on the x-y transverse plane.
A deep reflection-mode photoacoustic imaging system utilized a tunable Ti:Sapphire laser (LT-2211A; Lotis TII, Minsk, Belarus) pumped by a Q-switched Nd:YAG laser (LS-2137; Lotis TII) for photoacoustic excitation at a wavelength of 800 nm (pulse width: 5 ns, pulse repetition rate: 10 Hz) [32]. A 5-MHz central frequency, spherically focused ultrasonic transducer (V308; Panametrics-NDT, Waltham, MA, USA) was used to acquire the photoacoustic signals generated from the sample. The 5-MHz transducer yielded axial and transverse resolutions of 150 and 560 µm, respectively. The signals were amplified by a low-noise amplifier (5072PR; Panametrics-NDT) and recorded using a digital oscilloscope (TDS 5054; Tektronix, Beaverton, OR). 2D en face photoacoustic images were generated by raster scanning of the objective and the transducer on the x-y transverse plane.
In vivo tracking of hMSCs homed to tumor regions
All animal experiments were performed in accordance with protocols approved by the Washington University Department of Comparative Medicine and the Animal Studies Committee. Athymic Nude mice 4-5 weeks old were obtained from Harlan and housed under specific pathogen-free conditions in the animal facility at Washington University. About 5 µL of PBS containing approximately 1 × 10⁵ U87-MG glioblastoma cells was injected subcutaneously in the left ear of each mouse. The tumors were allowed to grow for 1 week to develop blood vessels inside the tumor regions. Then 100 µL of PBS containing approximately 1 × 10⁵ hMSCs labeled with AuNCs was injected intravenously through the tail vein of each mouse. Imaging was performed using two-photon microscopy or photoacoustic microscopy at 1 week post injection of the hMSCs. For two-photon microscopy, blood vessels were further labeled by intravenous injection of 50 µL of rhodamine-dextran (M.W. 100,000,000, 10 mg/mL in PBS) and imaged using the confocal configuration at an excitation wavelength of 530 nm. The hMSCs labeled with AuNCs were detected by the two-photon configuration at an excitation wavelength of 800 nm. For photoacoustic microscopy (see below for details), dual wavelength imaging was carried out at 532 nm (for blood vessels) and 638 nm (for hMSCs labeled with AuNCs).
A recently developed voice-coil optical-resolution photoacoustic microscopy was employed [33]. The system was consisted of a photoacoustic probe and a voice-coil-based scanner. In the photoacoustic probe, a custom-made photoacoustic beam combiner was utilized to merge the optical and acoustic beams. Short laser pulses were focused onto the sample through a set of lenses. The excited photoacoustic waves were collected by an ultrasound lens (6-mm aperture, 0.5-NA in water) and received by a high-frequency ultrasound transducer (V214-BC, Olympus NDT, Waltham, MA). To achieve high sensitivity, the optical and acoustic foci were confocally and coaxially aligned. The photoacoustic probe was mounted onto the voice-coil-based scanner (VCS-1010, Equipment Solutions, Sunnyvale, CA) to implement fast imaging, which could achieve a 20-Hz cross-sectional imaging speed over a range of several millimeters. The lateral resolution was measured to be 3.4 µm in water. 2D en face photoacoustic images were generated by raster scanning of the objective and the transducer on the x-y transverse plane.
For histology analysis, the tumors in a parallel group were explanted at 1 week post injection of the hMSCs, fixed in 3.7 vol.% formaldehyde in PBS, dehydrated in a graded ethanol series, embedded in paraffin and sectioned using a microtome (5 µm in thickness). The samples were stained with hematoxylin/eosin and observed under Nanozoomer Virtual Digital Microscopy (Hamamatsu, Bridgewater, NJ).
Results
AuNCs and cell uptake
As shown in Figure 1A, the AuNCs had an edge length of around 45 nm. They did not induce remarkable cytotoxicity towards hMSCs as revealed by the high (>80%) viability of the cells after incubation with AuNCs for 24 h at concentrations up to 50 pM, or at a concentration of 25 pM for up to 48 h (Figure 1B). The uptake of AuNCs by the cells also did not compromise their membrane integrity, as measured by quantifying the release of G6PD from the cells into the surrounding medium (Supplementary Material: Figure S1). Figure 1C shows the two-photon luminescence spectrum of AuNCs as recorded using a microscope [34]. The AuNCs had strong photoluminescence in the spectral range of approximately 400-700 nm. Figure 1D shows UV-vis extinction spectra of AuNCs in comparison with hemoglobin. While AuNCs had an absorption peak around 800 nm, the major absorption peaks for both oxygenated and deoxygenated hemoglobin fell in the range of below 600 nm.
Fig 1
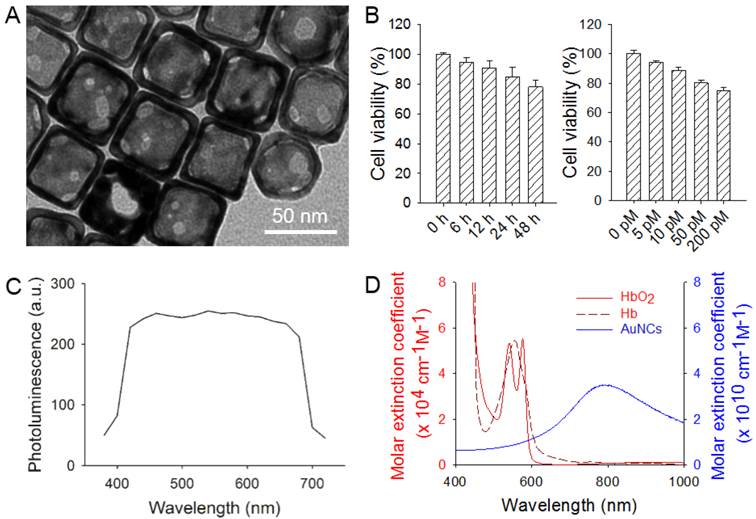
(A) A transmission electron micrograph showing AuNCs with an edge length of around 45 nm. (B) Cell viability data of AuNCs when they were incubated with hMSCs at a concentration of 25 pM for up to 48 h (left) or for 24 h at various concentrations up to 200 pM (right). (C) Photoluminescence spectrum of AuNCs measured using two-photon microscopy. (D) UV-vis extinction spectra of AuNCs, oxygenated hemoglobin (HbO2) and deoxygenated hemoglobin (Hb). Note that the extinction peak of AuNCs was located at a wavelength distinct from that of either HbO2 or Hb.
TEM observation confirmed the uptake of AuNCs by hMSCs (Supplementary Material: Figure S2). Most AuNCs were enclosed in endosome-like structures. No AuNCs were found inside the nucleus. It could also be observed in a magnified image (Figure S2, inset) that the morphology of the AuNCs was not altered after their uptake by the cells. As shown in Supplementary Material: Figure S3, the uptake of AuNCs by hMSCs was linearly correlated with the incubation period as determined by ICP-MS (R2 = 0.9788). An incubation time of 24 h at a concentration of 25 pM AuNCs were used for the following experiments, because under such a condition the uptake of AuNCs by the cells could reach a sufficient amount (approximately 2.3 × 10⁴ AuNCs per cell) to generate strong enough two-photon or photoacoustic signals while maintaining high viability of the cells.
The AuNCs could retain in the cells for at least 28 days of culture (Supplementary Material: Figure S4A). During the culture period, there was negligible exocytosis of AuNCs by the cells as determined by a translocation assay, since hMSCs incubated with the medium collected from cultures of cells labeled with AuNCs did not effectively generate two-photon signals (Figure S4B).
Differentiation of hMSCs
To further investigate the cytotoxicity of AuNCs, labeled or un-labeled hMSCs were induced for adipogenesis and osteogenesis. For both labeled (Figure 2, A, C, E and G) and un-labeled (Figure 2, B, D, F and H) hMSCs, large amounts of oil droplets or mineral were found to form after 4 weeks of differentiation into adipose (Figure 2, A-D) or bone (Figure 2, E-H) lineages. The degree of differentiation was then quantified. As shown in Figure 2, I and J, the presence of AuNCs inside hMSCs did not affect their capability to differentiate into different cell lineages.
The AuNCs could also retain in the cells after they had been induced for differentiation for 28 days (Supplementary Material: Figure S5). Some AuNCs were observed to co-localize with oil droplets during adipogenesis (Figure S5, A and B), or with mineral deposits during osteogenesis (Figure S5, C and D).
In vitro two-photon and photoacoustic microscopy of hMSCs labeled with AuNCs
Phantom experiments were carried out by imaging suspensions of AuNCs at different concentrations sealed in glass capillaries with a two-photon or an optical-resolution photoacoustic microscope. As shown in Figure 3, A and B, the two-photon intensity and photoacoustic amplitude both showed linear correlations with the concentration of AuNCs (R2 = 0.9948 and 0.9968, respectively). The hMSCs labeled with AuNCs could be clearly imaged at high resolutions by both two-photon (Supplementary Material: Figure S6A) and photoacoustic microscopy (Figure S6B, the subwavelength-resolution system). It was also found that, as the initially labeled cells divided, AuNCs were diluted into their decedent cells, leading to linearly decreased two-photon intensity or photoacoustic amplitude (Figure 3, C and D) over a culture period of 7 days.
As shown in Supplementary Material: Figure S7A, hMSCs labeled with AuNCs could be detected when embedded deeply in tissues (over 5 mm, chicken breast) using an acoustic-resolution photoacoustic microscopy at the expense of decreasing lateral resolution to approximately 100 µm. As expected, at the same depth, photoacoustic amplitude was linearly correlated with the number of hMSCs labeled with AuNCs (Figure S7A), and at the same density of AuNCs-labeled cells, photoacoustic amplitude followed exponential decay against the depth (Figure S7B).
Fig 2
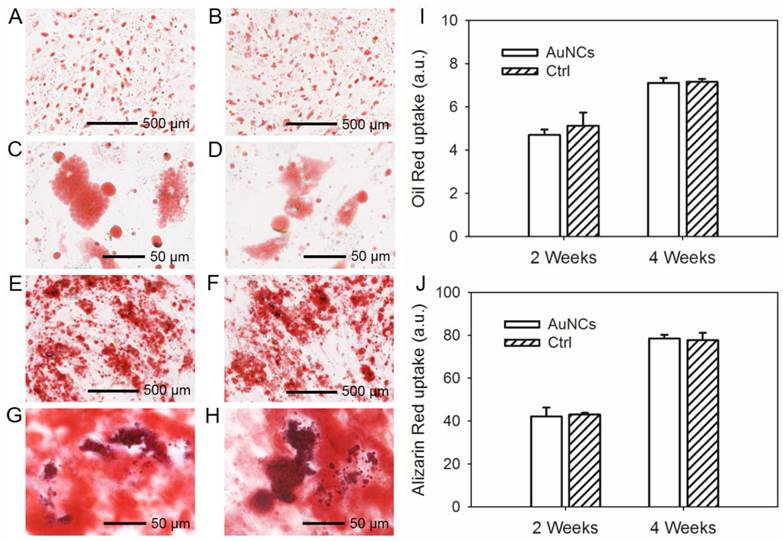
(A, B) Oil red staining showing the formation of oil drops in the hMSCs induced for adipogenesis for 4 weeks; (C, D) are magnified views of (A, B), respectively. (E, F) Alizarin red staining showing the formation of calcium deposits in the hMSCs induced for osteogenesis for 4 weeks. (G, H) are magnified views of (E, F), respectively. The hMSCs in (A, C, E, and G) were labeled with AuNCs while those in (B, D, F, and H) were unlabeled. (I, J) Quantification of oil red uptake in the adipogenesis group and alizarin red uptake in the osteogenesis group.
Fig 3
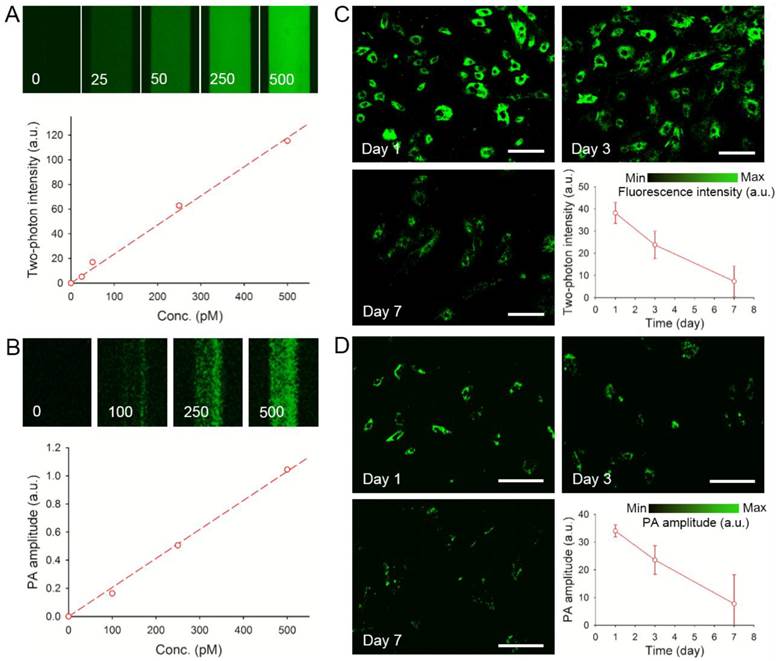
(A) Calibration plot for two-photon intensity versus different concentrations (0-500 pM) of AuNCs in glass capillaries. (B) Calibration plot for photoacoustic (PA) amplitude versus different concentrations (0-500 pM) of AuNCs in glass capillaries. (C) Two-photon intensity as a function of culture time for the hMSCs labeled with AuNCs (lase power: 2%; scale bars: 50 µm). (D) PA amplitude as a function of culture time for the hMSCs labeled with AuNCs (scale bars: 100 µm).
In vivo two-photon and photoacoustic microscopy of hMSCs labeled with AuNCs
The hMSCs labeled with AuNCs (around 2.3 × 10⁴ particles per cell) were injected subcutaneously into the ear of a nude mouse. As shown in Figure 4A, individual cells could be well-resolved by two-photon microscopy. Figure 4B shows a calibration curve of two-photon intensity as a function of the number of cells injected. Since each cell had about the same number of AuNCs, the two-photon intensity increased linearly as the number of cells increased (R2 = 0.8955). To evaluate the capability of two-photon microscopy to track the distribution of AuNCs-labeled hMSCs in vivo, a human glioblastoma (brain tumor) was induced to form in a mouse ear by subcutaneous injection of U87-MG cells. At 1 week after the formation of the tumor, around 1 × 10⁵ hMSCs labeled with AuNCs were injected intravenously into the mouse via the tail vein. Two-photon images were collected 7 days later to follow the homing of hMSCs to the tumor region. Prior to imaging, the mouse was injected with rhodamine-dextran via the tail vein to label the blood vessels. Figure 4, C and D, shows a confocal micrograph of the vasculature (red) and a two-photon micrograph of the AuNCs-labeled hMSCs (green) in the tumor region, respectively. A co-registered image is shown in Figure 4E, and Figure 4F shows an enlarged view of the area marked by the white dotted square in Figure 4E, indicating the co-localization of hMSCs with the tumor blood vessels.
The AuNCs-labeled hMSCs were also imaged in vivo using photoacoustic microscopy. As shown in Figure 5A, the photoacoustic amplitude was linearly correlated with the number of hMSCs labeled with AuNCs (R2 = 0.9956). We then injected AuNCs-labeled hMSCs subcutaneously into a mouse ear and performed optical-resolution photoacoustic imaging at a wavelength of 580 nm. Figure 5B shows coronal and sagittal maximum amplitude projection (MAP) images, respectively, revealing that both the blood vessels of the mouse ear and the AuNCs-labeled hMSCs (shown as bright dots or patches) could be detected at such a wavelength. We then tracked the homing of the hMSCs to the glioblastoma region using dual-wavelength optical-resolution photoacoustic microscopy. The tumor was prepared as described above and photoacoustic imaging was performed 7 days after injection of the AuNCs-labeled hMSCs via tail vein. At 532 nm, both the blood vessels and AuNCs-labeled hMSCs were visible. Only the labeled cells could be observed at 638 nm due to the much weaker absorption of hemoglobin/deoxy-hemoglobin than AuNCs at this wavelength (Figure 1D). Therefore, signals from each component could be easily separated in the photoacoustic images (Figure 5, C and D). We could further observe co-localization of tumor blood vessels and hMSCs in the co-registered images (Figure 5, E and F).
The homing of hMSCs to the tumor region was also verified by histology. As shown in Supplementary Material: Figure S8, a few AuNCs-labeled cells (indicated by white arrows, dark green or blackish in color due to the presence of AuNCs) were found within the tumor region, and they were typically in close proximity to blood vessels (indicated by yellow arrowheads), indicating their migration from the tumor vasculature to the surrounding tumor mass and/or their participation in the neovascularization of the tumor.
Fig 4
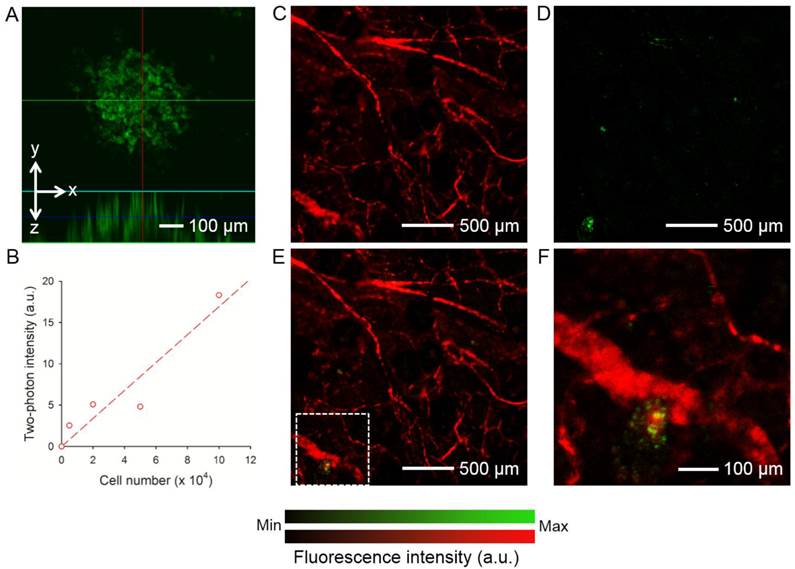
(A) A representative two-photon projection image showing the AuNCs-labeled hMSCs subcutaneously injected into a mouse ear. (B) Calibration plot for two-photon intensity versus the number of subcutaneously injected hMSCs labeled with AuNCs. (C-E) Confocal and two-photon coronal projection images showing (C) blood vessels in a U87 brain tumor and (D) AuNCs-labeled hMSCs that homed to the tumor region, and (E) superimposed image. (F) An enlarged view showing the area indicated by white dotted square in (E). The tumor cells were inoculated subcutaneously in a mouse ear and allowed to develop for 1 week. Afterwards, the AuNCs-labeled hMSCs were injected intravenously and images were collected 7 days after injection. The blood vessels were fluorescently labeled by intravenous injection of rhodamine-dextran right before imaging.
Fig 5
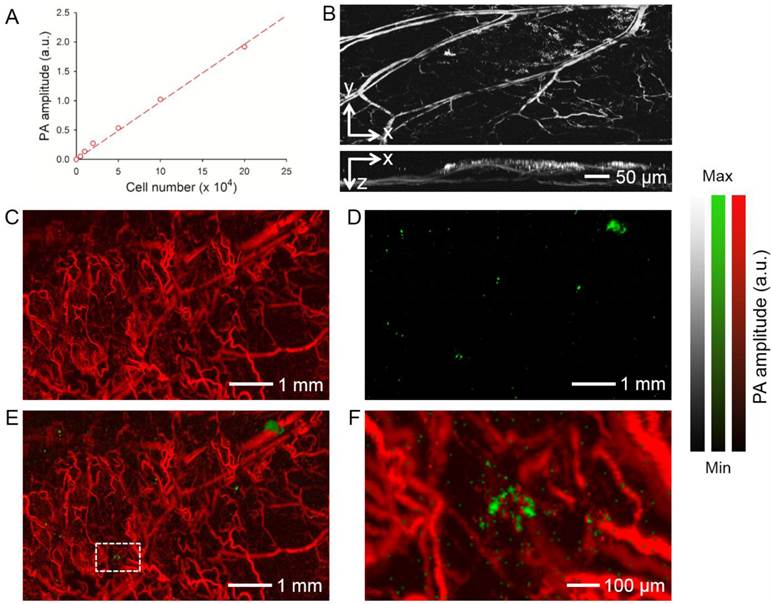
(A) Calibration plot for photoacoustic (PA) amplitude versus the number of subcutaneously injected hMSCs labeled with AuNCs. (B) Representative PA coronal and sagittal MAP images showing the AuNCs-labeled hMSCs subcutaneously injected into a mouse ear. Laser excitation at a single wavelength at 580 nm could detect both blood and the AuNCs-labeled hMSCs (bright spots or patches). (C-E) PA coronal MAP images showing (C) blood vessels in a U87 brain tumor acquired at a wavelength of 532 nm and (D) the AuNCs-labeled hMSCs that homed to the tumor region acquired at a wavelength of 638 nm, and (E) superimposed image. (F) An enlarged view showing the area as indicated by white dotted square in (E). The tumor cells were inoculated subcutaneously in a mouse ear and allowed to develop for 1 week. The AuNCs-labeled hMSCs were then injected intravenously and images were collected from the tumor region at 7 days after injection. MAP stands for 'Maximum Amplitude Projection'.
Discussion
AuNCs are nanostructures with hollow interiors and porous walls; they can be readily prepared using a galvanic replacement reaction (Figure 1A). Due to their capability to carry bioactive substances within the hollow structures, AuNCs have been extensively used in drug delivery and cancer therapeutics [35, 36], as well as related cell uptake studies [37, 38]. Besides, they possess excellent optical properties including multi-photon luminescence and strong optical scattering/absorption at tunable wavelengths (Figure 1, C and D). As such, they have also been actively explored as contrast agents for optical coherence tomography [39], multi-photon microscopy [34, 40], photoacoustic microscopy [41, 42], and surface-enhanced Raman scattering [43]. Here we further demonstrated that AuNCs could be used to label stem cells in an effort to track these cells non-invasively, both in vitro and in vivo, using two-photon or photoacoustic microscopy.
For any stem cell labeling technology to be practical, it is essential that the nanoparticles do not exert any toxic effect on the labeled cells. The potential toxicity of a few types of nanoparticles has been observed although somewhat controversial. For example, SPIO nanoparticles were shown to induce impaired differentiation of hMSCs via interference with signaling process [44]. Quantum dots containing cadmium can be toxic to cells due to the release of Cd2+ over time [25, 45]. Our cytotoxicity results showed that, incubation of AuNCs with hMSCs did not remarkably reduce the metabolic activity of the cells as determined by the MTT assay (Figure 1B), nor the membrane integrity by analyzing G6PD released from the cells (Supplementary Material: Figure S1) within a reasonable dose. The minor toxicity of AuNCs to hMSCs was also demonstrated in a differentiation assay, where the labeled cells were induced to differentiate into adipose or bone lineages. In either case there was no significant difference in the degree of differentiation comparing to the unlabeled cells (Figure 2). In addition, it is noted that AuNCs could retain in cultured hMSCs for at least 28 days in either the differentiation medium (Supplementary Material: Figure S4) or proliferation medium (Supplementary Material: Figure S5). During this period of time, the clearance of AuNCs by the cells was also negligible (Figure S5), unlike the marked exocytosis when using quantum dots smaller in size (10-20 nm) [21]. These results imply that our labeling technique based on AuNCs could potentially enable long-term tracking of hMSCs, which represents another important aspect of efficient stem cell labeling technology.
Current imaging modalities based on nanoparticle-labeling for monitoring stem cells are plagued by certain factors, including the relatively low sensitivity for MRI [24], the ionizing irradiation imposed by high-energy X-rays for micro-CT [27, 28], and shallow penetration depth for (confocal) fluorescence microscopy. Unlike conventional (confocal) fluorescence microscopy, multi-photon microscopy utilizes localized non-linear excitation from a pulsed laser to excite fluorophores only at the focal plane, resulting in a quadratic dependence on the light intensity [46]. Photoacoustic microscopy, on the other hand, is a more recently developed imaging modality based on the detection of ultrasonic waves generated by an optically absorbing object irradiated by a pulsed or intensity-modulated laser [47]. Due to both the tolerance of optical scattering and the weak scattering of ultrasonic waves by biological tissues, photoacoustic microscopy can easily reach a much deeper depth than conventional microscopy based on pure optical imaging. Notably, the excitation peak of AuNCs was adjusted to a wavelength of 800 nm for both two-photon microscopy and photoacoustic microscopy, which could further improve the penetration depth of the two imaging modalities due to the relatively low absorption of biological tissues at such a wavelength. Given the large optical absorption cross-section of AuNCs [48], it could also improve the detection sensitivity and therefore reduce the dose and potential cytotoxicity of the nanoparticles to the cells.
Our in vitro experiments demonstrated that hMSCs labeled with AuNCs could be monitored by two-photon microscopy or photoacoustic microscopy at high resolution (Supplementary Material: Figure S6). Similar to two-photon microscopy, optical-resolution photoacoustic microscopy could achieve resolution as high as approximately 0.4 µm through tight optical focusing [31]. In addition to imaging their morphologies (Figure 3, C and D), we could further quantify the signals from the cells based on their two-photon luminescence intensity or photoacoustic amplitude. The two-photon luminescence intensity or the photoacoustic amplitude decreased almost linearly over time (Figure 3, C and D), because the AuNCs were re-distributed and diluted into the daughter cells when the mother cells divided. Interestingly, the standard deviation of the amount of AuNCs in each cell increased over time, indicating that the nanoparticles were presumably not distributed equally into the daughter cells upon the division of the mother cells. This result is similar to our study on the re-distribution of AuNCs in a brain tumor cell line [49]. It should be further noted that the AuNCs passively taken up by hMSCs were mainly distributed in the cytoplasm of the cells and the nuclei remained unlabeled. An investigation using TEM further revealed that the majority of AuNCs were encapsulated within endosome-like structures (Supplementary Material: Figure S2), possibly due to their neutral surface charge. By modifying the surface properties (e.g., charges or ligands) of AuNCs, we can potentially control their cellular distributions to specific locations such as the plasma membrane, cytoplasm, and even nuclei. Importantly, using acoustic-resolution photoacoustic microscopy based on ultrasonic focusing, we could image the AuNCs-labeled hMSCs embedded more than 5 mm deep in tissues at a lateral resolution of approximately 100 µm (Supplementary Material: Figure S7). In fact, photoacoustic tomography can even image objects in biological tissues at a depth of several centimeters at the expense of further decreasing the resolution [50, 51], which might be suitable for large animal studies and clinical applications.
We also demonstrated the ability to image and track hMSCs in vivo. Using a glioblastoma model in the ear of a nude mouse, we could efficiently monitor the homing of AuNCs-labeled hMSCs to the tumor region post injection via tail vein using two-photon microscopy, while the blood vessels were simultaneously imaged using confocal microscopy after intravenous injection of rhodamine-dextran (Figure 4, C-F). In comparison, simultaneous imaging of AuNCs-labeled hMSCs and the tumor vasculature could be achieved using photoacoustic microscopy simply by dual-wavelength scanning (Figure 5, C-F), therefore eliminating any need to further label blood vessels with an exogenous contrast agent [52, 53]. This unique feature comprises another major advantage of photoacoustic microscopy because the injection of any contrast agents into the blood stream may alter the hemodynamics of the vessels. Moreover, besides qualitative imaging of the blood vessels, quantitative and functional photoacoustic microscopy can also be performed to derive many parameters of the vasculature, including blood vessel area [53], blood flow velocity [54], oxygen saturation [55], partial oxygen pressure [30, 55], and oxygen metabolism [56]. These parameters can be particularly important when studying the interactions between the infused stem cells and blood vessels, which are otherwise not easily obtainable with other imaging modalities including two-photon microscopy, micro-CT, MRI, and PET.
In summary, four photoacoustic microscopy systems were used in our current study. One of them is the subwavelength-resolution photoacoustic microscopy that can achieve a lateral resolution of approximately 400 nm through tight optical focusing, close to the optical diffraction limit (Figure S6B). However, the penetration depth of such a system is limited to micrometer-scale due to strong light scattering. On the contrary, an acoustic-resolution photoacoustic microscopy can achieve very deep penetration over a few millimeters although the resolution has to be reduced to approximately 100 µm (Figure S7). By further decreasing the resolution, even deeper penetration on the scale of centimeters can be obtained. The other two systems referred to as optical-resolution photoacoustic microscopy are in between these two extremes. They have high lateral resolutions of 3-5 µm and intermediate penetration depths of approximate 0.7-1 mm, which is well-suited for studies with cells and small animals. While the dual-modality system combining optical-resolution photoacoustic microscopy and confocal microscopy can be useful for regular photoacoustic imaging (Figure 3, B and D; Figure 5B) or in situations where absorption and fluorescence contrasts co-exist [57], the voice-coil optical-resolution photoacoustic microscopy is particularly suitable for live cell or animal imaging because of its fast scanning speed (Figure 5, C-F). Therefore, the photoacoustic microscopy systems are remarkably versatile in imaging samples over multiple scales depending on the specific application.
Conclusion
We have demonstrated that AuNCs could be used to effectively label hMSCs for long-term tracking of the cells using non-invasive, two-photon or photoacoustic microscopy. The AuNCs did not show remarkable cytotoxicity towards hMSCs as indicated by their high viability, membrane integrity, and differentiation capability. With future development of an integrated dual modality imaging system that combines two-photon and photoacoustic microscopy, we believe that our labeling and imaging techniques will find major applications in the field of (stem) cell tracking.
Supplementary Material
Fig. S1-S8.
Acknowledgements
This work was supported in part by an NIH grant (R01 CA138527) and startup funds from Washington University in St. Louis (to Y.X.). This work was also sponsored by NIH grants (R01 EB000712, R01 EB008085, R01 CA134539, U54 CA136398, R01 CA157277, and R01 CA159959, to L.V.W.). Part of the research was performed at the Alafi Neuroimaging Laboratory of the Hope Center for Neurological Disorders, which was supported by the NIH Neuroscience Blueprint Center Core Grant P30 NS057105. We thank Arie Krumholz for his assistance with the preparation of animal protocol.
Conflict of Interest
L.V.W. has a financial interest in Microphotoacoustics, Inc. and Endra, Inc., which, however, did not support this work. All other authors declare no competing financial interests.
References
1. Koike N, Fukumura D, Gralla O, Au P, Schechner JS, Jain RK. Tissue engineering: creation of long-lasting blood vessels. Nature. 2004;428:138-9
2. Nauta AJ, Fibbe WE. Immunomodulatory properties of mesenchymal stromal cells. Blood. 2007;110:3499-506
3. Humphreys BD, Bonventre JV. Mesenchymal stem cells in acute kidney injury. Annu Rev Med. 2008;59:311-25
4. Stappenbeck TS, Miyoshi H. The role of stromal stem cells in tissue regeneration and wound repair. Science. 2009;324:1666-9
5. Bexell D, Scheding S, Bengzon J. Toward brain tumor gene therapy using multipotent mesenchymal stromal cell vectors. Mol Ther. 2010;18:1067-75
6. Borthwick L. The dark side of mesenchymal stem cells. Nat Rep Stem Cells. 2007 DOI:10.1038/stemcells.2007.107
7. Pittenger MF, Martin BJ. Mesenchymal stem cells and their potential as cardiac therapeutics. Circ Res. 2004;95:9-20
8. Lu D, Mahmood A, Wang L, Li Y, Lu M, Chopp M. Adult bone marrow stromal cells administered intravenously to rats after traumatic brain injury migrate into brain and improve neurological outcome. Neuroreport. 2001;12:559-63
9. Guo J, Lin G-s, Bao C-y, Hu Z-m, Hu M-y. Anti-inflammation role for mesenchymal stem cells transplantation in myocardial infarction. Inflammation. 2007;30:97-104
10. Chen X, Lin X, Zhao J, Shi W, Zhang H, Wang Y. et al. A tumor-selective biotherapy with prolonged impact on established metastases nased on cytokine gene-engineered MSCs. Mol Ther. 2008;16:749-56
11. Hu Y-L, Fu Y-H, Tabata Y, Gao J-Q. Mesenchymal stem cells: a promising targeted-delivery vehicle in cancer gene therapy. J Control Release. 2010;147:154-62
12. Hung S-C, Deng W-P, Yang WK, Liu R-S, Lee C-C, Su T-C. et al. Mesenchymal stem cell targeting of microscopic tumors and tumor stroma development monitored by noninvasive in vivo positron emission tomography imaging. Clinical Cancer Res. 2005;11:7749-56
13. Rodriguez-Porcel M. In vivo imaging and monitoring of transplanted stem cells: clinical applications. Curr Cardiol Rep. 2010;12:51-8
14. Chin BB, Nakamoto Y, Bulte JW, Pittenger MF, Wahl R, Kraitchman DL. 111In oxine labelled mesenchymal stem cell SPECT after intravenous administration in myocardial infarction. Nucl Med Commun. 2003;24:1149-54
15. Reagan MR, Kaplan DL. Concise review: mesenchymal stem cell tumor-homing: detection methods in disease model systems. Stem Cells. 2011;29:920-7
16. Andreas K, Georgieva R, Ladwig M, Mueller S, Notter M, Sittinger M. et al. Highly efficient magnetic stem cell labeling with citrate-coated superparamagnetic iron oxide nanoparticles for MRI tracking. Biomaterials. 2012;33:4515-25
17. Tran LA, Krishnamurthy R, Muthupillai R, da Graça Cabreira-Hansen M, Willerson JT, Perin EC. et al. Gadonanotubes as magnetic nanolabels for stem cell detection. Biomaterials. 2010;31:9482-91
18. Torrente Y, Gavina M, Belicchi M, Fiori F, Komlev V, Bresolin N. et al. High-resolution X-ray microtomography for three-dimensional visualization of human stem cell muscle homing. FEBS Lett. 2006;580:5759-64
19. Giuliani A, Frati C, Rossini A, Komlev VS, Lagrasta C, Savi M. et al. High-resolution X-ray microtomography for three-dimensional imaging of cardiac progenitor cell homing in infarcted rat hearts. J Tissue Eng Regen Med. 2011;5:e168-e78
20. Chakraborty SK, Fitzpatrick JAJ, Phillippi JA, Andreko S, Waggoner AS, Bruchez MP. et al. Cholera toxin B conjugated quantum dots for live cell labeling. Nano Lett. 2007;7:2618-26
21. Ranjbarvaziri S, Kiani S, Akhlaghi A, Vosough A, Baharvand H, Aghdami N. Quantum dot labeling using positive charged peptides in human hematopoetic and mesenchymal stem cells. Biomaterials. 2011;32:5195-205
22. Yu X, Song S-K, Chen J, Scott MJ, Fuhrhop RJ, Hall CS. et al. High-resolution MRI characterization of human thrombus using a novel fibrin-targeted paramagnetic nanoparticle contrast agent. Magnet Reson Med. 2000;44:867-72
23. Lee J-H, Jun Y-w, Yeon S-I, Shin J-S, Cheon J. Dual-mode nanoparticle probes for high-performance magnetic resonance and fluorescence imaging of neuroblastoma. Angew Chem Int Ed. 2006;118:8340-2
24. Rogers WJ, Meyer CH, Kramer CM. Technology insight: in vivo cell tracking by use of MRI. Nat Clin Pract Cardiovasc Med. 2006;3:554-62
25. Derfus AM, Chan WCW, Bhatia SN. Probing the cytotoxicity of semiconductor quantum dots. Nano Lett. 2003;4:11-8
26. Hardman R. A toxicologic review of quantum dots: toxicity depends on physicochemical and environmental factors. Environ Health Perspect. 2006;114:165-72
27. Klinck RJ, Campbell GM, Boyd SK. Radiation effects on bone architecture in mice and rats resulting from in vivo micro-computed tomography scanning. Med Eng Phys. 2008;30:888-95
28. Ritman EL. Molecular imaging in small animals — roles for micro-CT. J Cell Biochem. 2002;87:116-24
29. Skrabalak SE, Au L, Li X, Xia Y. Facile synthesis of Ag nanocubes and Au nanocages. Nat Protoc. 2007;2:2182-90
30. Wang Y, Hu S, Maslov K, Zhang Y, Xia Y, Wang LV. In vivo integrated photoacoustic and confocal microscopy of hemoglobin oxygen saturation and oxygen partial pressure. Opt Lett. 2011;36:1029-31
31. Zhang C, Maslov K, Wang LV. Subwavelength-resolution label-free photoacoustic microscopy of optical absorption in vivo. Opt Lett. 2010;35:3195-7
32. Song KH, Wang LV. Deep reflection-mode photoacoustic imaging of biological tissue. J Biomed Opt. 2007;12:060503-3
33. Wang L, Maslov K, Yao J, Rao B, Wang LV. Fast voice-coil scanning optical-resolution photoacoustic microscopy. Opt Lett. 2011;36:139-41
34. Au L, Zhang Q, Cobley CM, Gidding M, Schwartz AG, Chen J. et al. Quantifying the cellular uptake of antibody-conjugated Au nanocages by two-photon microscopy and inductively coupled plasma mass spectrometry. ACS Nano. 2010;4:35-42
35. Yavuz MS, Cheng Y, Chen J, Cobley CM, Zhang Q, Rycenga M. et al. Gold nanocages covered by smart polymers for controlled release with near-infrared light. Nat Mater. 2009;8:935-9
36. Li W, Cai X, Kim C, Sun G, Zhang Y, Deng R. et al. Gold nanocages covered with thermally-responsive polymers for controlled release by high-intensity focused ultrasound. Nanoscale. 2011;3:1724-30
37. Cho EC, Xie J, Wurm PA, Xia Y. Understanding the role of surface charges in cellular adsorption versus internalization by selectively removing gold nanoparticles on the cell surface with a I2/KI etchant. Nano Lett. 2009;9:1080-4
38. Cho EC, Zhang Q, Xia Y. The effect of sedimentation and diffusion on cellular uptake of gold nanoparticles. Nat Nanotechnol. 2011;6:385-91
39. Cang H, Sun T, Li ZY, Chen J, Wiley BJ, Xia Y. et al. Gold nanocages as contrast agents for spectroscopic optical coherence tomography. Opt Lett. 2005;30:3048-50
40. Tong L, Cobley CM, Chen J, Xia Y, Cheng J-X. Bright three-photon luminescence from gold/silver alloyed nanostructures for nioimaging with negligible photothermal toxicity. Angew Chem Int Ed. 2010;49:3485-8
41. Song KH, Kim C, Cobley CM, Xia Y, Wang LV. Near-infrared gold nanocages as a new class of tracers for photoacoustic sentinel lymph node mapping on a rat model. Nano Lett. 2009;9:183-8
42. Kim C, Cho EC, Chen J, Song KH, Au L, Favazza C. et al. In vivo molecular photoacoustic tomography of melanomas targeted by bioconjugated gold nanocages. ACS Nano. 2010;4:4559-64
43. Rycenga M, Hou KK, Cobley CM, Schwartz AG, Camargo PHC, Xia Y. Probing the surface-enhanced Raman scattering properties of Au-Ag nanocages at two different excitation wavelengths. Phys Chem Chem Phys. 2009;11:5903-8
44. Bulte JWM, Kraitchman DL, Mackay AM, Pittenger MF. Chondrogenic differentiation of mesenchymal stem cells is inhibited after magnetic labeling with ferumoxides. Blood. 2004;104:3410-3
45. Resch-Genger U, Grabolle M, Cavaliere-Jaricot S, Nitschke R, Nann T. Quantum dots versus organic dyes as fluorescent labels. Nat Methods. 2008;5:763-75
46. Zipfel WR, Williams RM, Webb WW. Nonlinear magic: multiphoton microscopy in the biosciences. Nat Biotechnol. 2003;21:1369-77
47. Wang LV. Multiscale photoacoustic microscopy and computed tomography. Nat Photon. 2009;3:503-9
48. Cho EC, Kim C, Zhou F, Cobley CM, Song KH, Chen J. et al. Measuring the optical absorption cross sections of Au-Ag nanocages and Au nanorods by photoacoustic imaging. J Phys Chem C. 2009;113:9023-8
49. Cho EC, Zhang Y, Cai X, Moran CH, Wang LV, Xia Y. A quantitative analysis of the fate of Au nanocages after uptake by U87-MG tumor cells under both in vitro and in vivo conditions. Angew Chem Int Ed; in press. DOI: 10.1002/anie.201208096.
50. Ku G, Wang LV. Deeply penetrating photoacoustic tomography in biological tissues enhancedwith an optical contrast agent. Opt Lett. 2005;30:507-9
51. Kim C, Erpelding TN, Jankovic L, Pashley MD, Wang LV. Deeply penetrating in vivo photoacoustic imaging using a clinical ultrasound array system. Biomed Opt Express. 2010;1:278-84
52. Zhang HF, Maslov K, Stoica G, Wang LV. Functional photoacoustic microscopy for high-resolution and noninvasive in vivo imaging. Nat Biotechnol. 2006;24:848-51
53. Cai X, Zhang Y, Li L, Choi S-W, MacEwan MR, Yao J. et al. Investigation of neovascularization in three-dimensional porous scaffolds in vivo by a combination of multiscale photoacoustic microscopy and optical coherence tomography. Tissue Eng C. 2013;19:196
54. Yao J, Wang LV. Transverse flow imaging based on photoacoustic Doppler bandwidth broadening. J Biomed Opt. 2010;15:021304-5
55. Zhang HF, Maslov K, Sivaramakrishnan M, Stoica G, Wang LV. Imaging of hemoglobin oxygen saturation variations in single vessels in vivo using photoacoustic microscopy. Appl Phys Lett. 2007;90:053901
56. Yao J, Maslov K, Zhang Y, Xia Y, Wang LV. Label-free oxygen-metabolic photoacoustic microscopy in vivo. J Biomed Opt. 2011;16:076003-11
57. Zhang Y, Cai X, Wang Y, Zhang C, Li L, Choi S-W. et al. Noninvasive photoacoustic microscopy of living cells in two and three dimensions through enhancement by a metabolite dye. Angew Chem Int Ed. 2011;50:7359-63
Author contact
![]() Corresponding authors: E-mail: younan.xiagatech.edu (for gold nanocages, cell culture and two-photon microscopy); lhwangwustl.edu (for photoacoustic microscopy).
Corresponding authors: E-mail: younan.xiagatech.edu (for gold nanocages, cell culture and two-photon microscopy); lhwangwustl.edu (for photoacoustic microscopy).
Citation styles
APA
Zhang, Y.S., Wang, Y., Wang, L., Wang, Y., Cai, X., Zhang, C., Wang, L.V., Xia, Y. (2013). Labeling Human Mesenchymal Stem Cells with Gold Nanocages for in vitro and in vivo Tracking by Two-Photon Microscopy and Photoacoustic Microscopy. Theranostics, 3(8), 532-543. https://doi.org/10.7150/thno.5369.
ACS
Zhang, Y.S.; Wang, Y.; Wang, L.; Wang, Y.; Cai, X.; Zhang, C.; Wang, L.V.; Xia, Y. Labeling Human Mesenchymal Stem Cells with Gold Nanocages for in vitro and in vivo Tracking by Two-Photon Microscopy and Photoacoustic Microscopy. Theranostics 2013, 3 (8), 532-543. DOI: 10.7150/thno.5369.
NLM
Zhang YS, Wang Y, Wang L, Wang Y, Cai X, Zhang C, Wang LV, Xia Y. Labeling Human Mesenchymal Stem Cells with Gold Nanocages for in vitro and in vivo Tracking by Two-Photon Microscopy and Photoacoustic Microscopy. Theranostics 2013; 3(8):532-543. doi:10.7150/thno.5369. https://www.thno.org/v03p0532.htm
CSE
Zhang YS, Wang Y, Wang L, Wang Y, Cai X, Zhang C, Wang LV, Xia Y. 2013. Labeling Human Mesenchymal Stem Cells with Gold Nanocages for in vitro and in vivo Tracking by Two-Photon Microscopy and Photoacoustic Microscopy. Theranostics. 3(8):532-543.
This is an open access article distributed under the terms of the Creative Commons Attribution (CC BY-NC) License. See http://ivyspring.com/terms for full terms and conditions.