Theranostics
13.3
Impact Factor
- Current Issue
- Advance Articles
- Volume 16; 2026
- Volume 15; 2025
- Volume 14; 2024
- Volume 13; 2023
- Volume 12; 2022
- Archive
- Cover Images
- Cover Suggestion
- Special Issues
Top
Introduction
Patients and Methods
Results
Discussion
Abbreviations
Supplementary Material
Acknowledgements
References
Introduction
Patients and Methods
Results
Discussion
Abbreviations
Supplementary Material
Acknowledgements
References
International Journal of Biological Sciences
International Journal of Medical Sciences
 Global reach, higher impact

Theranostics 2015; 5(3):218-226. doi:10.7150/thno.10636 This issue Cite
Research Paper
Quantitative Hepatitis B Core Antibody Level Is a New Predictor for Treatment Response In HBeAg-positive Chronic Hepatitis B Patients Receiving Peginterferon
Feng-Qin Hou1*, Liu-Wei Song2*, Quan Yuan2, Lin-Lin Fang2, Sheng-Xiang Ge2, Jun Zhang2, Ji-Fang Sheng3, Dong-Ying Xie4, Jia Shang5, Shu-Huan Wu6, Yong-Tao Sun7, Shao-Feng Wei8, Mao-Rong Wang9, Mo-Bin Wan10, Ji-Dong Jia11, Guang-Han Luo12, Hong Tang13, Shu-Chen Li14, Jun-Qi Niu15, Wei-dong Zhou16, Li Sun16 ![]() , Ning-Shao Xia2
, Ning-Shao Xia2 ![]() , Gui-Qiang Wang1
, Gui-Qiang Wang1 ![]()
1. Department of Infectious Diseases, Center for Liver Diseases, Peking University First Hospital, Beijing, China;
2. State Key Laboratory of Molecular Vaccinology and Molecular Diagnostics, National Institute of Diagnostics and Vaccine Development in Infectious Diseases, School of Public Health, Xiamen University, Xiamen, China;
3. Department of Infectious Diseases, the First Affiliated Hospital, Zhejiang University School of Medicine, Hangzhou, China;
4. Department of Infectious Diseases, the Third Affiliated Hospital of Sun Yet-Sen University, Guangzhou, China;
5. Department of Infectious Diseases, Henan Provincial People's Hospital, Zhengzhou, China;
6. Department of Infectious Diseases, the First Affiliated Hospital of Zhengzhou University, Zhengzhou, China;
7. Department of Infectious Diseases, Tang Du Hospital, the Fourth Military Medical University, Xi'an, China;
8. Department of Infectious Diseases, the First Affiliated Hospital of Anhui Medical University, Hefei, China;
9. Department of Infectious Diseases, PLA 81st Hospital, Nanjing, China;
10. Department of Infectious Diseases, the Second Military Medical University Changhai Hospital, Shanghai, China;
11. Liver Research Center, Beijing Friendship Hospital, Capital Medical University, Beijing, China;
12. Department of Infectious Diseases, the First Affiliated Hospital of Guangxi Medical University, Nanning, China;
13. Center of Infectious Diseases, West China Hospital, Sichuan University, Chengdu, China;
14. Department of Infectious Diseases, the Second Affiliated Hospital of Harbin Medical University, Harbin, China;
15. Center for Liver Diseases, the First Affiliated Hospital of Changchun University, Changchun, China;
16. Xiamen Amoytop Biotech Co. Ltd, Xiamen, China.
*These authors contributed equally to this work.
Received 2014-9-25; Accepted 2014-10-2; Published 2015-1-1
Citation:
Hou FQ, Song LW, Yuan Q, Fang LL, Ge SX, Zhang J, Sheng JF, Xie DY, Shang J, Wu SH, Sun YT, Wei SF, Wang MR, Wan MB, Jia JD, Luo GH, Tang H, Li SC, Niu JQ, Zhou Wd, Sun L, Xia NS, Wang GQ. Quantitative Hepatitis B Core Antibody Level Is a New Predictor for Treatment Response In HBeAg-positive Chronic Hepatitis B Patients Receiving Peginterferon. Theranostics 2015; 5(3):218-226. doi:10.7150/thno.10636. https://www.thno.org/v05p0218.htm
Other stylesAbstract

A recent study revealed that quantitative hepatitis B core antibody (qAnti-HBc) level could serve as a novel marker for predicting treatment response. In the present study, we further investigated the predictive value of qAnti-HBc level in HBeAg-positive patients undergoing PEG-IFN therapy. A total of 140 HBeAg-positive patients who underwent PEG-IFN therapy for 48 weeks and follow-up for 24 weeks were enrolled in this study. Serum samples were taken every 12 weeks post-treatment. The predictive value of the baseline qAnti-HBc level for treatment response was evaluated. Patients were further divided into 2 groups according to the baseline qAnti-HBc level, and the response rate was compared. Additionally, the kinetics of the virological and biochemical parameters were analyzed. Patients who achieved response had a significantly higher baseline qAnti-HBc level (serological response [SR], 4.52±0.36 vs. 4.19±0.58, p=0.001; virological response [VR], 4.53±0.35 vs. 4.22±0.57, p=0.005; combined response [CR], 4.50±0.36 vs. 4.22±0.58, p=0.009)). Baseline qAnti-HBc was the only parameter that was independently correlated with SR (p=0.008), VR (p=0.010) and CR(p=0.019). Patients with baseline qAnti-HBc levels ≥30,000 IU/mL had significantly higher response rates, more HBV DNA suppression, and better hepatitis control in PEG-IFN treatment. In conclusion, qAnti-HBc level may be a novel biomarker for predicting treatment response in HBeAg-positive patients receiving PEG-IFN therapy.
Keywords: quantitative anti-HBc, chronic hepatitis B, PEG-IFN treatment, treatment response prediction, pretreatment biomarker.
Introduction
Chronic hepatitis B virus (HBV) infection affects over 350 million people worldwide and can cause hepatitis, liver cirrhosis (LC), and hepatocellular carcinoma (HCC), resulting in over 1 million deaths per year [1, 2]. PEG-IFN is one of the first-line drugs recommended for HBeAg-positive chronic hepatitis B patients in all international treatment guidelines [3, 4]. However, only a minority of patients (approximately 30%) respond during PEG-IFN therapy [5, 6]. Hence, biomarkers for pre-treatment prediction of therapy response are needed.
Hepatitis B core antibodies (anti-HBc) are classical serological markers for HBV infection [7] and are routinely used in clinical diagnosis or blood screening. Generally, the presence of anti-HBc is considered to be an indicator of both past and persistent HBV infection, typically with lifelong persistence. Because of the limitation of detection technology and a lack of international standardization, little is known about the clinical significance of anti-HBc quantification (qAnti-HBc) levels.
Based on a double-antigen sandwich enzyme-linked immunosorbent assay [8] and standard substance information derived from World Health Organization (WHO) reports [9], it was revealed that the pretreatment qAnti-HBc level is a novel marker for predicting treatment response in both interferon-α and nucleoside analogue therapy cohorts [10]. Because of the small sample size in the interferon-α cohort, these findings required further investigation. In the present study, we validated the predictive value of baseline qAnti-HBc levels in a PEG-IFN treatment cohort.
Patients and Methods
Patients
A total of 205 patients participated in a multicenter, randomized, double-blind, controlled phase II clinical trial in China. This trial is registered with ClinicalTrials.gov, number NCT01143662. Patients were randomly assigned to 1 of 4 different treatment groups to receive Peg-IFN therapy: weekly 90 μg, 135 μg, or 180 μg doses of PegBeron® (Amoytop Biotechnology, Xiamen, Fujian, China) or 180 μg of Pegasys® (Roche, Basel, Switzerland). The therapy duration was 48 weeks, followed by a 24-week observation period. Serum samples were collected every 12 weeks.
A total of 140 patients met the inclusion criteria and were enrolled in this study (Supplementary Material: figure S1). These patients were positive for HBsAg for more than 6 months, were HBeAg positive, had 2 episodes of elevated serum alanine aminotransferase (ALT) levels (>1.5 times the upper limit of the normal range) within 6 months before randomization, and had a serum HBV DNA level >100,000 IU/mL. The following exclusion criteria were applied: failure to follow-up at 72 weeks post-treatment, antiviral or immunosuppressive therapy within the previous 6 months, co-infection with hepatitis A, hepatitis C, hepatitis D, hepatitis E, or human immunodeficiency virus, other acquired or inherited causes of liver disease, preexisting cytopenia, or decompensated liver disease, pregnancy, and alcoholism within 1 year before the treatment. The study was conducted in accordance with the guidelines of the Declaration of Helsinki and the principles of good clinical practice. All patients provided written, informed consent, and the consent forms were approved by the Peking University First Hospital Ethics Committee.
Laboratory measurements
Samples taken at each time point (weeks 0, 12, 24, 48, and 72) were analyzed. The serum qAnti-HBc level was measured using a newly developed double-sandwich immunoassay (Wantai, China) that was calibrated using WHO standards (NIBSC, UK). The HBsAg levels were quantified with the Architect HBsAg assay (Abbott Laboratories; range, 0.05-250 IU/mL). The serum HBV DNA level was measured with the CobasTaqman HBV Kit (Roche Diagnostics; lower limit of quantification, 12 IU/mL). HBeAg and Anti-HBe were detected using an Architect assay (Abbott Laboratories). Aminotransferases were measured according to standard procedures locally at the time of sampling. The HBV genotype was assessed by sequencing.
Definitions
Serological response (SR) was defined as HBeAg seroconversion at 24 weeks post-treatment, virological response (VR) was defined as HBV DNA level <200 IU/mL at 24 weeks post-treatment, and combined response(CR) was defined as HBeAg loss combined with HBV DNA level <2,000 IU/mL at 24 weeks post-treatment[11]..
Statistical analysis
Continuous variables such as HBsAg level, age, HBV DNA, qAnti-HBc, HBeAg, ALT and AST were compared using an unpaired t-test. Categorical variables such as gender, genotype, ALT strata and treatment group were compared using Mantel-Haenszel χ2 test or Fisher's exact test. The association between the baseline parameters and SR, VR and CR was assessed using logistic regression analysis. All variables in univariate analysis were analysed by stepwise multivariate analysis for independent factors associated with response and only significant parameters were finally included in the model. Linear regression models were used for the correlation analysis for qAnti-HBc and other parameters (Pearson's correlation). Generalized estimating equations (GEE) were used for longitudinal data analysis of correlation between ALT and other parameters. Statistical analysis was performed using SPSS (Statistical Package for the Social Sciences) ver. 17.0 software (SPSS, Chicago, IL, USA). All statistical analyses were based on 2-tailed hypothesis tests with a significance level of p<0.05.
Results
SR, VR and CR rates
Forty of the 140 patients (28.6%) achieved SR, 31 patients (22.1%) achieved VR, and 33 patients (23.6%) developed CR. The number of patients who achieved SR, VR and CR were comparable among the 4 treatment groups that received various doses of PegBeron® (90 μg/week, 135 μg/week and 180 μg/week) or 180 μg/week of Pegasys® (SR, 9 of 37 [24.3%], 7 of 33 [21.2%], 10 of 32 [31.3%], and 14 of 38 [36.8%], respectively, p=0.46; VR, 5 of 37 [13.5%], 8 of 33 [24.2%], 7 of 32 [21.9%], and 11 of 38[28.9%], respectively, p=0.44; CR, 7 of 37 [18.9%], 6 of 33 [18.2%], 9 of 32 [28.1%], and 11 of 38[28.9%], respectively, p=0.58). The 4 groups were, therefore, pooled for further analysis. Three of 140 (2.1%) patients achieved HBsAg loss at 24 weeks post-treatment. Those patients received 135 μg/week of PegBeron®, 180 μg/week of PegBeron®, and 180 μg/week of Pegasys®.
Baseline characteristics
The baseline characteristics of the 140 patients are shown in Table 1. Compared to patients without SR, patients who achieved SR had significantly lower HBsAg (3.93±0.50 vs. 4.14±0.55, p=0.038) and HBeAg S/CO values (2.45±0.74 vs. 2.90±0.39, p<0.0001) but had significantly higher qAnti-HBc (4.52±0.36 vs. 4.19±0.58, p=0.001), ALT (242.66±201.97 vs. 162.95±103.77, p=0.003), and AST (142.21±126.31 vs. 89.94±53.67, p<0.001) values. Compared to the patients without VR, the patients who achieved VR had a significantly younger average age (24.10±4.91 years vs. 27.50±7.31 years, p=0.016), and lower HBsAg (3.82±0.59 vs. 4.15±0.51, p=0.002), and HBV DNA (7.36±0.62 vs. 7.78±0.78, p=0.008) levels but significantly higher qAnti-HBc (4.53±0.35 vs. 4.22±0.57, p=0.005), ALT (232.05±152.59 vs. 172.55±137.92, p=0.04), and AST (140.40±98.73 vs. 94.77±77.15, p=0.007) levels. Compared to the patients without CR, the patients who achieved CR had a significantly lower HBsAg (3.84±0.57 vs. 4.15±0.51, p=0.003), HBV DNA (7.36±0.65 vs. 7.78±0.77, p=0.006), and HBeAg S/CO values (2.55±0.66 vs. 2.84±0.49, p=0.009) but significantly higher qAnti-HBc(4.50±0.36 vs. 4.22±0.58, p=0.009), ALT(230.37±149.94 vs. 171.95±138.48, p=0.04), and AST(139.02±94.65 vs. 94.35±78.21, p=0.007) levels.
Table 1
Baseline characteristics of patients according to SR, VR and CR.
| Characteristics | Overall | SR(+) | SR(-) | p | VR(+) | VR(-) | p | CR(+) | CR(-) | p |
|---|---|---|---|---|---|---|---|---|---|---|
| No. | 140 | 40 | 100 | - | 31 | 109 | - | 33 | 107 | - |
| Gender, M/F | 103/37 | 27/13 | 76/24 | 0.40 | 19/12 | 84/25 | 0.11 | 19/14 | 84/23 | 0.024 |
| Age, yrs | 26.75±6.99 | 25.32±6.72 | 27.32±7.04 | 0.13 | 24.10±4.91 | 27.50±7.31 | 0.016 | 24.76±5.83 | 27.36±7.22 | 0.06 |
| HBsAg, Log10 IU/mL | 4.08±0.54 | 3.93±0.50 | 4.14±0.55 | 0.038 | 3.82±0.59 | 4.15±0.51 | 0.003 | 3.84±0.57 | 4.15±0.51 | 0.003 |
| HBV DNA, Log10 IU/mL | 7.68±0.76 | 7.55±0.57 | 7.74±0.82 | 0.19 | 7.36±0.62 | 7.78±0.78 | 0.008 | 7.36±0.65 | 7.78±0.77 | 0.006 |
| HBeAg, Log10 S/CO | 2.77±0.55 | 2.45±0.74 | 2.90±0.39 | <0.001 | 2.66±0.61 | 2.80±0.53 | 0.22 | 2.55±0.66 | 2.84±0.49 | 0.009 |
| Anti-HBc, Log10 IU/mL | 4.29±0.55 | 4.52±0.36 | 4.19±0.58 | 0.001 | 4.53±0.35 | 4.22±0.57 | 0.005 | 4.50±0.36 | 4.22±0.58 | 0.009 |
| HBV genotype, B/C | 51/89 | 16/24 | 35/65 | 0.70 | 13/18 | 38/71 | 0.53 | 12/21 | 39/68 | 1.00 |
| ALT, U/L | 185.72±142.90 | 242.66±201.97 | 162.95±103.77 | 0.003 | 232.05±152.59 | 172.55±137.92 | 0.04 | 230.37±149.94 | 171.95±138.48 | 0.04 |
| ALT strata, ≥/<5ULN | 46/94 | 18/22 | 28/72 | 0.07 | 15/16 | 31/78 | 0.05 | 15/18 | 31/76 | 0.09 |
| AST, U/L | 104.88±84.20 | 142.21±126.31 | 89.94±53.67 | <0.001 | 140.40±98.73 | 94.77±77.15 | 0.007 | 139.02±94.65 | 94.35±78.21 | 0.007 |
| Treatment group*, 1/2/3/4 | 37/33/32/38 | 9/7/10/14 | 28/26/22/24 | 0.46 | 5/8/7/11 | 32/25/25/27 | 0.44 | 7/6/9/11 | 30/27/23/27 | 0.58 |
*1 represented the group with 90μg/week PegBeron® treatment, 2 represented 135μg/week PegBeron®, 3 represented 180μg/week PegBeron® , and 4 represented 180μg/week Pegasys®
Correlation between qAnti-HBc and ALT
The baseline qAnti-HBc levels were positively correlated with the baseline ALT levels (r=0.28, p<0.001, Figure 1A) and at all other time points (r=0.42, p<0.0001, Figure 1B). ALT was the only parameter that correlated with qAnti-HBc during treatment and follow-up (Beta=0.174, p<0.001, Figure 1C).
Correlation between baseline parameters and SR/VR/CR
The univariate analysis indicated that relatively low HBsAg and HBeAg levels and relatively high qAnti-HBc, ALT, and AST levels were associated with increased SR rates, whereas younger age, lower HBsAg level, lower HBV DNA level, higher qAnti-HBc level, ALT >5 ULN, and higher AST levels were associated with higher VR rates, and female, lower HBsAg level, lower HBV DNA level, lower HBeAg level, higher qAnti-HBc level, and higher AST levels were associated with higher CR rates. The multivariate analysis showed that the HBeAg level (1 log10 S/CO increment, OR, 0.280, 95% confidence interval [CI]=0.131-0.600, p=0.001) and the qAnti-HBc level (1 log10 IU/mL increment, OR, 5.732, 95% CI, 1.584-20.743, p=0.008) could independently predict SR, while the HBsAg level (1 log10 IU/mL increment, OR, 0.378, 95% CI, 0.170-0.841, p=0.017; and for CR: OR, 0.40, 95% CI, 0.18-0.86, p=0.019) and qAnti-HBc level (1 log10 IU/mL increment, OR, 6.009, 95% CI, 1.544-23.378, p=0.010; and for CR: OR, 4.56, 95% CI, 1.29-16.19, p=0.019) could independently predict VR and CR (Table 2).
Figure 1
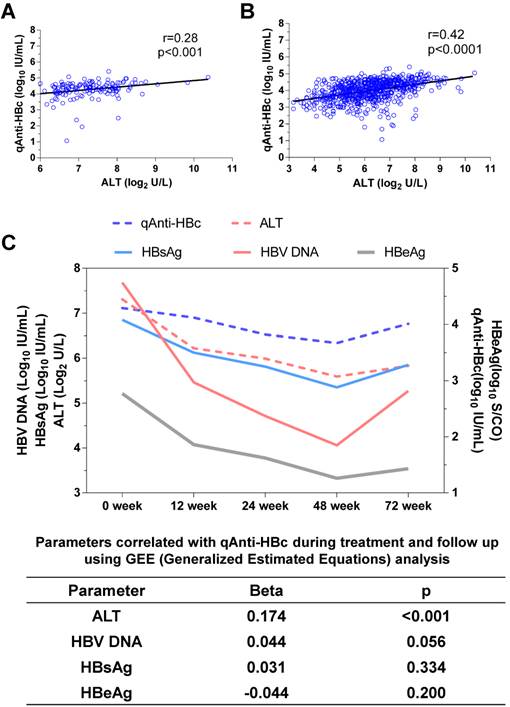
The correlation between qAnti-HBc and ALT. (A) The relationship between ALT and qAnti-HBc level in samples collected at baseline. (B) The relationship between ALT and qAnti-HBc level in samples collected at all the time points including baseline, 12, 24, 48 and 72 week. (C) Changes of qAnti-HBc, ALT, HBsAg, HBeAg and HBV DNA levels during treatment and follow-up, and the relationship between ALT, HBsAg, HBeAg or HBV DNA with qAnti-HBc levels during the longitudinal process using GEE analysis.
Table 2
Univariate and multivariate analysis of baseline parameters with SR, VR and CR.
| Baseline parameters | SR | VR | CR | |||||||||
|---|---|---|---|---|---|---|---|---|---|---|---|---|
| Univariate | Multivariate* | Univariate | Multivariate* | Univariate | Multivariate* | |||||||
| OR(95%CI) | P | OR(95%CI) | P | OR(95%CI) | P | OR(95%CI) | P | OR(95%CI) | P | OR(95%CI) | P | |
| Gender, M/F | 0.66 (0.29-1.47) | 0.305 | - | - | 0.47 (0.20-1.10) | 0.083 | - | - | 0.37 (0.16-0.85) | 0.019 | - | - |
| Age, yrs | 0.96 (0.90-1.01) | 0.130 | - | - | 0.91 (0.85-0.99) | 0.021 | - | - | 0.94 (0.88-1.00) | 0.066 | - | - |
| HBsAg, Log10 IU/mL | 0.49 (0.25-0.97) | 0.041 | - | - | 0.32 (0.15-0.70) | 0.004 | 0.38 (0.17-0.84) | 0.017 | 0.34 (0.16-0.72) | 0.005 | 0.40 (0.18-0.86) | 0.019 |
| HBV DNA, Log10 IU/mL | 0.74 (0.45-1.17) | 0.188 | - | - | 0.50 (0.25-0.85) | 0.011 | - | - | 0.49 (0.29-0.83) | 0.008 | - | - |
| HBeAg, Log10 S/CO | 0.24 (0.11-0.50) | <0.001 | 0.28 (0.13-0.60) | 0.001 | 0.66 (0.34-1.29) | 0.225 | - | - | 0.44 (0.23-0.84) | 0.013 | - | - |
| Anti-HBc, Log10 IU/mL | 7.86 (2.27-27.19) | 0.001 | 5.73 (1.58-20.74) | 0.008 | 7.13 (1.91-26.65) | 0.004 | 6.01 (1.54-23.38) | 0.010 | 5.45 (1.59-18.67) | 0.007 | 4.56 (1.29-16.19) | 0.019 |
| HBV genotype, B/C | 1.24 (0.58-2.63) | 0.579 | - | - | 1.35 (0.60-3.05) | 0.471 | - | - | 1.00 (0.45-2.26) | 0.993 | - | - |
| ALT, U/L | 1.01 (1.00-1.01) | 0.016 | - | - | 1.00 (1.00-1.01) | 0.081 | - | - | 1.00 (1.00-1.01) | 0.08 | - | - |
| ALT strata, ≥/<5ULN | 2.10 (0.98-4.50) | 0.055 | - | - | 2.36 (1.04-5.35) | 0.04 | - | - | 2.04 (0.92-4.56) | 0.081 | - | - |
| AST, U/L | 1.01 (1.00-1.02) | 0.008 | - | - | 1.01 (1.00-1.01) | 0.029 | - | - | 1.01 (1.00-1.01) | 0.028 | - | - |
| Treatment group, 1/2/3/4 | 0.79 (0.57-1.10) | 0.158 | - | - | 0.77 (0.54-1.10) | 0.146 | - | - | 1.25 (0.88-1.76) | 0.211 | ||
*Stepwise multivariate logistic regression model was used to test all the variables and only significant parameters were finally entered.
Predict SR/VR/CR using baseline qAnti-HBc level
The patients with baseline qAnti-HBc levels <5,000 IU/mL, 5,000-10,000 IU/mL, 10,000-30,000 IU/mL, 30,000-50,000 IU/mL, and >50,000 IU/mL had the following SR, VR and CR rates: SR, 7.7%, 18.2%, 21.2%, 41.9%, and 52.6%, respectively; VR, 7.7%, 9.1%, 15.2%, 32.3%, and 47.4%, respectively; CR, 7.7%, 18.2%, 15.2%, 38.7%, and 42.1%, respectively. We evaluated different qAnti-HBc levels such as 5,000, 10,000, 30,000 or 50,000 IU/mL as the cutoff value for predict SR, VR and CR, the 30,000 IU/mL presented the best efficacy and was served as the cutoff value. The patients were divided into 2 groups (HBc-high and HBc-low) based on a baseline qAnti-HBc level ≥ or < 30,000 IU/mL. The 50 HBc-high patients had a 46% chance of achieving SR, which was significantly higher than the 18.9% chance for the 90 HBc-low patients (RR, 2.44, 95% CI, 1.44-4.11, p<0.001, Figure 3A). The HBc-high patients had a 38% chance of achieving VR, which was significantly higher than the 13.3% chance for the HBc-low patients (relative risk [RR], 2.85, 95% CI, 1.51-5.38, p<0.01, Figure 3C). And the HBc-high patients had a 40% chance of achieving CR, which was significantly higher than the 14.4% chance for the HBc-low patients (relative risk [RR], 2.77, 95% CI, 1.51-5.08, p<0.01, Figure 3E). The predictive value of baseline qAnti-HBc level in different baseline ALT strata was further analyzed (Figure 3B, 3D and 3F). The HBc-high patients had higher SR, VR and CR rates than the HBc-low patients, both in patients with ALT ≥5 ULN (SR, 54.5% vs. 25.0%, VR, 54.5% vs. 12.5%, CR, 54.5% vs. 12.5%) and in patients with ALT <5 ULN (SR, 39.3% vs. 16.7%, VR, 25.0% vs. 13.6%, CR, 28.6% vs. 15.2%).
Kinetics of parameters according to different baseline qAnti-HBc levels during treatment and follow-up
The virological and biochemical parameter kinetics were analyzed according to patients with different baseline qAnti-HBc levels. The patients with higher baseline qAnti-HBc (HBc-high) had significantly deeper HBV DNA declines than the patients with lower baseline qAnti-HBc levels (HBc-low) at week 0, 12, 24, 48 and 72(p=0.003, 0.002, 0.048 and <0.001, Figure 4A), and the difference was 1.6 log10 IU/mL at the end of the follow-up. The HBc-high patients had a significantly deeper decline in HBeAg than the HBc-low patients at each time point, except at week 48 (p=0.002, 0.008, 0.09, and 0.007, Figure 4B). The HBc-high patients showed a deeper declines in HBsAg concentration compared to HBc-low patients at each time point, while the difference was not statistically significant (p=0.15, 0.16, 0.27 and 0.15, Figure 4C). The kinetics of qAnti-HBc and ALT had the same trend of a deeper decline observed in HBc-high patients, with the difference gradually increasing insignificance post-treatment (qAnti-HBc, p=0.13, 0.02, <0.001, and <0.0001 at each time point, Figure 4D; ALT, p=0.12, 0.002, 0.001, and <0.0001 at each time point, Figure 4E). Furthermore, the HBc-high patients had a significantly higher ALT normalization rate at the end of the follow-up (58.0% vs. 27.8%, p<0.001, Figure 4F).
Figure 2
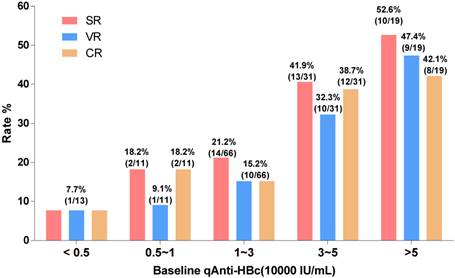
Treatment response rate according to baseline qAnti-HBc level stratus. Patients were divided into 5 groups according to their baseline qAnti-HBc level<5,000, 5,000~10,000, 10,000~30,000, 30,000~50,000 and >50,000IU/mL. SR, VR and CR rate were analyzed in the different groups.
Figure 3
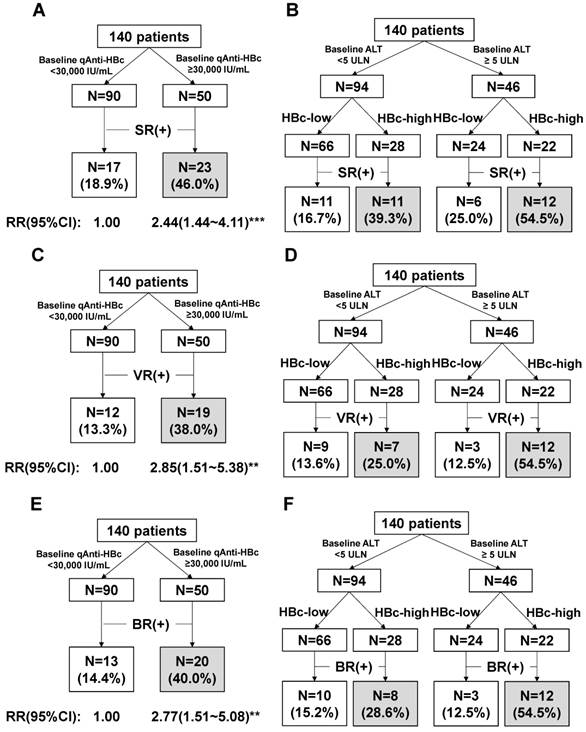
Predict treatment response using the baseline qAnti-HBc level. (A)Prediction of SR using baseline qAnti-HBc level. (B)Prediction of SR using baseline qAnti-HBc level in patients who were classified with baseline ALT strata. (C)Prediction of VR using baseline qAnti-HBc level. (D)Predict VR using baseline qAnti-HBc level in patients who were classified with baseline ALT strata. (E)Prediction of CR using baseline qAnti-HBc level. (F)Predict CR using baseline qAnti-HBc level in patients who were classified with baseline ALT strata. RR, risk ratio; 95% CI, 95% confidence interval. ** indicates p<0.01; ***indicates p<0.001.
Figure 4
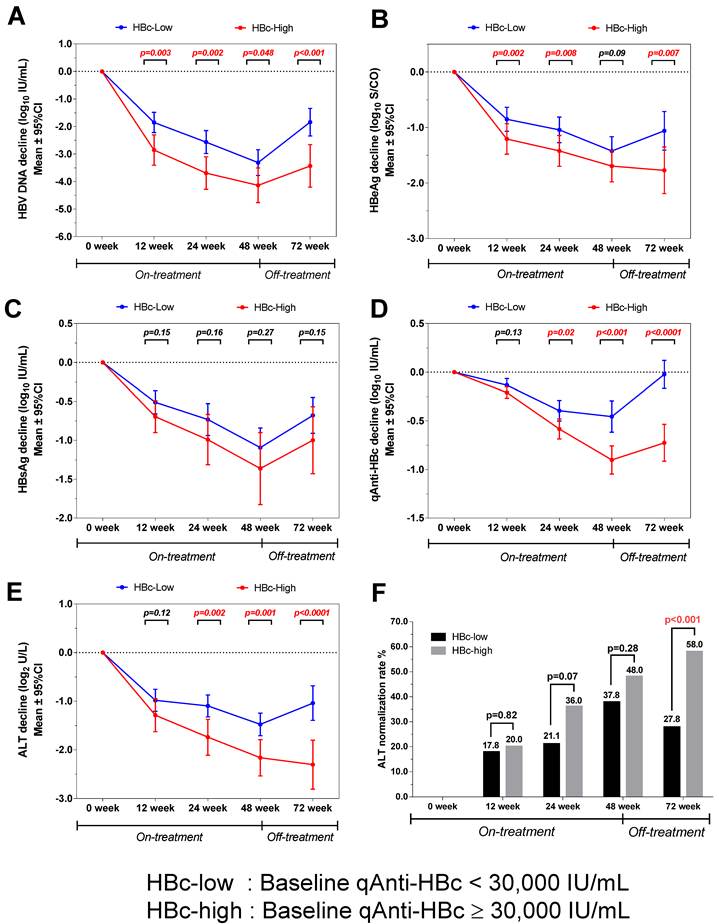
Kinetics of various parameters in patients with different baseline qAnti-HBc levels during treatment and follow-up. (A) HBV DNA, (B) HBeAg, (C) HBsAg, (D) qAnti-HBc, (E) ALT, (F) ALT normalization rates.
Discussion
Our previous work with the quantification of Anti-HBc levels according to natural history of infection and treatment cohorts in chronic hepatitis B (CHB) patients revealed that qAnti-HBc levels are closely correlated with hepatic inflammatory activities and can serve as a new treatment response marker [10]. In the present report, we demonstrated the predictive value of the pretreatment quantification of qAnti-HBc level for treatment response in PEG-IFN therapy.
The qAnti-HBc level was positively correlated with ALT during therapy and follow-up in both the cross-sectional and longitudinal analyses. The results suggested a positive correlation between serum qAnti-HBc level and liver inflammatory activity in cases of CHB, although direct evidence from liver biopsy is required to confirm this result. A possible mechanistic explanation for this association is that native HBcAg particles are released from damaged hepatocytes and provide potent antigenic stimulation to B-cells, thus raising the serum anti-HBc levels. Moreover, massive intrahepatic production of anti-HBcs induced complement-mediated pathogenesis in HBV-associated acute liver failure, suggesting a potential pathogenic role of anti-HBc elevation in chronic hepatitis B. Furthermore, these results were consistent with previous findings that indicated that the qAnti-HBc level may serve as a surrogate marker for the host anti-HBV immune response [12]. Therefore, we hypothesized that patients with higher qAnti-HBc levels may have a higher host immune response, resulting in a higher likelihood of achieving a response during therapy.
HBeAg seroconversion (SR) and HBV DNA suppression (VR) at the end of the post-antiviral therapy follow-up were the 2 major end-points that were associated with favorable outcomes in the HBeAg-positive patients [13, 14]. However, current therapy reportedly achieves SR and VR in fewer than 50% of patients. The patients with SR, VR or CR had a significantly higher baseline qAnti-HBc level compared to the patients without a therapeutic response (p=0.001, 0.005 and 0.009), and baseline qAnti-HBc is the only parameter independently correlated with both SR (OR=5.732, p=0.008) and VR (OR=6.009, p=0.01), and also CR (OR=4.56, p=0.019), with a large OR value in a multivariate analysis. The response rate gradually rose with increasing baseline qAnti-HBc levels (Figure 2), and the HBc-high group had significantly higher SR, VR and CR rates of 46%, 38%, and 40% respectively, while the SR, VR and CR values in the HBc-low group were 18.9%, 13.3%, and 14.4%, respectively (Figure 3A, 3C and 3E). Furthermore, HBV DNA, HBeAg, HBsAg, and ALT were much more suppressed post-treatment in the patients with higher baseline qAnti-HBc levels. Additionally, the ALT normalization rate was much higher in the patients with high baseline qAnti-HBc levels compared with patients with low baseline levels (58.0% vs. 27.8%, respectively, p<0.001) at the end of follow-up. These data demonstrated that the virus was further suppressed, and hepatitis activation was well controlled in patients with higher pretreatment qAnti-HBc levels, identifying the patients who would achieve better treatment effects. By all accounts, patients with high pretreatment qAnti-HBc levels (≥30,000 IU/ml) should be encouraged to receive PEG-IFN therapy, as they are expected to have a relatively high chance of being responsive to therapy.
Note that although baseline ALT ≥5 ULN is a well-known and previously suggested predictive marker for treatment response [15, 16] and that higher ALT levels were associated with higher SR, VR and CR rates in our data, ALT was excluded in the multivariate analysis in correlation with either SR or VR when qAnti-HBc was included. These results indicate that qAnti-HBc levels had better predictive value than ALT for PEG-IFN treatment response, perhaps because elevated ALT is a non-HBV specific indicator for hepatocyte damage. ALT levels can be affected by several factors other than HBV infection in CHB patients, such as non-alcoholic steatohepatitis (NASH) and autoimmune hepatitis. In these scenarios, the ALT levels cannot exactly reflect the cellular immunity against HBV. However, qAnti-HBc is a marker of the HBV-specific humoral immune response, and the anti-HBc titer may, therefore, be more closely associated with the overall immune response against HBV than the ALT level in CHB patients. This hypothesis was further supported by the fact that patients with higher baseline qAnti-HBc achieved a higher response rate regardless of ALT level (Figure 3B, 3D and 3F).
Interestingly, the qAnti-HBc level continuously declined during therapy and rebound during follow-up. This marker declined much more and rebounded much less in the HBc-high group, whereas it rebounded to baseline level in the HBc-low group at the end of the follow-up. This result may indicate a poor improvement in hepatitis activation; however, the mechanism behind this result and its clinical significance require further investigation.
Our study had few limitations, first, we failed to follow-up 38 patients in the cohort and the follow-up rate was 79%. The exclusion of the patients failed to be followed-up may bring bias to this research. Then, our cohort only include patients with genotype B and C, the results in patients with genotype A and D which were prevalent in America and Europe need to be further investigated.
In conclusion, baseline qAnti-HBc may be a novel and efficient marker for predicting treatment response in HBeAg-positive patients who are candidates for PEG-IFN therapy. Patients with relatively high baseline qAnti-HBc levels (≥30,000 IU/ml) experienced much higher viral suppression and hepatitis control during therapy and follow-up and ultimately achieved higher response rate compared to those patients with lower baseline qAnti-HBc levels.
Abbreviations
HBV, hepatitis B virus; ALT, alanine aminotransferase; Anti-HBc, antibodies against hepatitis B core protein; HBsAg, hepatitis B surface antigen; HBeAg, hepatitis B e antigen; ULN, the upper limit of normal; PEG-IFN, peginterferon; CI, confidence interval; SD, standard deviation.
Supplementary Material
Figures S1-S4.
Acknowledgements
We thank for our collaborators: Hao Wang, Tao Han, Shijun Chen, Chibiao Yin, Jie Peng, Deming Tan, Chen Pan, Baosen Li, Qinghua Meng, Longfeng Zhao, Zhen Zhen, Qing Xie, Chengwei Chen, Qin Zhang, Jian Lu, Wei Zhao, Jun Li, Qing Mao, Hong Chen, Qin Ning, Guozhong Gong, Lunli Zhang, Yongping Chen, and Guangfeng Shi. This work was supported by grants from the National Science Fund (30925030 and 81371819), the Technological Major Project (2012ZX10002005, 2011ZX09101-008-06, 2012ZX10002006, 2013ZX10002005), and the Beijing Scientific & Technological Project (D121100003912002).
Competing Interests
Li Sun and Wei-dong Zhou are employees of the Xiamen Amoytop Biotech Co. Ltd. The other authors declare no competing interests.
References
1. Liaw YF, Chu CM. Hepatitis B virus infection. Lancet. 2009;373:582-92
2. Dienstag JL. Hepatitis B virus infection. N Engl J Med. 2008;359:1486-500
3. Lok AS, McMahon BJ. Chronic hepatitis B: update 2009. Hepatology. 2009;50:661-2
4. EASL clinical practice guidelines. Management of chronic hepatitis B virus infection. J Hepatol. 2012;57:167-85
5. Janssen HL, van Zonneveld M, Senturk H, Zeuzem S, Akarca US, Cakaloglu Y. et al. Pegylated interferon alfa-2b alone or in combination with lamivudine for HBeAg-positive chronic hepatitis B: a randomised trial. Lancet. 2005;365:123-9
6. Lau GK, Piratvisuth T, Luo KX, Marcellin P, Thongsawat S, Cooksley G. et al. Peginterferon Alfa-2a, lamivudine, and the combination for HBeAg-positive chronic hepatitis B. N Engl J Med. 2005;352:2682-95
7. Hoofnagle JH, Seeff LB, Bales ZB, Zimmerman HJ. Type B hepatitis after transfusion with blood containing antibody to hepatitis B core antigen. N Engl J Med. 1978;298:1379-83
8. Li A, Yuan Q, Huang Z, Fan J, Guo R, Lou B. et al. Novel double-antigen sandwich immunoassay for human hepatitis B core antibody. Clin Vaccine Immunol: CVI. 2010;17:464-9
9. WHO International Standard: First International Standard for anti-Hepatitis B core antigen, 2008. NIBSC. www.nibsc.ac.uk/documents/fu/95-522.pdf
10. Yuan Q, Song LW, Liu CJ, Li Z, Liu PG, Huang CH. et al. Quantitative hepatitis B core antibody level may help predict treatment response in chronic hepatitis B patients. Gut. 2013;62:182-4
11. Sonneveld MJ, Hansen BE, Piratvisuth T, Jia JD, Zeuzem S, Gane E. et al. Response-guided peginterferon therapy in hepatitis B e antigen-positive chronic hepatitis B using serum hepatitis B surface antigen levels. Hepatology. 2013;58:872-80
12. Farci P, Diaz G, Chen Z, Govindarajan S, Tice A, Agulto L. et al. B cell gene signature with massive intrahepatic production of antibodies to hepatitis B core antigen in hepatitis B virus-associated acute liver failure. Proc Natl Acad Sci U S A. 2010;107:8766-71
13. Liaw YF, Sung JJ, Chow WC, Farrell G, Lee CZ, Yuen H. et al. Lamivudine for patients with chronic hepatitis B and advanced liver disease. N Engl J Med. 2004;351:1521-31
14. van Zonneveld M, Honkoop P, Hansen BE, Niesters HG, Darwish Murad S, de Man RA. et al. Long-term follow-up of alpha-interferon treatment of patients with chronic hepatitis B. Hepatology. 2004;39:804-10
15. Chien RN, Liaw YF, Atkins M. Pretherapy alanine transaminase level as a determinant for hepatitis B e antigen seroconversion during lamivudine therapy in patients with chronic hepatitis B. Asian Hepatitis Lamivudine Trial Group. Hepatology. 1999;30:770-4
16. Yuen MF, Yuan HJ, Hui CK, Wong DK, Wong WM, Chan AO. et al. A large population study of spontaneous HBeAg seroconversion and acute exacerbation of chronic hepatitis B infection: implications for antiviral therapy. Gut. 2003;52:416-9
Author contact
![]() Corresponding authors: Gui-Qiang Wang, No. 8, Xishiku Street, Xicheng District, Beijing 100034, China, E-mail: john131212com; Ning-Shao Xia, National Institute of Diagnostics and Vaccine Development in Infectious Diseases, Xiamen University, China. E-mail: nsxiaedu.cn. Fax: (86)-0592-2181258; Correspondence can also be addressed to: Li Sun, Xiamen Amoytop Biotech Co. Ltd, Xiamen, China. E-mail: sunlicom.
Corresponding authors: Gui-Qiang Wang, No. 8, Xishiku Street, Xicheng District, Beijing 100034, China, E-mail: john131212com; Ning-Shao Xia, National Institute of Diagnostics and Vaccine Development in Infectious Diseases, Xiamen University, China. E-mail: nsxiaedu.cn. Fax: (86)-0592-2181258; Correspondence can also be addressed to: Li Sun, Xiamen Amoytop Biotech Co. Ltd, Xiamen, China. E-mail: sunlicom.
Citation styles
APA
Hou, F.Q., Song, L.W., Yuan, Q., Fang, L.L., Ge, S.X., Zhang, J., Sheng, J.F., Xie, D.Y., Shang, J., Wu, S.H., Sun, Y.T., Wei, S.F., Wang, M.R., Wan, M.B., Jia, J.D., Luo, G.H., Tang, H., Li, S.C., Niu, J.Q., Zhou, W.d., Sun, L., Xia, N.S., Wang, G.Q. (2015). Quantitative Hepatitis B Core Antibody Level Is a New Predictor for Treatment Response In HBeAg-positive Chronic Hepatitis B Patients Receiving Peginterferon. Theranostics, 5(3), 218-226. https://doi.org/10.7150/thno.10636.
ACS
Hou, F.Q.; Song, L.W.; Yuan, Q.; Fang, L.L.; Ge, S.X.; Zhang, J.; Sheng, J.F.; Xie, D.Y.; Shang, J.; Wu, S.H.; Sun, Y.T.; Wei, S.F.; Wang, M.R.; Wan, M.B.; Jia, J.D.; Luo, G.H.; Tang, H.; Li, S.C.; Niu, J.Q.; Zhou, W.d.; Sun, L.; Xia, N.S.; Wang, G.Q. Quantitative Hepatitis B Core Antibody Level Is a New Predictor for Treatment Response In HBeAg-positive Chronic Hepatitis B Patients Receiving Peginterferon. Theranostics 2015, 5 (3), 218-226. DOI: 10.7150/thno.10636.
NLM
Hou FQ, Song LW, Yuan Q, Fang LL, Ge SX, Zhang J, Sheng JF, Xie DY, Shang J, Wu SH, Sun YT, Wei SF, Wang MR, Wan MB, Jia JD, Luo GH, Tang H, Li SC, Niu JQ, Zhou Wd, Sun L, Xia NS, Wang GQ. Quantitative Hepatitis B Core Antibody Level Is a New Predictor for Treatment Response In HBeAg-positive Chronic Hepatitis B Patients Receiving Peginterferon. Theranostics 2015; 5(3):218-226. doi:10.7150/thno.10636. https://www.thno.org/v05p0218.htm
CSE
Hou FQ, Song LW, Yuan Q, Fang LL, Ge SX, Zhang J, Sheng JF, Xie DY, Shang J, Wu SH, Sun YT, Wei SF, Wang MR, Wan MB, Jia JD, Luo GH, Tang H, Li SC, Niu JQ, Zhou Wd, Sun L, Xia NS, Wang GQ. 2015. Quantitative Hepatitis B Core Antibody Level Is a New Predictor for Treatment Response In HBeAg-positive Chronic Hepatitis B Patients Receiving Peginterferon. Theranostics. 5(3):218-226.
This is an open access article distributed under the terms of the Creative Commons Attribution (CC BY-NC) License. See http://ivyspring.com/terms for full terms and conditions.