Theranostics
13.3
Impact Factor
- Current Issue
- Advance Articles
- Volume 16; 2026
- Volume 15; 2025
- Volume 14; 2024
- Volume 13; 2023
- Volume 12; 2022
- Archive
- Cover Images
- Cover Suggestion
- Special Issues
Top
Introduction
Materials and Methods
Results and Discussion
Conclusions
Supplementary Material
Acknowledgements
References
Introduction
Materials and Methods
Results and Discussion
Conclusions
Supplementary Material
Acknowledgements
References
International Journal of Biological Sciences
International Journal of Medical Sciences
 Global reach, higher impact

Theranostics 2015; 5(10):1058-1067. doi:10.7150/thno.11758 This issue Cite
Research Paper
Enzyme-Controlled Intracellular Self-Assembly of 18F Nanoparticles for Enhanced MicroPET Imaging of Tumor
Yaling Liu‡1,3, Qingqing Miao‡2, Pei Zou3, Longfei Liu2, Xiaojing Wang2, Linna An2, Xiaoliu Zhang2, Xiangping Qian4, Shineng Luo ![]() 1,3, Gaolin Liang
1,3, Gaolin Liang ![]() 2
2
1. School of Chemical and Material Engineering, Jiangnan University, 1800 Lihu Road, Wuxi, Jiangsu 214122, China
2. CAS Key Laboratory of Soft Matter Chemistry, Department of Chemistry, University of Science and Technology of China, Hefei, Anhui 230026, China
3. Key Laboratory of Nuclear Medicine, Ministry of Health, Jiangsu Key Laboratory of Molecular Nuclear Medicine, Jiangsu Institute of Nuclear Medicine, Wuxi, Jiangsu 214063, China
4. College of Pharmaceutical Sciences, Soochow University, Suzhou, Jiangsu 215123, China
‡These authors contributed equally.
Received 2015-2-2; Accepted 2015-6-2; Published 2015-6-25
Citation:
Liu Y, Miao Q, Zou P, Liu L, Wang X, An L, Zhang X, Qian X, Luo S, Liang G. Enzyme-Controlled Intracellular Self-Assembly of 18F Nanoparticles for Enhanced MicroPET Imaging of Tumor. Theranostics 2015; 5(10):1058-1067. doi:10.7150/thno.11758. https://www.thno.org/v05p1058.htm
Other stylesAbstract

Herein, we report the development of a new “smart” radioactive probe (i.e., 1) which can undergo furin-controlled condensation and self-assembly of radioactive nanoparticles (i.e., 1-NPs) in tumor cells and its application for enhanced microPET imaging of tumors in nude mice co-injected with its cold analog (i.e., 1-Cold). Furin-controlled condensation of 1-Cold and self-assembly of its nanoparticles (i.e., 1-Cold-NPs) in vitro were validated and characterized with HPLC, mass spectra, SEM, and TEM analyses. Cell uptake studies showed that both 1 and 1-Cold have good cell permeability. TEM images of 1-Cold-treated MDA-MB-468 cells directly uncovered that the intracellular 1-Cold-NPs were at/near the location of furin (i.e., Golgi bodies). MTT results indicated that 50 µM 1-Cold did not impose cytotoxicity to MDA-MB-468 cells up to 12 hours. MicroPET imaging of MDA-MB-468 tumor-bearing mice indicated that mice co-injected with 1 and 1-Cold showed higher uptake and longer attenuation of the radioactivity in tumors than those mice only injected with same dosage of 1. Tumor uptake ratios of 1 between these two groups of mice reached the maximum of 8.2 folds at 240 min post injection. Biodistribution study indicated that the uptake ratios of 1 in kidneys between these two groups continuously increased and reached 81.9 folds at 240 min post injection, suggesting the formation of radioactive NPs (i.e., 1-NPs) in MDA-MB-468 tumors of mice co-injected with 1 and 1-Cold. And the nanoparticles were slowly digested and secreted from the tumors, accumulating in the kidneys. Our ''smart'' probe (i.e., 1), together with the strategy of co-injection, might help researchers trace the biomarkers of interest within a longer time window.
Keywords: self-assembly, nanoparticles, furin, co-injection.
Introduction
To achieve a successful tumor imaging, molecular imagers should design biocompatible probes which can not only overcome the delivery barriers to tumors but also amplify their signals at the targeting sites [1, 2]. Small-molecule-based (SMB) probes can easily translocate cellular membranes via either passive diffusion or electrostatic interaction if they are designed with care [3-5]. However, it is necessary for SMB probes to concentrate at the targets to amplify the signal to noise (S/N) ratio thus to achieve desired contrast for imaging [6-10]. These amplification strategies, which are complicated and difficult to design, include pretargeting [11, 12], avidin-biotin conjugation [13-15], enzymatic reactions [16-18], fluorescence resonance energy transfer (FRET) [19, 20], increasing R1 or R2 at magnetic resonance imaging (MRI) [21-26], and so on. Nanoprobes have emerged as a promising tool for tumor imaging due to their ability of loading as many small molecular probes as needed to yield enough contrast without signal amplification, if they are precisely delivered to the tumor sites [27-36]. Nevertheless, besides the difficulty of their fabrication reproducibility, it is harder for nanoprobes to translocate cell membranes than SMB probes do [37-39]. Thus, naturally, we thought of utilizing a “smart”, controlled intracellular self-assembly system, which starts with SMB probe to translocate cell membrane and ends up with nanoscale probes at the targets, to amplify signals. The “smart” system we employed herein was proposed by Rao and co-workers and has shown promising applications for self-assembling nanostructures, imaging enzyme activities in cells, designing “smart” probes for tumor MRI, enhancing cell uptake of radioactive probes, etc [40-45].
Our design is illustrated in Scheme 1. Briefly, the SMB probe, Acetyl-Arg-Val-Arg-Arg-Cys(StBu)-Lys(18F-FB)-CBT (1), was designed to have these components as following: (1) a RVRR peptide sequence for cell-membrane-translocation and furin (a protease overexpressed in cancer) cleavage; (2) a disulfided Cys for supplying the 1,2-aminothiol group to condense with the cyano group on the 2-cyanobenzothiazole (CBT) motif; (3) a Lys whose side chain is covalently conjugated with 4-18F-fluorobenzoate (18F-FB) for positron emission tomography (PET) imaging. After entering cancer cells, the disulfide bond of the Cys motif of 1 is reduced by the intracellular glutathione (GSH) and subsequently its RVRR motif is cleaved by furin, resulting in the active intermediate 1-Core. Two 1-Cores quickly condense to yield the amphiphilic oligomers (e.g., dimer of 1-Core, 1-Dimer) which self-assemble into nanoparticles (i.e., 1-NPs) via π-π stacking among each other. As-formed 1-NPs could concentrate the radioactivity inside tumor cells, rendering enhanced PET imaging of tumors. Moreover, the big size and the hydrophobic nature of 1-NPs would prevent themselves from being pumped out by the cells, resulting in longer retention time in cells or longer circulation time in vivo, which is also good for tumor imaging. However, before approaching to furin at Golgi bodies, the cyano group of the radioactive probe 1 at very low chemical concentration (7.1 pmol kg-1 for PET imaging in this work) would condense with intracellular Cys, causing its self-condensation and assembly of 1-NPs infeasible. To resolve this, we have demonstrated that co-incubation of the radioactive probe (e.g., 1 herein) with its cold analog (e.g., 1-Cold herein Figure 1) above 25 µM would conquer intracellular Cys and warrant the self-assembly of the radioactive nanoparticles inside cells [44]. In this paper, we designed 1-Cold for the co-injection with 1 into nude mice xenografted with MDA-MB-468 breast tumors that overexpress furin. We found that mice co-injected with 1 and 1-Cold show obviously higher uptake of radioactivity in tissues than those only injected with 1. During the 360 min microPET imaging of mice post injection, tumor uptake ratio between mice of these two groups gradually increased, reaching its maximum of 8.2 folds at 240 min.
Scheme 1
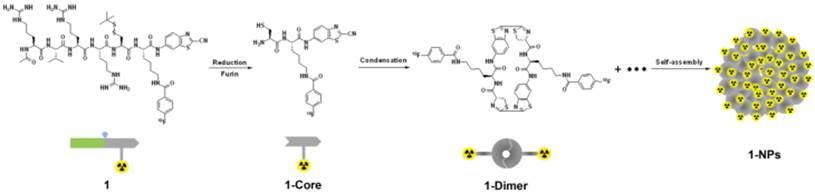
Shematic illustration of a furin-controlled condensation of 1 to assemble radioactive nanoparticles in cancer cells. After entering cancer cells, the disulfide bond of probe 1 is reduced by GSH and the RVRR peptide sequence is cleaved by furin to yield the active intermediate 1-Core. Two 1-Cores condense to yield amphiphilic dimers which self-assemble into 1-NPs at or near the locations of furin (i.e., Golgi bodies) in cancer cells.
Materials and Methods
Materials
All the starting materials were obtained from Adamas or Sangon Biotech. Commercially available reagents were used without further purification, unless noted otherwise. All chemicals were reagent grade or better. Furin was purchased from Biolabs (2,000 U mL-1, one unit (U) corresponds to the amount of furin that releases 1 pmol of methylcoumarinamide (MCA) from the fluorogenic peptide Boc-RVRR-MCA (Bachem) in one minute at 30 °C). 1HNMR spectra were obtained on a 300 MHz Bruker AV 300. MALDI-TOF/TOF and ESI mass spectra were obtained on a time-of-flight Ultrflex II mass spectrometer (Bruker Daltonics) and on a Finnigan LCQ Advantage ion trap mass spectrometer (ThermoFisher Corporation) equipped with a standard ESI source, respectively. High performance liquid chromatography (HPLC) analyses were performed on an Agilent 1200 HPLC system equipped with a G1322A pump and in-line diode array UV detector and a YMC-Pack ODS-AM column with CH3CN (0.1% of TFA) and water (0.1% of TFA) as the eluent. Semipreparative HPLC for radiosyntheses were performed on a Waters preparative chromatography packed with waters 2998 photodiode array detector and Bioscan flow-count equipped with C18 column (5 µm, 10 mm × 250 mm, Wuxi Chrom-matrix Bio-Technology Co., Ltd. China) with CH3CN (0.1% of TFA) and water (0.1% of TFA) as the eluent. Dynamic light scattering (DLS) was measured on a Zeta Sizer Nano Series (Malvern Instruments). Transmission electron micrograph (TEM) images in Figure 2 were obtained on a JEOL 2100 electron microscope, operating at 200 kV. The cryo-dried samples were prepared as following: a copper grid coated with carbon was dipped into the suspension solvent and placed into a vial, which was plunged into liquid nitrogen until no bubbles were apparent. Then water was removed from the frozen specimen by a freeze-drier. TEM images in Figure 3 were obtained on a FEI Techni 12 electron microscope, operating at 120 kV. UV-vis absorbance spectra were recorded on a lambda 25 UV-visible spectrophotometer (PerkinElmer, America) at room temperature. Fluorescence spectra were recorded on a F-4600 fluorescence spectrophotometer (Hitachi High-Technologies Corporation, Japan) with excitation wavelength set to 320 nm. [18F]-fluoride was prepared by medical cyclotron (Sumitomo HM-7, Japan). Micro-PET imaging was performed on an Inveon scanner (Siemens, Germany). The radionuclide activity meter was curiementor-3 (PTW, Germany).
Cell Culture
MDA-MB-468 human breast adenocarcinoma epithelial cells were cultured in Dulbecco's modified eagle medium (GIBCO) supplemented with 10% fetal bovine serum (FBS, GIBCO). The cells were expanded in tissue culture dishes and kept in a humidified atmosphere of 5% CO2 at 37 °C. The medium was changed every other day.
Western Blot
MDA-MB-468 cells were cultured on a 10-cm dish, then washed with cold PBS for three times and harvested in 1.5 mL eppendorf tubes, followed by centrifugation at 3,000 rpm and 4 °C for 10 min. The supernatants were removed and the cell samples were treated with radioimmunoprecipitation assay (RIPA) lysis buffer containing 4% protease inhibitor (Roche). Cells in the mixture were broken by Sonifier cell disruptor (200 W, 6 s) and lysed for 3 min on ice. Cell extracts were clarified by centrifugation at 12,000 rpm and 4 °C for 15 min, and then mixed with SDS sample buffer for denaturation at 100 °C for 5 min. Proteins were separated by sodium dodecyl sulfate polyacrylamide gel electrophoresis (SDS-PAGE) and transferred to Immun-Blot with NC (nitrocellulose) membrane. Western blotting was carried out using anti-furin (1:1000, Sigma Aldrich) or β-actin (1:5000, Cell Signaling Technology) at 4 °C overnight and horse radish peroxidase (HRP)-conjugated secondary antibodies at room temperature for 1 h. All antibodies were used in 5% skim milk (BD Bioscience).
Cell Imaging
MDA-MB-468 human breast adenocarcinoma epithelial cells (3 × 10⁶) were incubated with 100 µM 1-Cold at 37 °C for 0.5 h. The cells were washed with PBS for three times, imaged under an Olympus IX71 Inverted optical fluorescence microscopy, and presented in Figure 3.
Furin Immunofluorescence Staining
MDA-MB-468 cells were plated on glass coverslips in 24-well plates at 50% cell density the next day. After the medium was removed and the cells were washed for 3 times with PBS, cells were incubated with 1-Cold at 100 μM for 1 h, washed for three times with PBS, fixed with 4% paraformaldehyde at room temperature for 30 min. Subsequently, fixed cells were washed for 3 times with PBS and permeabilized with 1% Triton X-100/PBS for 20 min, followed by blocking with 10% goat serum solution in PBS for 30 min at room temperature. After blocking, cells were incubated with primary antibody (1:200, antifurin rabbit polyclonal antibody (Sigma)) for 1 h at 37 °C. After washing for three times with PBS, cells were incubated with secondary antibody (1: 200, goat polyclonal antirabbit IgG rhodamine conjugate) for 1 h at 37 °C. After being washed with PBS for three times and distilled water once, the final samples were mounted on a glass slide. Images were acquired using a Leica TCS SP5 microscope equipped with a 63× objective.
Cell Uptake
MDA-MB-468 cells were seeded in 6-well plates for 6 h at a number of 600,000 for each well. After that, the medium was replaced with fresh medium containing 1 µCi of 1 for each well. At 5, 10, 20, 30, 60, and 90 min, cells and medium were harvested for counting the radioactivity by a γ-counter.
Cellular Efflux Titration
MDA-MB-468 cells in 6-well plates at a number of 1 million for each well were incubated with 4 μCi of 1 and 1-Cold at 0, 5, 25, 50 μM at 37 °C, respectively. After 1 hour incubation, the medium was replaced with fresh medium and the efflux starts as time 0 min. At 5, 10, 20, 30, 60, 90 and 120 min, the medium was changed and the radioactivity of the old medium was counted. At 120 min, the cells were also harvested for counting the radioactivity and calculating the total radioactivity at time 0.
Electron Microscopic Imaging of Cells
MDA-MB-468 cells were incubated with 1-Cold at 100 µM for 8 h, washed for three times with phosphate-buffered saline (PBS), fixed with 2.5% glutaraldehyde at room temperature for 30 min. The cells were then detached from culture dishes, centrifuged (300 rpm, 15 min) and washed with PBS for further three times, and then stained with 1% OsO4 in double-distilled water for 1.5 h. Then the cells were dehydrated in ethanol and embedded in Epon. Thin sections (80 nm) were cut and mounted on copper grids, stained with saturated solution of uranyl acetate and lead citrate for electron microscope observation.
MTT Assay
The cytotoxicity was measured using the 3-(4, 5-dimethylthiazol-2-yl)-2, 5-diphenyltetrazolium bromide (MTT) assay with MDA-MB-468 cells. Cells growing in log phase were seeded into 96-well cell culture plate at 3 × 10³/well. The cells were incubated for 12 h at 37 oC under 5% CO2. The solutions of 1-Cold (100 µL/well) at concentrations of 25, 50 or 100 µM in medium were added to the wells, respectively. The cells were incubated for 3, 6 and 12 h at 37 °C under 5% CO2. A solution of 5 mg/mL MTT dissolved in phosphate buffered saline (PBS) (pH 7.4) (10 µL /well) was added to each well of the 96-well plate. A solution of 10% SDS/phosphate buffered saline (PBS) (pH 7.4) (100 µL/well) was added to dissolve the formazan after an additional 4 hour incubation. The data were obtained using an ELISA reader (VARIOSKAN FLASH) to detect its absorption at 570/680 nm. The following formula was used to calculate the viability of cell growth: Viability (%) = (mean of Absorbance value of treatment group/mean of Absorbance value of control) × 100.
Radiolabeling of 2
18F-SFB (20 µL, 5 mCi) was added into the 150 µL solution of 2 (100 µg, 90 nmol) dissolved in phosphate buffered saline (PBS) at pH 7.2, stirred at 50 °C for 0.5 h. Then the reaction mixture was injected into the radio-HPLC for purification and analysis. the HPLC peak at 15.9 min on the raio-HPLC trace, which has a same retention time to that of 1-Cold, was collected and dried at 100 °C by N2 to remove the acetonitrile as 1 with 50% radiochemical yield (RCY) (decay-corrected to the end of synthesis).
In Vivo MicroPET Scans
Female BALB/c nude mice of 4-8 weeks old were bought from Shanghai Silaike Experimental Animals Corporation. All animals received care in compliance with the guidelines outlined in the Guide for the Care and Use of Laboratory Animals. The procedures were approved by the Jiangsu Institute of Nuclear Medicine Animal Care and Use Committee. MDA-MB-468 tumor lesions were established by subcutaneous foreleg injection of 4 × 10⁷ tumor cells in 100 µL PBS for each mouse. Visible tumors were normally observed 4 - 6 weeks after injection. The tumor-xenografted mice immobilized by isoflurane anaesthesia were then subjected randomly into two groups for tail vein injections of 1 or co-injections of 1 with 1-Cold (injection dose for each mouse: 1 at 85 µCi and 1-Cold at 20 µmol/kg). Ten-minute static PET images were acquired at 10 min, 30 min, 1 h, 2 h, 4 h and 6 h post-injection. The image reconstruction was done by the 3-dimensional ordered subsets expectation maximum (3D OSEM) algorithm without attenuation or scatter correction. Regions of interest (ROIs) over the tumor and major organs were drawn on decay-corrected whole-body coronal images using vendor software (ASI Pro 6.7.1.1) for each microPET scan. The radioactivity concentration (accumulation) within a tumor or an organ was obtained from mean pixel values within the multiple ROI volume, which had been converted to MBq/mL/min by using a conversion factor. The conversion to MBq/g/min assumed a tissue density of 1 g/mL. Imaging ROI-derived % ID/g was calculated by dividing the ROIs by the administered activity.
Results and Discussion
Syntheses and Rationale of the Design
We began the study with the syntheses of the precursor 2 for 1, and 1-Cold for the demonstration of furin-controlled condensation and self-assembly of nanoparticles in vitro and in vivo (Figure 1 and Supplementary Material). The syntheses are facile and straightforward. Briefly, peptide sequence Ac-Arg-Val-Arg-Arg-Cys(StBu)-Lys-OH (A) with protection groups was synthesized with solid phase peptide synthesis (SPPS), then coupled with CBT, purified with HPLC to yield B (Scheme S1). Deprotection of B yields 2 after HPLC purification. N-succinimidyl-4-fluorobenzoate (SFB) was synthesized according to the literature [46]. Coupling of 2 with SFB at pH 8.5 and room temperature for 6 h yields 1-Cold after HPLC purification with good yield (70%). 18F-SFB was also synthesized according to the literature [47], purified with a C18 Sep-Pak Cartridge. Labeling of 2 with 18F-SFB at pH 7.2 and 50 °C for 0.5 h yields 1 after HPLC purification.
Furin-controlled Condensation of 1-Cold and Self-assembly of 1-Cold-NPs, and Nanocharacterizations
To validate furin-controlled condensation and self-assembly, we used 1-Cold for the in vitro study. As shown in Figure 2a, after 4 h incubation of 1-Cold at 100 µM and 37 °C with 1 nmol/U of furin, we directly injected the incubation mixture into a HPLC system and collected the peaks for matrix-assisted laser desorption/ionization (MALDI) mass spectroscopic analysis. Peak on HPLC trace at retention time of 38.9 min was identified as the condensation product of 1-Cold after furin cleavage (i.e., 1-Cold-Dimer, Figure 2a and Supplementary Material: Figure S9). Time course HPLC analysis of furin cleavage indicated that, at this condition, furin-controlled condensation of 1-Cold was accomplished in 2 h and the products (i.e., 1-Cold-Dimer) are stable until 8 h (Supplementary Material: Figure S9). This suggests that 1-Cold has an average speed of furin cleavage (8.3 pmol/U per minute) at 37 °C, much faster than that of commercial substrate Boc-RVRR-AMC (Bachem, 1 pmol/U per min) at 30 °C. Using HPLC and fluorescence spectroscopic analyses, we calculated the enzymatic Michaelis-Menten constants (KM) of furin towards 1-Cold and Boc-RVRR-AMC to be 242 µM and 99 µM, respectively (Supplementary Material: Figure S10). This indicated that the binding affinity of 1-Cold to furin was 2.4-fold-lower than that of Boc-RVRR-AMC. However, the calculated Kcat and Kcat/KM values of furin towards 1-Cold were 35 times and 15 times of those of Boc-RVRR-AMC (Supplementary Material: Figure S10), respectively, echoing that furin cleaves 1-Cold faster than Boc-RVRR-AMC. UV-vis spectra at 500-700 nm of the incubation mixture at 4 h showed an obvious increase of absorption compared with that before incubation, suggesting the aggregation of nanoparticles (Supplementary Material: Figure S11). Directly taking the above dispersion for scanning electron microscope (SEM) and transmission electron microscope (TEM) observation, we found that the nanoparticles have an average diameter of 182 ± 70 nm under TEM (Figure 2c) and an average diameter of 207 ± 99 nm under SEM (Figure 2b).
Figure 1
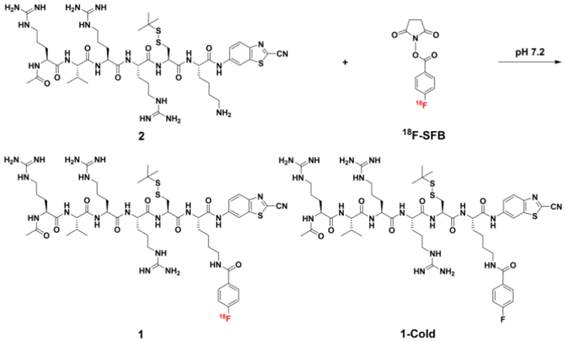
Chemical structures of 1 and 1-Cold for furin-controlled condensation and self-assembly of nanoparticles, and synthetic route for 1.
Figure 2
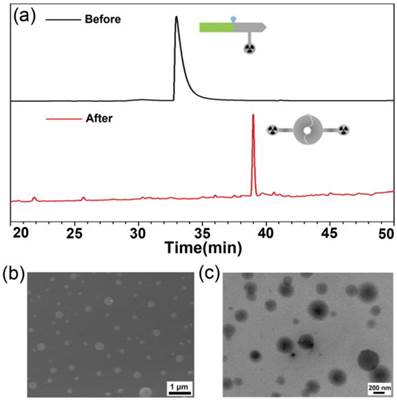
(a) HPLC trace of the incubation mixture of 1-Cold at 100 µM after 4 h incubation with 1 nmol/U of furin at 37 °C (bottom), and HPLC trace of 1-Cold in water (top). (b) SEM images of the nanoparticles in the incubation mixture of 1-Cold at 100 µM after 4 h incubation with 1 nmol/U of furin at 37 °C. (c) TEM images of the nanoparticles in the incubation mixture of 1-Cold at 100 µM after 4 h incubation with 1 nmol/U of furin at 37 °C.
Cell Permeability of 1 and 1-Cold, Intracellular Self-Assembly of 1-Cold-NPs, and Biocompatibility Study of 1-Cold
After the validation of furin-controlled condensation and self-assembly, we studied the cell permeability of 1 and 1-Cold, as well as the biocompatibility of 1-Cold. Cell permeability study of 1 was conducted by incubating the probe with MDA-MB-468 cells and quantitating its cellular uptake by counting the radioactivity with a γ-counter. Cell permeability of 1-Cold was evaluated by directly taking the fluorescence images of the cells incubated with the probe, since 1-Cold has a strong fluorescence emission at 450 nm after furin-controlled condensation in cells. Before applying 1 or 1-Cold for the cellular experiments, we tested the expression level of furin in human breast cancer cell line MDA-MB-468 with western blot. Human colon carcinoma LoVo cells were chosen as control cell lines because they are reported to be furin-deficient [48]. The results showed that MDA-MB-468 cells have a positive signal for furin (31.2% of β-actin) while very weak signal of furin (10.4% of β-actin) was detected in LoVo cells (Supplementary Material: Figure S12). As shown in Figure 3b, cellular uptake of 1 rapidly approached its plateaus at 30 min (20.4% of total radioactivity) and reached its maximum of 22.2% at 60 min, suggesting that 1 could be quickly and efficiently uptaken by the MDA-MB-468 cells. For the MDA-MB-468 cells incubated with 100 µM 1-Cold at 37 °C for 0.5 h, strong fluorescence emissions inside the cells were clearly observed, suggesting the good cell permeability of 1-Cold. To determine the localization of the condensation products of 1-Cold, we incubated 100 µM 1-Cold with the cells at 37 °C for 1 h and then immunofluorescence staining of furin in the cells was conducted using rhodamine-labelled secondary antibody. An overlay of the fluorescence image of the condensation products of 1-Cold with that of furin staining clearly shows that the condensation products of 1-Cold are actually at or near the localizations of furin (i.e., Golgi bodies) (Supplementary Material: Figure S13). To directly validate the formation of 1-Cold-NPs in MDA-MB-468 cells, we incubated the cells with 100 µM 1-Cold for 8 h and sliced the cells for electron microscope (EM) observation. As shown in Figure 3c-d, clearly we found that the intracellular nanoparticles of 1-Cold (i.e., 1-Cold-NPs) were near/at Golgi bodies where the furin enzyme was activated. After that, we studied the biocompatibility of 1-Cold. 3-(4,5-dimethylthiazol-2-yl) 2,5-diphenyltetrazolium bromide (MTT) assay indicated, after being incubated with 1-Cold at 25 µM, 50 µM, or 100 µM for 3 h, 110%, 103%, or 87% of the MDA-MB-468 cells survived respectively (Supplementary Material: Figure S14). When the cells were incubated with 25 µM, 50 µM, or 100 µM 1-Cold for 12 h, 98%, 105% or 68% of the cells survived respectively, suggesting 1-Cold is nontoxic to the cells until 12 h.
Figure 3
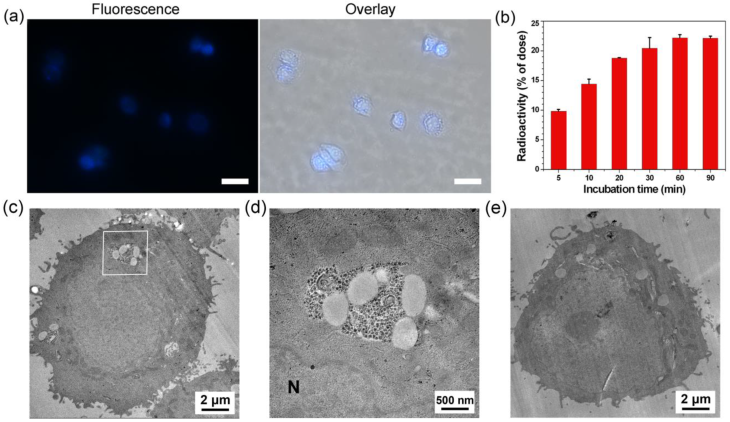
(a) Left: Fluorescence image (DAPI channel) of MDA-MB-468 cells after incubation with 100 µM of 1-Cold at 37 °C for 0.5 h. Right: overlay of differential interference contrast (DIC) with fluorescence images. Scale bars: 20 µm. (b) Time course of cellular uptake of 1 on MDA-MB-468 cells. 600,000 cells were incubated with 1 µCi of 1. At each time point, cells were harvested to count the radioactivity using a γ-counter. (c) Electron microscopic image of MDA-MB-468 cells after incubation with 100 μM 1-Cold for 8 h. (d) High magnification electron microscopic image of the square area in c. Large area of clustered 1-Cold-NPs were found at/near Golgi bodies. N: nucleus. (e) Electron microscopic image of MDA-MB-468 cells.
Figure 4
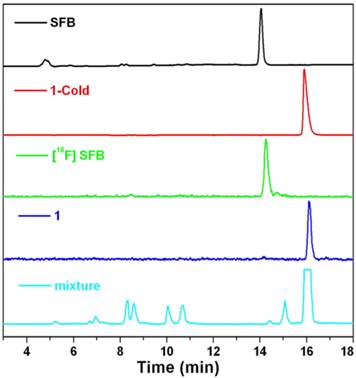
HPLC traces of SFB (black, absorbance at 254 nm), 1-Cold (red, absorbance at 320 nm), 18F-SFB (green, radiochromatograph), 1 (blue, radiochromatograph), and reaction mixture of 1 (cyan, radiochromatograph), respectively.
Radiolabeling
To ensure a successful radio-synthesis of 1, we used a radio-HPLC equipped with a UV-vis detector and a γ-counter to monitor the reaction. In detail, 18F-SFB was synthesized according to the literature and purified with a C18 Sep-Pak cartridge. Compared with SFB which has a retention time of 14.1 min on the HPLC chromatograph, purified 18F-SFB has a retention time of 14.2 min and radiochemical purity more than 90% (Figure 4). After that, 18F-SFB (20 µL, 5 mCi) was added into the solution of 2 (100 µg, 90 nmol) dissolved in 150 µL phosphate buffered saline (PBS) at pH 7.2, heated at 50 °C for 0.5 h. Then the reaction mixture was injected into the radio-HPLC for purification and analysis. As shown in Figure 4, the flatheaded HPLC peak at 15.9 min on the radio-HPLC trace, which has a same retention time to that of 1-Cold, was collected and purified as 1 with 50% radiochemical yield (RCY) (decay-corrected to the end of synthesis, EOS) and specific radioactivity of 0.6 ± 0.4 Ci µmol-1 (EOS). The amount of unreacted 18F-SFB in the mixture, which has a retention time of 14.4 min, was very tiny. Stability study indicated that 1 was stable in fetal bovine serum at 37 °C up to 5 h (97.7%) (Supplementary Material: Figure S15).
Figure 5
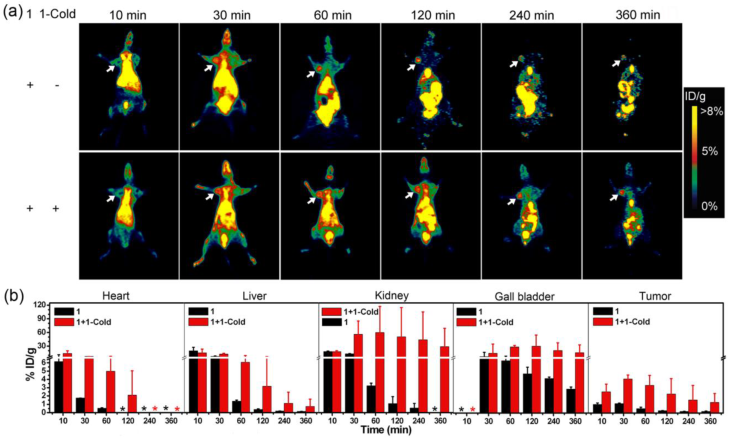
(a) Representative whole body coronal microPET images of mice with subcutaneously xenografted MDA-MB-468 tumors at different time points post intravenous injections of 85 µCi 1 (top) or 85 µCi 1 with 20 µmol/kg 1-Cold (bottom) via tail veins. Tumors are indicated by white arrows. (b) Time-course uptake of 1 in heart, liver, kidney, gall bladder, and MDA-MB-468 tumor derived from PET quantification (%ID/g, n = 4 for each group). Tissue radioactivity is expressed as the percentage of injected dose per gram of tissue (%ID/g). *: Not detectable.
MicroPET Imaging of MDA-MB-468 Tumor Xenografts in Mice
After validating overexpression of furin in MDA-MB-468 breast cancer cells by western blotting, our next plan was to use MDA-MB-468 tumor xenografts to demonstrate the furin-controlled intracellular self-assembly of 1-NPs in vivo for an enhanced microPET imaging of tumors in mice. As aforementioned, to ensure the feasibility of intracellular self-assembly of 1 into 1-NPs, co-injection of 1-Cold with 1 into mice to conquer intracellular Cys is a must. To characterize the concentration effect of 1-Cold on the self-assembly of 1-NPs, we did cellular efflux titration on MDA-MB-468 cells pre-incubated with 4 μCi of 1 and 1-Cold at 0, 5, 25, or 50 μM and 37 °C, respectively. The results indicated that 120 min after cell efflux, cells incubated with 1 alone have 13.1 ± 1.2% of initial radioactivity retained while those cells co-incubated with 5, 25, or 50 μM 1-Cold have 20.3 ± 4.2%, 28.5 ± 1.4%, or 32.1 ± 0.9% of initial radioactivity retained, respectively (Supplementary Material: Figure S16). Therefore, in this study, MDA-MB-468 tumor-bearing nude mice were each co-injected with 85 µCi of 1 and 20 µmol/kg 1-Cold via tail vein for microPET scans. Those tumor-bearing nude mice only injected with the same dosage of 1 were studied in parallel. Before microPET imaging, we conducted pharmacokinetic study of 1 in mice after intravenous (i.v.) administration at about 3.0 mCi/kg. The profiles of mean plasma concentration of 1 vs. time were best fitted to a two-compartment model (R2 = 0.957). The blood circulation half-time (t1/2) was estimated to be 86.1 min (t1/2α = 1.4 min, t1/2β = 84.7 min). The mean AUC0-t value was 452.2 min mCi L-1, CLtot was 0.006 L min-1 kg-1, Vd was 1.042 L kg-1, and Cmax was 7.471 mCi L-1, respectively (Supplementary Material: Figure S17). These data indicate that clearance of 1 in mouse is relatively slow. From the preliminary results of radiolabeling and pharmacokinetic study, we could calculate that the co-injection dose of 1-Cold (i.e., 20 µmol/kg) could result in Cmax of 49.8 µM of 1-Cold in blood, which is obviously higher than the concentration for self-assembling 1-NPs (i.e., 25 µM). The microPET imaging results are shown in Figure 5a. Coronal microPET imaging of mice showed that MDA-MB-468 tumors in the mice co-injected with 1 and 1-Cold were clearly visualized with good tumor-to-background contrast from 30 to 360 min (bottom panels of Figure 5a). Interestingly, tumors in those mice that only injected with 1 also could be visualized at 30 min and 60 min post injection but their PET images attenuated very fast after 60 min (top panels of Figure 5a). These results suggested that the radioactive probe 1 has a good tumor uptake enough for tumor PET imaging but co-injection of 1 with 1-Cold results in better uptake and longer attenuation of the radioactivity in tumor. Quantitative analysis of radioactivity values of tumor PET images showed that mice co-injected with 1 and 1-Cold had tumor uptake of radioactivity significantly higher than that of mice only injected with 1 at all time points studied (Supplementary Material: Table S4). At time points of 10, 30, 60, 120, 240, 360 min post injection, mice co-injected with 1 and 1-Cold had tumor uptake of 2.52 ± 0.95%, 4.08 ± 0.48%, 3.31 ± 1.22%, 2.27 ± 1.86%, 1.55 ± 1.75%, 1.28 ± 1.07% ID/g of 1, respectively. For mice only injected with 1, they had tumor uptake of 1.02 ± 0.19%, 1.12 ± 0.08%, 0.52 ± 0.18%, 0.28 ± 0.02%, 0.19 ± 0.03%, and 0.19 ± 0.05% ID/g of 1 at these time points respectively (Supplementary Material: Table S4). Quantitative results showed that tumor uptake ratios between these two groups of mice are 2.5 (at 10 min), 3.6 (at 30 min), 6.4 (at 60 min), 7.9 (at 120 min), 8.2 (at 240 min), 6.5 (at 360 min), respectively (Figure 5b, and Supplementary Material: Table S4). These results indicated that co-injection of 1 with 1-Cold is obviously better than 1 alone for microPET imaging of MDA-MB-468 tumors, suggesting that 1-Cold helps the furin-controlled intracellular condensation and self-assembly of 1 into 18F-NPs (i.e., 1-NPs) in tumors.
After validating that co-injection of 1 with 1-Cold enhances the microPET imaging of MDA-MB-468 tumors in mice, we also investigated the biodistribution of 1 in MDA-MB-468 tumor-xenografted nude mice at 10, 30, 60, 120, 240, or 360 min post injection of 1 with 1-Cold or 1 alone. As shown in Figure 5b, mice co-injected with 1 and 1-Cold exhibited higher uptake of 1 than those only injected with 1 in all organs at all the time points studied, suggesting the formation of 1-NPs in the tumors and the NPs were slowly digested, degraded, and secreted into these organs. In detail, all the mice showed high uptake of 1 in liver and heart in 30 minutes and rapid clearance of 1 after 60 min. As for kidney and gall bladder, mice injected with 1 showed relatively rapider clearance of 1 in these organs than those co-injected with 1 and 1-Cold. Interestingly, the uptake ratios of 1 in gall bladders between mice co-injected with 1 and 1-Cold and those injected with 1 at the time points studied are similar to those in tumors between these two group of mice (Supplementary Material: Table S4). However, the uptake ratios of 1 in kidneys between these two groups continuously increased, reaching 81.9 folds at 240 min post injection (Supplementary Material: Table S4). This might hint the formation of radioactive NPs in tumors of mice co-injected with 1 and 1-Cold, and the NPs were slowly dissembled (or digested) into smaller nanoparticles and secreted from the tumors, trapping in the kidneys since glomerular filtration in the kidney is controlled by similar effective pore sizes, and renal excretion is a strong function of hydrodynamic diameter [49]. The biodistribution data, together with the microPET imaging results suggest that it is the furin-controlled self-assembly of 1-NPs in MDA-MB-468 tumor-bearing mice co-injected with 1 and 1-Cold that greatly enhance the microPET imaging of the tumors.
Conclusions
In conclusion, taking advantage of a biocompatible condensation reaction and the strategy of co-injection, we have successfully developed a new “smart” radioactive probe (i.e., 1) which self-assembles into radioactive nanoparticles with its cold analog (i.e., 1-Cold) in cancer cells for enhanced microPET imaging of tumors in nude mice. The enzyme that we employed herein to control the intracellular condensation and self-assembly of 1 or 1-Cold is furin, one of the trans-Glogi proteases which is overexpressed in some cancer cells (e.g., breast cancer cell MDA-MB-468). After the validations of furin-controlled self-assembly of 1-Cold-NPs in vitro with 1-Cold, good cell permeability of 1 and 1-Cold, biocompatibility of 1-Cold, we conducted the microPET imaging of MDA-MB-468 tumors in mice co-injected with 1 and 1-Cold and in mice injected with 1 alone. The results indicated that mice co-injected with 1 and 1-Cold showed higher uptake and longer attenuation of the radioactivity in tumors than those mice only injected with same dosage of 1. Tumor uptake ratios of 1 between these two groups of mice reached the maximum of 8.2 folds at 240 min post injection. Biodistribution studies indicated that the uptake ratios of 1 in kidneys between these two groups continuously increased and reached 81.9 folds at 240 min post injection, suggesting the formation of radioactive NPs (i.e., 1-NPs) in MDA-MB-468 tumors of mice co-injected with 1 and 1-Cold. And the nanoparticles were slowly disassembled (or digested) into smaller nanoparticles and secreted from the tumors, trapping in the kidneys. Encouraged by these exciting results above, we envisioned that our ''smart'' probe (i.e., 1), together with the strategy of co-injection, might help researchers trace the biomarkers of interest within a longer time window.
Supplementary Material
Synthetic routes; Figure S1-17 and Tables S1-4.
Acknowledgements
This work was supported by Collaborative Innovation Center of Suzhou Nano Science and Technology, the Major Program of Development Foundation of Hefei Center for Physical Science and Technology, and the National Natural Science Foundation of China (Grants 21175122 and 21375121).
Competing Interests
The authors declare no competing financial interest.
References
1. Weissleder R, Mahmood U. Molecular imaging. Radiology. 2001;219:316-33
2. Huang XL, Zhang F, Wang H, Niu G, Choi KY, Swierczewska M. et al. Mesenchymal stem cell-based cell engineering with multifunctional mesoporous silica nanoparticles for tumor delivery. Biomaterials. 2013;34:1772-80
3. Hinshaw JE, Carragher BO, Milligan RA. Architecture and Design of the Nuclear-Pore Complex. Cell. 1992;69:1133-41
4. Derfus AM, Chan WCW, Bhatia SN. Intracellular delivery of quantum dots for live cell labeling and organelle tracking. Adv Mater. 2004;16:961-6
5. Joliot A, Prochiantz A. Transduction peptides: from technology to physiology. Nat Cell Biol. 2004;6:189-96
6. Kircher MF, Gambhir SS, Grimm J. Noninvasive cell-tracking methods. Nat Rev Clin Oncol. 2011;8:677-88
7. Weissleder R. Molecular imaging in cancer. Science. 2006;312:1168-71
8. Liu SL, Liu HG, Ren G, Kimura RH, Cochran JR, Cheng Z. PET Imaging of Integrin Positive Tumors Using F-18 Labeled Knottin Peptides. Theranostics. 2011;1:403-12
9. Orbay H, Hong H, Zhang Y, Cai WB. Positron Emission Tomography Imaging of Atherosclerosis. Theranostics. 2013;3:894-902
10. Wu CX, Yue XY, Lang LX, Kiesewetter DO, Li F, Zhu ZH. et al. Longitudinal PET Imaging of Muscular Inflammation Using F-18-DPA-714 and F-18-Alfatide II and Differentiation with Tumors. Theranostics. 2014;4:546-55
11. Devaraj NK, Upadhyay R, Hatin JB, Hilderbrand SA, Weissleder R. Fast and Sensitive Pretargeted Labeling of Cancer Cells through a Tetrazine/trans-Cyclooctene Cycloaddition. Angew Chem Int Ed. 2009;48:7013-6
12. Kim HJ, Eichinger A, Skerra A. High-Affinity Recognition of Lanthanide (III) Chelate Complexes by a Reprogrammed Human Lipocalin 2. J Am Chem Soc. 2009;131:3565-76
13. Xu H, Regino CAS, Koyama Y, Hama Y, Gunn AJ, Bernardo M. et al. Preparation and preliminary evaluation of a biotin-targeted, lectin-targeted dendrimer-based probe for dual-modality magnetic resonance and fluorescence Imaging. Bioconjugate Chem. 2007;18:1474-82
14. Mishra A, Pfeuffer J, Mishra R, Engelmann J, Mishra AK, Ugurbil K. et al. A new class of Gd-based DO3A-ethylamine-derived targeted contrast agents for MR and optical imaging. Bioconjugate Chem. 2006;17:773-80
15. Hussey SL, Peterson BR. Efficient delivery of streptavidin to mammalian cells: Clathrin-mediated endocytosis regulated by a synthetic ligand. J Am Chem Soc. 2002;124:6265-73
16. Weissleder R. Scaling down imaging: Molecular mapping of cancer in mice. Nat Rev Cancer. 2002;2:11-8
17. Cao CY, Chen Y, Wu FZ, Deng Y, Liang GL. Caspase-3 controlled assembly of nanoparticles for fluorescence turn on. Chem Commun. 2011;47:10320-2
18. Chen Y, Liang GL. Enzymatic Self-Assembly of Nanostructures for Theranostics. Theranostics. 2012;2:139-47
19. Lovell JF, Chan MW, Qi QC, Chen J, Zheng G. Porphyrin FRET Acceptors for Apoptosis Induction and Monitoring. J Am Chem Soc. 2011;133:18580-2
20. Sako Y, Minoguchi S, Yanagida T. Single-molecule imaging of EGFR signalling on the surface of living cells. Nat Cell Biol. 2000;2:168-72
21. Moats RA, Fraser SE, Meade TJ. A ''smart'' magnetic resonance imaging agent that reports on specific enzymatic activity. Angew Chem Int Edit. 1997;36:726-8
22. Artemov D, Mori N, Ravi R, Bhujwalla ZM. Magnetic resonance molecular imaging of the HER-2/neu receptor. Cancer Res. 2003;63:2723-7
23. Chou SW, Shau YH, Wu PC, Yang YS, Shieh DB, Chen CC. In Vitro and in Vivo Studies of FePt Nanoparticles for Dual Modal CT/MRI Molecular Imaging. J Am Chem Soc. 2010;132:13270-8
24. Huang GM, Hu J, Zhang H, Zhou ZJ, Chi XQ, Gao JH. Highly magnetic iron carbide nanoparticles as effective T-2 contrast agents. Nanoscale. 2014;6:726-30
25. Huang GM, Li H, Chen JH, Zhao ZH, Yang LJ, Chi XQ. et al. Tunable T-1 and T-2 contrast abilities of manganese-engineered iron oxide nanoparticles through size control. Nanoscale. 2014;6:10404-12
26. Weissleder R, Moore A, Mahmood U, Bhorade R, Benveniste H, Chiocca EA. et al. In vivo magnetic resonance imaging of transgene expression. Nat Med. 2000;6:351-5
27. Huang P, Lin J, Li WW, Rong PF, Wang Z, Wang SJ. et al. Biodegradable Gold Nanovesicles with an Ultrastrong Plasmonic Coupling Effect for Photoacoustic Imaging and Photothermal Therapy. Angew Chem Int Ed. 2013;52:13958-64
28. Chen F, Ellison PA, Lewis CM, Hong H, Zhang Y, Shi SX. et al. Chelator-Free Synthesis of a Dual-Modality PET/MRI Agent. Angew Chem Int Ed. 2013;52:13319-23
29. Gao XH, Cui YY, Levenson RM, Chung LWK, Nie SM. In vivo cancer targeting and imaging with semiconductor quantum dots. Nat Biotechnol. 2004;22:969-76
30. Zhang Y, So MK, Rao JH. Protease-modulated cellular uptake of quantum dots. Nano Lett. 2006;6:1988-92
31. Cheng L, Liu JJ, Gu X, Gong H, Shi XZ, Liu T. et al. PEGylated WS2 Nanosheets as a Multifunctional Theranostic Agent for in vivo Dual-Modal CT/Photoacoustic Imaging Guided Photothermal Therapy. Adv Mater. 2014;26:1886-93
32. Liu Z, Lin Q, Sun Y, Liu T, Bao C, Li F. et al. Spatiotemporally Controllable and Cytocompatible Approach Builds 3D Cell Culture Matrix by Photo-Uncaged-Thiol Michael Addition Reaction. Adv Mater. 2014;26:3912-7
33. Chi XQ, Huang DT, Zhao ZH, Zhou ZJ, Yin ZY, Gao JH. Nanoprobes for in vitro diagnostics of cancer and infectious diseases. Biomaterials. 2012;33:189-206
34. Zhao YY, Ye CJ, Liu WW, Chen R, Jiang XY. Tuning the Composition of AuPt Bimetallic Nanoparticles for Antibacterial Application. Angew Chem Int Ed. 2014;53:8127-31
35. Min YZ, Li JM, Liu F, Yeow EKL, Xing BG. Near-Infrared Light-Mediated Photoactivation of a Platinum Antitumor Prodrug and Simultaneous Cellular Apoptosis Imaging by Upconversion-Luminescent Nanoparticles. Angew Chem Int Ed. 2014;53:1012-6
36. Lewis CM, Graves SA, Hernandez R, Valdovinos HF, Barnhart TE, Cai WB. et al. Mn-52 Production for PET/MRI Tracking Of Human Stem Cells Expressing Divalent Metal Transporter 1 (DMT1). Theranostics. 2015;5:227-39
37. Silva GA. Neuroscience nanotechnology: Progress, opportunities and challenges. Nat Rev Neurosci. 2006;7:65-74
38. Giepmans BNG, Adams SR, Ellisman MH, Tsien RY. The fluorescent toolbox for assessing protein location and function. Science. 2006;312:217-24
39. Lee S, Lee KH, Ha JS, Lee SG, Kim TK. Small-Molecule-Based Nanoassemblies as Inducible Nanoprobes for Monitoring Dynamic Molecular Interactions Inside Live Cells. Angew Chem Int Ed. 2011;50:8709-13
40. Ren HJ, Xiao F, Zhan K, Kim YP, Xie HX, Xia ZY. et al. A Biocompatible Condensation Reaction for the Labeling of Terminal Cysteine Residues on Proteins. Angew Chem Int Ed. 2009;48:9658-62
41. Liang GL, Ren HJ, Rao JH. A biocompatible condensation reaction for controlled assembly of nanostructures in living cells. Nat Chem. 2010;2:54-60
42. Shen B, Jeon J, Palner M, Ye DJ, Shuhendler A, Chin FT. et al. Positron Emission Tomography Imaging of Drug-Induced Tumor Apoptosis with a Caspase-Triggered Nanoaggregation Probe. Angew Chem Int Ed. 2013;52:10511-4
43. Cao CY, Shen YY, Wang JD, Li L, Liang GL. Controlled intracellular self-assembly of gadolinium nanoparticles as smart molecular MR contrast agents. Sci Rep. 2013;3:1024
44. Miao QQ, Bai XY, Shen YY, Mei B, Gao JH, Li L. et al. Intracellular self-assembly of nanoparticles for enhancing cell uptake. Chem Commun. 2012;48:9738-40
45. Yuan Y, Zhang J, An L, Cao Q, Deng Y, Liang G. Oligomeric nanoparticles functionalized with NIR-emitting CdTe/CdS QDs and folate for tumor-targeted imaging. Biomaterials. 2014;35:7881-6
46. Gao Y, Kuang Y, Guo ZF, Guo ZH, Krauss IJ, Xu B. Enzyme-Instructed Molecular Self-assembly Confers Nanofibers and a Supramolecular Hydrogel of Taxol Derivative. J Am Chem Soc. 2009;131:13576-7
47. Wang MW, Zhang YP, Zhang YJ, Shen CKF. Module-assisted one-pot synthesis of [F-18]SFB for radiolabeling proteins. J Radioanal Nucl Chem. 2011;289:191-6
48. Lehmann M, Andre F, Bellan C, Remacle-Bonnet M, Garrouste F, Parat F. et al. Deficient processing and activity of type I insulin-like growth factor receptor in the furin-deficient LoVo-C5 cells. Endocrinology. 1998;139:3763-71
49. Choi HS, Liu W, Misra P, Tanaka E, Zimmer JP, Ipe BI. et al. Renal clearance of quantum dots. Nat Biotechnol. 2007;25:1165-70
Author contact
![]() Corresponding author: Shineng Luo, Ph.D., School of Chemical and Material Engineering, Jiangnan University, 1800 Lihu Road, Wuxi, Jiangsu 214122, China. Tel: (+86)-510-85508869. E-mail: luoshn163com. Gaolin Liang, Ph.D., CAS Key Laboratory of Soft Matter Chemistry, Department of Chemistry, University of Science and Technology of China, 96 Jinzhai Road, Hefei, Anhui 230026, China. Tel: (+86)-551-63607935; fax: (+86)-551-63600730. E-mail: gliangedu.cn.
Corresponding author: Shineng Luo, Ph.D., School of Chemical and Material Engineering, Jiangnan University, 1800 Lihu Road, Wuxi, Jiangsu 214122, China. Tel: (+86)-510-85508869. E-mail: luoshn163com. Gaolin Liang, Ph.D., CAS Key Laboratory of Soft Matter Chemistry, Department of Chemistry, University of Science and Technology of China, 96 Jinzhai Road, Hefei, Anhui 230026, China. Tel: (+86)-551-63607935; fax: (+86)-551-63600730. E-mail: gliangedu.cn.
Citation styles
APA
Liu, Y., Miao, Q., Zou, P., Liu, L., Wang, X., An, L., Zhang, X., Qian, X., Luo, S., Liang, G. (2015). Enzyme-Controlled Intracellular Self-Assembly of 18F Nanoparticles for Enhanced MicroPET Imaging of Tumor. Theranostics, 5(10), 1058-1067. https://doi.org/10.7150/thno.11758.
ACS
Liu, Y.; Miao, Q.; Zou, P.; Liu, L.; Wang, X.; An, L.; Zhang, X.; Qian, X.; Luo, S.; Liang, G. Enzyme-Controlled Intracellular Self-Assembly of 18F Nanoparticles for Enhanced MicroPET Imaging of Tumor. Theranostics 2015, 5 (10), 1058-1067. DOI: 10.7150/thno.11758.
NLM
Liu Y, Miao Q, Zou P, Liu L, Wang X, An L, Zhang X, Qian X, Luo S, Liang G. Enzyme-Controlled Intracellular Self-Assembly of 18F Nanoparticles for Enhanced MicroPET Imaging of Tumor. Theranostics 2015; 5(10):1058-1067. doi:10.7150/thno.11758. https://www.thno.org/v05p1058.htm
CSE
Liu Y, Miao Q, Zou P, Liu L, Wang X, An L, Zhang X, Qian X, Luo S, Liang G. 2015. Enzyme-Controlled Intracellular Self-Assembly of 18F Nanoparticles for Enhanced MicroPET Imaging of Tumor. Theranostics. 5(10):1058-1067.
This is an open access article distributed under the terms of the Creative Commons Attribution (CC BY-NC) License. See http://ivyspring.com/terms for full terms and conditions.