Impact Factor
- Issue 12; 2026
- Issue 11; 2026
- Issue 10; 2026
- Issue 9; 2026
- Issue 8; 2026
- Volume 16; 2026
- Advance Articles
- Past Issues
- Cover Images
- Cover Suggestion
- Index & Coverage
- Special Issues
Introduction
Materials and Methods
Results
Discussion
Abbreviations
Supplementary Material
Acknowledgements
References
International Journal of Biological Sciences
International Journal of Medical Sciences
 Global reach, higher impact

Theranostics 2015; 5(11):1175-1186. doi:10.7150/thno.13048 This issue Cite
Research Paper
Assessment of Inflammation in an Acute on Chronic Model of Inflammatory Bowel Disease with Ultrasound Molecular Imaging
Steven Machtaler1*, Ferdinand Knieling1*, Richard Luong2, Lu Tian3, Jürgen K. Willmann1 ![]()
1. Department of Radiology, Molecular Imaging Program at Stanford, Stanford University, School of Medicine, Stanford, California, USA
2. Department of Comparative Medicine, Stanford University, Stanford, California, USA
3. Department of Health, Research & Policy, Stanford University, Stanford, California, USA
*Co-first Authors
Received 2015-6-27; Accepted 2015-7-16; Published 2015-8-8
Abstract

Background: Ultrasound (US) molecular imaging has shown promise in assessing inflammation in preclinical, murine models of inflammatory bowel disease. These models, however, initiated acute inflammation on previously normal colons, in contrast to patients where acute exacerbations are often in chronically inflamed regions. In this study, we explored the potential of dual P- and E-selectin targeted US imaging for assessing acute inflammation on a murine quiescent chronic inflammatory background.
Methods: Chronic colitis was induced using three cycles of 4% DSS in male FVB mice. Acute inflammation was initiated 2 weeks after the final DSS cycle through rectal administration of 1% TNBS. Mice at different stages of inflammation were imaged using a small animal ultrasound system following i.v. injection of microbubbles targeted to P- and E-selectin. In vivo imaging results were correlated with ex vivo immunofluorescence and histology.
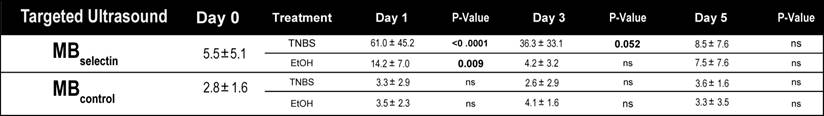
Results: Induction of acute inflammation resulted in an increase in the targeted US signal from 5.5 ± 5.1 arbitrary units (a.u.) at day 0 to 61.0 ± 45.2 a.u. (P < 0.0001) at day 1, 36.3 ± 33.1 a.u. at day 3, returning to levels similar to control at day 5. Immunofluorescence showed significant increase in the percentage of P- and E-selectin positive vessels at day 1 (P-selectin: 21.0 ± 7.1% of vessels; P < 0.05; E-selectin: 16.4 ±3.7%; P < 0.05) compared to day 0 (P-selectin: 10.3 ± 5.7%; E-selectin: 7.3 ± 7.0%).
Conclusions: Acute inflammation can be accurately measured in a clinically relevant murine model of chronic IBD using ultrasound molecular imaging with a dual P- and E- selectin-targeted contrast agent.
Keywords: Targeted ultrasound imaging, P- and E-selectin targeted microbubbles, acute inflammation on chronic colitis background, DCE-US imaging
Introduction
Inflammatory bowel disease (IBD) is a complex group of chronic and relapsing diseases (including Crohn's disease and ulcerative colitis) which involve changes in mucosal immunity and gastrointestinal physiology. It currently affects approximately 1.4 million people in the USA, with rising rates in children and adolescents and annual direct health care costs totaling $6.1 billion dollars [1-4]. Due to the recurrent nature of the disease, patients need to be monitored multiple times over many years to assess location and extent of disease activity.
Imaging plays an important role in the diagnosis and monitoring of IBD. Endoscopy with biopsy is the reference standard; however, it is invasive and cannot access all areas of the colon and small bowel [5]. Therefore, alternative, non-invasive imaging modalities are being used to complement endoscopy for monitoring the disease. In particular, patients with acute symptoms and potential complications suspected, computed tomography (CT) is increasingly being used due to its broad accessibility and robust scanning results [6]. However, CT is less suitable in children and young adults for multiple repetitive exams to assess disease activity due to the cumulative exposure to ionization radiation inherent to the technology [7, 8]. Magnetic resonance imaging (MRI) does not expose patients to ionizing radiation; however, disadvantages include relative high cost and reduced accessibility, limitations in claustrophobic patients and patients with pace makers, as well as the need to sedate children who cannot remain stationary for the duration of the exam [9, 10]. Ultrasound is a cross sectional imaging modality routinely used for bowel imaging in pediatric and adult patients with appropriate acoustic windows [11, 12]. While ultrasound is widely available does not expose patients to ionizing radiation, experienced sonographers are required to reduce variability in accuracy for identifying disease location and severity [11].
Ultrasound molecular imaging utilizes micron-sized, gas filled contrast microbubbles (MB) that are modified to bind proteins on vascular endothelial cells that are upregulated in various disease processes including inflammation [13]. One of the hallmarks of IBD is the recruitment of large numbers of immune cells into active sites of inflammation within the bowel [14]. In order for immune cells to traffic into these sites, they have to first exit circulation. This extravasation is accomplished through a complex set of interactions between the trafficking immune cells and adhesion proteins expressed on the surface of vascular endothelial cells which allow for rolling, adhesion, and eventual transendothelial migration [15]. Of particular importance to leukocyte rolling are the adhesion proteins P- and E-selectin. Both selectins share the same ligand, PSGL-1, which is expressed on the surface of trafficking leukocytes. The interaction of P- and E-selectin with PSGL-1 slows down the circulating leukocytes enough to allow for interaction with surface-bound chemokines on the endothelial cells, and initiation of firm adhesion [15]. Ultrasound molecular imaging can take advantage of this inflammatory mechanism by using MB that contain PSGL-1 [16, 17]. Previous studies have shown that selectin targeted ultrasound imaging allows accurate and objective assessment of inflammation in acute murine models of colitis; however, inflammation in these mice was initiated de novo in normal colons [17, 18]. In contrast, patients with IBD often present with acute inflammatory exacerbations in regions that were previously in a clinically quiescent chronic inflammation state. The ability to identify and accurately monitor treatment response in regions of acute inflammation has important implications for the clinical management of patients with IBD.
The purpose of this study was to explore the potential of dual P- and E-selectin targeted ultrasound imaging for assessing acute inflammation in mice with a chronic inflammatory background, which simulates a clinical phenotype of acute on chronic IBD.
Materials and Methods
Animal Models
The institutional administrative panel on laboratory animal care approved all procedures involving laboratory animals. An overall total of 138 mice (including controls) were used and the following two colitis models were generated: 1) Acute colitis in previously normal colon (n=45); 2) acute inflammation in mice with quiescent chronic colitis (henceforth, acute on chronic colitis; n=24). All mice were weighed on day -8, day 0, day 1, day 3, and day 5.
Acute Inflammation in Normal Colon Model
Acute inflammation in normal colons was induced in 45 BALB/c mice (6-8 week old; Jackson Laboratories, USA) using the contact sensitizing agent 2.4.6-trinitrobenzenesulfonic acid (TNBS; Sigma-Aldrich, St. Louis MO) according to previously reported methods [19] (see supplementary materials).
Chronic Colitis Model
Chronic colitis background was induced in 58 mice (FVB mice; 6-8 weeks old, Jackson Laboratories) using three repeated doses of dextran sodium sulfate (DSS) in the drinking water separated by 2 weeks of normal drinking water as described [19] (Figure 1A).
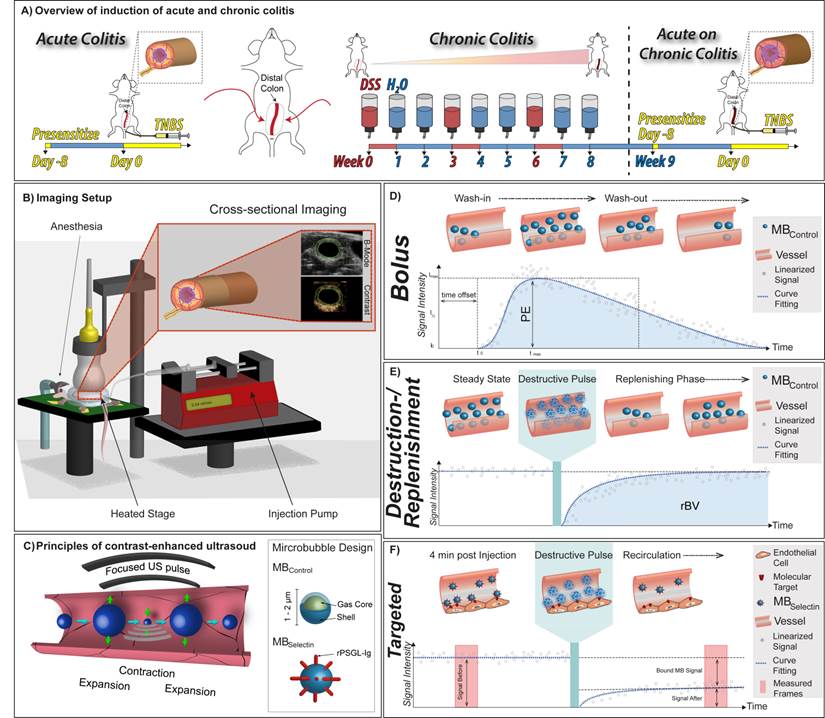
Overview of animal models and imaging techniques. A) Summary of chemical treatment to induce acute colitis in mice with normal colon using TNBS (left) and acute on chronic colitis (right) using both DSS and TNBS. B) Graphical summary of ultrasound molecular imaging setup with anesthetized mice placed on a heated stage. C) In contrast-enhanced ultrasound contrast microbubbles resonate at the insonation frequency thereby sending out strong echoes. The general design of control and dual-selectin-targeted contrast microbubbles is also shown. Typical time-intensity curves in dynamic contrast-enhanced ultrasound (DCE-US) imaging using D) the bolus DCE-US technique to measure peak enhancement (PE), and E) the destruction-replenishment DCE-US technique to measure relative blood volume (rBV) are shown. F) Summary of data acquisition in ultrasound molecular imaging using dual-selectin-targeted contrast microbubbles to measure the molecular imaging signal from bound microbubbles.
Acute on Chronic Colitis Model
In 24 mice with quiescent chronic colitis, a single rectal TNBS/ethanol (EtOH) dose was administered at the end of the 9-week DSS treatment to create an acute inflammation on chronic colitis model. In 16 mice with quiescent chronic colitis, an EtOH solution (1:1 EtOH with H2O) was administered rectally as control. An additional 18 mice were not treated and used as day 0 controls.
Dual-Selectin Targeted Contrast Microbubbles
Clinical grade, dual-selectin targeted MB (MBSelectin) were provided by Bracco Suisse SA (Geneva, Switzerland) and were constructed by covalently coupling a selectin-binding ligand rPSGL-Ig onto lipid-shelled MB as described previously [16] (see supplementary materials). The mean diameter of MBSelectin was assessed using a Multisizer III Coulter Counter (Beckman Coulter, Fullerton, CA) and determined to be 1.5 μm (range, 1-2 μm). Control non-targeted MB (MBControl) were prepared with the same protocol but without coupling of the ligand rPSGL-Ig to the MB shell [16].
Contrast-Enhanced Ultrasound Imaging and Image Analysis
During scanning, all mice were kept under anesthesia with 2% isoflurane/ oxygen (2 L/min) and were placed on a heated stage (37 ºC) to keep constant body temperature. Ultrasound settings were kept consistent for all mice throughout the imaging sessions. The transducer was fixed on a railing system and positioned over the colon at a distance of 3 cm from the anus (Figure 1B). Pre-warmed gel was used as a coupling agent on the shaved abdominal skin and also injected into the colon using a lubricated catheter. To slow bowel movements, all animals were injected with 100 μl atropine subcutaneously (1:50 atropine:saline; American Regent, Shirley, NY) 10 minutes prior to imaging sessions.
Contrast-enhanced US was performed using a dedicated small-animal ultrasound system (Vevo 2100; VisualSonics, Toronto, Ontario, Canada; Figure 1C). Images were collected in a transverse plane in contrast-mode using a high spatial resolution 21-MHz transducer (MS250; VisualSonics, Toronto, Canada; axial and lateral resolution of 75 µm and 165 µm, respectively; focal length, 8 mm; transmit power, 10%; mechanical index, 0.2; dynamic range, 35 dB).
Dual-selectin targeted ultrasound imaging was performed in a total of 88 animals (19 with acute colitis on normal colon, 18 EtOH control, and 9 normal colons; 17 with acute inflammation on chronic colitis, 11 EtOH control, and 14 with quiescent chronic colitis). In addition, a subgroup of 50 animals (10 with acute colitis in normal colons, 9 EtOH control, 6 no treatment; 10 with acute inflammation on chronic colitis background, 10 EtOH control, 5 with no treatment), dynamic contrast-enhanced ultrasound (DCE-US) imaging was performed for further characterization in terms of colon wall perfusion. Image analysis was performed using commercially available image analysis software (VEVO CQ; Visual Sonics, Toronto, Canada) by one reader. Regions of interest (ROI) were drawn around the bowel walls excluding the bowel lumen.
Dual-Selectin Targeted Ultrasound Molecular Imaging
5 x 10⁷ MBSelectin and MBControl (separated by 20 min to allow clearance: total volume 100 μl each; random order) were injected intravenously in a total of 88 mice and allowed to circulate for 4 min before assessing MB binding, as previously described [18]. In brief, after the 4 minute binding period, ~120 imaging frames were captured over a 15 second period to capture signal imaging signal from both bound and freely circulating MB in the colon vasculature. A continuous high-power destructive pulse of 3.7 MPa (transmit power, 100%; mechanical index, 0.63) was then applied for 1 second, which destroyed all MB within the imaging plane. Post destruction, ~120 imaging frames were acquired to measure signal from replenished freely circulating MB only. The difference between the imaging signal pre and post destruction represented the signal from bound MB (Figure 1F).
Dynamic Contrast-enhanced Ultrasound Imaging
Two well-established DCE-US acquisition techniques were used in an additional subset of 50 mice to characterize the animal model in terms of blood perfusion in the bowel wall. The first method (bolus DCE-US) is based on the wash-in/wash-out kinetics of MB after bolus injection. The second method (destruction-replenishment DCE-US) is based on reaching a steady state MB concentration within the whole capillary bed, applying a destructive pulse and then observing the replenishment kinetics [20].
Bolus DCE-US Imaging
Bolus DCE-US was performed following a bolus injection of 5x10⁷ (100 μl) MBControl over a 5-sec period by using an injection pump (Kent Scientific, Torrington, CT; Figure 1D). Eight hundred to 1000 frames were recorded at 25 frames per second to capture the wash-in and washout characteristics of the injected MB within the region of interest (ROI). Linearized and fitted time-intensity curves were generated and exported to Microsoft excel and perfusion parameters were calculated based on the fitting to a lognormal distribution function as described [21, 22]: Peak enhancement (PE), an indicator for relative blood volume in the corresponding ROI and proportional to the MB dose [23] was calculated as the difference between the maximum (Imax) and the baseline (I0) signal intensities (Figure 1D).
Destruction-Replenishment DCE-US Imaging
Destruction-replenishment DCE-US imaging was performed after reaching a steady state of the ultrasound contrast agent in the circulation using standardized techniques [24]. In brief, MBControl were injected at a constant flow rate of 0.04 ml/min using an injection pump (Figure 1E). When steady state was reached (between 3 and 5 minutes), a continuous high-power destructive pulse of 3.7 MPa (transmit power, 100%; mechanical index, 0.63) was applied for 1 second to destroy all MB within the field of view and the replenishment of the MB into the field of view was measured until the baseline signal intensity was reached. Time intensity curves were generated and the relative blood volume (rBV), which reflects the microvascular cross-sectional area, was calculated as described previously [25].
Ex Vivo Tissue Analysis
Tissue Preparation
Immediately following imaging (or without imaging in mice sacrificed at day 0), the bowel segments at 3 cm from the anus were harvested and fixed in a 4% paraformaldehyde/phosphate buffered saline solution (PFA/PBS; Santa Cruz Biotechnology, Santa Cruz, CA) overnight at 4 ºC. Ex vivo analysis included: 1) hematoxylin-eosin (H&E) staining for histological inflammation grading; 2) Masson trichrome staining for assessment of fibrosis levels; and 3) Immunofluorescence staining for quantitative assessment of P-selectin and E-selectin expression.
Histological Analysis
After fixation, tissues were embedded in paraffin, sectioned, and stained with H&E and Masson Trichrome according to standard protocols [18]. Grading of inflammation and fibrosis was performed by one, blinded veterinary pathologist (with 10 years of experience) as follows:
Inflammation Grading: A 4-point modified scoring system was used as described [26] with a score of 0 indicating no evidence of inflammation; 1, low level of inflammation with scattered infiltrating mononuclear cells; 2, moderate inflammation with multiple sites of infiltration; 3, high level of inflammation with increased vascular density and marked wall thickening; 4, severe inflammation with transmural leukocyte infiltration and loss of goblet cells.
Fibrosis Grading: A 4-point scoring system was used with a score of 1, indicating no evidence of fibrosis (collagen covering < 5% of area); 2, loose irregular connective tissue with very few focal increases in collagen (collagen covering approximately 6-15% of area) ; 3, increase in the number and density of focal collagen regions along with a mild increase in the pan collagen (collagen covering approximately 16-40% of area); 4, severe: presence of a thick collagen layer (collagen covering more than 40% of the area) [27].
Immunofluorescence Staining for P-selectin and E-selectin and Vascular Area Measurement
Quantitative immunofluorescence analysis of P- and E-selectin expression as well as assessment of the vascular area in the bowel wall was performed following standard protocols (see supplementary materials). Quantitative analysis of P- and E-selectin positive vessels was performed using ImageJ (http://rsb.info.nih.gov/ij/) as previously described [17].
Vessel area in the murine colons was assessed using ImageJ as follows: First, the vascular area within the mucosa and submucosa was determined by summing the area of all the CD31 positive vessels detectable within the field. This area was then divided by the total area of the mucosa and submucosal layers. The total area of the mucosa and submucosal layers in each micrograph was determined by tracing a ROI around both the mucosa and submucosa and calculating the total area covered by the ROI.
Statistical Analysis
All data are given as mean ± standard deviations. For perfusion imaging and ultrasound molecular imaging data sets, experimental groups were compared with a Bonferroni's multiple comparisons test and was performed using GraphPad Prism 6 Software (GraphPad Sofware, La Jolla,CA). A level of P ≤ 0.008 was considered statistically significant. Differences between vascular area, P- and E-selectin expression and histological scoring were assessed using a nonparametric Wilcoxon rank test to compare the baseline and time points post TNBS treatment. A level of P ≤ 0.05 was considered statistically significant and tests were performed using R 3.1.1 (http://cran.r-project.org/).
Results
Establishment of Acute Inflammation in Mice with Quiescent Chronic Colitis
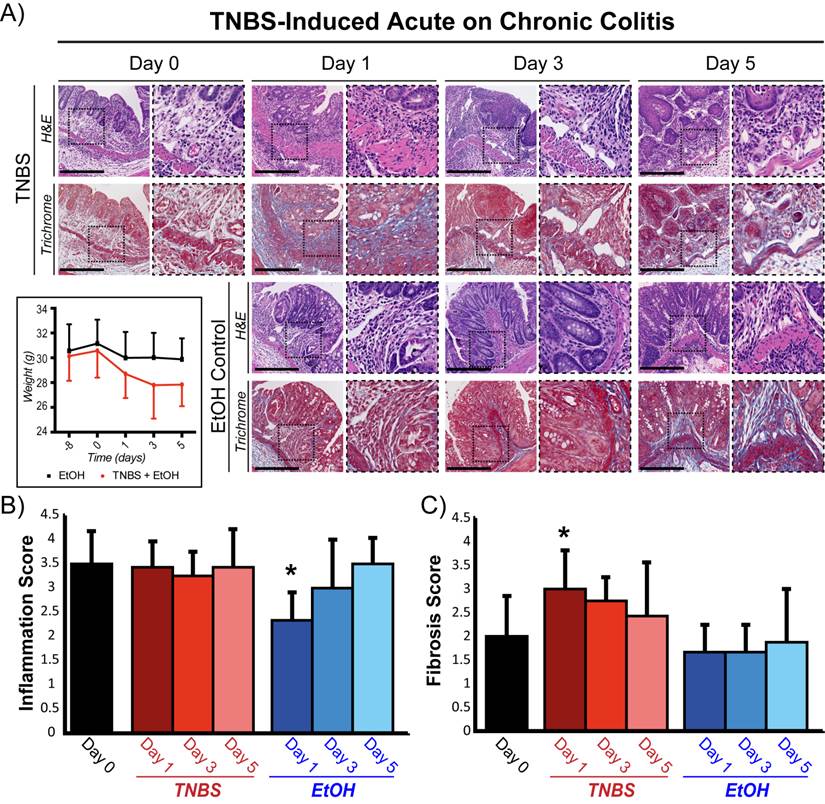
A murine acute on chronic colitis model was established using repeated doses of DSS to establish the initial chronic phenotype (Figure 1A). Two weeks after the final DSS treatment (quiescent chronic inflammation state, Day 0), histological assessment revealed increased vascular density, bowel wall thickening, and transmural leukocyte infiltration with a mean inflammation score of 3.6 ± 0.67 (Figure 2A, B). The number and density of focal collagen regions was also increased (fibrosis score: 2.0 ± 0.9; Figure 2C). Acute inflammation induction with TNBS in animals with chronic colitis did not significantly change the histological inflammation score at any time point compared to baseline (P ≥ 0.4; Figure 2B). In contrast, in animals with normal colons, induction of acute inflammation resulted in a significantly increased inflammation score at all time points (P ≤ 0.003; supplementary Figure 1). In both animal models, total body weight significantly decreased (P ≤ 0.003) after TNBS administration, peaking at day 3 (supplementary Figure 1 and Figure 2A).
Representative micrographs and histological grading of colons from mice with acute on chronic colitis following TNBS administration. A) H&E (top: inflammation) and trichrome (bottom: fibrosis) staining of colons with chronic colitis before (day 0) and 1, 3, and 5 days after TNBS administration (top two rows) or ethanol (EtOH) control (bottom two rows). Mouse weights treated either with EtOH alone or both EtOH and TNBS are also plotted for the different time points starting at day -8 (bottom left). Inset dashed boxes represent zoomed region of the micrographs (right panel at each time point). Scale bar = 500 μm. Bar graphs summarize means ± standard deviations of histological scoring of inflammation grading based on H&E staining (B) and of fibrosis based on trichrome staining (C). * denotes P < 0.05.
Vascular Perfusion Responses to Acute Inflammation in Chronic Colitis
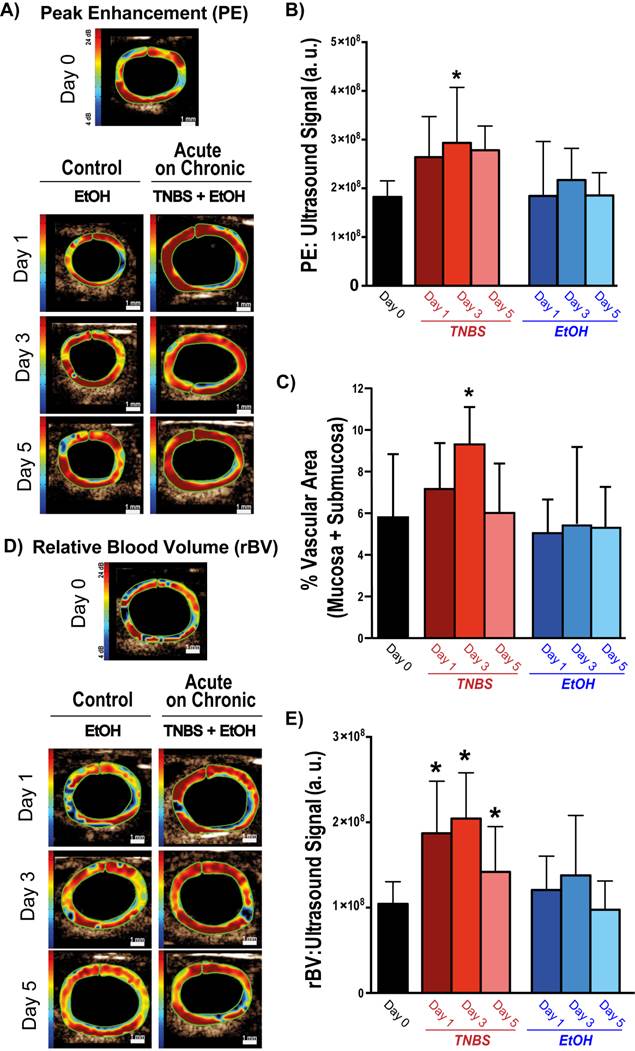
The impact of TNBS-induced acute inflammation on colonic wall blood circulation was imaged with DCE-US imaging. After induction of acute inflammation in mice with chronic colitis, there was a significant (P = 0.003) increase in peak enhancement by day 3, which decreased by day 5 (Figure 3A and B; Table 1). In contrast, induction of acute inflammation in normal colons resulted in a significant (P = 0.008) decrease in peak enhancement observable at day 1 (supplementary Figure 2; supplementary Table 1). The increase in peak enhancement in mice with acute on chronic colitis also coincided with a significant increase (P = 0.02) in the vascular area of the colon as assessed on histology, peaking by day 3 and decreasing to levels similar to control by day 5 (Figure 3C).
Representative ultrasound images and corresponding quantification of murine colons after induction of acute on chronic colitis imaged with bolus and destructions-replenishment dynamic contrast-enhanced ultrasound imaging techniques. A) Transverse ultrasound images of peak enhancement (PE) imaged 0, 1, 3, and 5 days after acute inflammation induction using TNBS\EtOH (right) or EtOH only (left). Scale bar = 1 mm. B) Bar graph summarizes mean ± standard deviations of quantitate PE values; * denotes P < 0.008. C) Bar graph summarizes mean ± standard deviations of the vascular area quantified as the percentage CD31 positive vessels in mucosa and submucosa of bowel; * denotes P < 0.05. D) Transverse ultrasound images showing relative blood volume (rBV) imaged 0, 1, 3, and 5 days after acute inflammation induction using TNBS/EtOH (right) or EtOH only (left). Scale bar = 1 mm. E) Bar graph summarizes mean ± standard deviations of quantitate rBV values; * denotes P < 0.008.
Dynamic contrast-enhanced ultrasound imaging quantification (both bolus and destruction replenishment methods) of vascular perfusion in murine acute on chronic colitis.
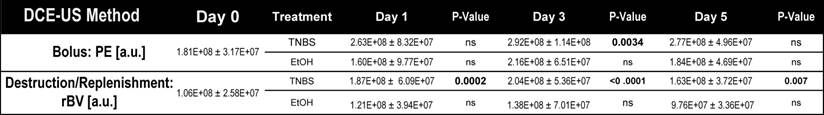
While bolus-DCE-ultrasound represents the early arterial filling of the circulatory system, destruction-replenishment DCE-ultrasound measures the complete circulatory system (including small post-arterial capillaries). After induction of acute on chronic colitis, rBV increased significantly by day 1 (187 ± 50 a.u., P =0.0002), peaked at day 3 (204 ± 54 a.u., P < 0.0001), and began to decrease by day 5 (163 ± 37 a.u., P = 0.007; Table 1; Figure 3D and E).
Assessment of Inflammation using P- and E-Selectin Targeted US Imaging
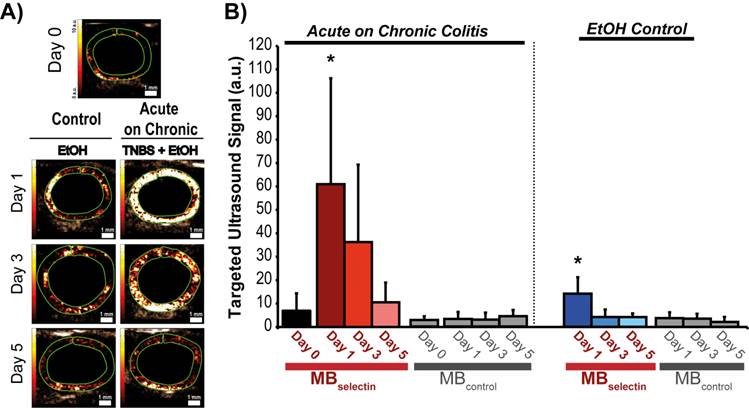
Induction of acute inflammation in mice with chronic colitis resulted in a significant increase in the ultrasound molecular imaging signal (61.0 ± 45.2 a.u.; P < 0.0001) at day 1 compared to baseline (5.5 ± 5.1 a.u.) when imaged with MBselectin (Figure 4A and B; Table 2). The ultrasound molecular imaging signal declined, yet remained elevated at day 3 after induction of acute inflammation (36.3 ± 33.1 a.u.), returning to levels similar to control by day 5 (8.5 ± 7.6 a.u.). This trend was similar to acute inflammation in mice with normal colons (supplementary Figure 3; supplementary Table 2). There was a small, but statistically significant increase in the ultrasound molecular imaging signal obtained with MBselectin one day post administration of EtOH (14.2 ± 7.0 a.u.), returning to levels similar to controls by day 3 (4.2 ± 3.2 .a.u.; Figure 4A and B; Table 2). Ultrasound molecular imaging using MBControl resulted in no significantly increased signal compared to non-treated controls (Day 0) in all treatments (P ≥ 0.99; Figure 4A and B).
Representative ultrasound molecular images using a dual-selectin targeted MB of acute on chronic colitis. A) Transverse ultrasound images highlighting the targeted ultrasound molecular imaging signal (within the green ROI) of colons 0, 1, 3 and 5 days after acute inflammation induction using TNBS/EtOH (right) or EtOH alone(left). Scale bar = 1 mm. B) Bar graph summarizes mean ± standard deviations of the molecular ultrasound imaging signal using MBselectin or MBcontrol in acute on chronic colitis or EtOH control; * denotes P < 0.008.
Quantification of dual-selectin targeted ultrasound imaging signal (both MBselectin and MBcontrol) in murine acute on chronic colitis.
Ex Vivo Analysis of P- and E-Selectin Expression
In quiescent chronic colitis (day 0), 10.3 ± 5.7 % of the vessels expressed P-selectin (Figure 5A and C), which significantly increased one day after acute inflammation induction (21.0 ± 7.1 %; P = 0.005). P-selectin expression remained significantly increased at day 3 (16.4 ± 7.6 % of vessels; P = 0.05) and at day 5 (18.3 ± 6.9 %; P = 0.03; Figure 5A and C). Induction of acute inflammation in normal colons resulted in an increase in P-selectin expression at day 1, followed by a return to levels similar to control by day 5 (supplementary Figure 4). There was also a significant increase in the expression of P-selectin in the EtOH control colons at Day 3 (16.4 ±3.7 %; P = 0.03), which returned to levels similar to controls by day 5 (11.3 ± 8.2 % of vessels).
Summary of ex vivo analysis of P- and E- selectin expression in acute on chronic colitis. A) Confocal micrographs show P-selectin expression (green) within the vasculature (CD31, red) of colons before (day 0) and 1, 3 and 5 days after TNBS/EtOH (top) and EtOH only (bottom) administration. Expression of P-selectin and CD31 is overlaid on top of differential interference contrast (DIC; left panels) and F-actin (middle: blue) images in order to observe tissue and cellular morphology. B) Confocal micrographs show E-selectin expression (green) within the vasculature (CD31, red) of colons before (day 0) and 1, 3 and 5 days after TNBS/EtOH (top) and EtOH only (bottom) administration. Expression of E-selectin and CD31 is overlaid on top of DIC (left panels) or F-actin (middle: blue) images in order to observe tissue and cellular morphology. Scale bar = 100 μm. C, D) Bar graphs summarize the percentage of vessels expressing P-selectin (C) and E-selectin (D) before (day 0) and 1, 3 and 5 days after TNBS/EtOH (top) and EtOH only (bottom); * denotes P < 0.05.
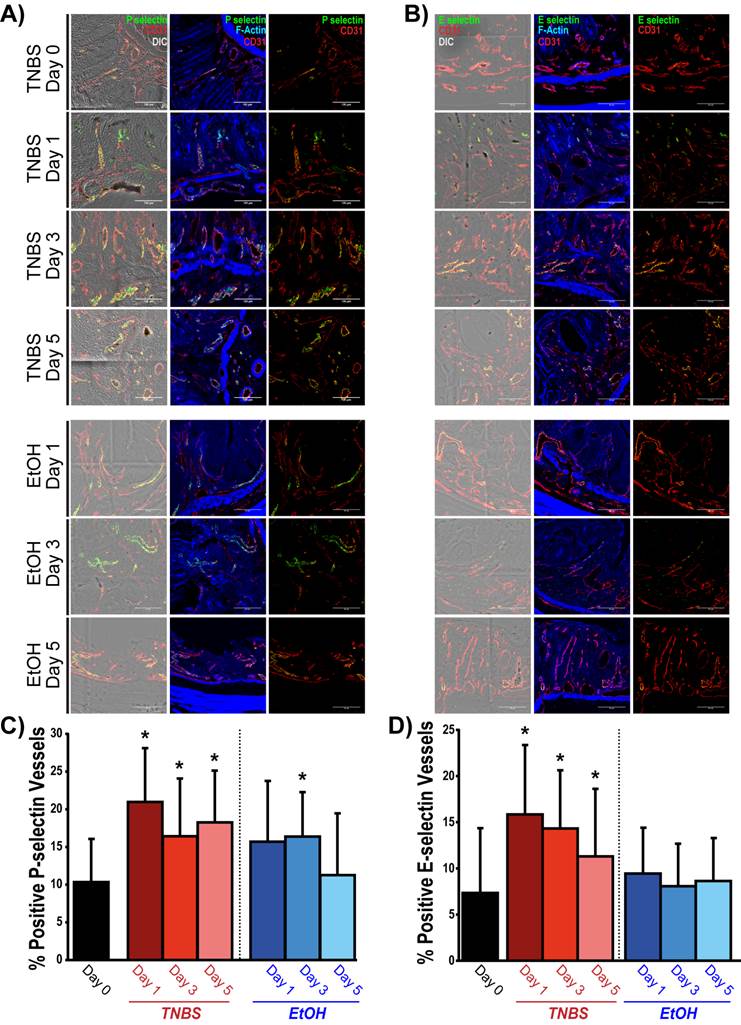
The percentage of vessels expressing E-selectin significantly increased one day post TNBS administration (15.7 ± 8.0 % of vessels; P = 0.009) compared to control colons (7.3 ± 7.0 % of vessels). Expression began to decline by day 3 (14.3 ± 6.3 % of vessels; P = 0.013) and day 5 (11.3 ± 7.3 % of vessels; P = 0.037) yet were still significantly higher than control colons. There was no significant increase in the percentage of E-selectin positive vessels in EtOH control colons (Figure 5B and D).
Discussion
In this study, we created a new murine acute on chronic colitis model and showed that ultrasound molecular imaging using a dual-selectin targeted contrast MB allows assessment of acute inflammation. Our findings lay the foundation for further development and clinical translation of this non-invasive imaging approach for monitoring disease activity in patients with IBD.
Previous preclinical studies have shown that ultrasound molecular imaging using a P-selectin or dual (P- and E-selectin) targeted MB can detect acute inflammation in mice with normal colon [17, 18]. However, since patients with IBD usually develop acute bouts of inflammation in an already chronically inflamed bowel, it is important to evaluate whether ultrasound molecular imaging allows assessment of inflammation on a chronic inflammatory background. Therefore, essential to this study was to use a murine model of chronic colitis that was in a quiescent state, in which acute bouts of inflammation could be induced. Among various available mouse models of IBD, chemically induced IBD models are advantageous since inflammation induction is immediate and relatively straight forward [19]. The two most commonly used chemical agents for this purpose are TNBS and DSS. TNBS is a haptenizing agent that induces a Th1-type response in the murine colon, whereas DSS is thought to have a toxic effect on the intestinal epithelial cells, which compromises the integrity of the mucosal barrier and induces inflammation independent of the acquired immune system [19, 28-30]. While both of these chemical agents have been used to create chronic-like IBD phenotypes [19, 31], we found that the mortality rates were lower in animals ingesting DSS in the drinking water compared to mice exposed with repetitive rectal TNBS administrations (unpublished results). After the DSS exposure, we allowed the animals 2-weeks recovery time which phenotypically resulted in a quiescent phase of chronic colitis. Here, murine colons showed characteristics of a chronically inflamed colon on histology with presence of moderate fibrosis. To simulate an acute bout of inflammation on this chronic inflammatory background in the distal colon and rectum, we administered TNBS, combining the strengths of the two chemical induction methods. This approach allowed us to initiate a temporally controlled acute inflammatory response in regions of the bowel that were in a quiescent chronic inflammatory state. In addition to histology, we further characterized this new model in terms of vascular perfusion using two complementary DCE-US techniques. Both DCE-US methods showed a significant increase in vascular perfusion at day 3 post TNBS administration, which returned to levels similar to control by day 5. These data are consistent with perfusion analysis in human IBD patients showing a similar increase during active disease [32], suggesting that, phenotypically, our model behaved in a similar fashion to human IBD with respect to the vascular response to inflammation.
When mice with chronic colitis were imaged with dual-targeted ultrasound imaging, a very low targeted signal was observed in the colons, supporting our hypothesis that this model represents a chronic quiescent state of inflammation. Following induction of an acute bout of inflammation with TNBS administration, the selectin-targeted ultrasound imaging signal substantially increased (approximately 11-fold higher than quiescent chronic colitis) and was also approximately 2-fold higher than in mice with acute inflammation on a normal colon background. This signal increase in mice with acute on chronic colitis may be due to an increase in the vascular area within the colon, as confirmed by histology in our study, resulting in a larger binding area for molecularly-targeted MB than in mice with normal colon backgrounds. In contrast to the in vivo imaging results, the inflammation scores obtained from histological analysis after induction of acute inflammation in mice with chronic colitis were not significantly different compared to the quiescent chronic colitis state, although there was substantial weight loss of the mice along with an increase in peak enhancement and relative blood volume, further indicating acute inflammation. This highlights a potential disadvantage of ex vivo histology in assessing active inflammation on a chronic background compared to in vivo imaging since scoring systems (similar to the one used in our study) rely on phenotypic changes such as colon thickness, leukocyte infiltration and loss of normal colon architecture. Those phenotypic changes in tissue and leukocyte clearance may lag behind the expression of the inflammatory markers P- and E-selectin. Therefore, the extent of active inflammation in a chronic inflammatory background may be more accurately and promptly quantified using non-invasive molecular imaging.
Our data also highlight an important advantage of molecular imaging over functional DCE-US imaging. In DCE-US, the perfusion parameters peak enhancement and relative blood flow increased by a factor of ~1.5-2 in the acute on chronic colitis model compared to quiescent chronic colitis, and the maximal increase was observed at day 3 after inflammation induction. Also, in mice with acute inflammation on normal colons, an unexplained decrease of peak enhancement and relative blood flow was observed at day 1, consistent with previous findings [18]. In contrast, there was an approximately 11-fold increase in the ultrasound molecular imaging signal using MBselectin as early as 1 day after the onset of acute inflammation in mice with chronic colitis background; furthermore, in mice with acute inflammation on normal colons the in vivo ultrasound molecular imaging signal increased at day 1 along with an increase in P- and E-selectin expression levels determined by ex vivo immunofluorescence. This robust and rapid signal increase observed with ultrasound molecular imaging may be advantageous in detecting inflammation and monitoring therapy in patients with IBD. However, this hypothesis needs to be further evaluated in future clinical trials.
The following limitations of our study need to be acknowledged. First, as with many animal models, the chemically induced IBD models simulating both chronic and acute on chronic colitis do not completely recapitulate human disease. Though other genetic models of IBD do exist that may be closer to human disease (i.e., Samp1/Yitfc which resembles human Crohn's disease [33]), a quiescent chronic inflammatory state or the exact onset of acute inflammation could not be assessed. We therefore required a model where the induction of inflammation could be tightly controlled as could be done using the two chemical agents in our study. Second, ultrasound molecular imaging was performed with a limited field of view in two dimensions only using the equipment available for this study. Three-dimensional ultrasound molecular imaging approaches are currently being explored [34] which may allow assessment of a larger and thus more representative segment of the bowel wall. Third, we could not perform an intra-animal comparison between the DCE-US techniques and ultrasound molecular imaging because the volume of contrast agent injected into the same animal within the same imaging session would have exceeded the safety limitations for the mice.
In conclusion, our results show that the presented murine acute on chronic colitis model resembles the phenotype of acute inflammation in patients with chronic IBD. Imaging with dual-selectin targeted ultrasound results in a significantly increased targeted ultrasound signal after induction of acute inflammation, suggesting that this modality may be a promising non-invasive approach for assessing and monitoring active inflammation in IBD.
Abbreviations
a.u.: arbitrary units; CT: X-ray computed tomography; DCE-US: dynamic contrast enhance ultrasound imaging; DSS: dextran sodium sulfate; EtOH: ethanol; MB: microbubbles; MPa: megapascal; MRI: magnetic resonance imaging; PE: peak enhancement; rBV: relative blood volume; ROI: region of interest; TNBS: 2.4.6-trinitrobenzenesulfonic acid; US: Ultrasound.
Supplementary Material
Supplementary Methods, Supplementary Results, Supplementary Tables and Figures.
Acknowledgements
We would like to acknowledge the following funding support: NIH R01DK092509 grant (JKW), the Broad Foundation (JKW), and The German National Foundation (FK). We acknowledge Thierry Bettinger, PhD, from Bracco Suisse SA (Geneva, Switzerland) for supplying the dual-selectin targeted and non-targeted microbubbles. We would also like to acknowledge the Stanford Neuroscience Microscopy Service, supported by NIH NS069375, and the SCi3 Core imaging facilities.
Competing Interests
The authors have declared that no competing interest exists.
References
1. Molodecky NA, Soon IS, Rabi DM, Ghali WA, Ferris M, Chernoff G. et al. Increasing incidence and prevalence of the inflammatory bowel diseases with time, based on systematic review. Gastroenterology. 2012;142:46-54 e42; quiz e30
2. Frolkis AD, Dykeman J, Negrón ME, deBruyn J, Jette N, Fiest KM. et al. Risk of Surgery for Inflammatory Bowel Diseases Has Decreased Over Time: A Systematic Review and Meta-analysis of Population-Based Studies. Gastroenterology. 2013;145:996-1006
3. Aloi M, Lionetti P, Barabino A, Guariso G, Costa S, Fontana M. et al. Phenotype and disease course of early-onset pediatric inflammatory bowel disease. Inflamm Bowel Dis. 2014;20:597-605
4. Abraham C, Cho JH. Inflammatory bowel disease. The New England journal of medicine. 2009;361:2066-78
5. Hamilton MJ. The valuable role of endoscopy in inflammatory bowel disease. Diagnostic and therapeutic endoscopy. 2012;2012:467979
6. Dambha F, Tanner J, Carroll N. Diagnostic imaging in Crohn's disease: What is the new gold standard? Best Practice & Research Clinical Gastroenterology. 2014;28:421-36
7. Duigenan S, Gee MS. Imaging of Pediatric Patients With Inflammatory Bowel Disease. American Journal of Roentgenology. 2012;199:907-15
8. Gee MS, Harisinghani MG. MRI in patients with inflammatory bowel disease. Journal of magnetic resonance imaging: JMRI. 2011;33:527-34
9. Pauls S, Gabelmann A, Schmidt S, Rieber A, Mittrach C, Haenle M. et al. Evaluating bowel wall vascularity in Crohn's disease: a comparison of dynamic MRI and wideband harmonic imaging contrast-enhanced low MI ultrasound. Eur Radiol. 2006;16:2410-7
10. Mason KP, Lubisch NB, Robinson F, Roskos R. Intramuscular Dexmedetomidine Sedation for Pediatric MRI and CT. American Journal of Roentgenology. 2011;197:720-5
11. Nylund K, Hausken T, Gilja OH. Ultrasound and inflammatory bowel disease. Ultrasound quarterly. 2010;26:3-15
12. Ziech ML, Hummel TZ, Smets AM, Nievelstein RA, Lavini C, Caan MW. et al. Accuracy of abdominal ultrasound and MRI for detection of Crohn disease and ulcerative colitis in children. Pediatric radiology. 2014
13. Kamaya A, Machtaler S, Safari Sanjani S, Nikoozadeh A, Graham Sommer F, Pierre Khuri-Yakub BT. et al. New technologies in clinical ultrasound. Seminars in roentgenology. 2013;48:214-23
14. Xu XR, Liu CQ, Feng BS, Liu ZJ. Dysregulation of mucosal immune response in pathogenesis of inflammatory bowel disease. World journal of gastroenterology: WJG. 2014;20:3255-64
15. Ley K, Laudanna C, Cybulsky MI, Nourshargh S. Getting to the site of inflammation: the leukocyte adhesion cascade updated. Nat Rev Immunol. 2007;7:678-89
16. Bettinger T, Bussat P, Tardy I, Pochon S, Hyvelin JM, Emmel P. et al. Ultrasound molecular imaging contrast agent binding to both E- and P-selectin in different species. Investigative radiology. 2012;47:516-23
17. Wang H, Machtaler S, Bettinger T, Lutz AM, Luong R, Bussat P. et al. Molecular Imaging of Inflammation in Inflammatory Bowel Disease with a Clinically Translatable Dual-Selectin-targeted US Contrast Agent: Comparison with FDG PET/CT in a Mouse Model. Radiology. 2013;267:818-29
18. Deshpande N, Lutz AM, Ren Y, Foygel K, Tian L, Schneider M. et al. Quantification and monitoring of inflammation in murine inflammatory bowel disease with targeted contrast-enhanced US. Radiology. 2012;262:172-80
19. Wirtz S, Neufert C, Weigmann B, Neurath MF. Chemically induced mouse models of intestinal inflammation. Nature protocols. 2007;2:541-6
20. Greis C. Quantitative evaluation of microvascular blood flow by contrast-enhanced ultrasound (CEUS). Clinical Hemorheology and Microcirculation. 2011;49:137-49
21. Dietrich CF, Averkiou MA, Correas JM, Lassau N, Leen E, Piscaglia F. An EFSUMB introduction into Dynamic Contrast-Enhanced Ultrasound (DCE-US) for quantification of tumour perfusion. Ultraschall in der Medizin. 2012;33:344-51
22. Needles A, Arditi M, Rognin NG, Mehi J, Coulthard T, Bilan-Tracey C. et al. Nonlinear contrast imaging with an array-based micro-ultrasound system. Ultrasound in medicine & biology. 2010;36:2097-106
23. Lassau N, Koscielny S, Chami L, Chebil M, Benatsou B, Roche A. et al. Advanced Hepatocellular Carcinoma: Early Evaluation of Response to Bevacizumab Therapy at Dynamic Contrast-enhanced US with Quantification—Preliminary Results. Radiology. 2011;258:291-300
24. Wei K, Jayaweera AR, Firoozan S, Linka A, Skyba DM, Kaul S. Quantification of Myocardial Blood Flow With Ultrasound-Induced Destruction of Microbubbles Administered as a Constant Venous Infusion. Circulation. 1998;97:473-83
25. Arditi M, Frinking PJ, Zhou X, Rognin NG. A new formalism for the quantification of tissue perfusion by the destruction-replenishment method in contrast ultrasound imaging. IEEE transactions on ultrasonics, ferroelectrics, and frequency control. 2006;53:1118-29
26. D'Haens GR, Geboes K, Peeters M, Baert F, Penninckx F, Rutgeerts P. Early lesions of recurrent Crohn's disease caused by infusion of intestinal contents in excluded ileum. Gastroenterology. 1998;114:262-7
27. Mähler M, Bristol IJ, Leiter EH, Workman AE, Birkenmeier EH, Elson CO. et al. Differential susceptibility of inbred mouse strains to dextran sulfate sodium-induced colitis. Am J Physiol. 1998;274:G544-51
28. Lawrance IC, Wu F, Leite AZA, Willis J, West GA, Fiocchi C. et al. A murine model of chronic inflammation-induced intestinal fibrosis down-regulated by antisense NF-κB. Gastroenterology. 2003;125:1750-61
29. Fichtner-Feigl S, Fuss IJ, Young CA, Watanabe T, Geissler EK, Schlitt H-J. et al. Induction of IL-13 Triggers TGF-β1-Dependent Tissue Fibrosis in Chronic 2,4,6-Trinitrobenzene Sulfonic Acid Colitis. The Journal of Immunology. 2007;178:5859-70
30. Axelsson LG, Landstrom E, Goldschmidt TJ, Gronberg A, Bylund-Fellenius AC. Dextran sulfate sodium (DSS) induced experimental colitis in immunodeficient mice: effects in CD4(+) -cell depleted, athymic and NK-cell depleted SCID mice. Inflammation research: official journal of the European Histamine Research Society [et al]. 1996;45:181-91
31. Loeuillard E, Bertrand J, Herranen A, Melchior C, Guerin C, Coeffier M. et al. 2,4,6-trinitrobenzene sulfonic acid-induced chronic colitis with fibrosis and modulation of TGF-beta1 signaling. World journal of gastroenterology: WJG. 2014;20:18207-15
32. Girlich C, Jung EM, Iesalnieks I, Schreyer AG, Zorger N, Strauch U. et al. Quantitative assessment of bowel wall vascularisation in Crohn's disease with contrast-enhanced ultrasound and perfusion analysis. Clin Hemorheol Microcirc. 2009;43:141-8
33. Pizarro TT, Pastorelli L, Bamias G, Garg RR, Reuter BK, Mercado JR. et al. SAMP1/YitFc mouse strain: a spontaneous model of Crohn's disease-like ileitis. Inflamm Bowel Dis. 2011;17:2566-84
34. Wang H, Kaneko OF, Tian L, Hristov D, Willmann JK. Three-Dimensional Ultrasound Molecular Imaging of Angiogenesis in Colon Cancer Using a Clinical Matrix Array Ultrasound Transducer. Investigative radiology. 2015;50:322-9
Author contact
![]() Corresponding author: Jürgen K. Willmann, M.D., Department of Radiology, Molecular Imaging Program at Stanford, School of Medicine, Stanford University, 300 Pasteur Drive, Room H1307, Stanford, CA 94305-5621. P: 650-723-5424; Fax: 650-723-1909; Email: willmannedu
Corresponding author: Jürgen K. Willmann, M.D., Department of Radiology, Molecular Imaging Program at Stanford, School of Medicine, Stanford University, 300 Pasteur Drive, Room H1307, Stanford, CA 94305-5621. P: 650-723-5424; Fax: 650-723-1909; Email: willmannedu