Impact Factor
 Global reach, higher impact
Theranostics 2016; 6(1):65-77. doi:10.7150/thno.12350 This issue Cite
Research Paper
Glycoproteomic Approach Identifies KRAS as a Positive Regulator of CREG1 in Non-small Cell Lung Cancer Cells
David J. Clark1,2, Yuping Mei1, Shisheng Sun3, Hui Zhang3, Austin J. Yang2, Li Mao1,2 ![]()
1. Department of Oncology and Diagnostic Sciences, University of Maryland School of Dentistry, Baltimore, MD
2. Marlene and Stewart Greenebaum Cancer Center, University of Maryland, Baltimore, MD
3. Department of Pathology, John Hopkins University, Baltimore, MD
Received 2015-4-8; Accepted 2015-9-9; Published 2016-1-1
Abstract

Protein glycosylation plays a fundamental role in a multitude of biological processes, and the associated aberrant expression of glycoproteins in cancer has made them attractive biomarkers and therapeutic targets. In this study, we examined differentially expressed glycoproteins in cell lines derived from three different states of lung tumorigenesis: an immortalized bronchial epithelial cell (HBE) line, a non-small cell lung cancer (NSCLC) cell line harboring a Kirsten rat sarcoma viral oncogene homolog (KRAS) activation mutation and a NSCLC cell line harboring an epidermal growth factor receptor (EGFR) activation deletion. Using a Triple SILAC proteomic quantification strategy paired with hydrazide chemistry N-linked glycopeptide enrichment, we quantified 118 glycopeptides in the three cell lines derived from 82 glycoproteins. Proteomic profiling revealed 27 glycopeptides overexpressed in both NSCLC cell lines, 6 glycopeptides overexpressed only in the EGFR mutant cells and 19 glycopeptides overexpressed only in the KRAS mutant cells. Further investigation of a panel of NSCLC cell lines found that Cellular repressor of E1A-stimulated genes (CREG1) overexpression was closely correlated with KRAS mutation status in NSCLC cells and could be down-regulated by inhibition of KRAS expression. Our results indicate that CREG1 is a down-stream effector of KRAS in a sub-type of NSCLC cells and a novel candidate biomarker or therapeutic target for KRAS mutant NSCLC.
Keywords: KRAS, non-small cell lung cancer (NSCLC), adenocarcinoma, quantitative glycoproteomics, glycoprotein
Introduction
Lung cancer is the leading cause of cancer-related death in the world, with over 221,000 estimated new cases and 158,000 estimated related deaths in 2015 in the United States alone [1]. Such a poor outcome is largely due to the late diagnosis of the disease as the 5-year survival rate for patients with advanced disease is less than 10%, compared to 70% for those with early stage disease [2]. A recent screening trial using low-dose computed-tomography (CT) revealed the screening technique reduced lung cancer associated mortality by 20% compared to chest radiography [3]. However, the screening resulted in a high false positive rate (96.4%), leading to unnecessary and invasive follow-up procedures.
Lung cancer is heterogeneous and consists of small cell lung cancer (SCLC) and non-small cell lung cancer (NSCLC). Most of lung cancer cases (80%) are classified as NSCLC and can be further sub-classified into adenocarcinoma, squamous cell carcinoma and large cell carcinoma, with adenocarcinoma as the most common subtype [4]. In adenocarcinoma, mutations in epidermal growth factor receptor (EGFR) and Kirsten rat sarcoma viral oncogene homolog (KRAS) are two prominent distinctive and non-overlapping events. The Lung Cancer Mutation Consortium examined approximately 800 lung adenocarcinomas and identified KRAS and EGFR mutations in 22% and 17% of the tumors, respectively [5]. These different mutations correlate with distinct prognoses, but more importantly with responses to different therapeutic agents [6], which was the basis of Biomarker-Integrated Approaches of Targeted Therapy for Lung Cancer Elimination (BATTLE) trial, wherein biomarker-based analysis of biopsy specimens was used to adaptively randomize lung cancer patients to treatment arms specific to individual molecular alterations [7].
Glycosylation is the most common post-translational modification of proteins, with an estimated 50% of all mammalian proteins being glycosylated [8]. N-linked glycosylation plays a key role in several cellular processes, such as cell communication, signaling and cell adhesion, and altered N-linked glycosylation has been considered as a key factor in tumorigenesis [9]. Abnormal expression of N-linked glycoproteins has been reported in various body fluids of patients with NSCLC [10-13]. However, these studies typically used patients' clinical and pathological parameters in their analysis without incorporating genomic information of the tumors. While a study examining the effect of KRAS-activation on the glycoprotein and global protein expression profiles revealed differentially expressed proteins [14], the potential influence of aberrant EGFR signaling on glycosylation and glycoprotein expression in lung cancer has yet to be explored, with most studies focusing on glycosylation of EGFR itself [15,16], or the downstream phosphorylation events [17,18].
Although KRAS and EGFR mutations are mutually exclusive in lung adenocarcinomas, increased constitutive EGFR signaling, through either mutation or overexpression of the protein, can cause enhanced KRAS activity leading to increased Raf/ERK/MAPK activation [19], activation of the PI3K/AKT/mTOR pathway and an increase in STAT signaling [20]. However, it remains unclear what differences mutant KRAS can illicit in these signaling pathways comparing to a mutational activation of EGFR, particularly on the expression of glycoproteins. In this study, we investigated the differences in the N-linked glycoproteome between a human bronchial epithelial (HBE) cell line and two NSCLC cell lines with a mutation in either KRAS or EGFR. Our quantitative proteomics analysis employed Stable Isotope Labeling by Amino Acids in Cell Culture (SILAC) paired with hydrazide chemistry to reveal expression levels of N-linked glycoproteins between the two NSCLC cell lines compared to the HBE line. We then expanded our analysis to include a panel of additional NSCLC cell lines to assess which glycoprotein's overexpression was common among cell lines with mutations in the same signaling molecule. We identified the glycoprotein CREG1 to be overexpressed in KRAS-mutant NSCLC cell lines and determined its overexpression was regulated by KRAS. We validated these results in a small panel of lung tumor samples, revealing a novel protein regulated by mutant KRAS in NSCLC.
Materials and Methods
Materials
Non-small cell lung cancer cell lines A549, H157, H358, H441, H460, H1975, H2279, and HCC827 and colon cancer cell lines HT-29, HCT116, CaCo2, SW480, and SW620 were purchased from American Type Culture Collection (ATCC, Manassas, VA). CDK4 (cyclin-dependent kinase 4)/hTERT (human telomerase reverse transcriptase)-immortalized human bronchial epithelial cells (HBEC4) were a gift from Dr. John Minna (University of Southwestern Medical Center, Dallas, TX). Keratinocyte-SFM media, Keratinocyte-SFM supplements, DMEM media, SILAC DMEM media, fetal bovine serum, dialyzed fetal bovine serum, 100 U/mL penicillin/streptomycin were from Life Technologies (Grand Island, NY). SILAC isotopes: 4,4,5,5-D4-L-lysine (K4) and 13C614N4-L-arginine (R6) or 13C615N2-L-lysine (K8) and 13C615N4-L-arginine (R10) were from Sigma Aldrich (St. Louis, MO). Trypsin was obtained from Thermo Scientific (Waltham, MA) Hydrazine resin was from Bio-Rad (Hercules, CA) and PNGase F was from New England Biolabs (Ipswich, MA). Mouse anti-CLPTM1 (G-7) and rabbit anti-EGFR (1005) were from Santa Cruz Biotechnology (Dallas, TX), rabbit anti-TMEM106B (A303-439) was from Bethyl Laboratories, Inc (Montgomery, TX), mouse anti-CREG1 (1B7) and mouse anti-β-actin (AC-15) were from Sigma-Aldrich (St. Louis, MO), rabbit anti-KRAS (PA5-27234) was from Thermo Scientific (Waltham, MA). BCA assay kit Pierce (Rockford, IL); SAX and C18 Solid Phase Extraction Disk were from 3M (St Paul, MN), and C18 resin was from Prospereon Life Science (Arlington Height, IL).
Tumor sample characterization
Primary NSCLC tissues were obtained as described previously [21]. In brief, tissues were from patients underwent surgical resection were obtained from Department of Pathology, the University of Texas MD Anderson Cancer Center according to protocols approved by the Institutional Review Boards. Clinical and pathological characteristics were assigned to each sample used in this study, but provided de-identified to the investigators. Tumor DNA was extracted from tissue samples and subjected to Exosome Capture Sequencing. DNA sequencing and bioinformatics analysis was performed by BGI Americas http://bgiamericas.com/ (Cambridge, MA)
Cell Culture
HBE4 cells were grown in K-SFM medium supplemented with 50 μg/mL bovine pituitary extract (BPE) and 5 ng/mL recombinant EGF as previously described [22]. A549, H157, H358, H441, H460, H1975, H2279, and HCC827 lung cancer cell lines were grown and maintained in DMEM media with 10% fetal bovine serum and 100 U/mL penicillin/streptomycin. Colon cancer cell lines HT-29, HCT116, SW480, and SW620 were grown and maintained in DMEM media with 10% fetal bovine serum and 100 U/mL penicillin/streptomycin; Caco2 grown and maintained in DMEM media with 20% fetal bovine serum and 100 U/mL penicillin/streptomycin. For SILAC labeling A549 and HCC827 cells were grown in SILAC media with 10% dialyzed fetal bovine serum and 100 U/mL penicillin/streptomycin supplemented with 4,4,5,5-D4-L-lysine (K4) and 13C614N4-L-arginine (R6) (medium) or 13C615N2-L-lysine (K8) and 13C615N4-L-arginine (R10) (heavy), respectively. After ten cell doublings, the incorporation of the stable isotopes was >98% as determined by LC-MS/MS analysis of tryptic peptides isolated from medium-Lys4/Arg6- and heavy-Lys8/Arg10-labeled cells. All cell lines were maintained at 37 ºC and 5% CO2 in a humidified incubator.
Cell harvest, lysis, and Tryptic Digestion
To prepare cell lysates for SILAC experiments, cell were grown to 90% confluence, washed with a volume of PBS twice, scrapped, collected and centrifuged at 3,000 x g. The cell pellet was resuspended in lysis buffer (8 M urea, 50 mM NH4HCO3, 0.1% SDS) and mechanically lysed using Bullet Blender ® Beads (Next Advance) to ensure complete sample homogenization. Samples were centrifuged at 14,000 x g for 10 minutes at 4ºC and the resulting supernatant retained. Protein concentration of the cell lysate supernatant was measured via BCA Protein Assay. 350 μg of cell lysate from HBEC4-K0R0, A549-K4R6, and HCC827-K8R10 were mixed in a 1:1:1 ratio, reduced with 10 mM tris(2-carboxyethyl)phosphine (TCEP), and alkylated with 15 mM iodoacetamide. Excess iodoacetamide was quenched by adding 30 mM dithiothretiol. The urea concentration in the sample was reduced to 1 M urea with 50 mM NH4HCO3, and proteins were digested with 20 μg of trypsin/mg protein overnight at 37ºC. A second aliquot of 20 μg of trypsin/mg protein was added, and the samples incubated for 6 additional hours. Protein digestion was stopped by adding formic acid at a 3% final concentration.
Isolation of N-linked glycopeptides
The glycosylated peptides were enriched and isolated from the triple SILAC cell lysate mixture using solid-phase extraction of N-glycoprotein (SPEG) method as previously described, with minor modifications [23]. Briefly, tryptic peptides were desalted using SepPak C18 columns (Waters), oxidized with 10 mM sodium periodate, and incubated at room temperature for 1 hour. Peptides were desalted using C18 prior to conjugation to hydrazine resin via overnight coupling in 80% acetonitrile, 0.1% TFA (trifluoroacetic acid), and 1% aniline. Nonglycosylated peptides were removed via washing the resin three times each with 1 mL of 50% acetonitrile, 1.5 M NaCl, HPLC-H2O, and 25 mM NH4HCO3. N-linked glycopeptides were released from the resin by incubation overnight with 3 μL of PNGase F in 25 mM NH4HCO3. Released peptides were collected after centrifugation at 3,000 x g, the resin was then rinsed with 50% acetonitrile twice and pooled. The peptide solution was desalted, dried, and reconstituted in 0.1% formic acid and subjected to MS analysis.
MS analyses of N-linked glycopeptides
Peptides were separated by nanoscale reversed-phase liquid chromatography using an Xtreme Simple nanoLC system (CVC/Micro-Tech). The analytical column was prepared by packing 1.7 μm 200 Å C18 resin into a laser-pulled fused silica capillary (75 μm inner diameter, 10.5 cm length, 10 μm tip; Sutter Instruments) using a pressure injection cell (Next Advance). Peptides were injected into the sample loop using an Endurance autosampler (Spark Holland) and were loaded onto the column with 95% solvent A (0.5% acetic acid in water). A 180 min LC gradient method from 5 to 35% solvent B (60% acetonitrile, 0.5% acetic acid) with a postsplit flow of 0.3 μL/min was used to elute the peptides into the mass spectrometer. The LTQ-Orbitrap XL_mass spectrometer (Thermo Electron) was equipped with a nanospray ionization source. The spray voltage was 1.7 kV and the heated capillary temperature was 180ºC. MS1 data were acquired in profile mode in the Orbitrap with a resolution of 60,000 at 400 m/z, and the top 10 most intense ions in each MS1 scan were selected for collision induced dissociation in the linear ion trap. Dynamic exclusion was enabled with a repeat count 2, repeat duration 30 s, and exclusion duration 180 s. Other mass spectrometry data generation parameters were as follows: collision energy 35%, ion selection threshold for MS/MS 500 counts, isolation width 3 m/z, default charge state 3, and charge state screening enabled.
Database Searching and Data Processing
MSConvert (v3.06736) was used to convert the acquired RAW files to mzML. Database searches and PSM validation were performed in the Trans-Proteomic Pipeline (TPP) [24]. Comet (v2014.1) was used to perform the database searches against a UniProtKB human protein database (version July, 2014; 40,826 reviewed sequences; 48,167 unreviewed sequences) with a concatenated reverse sequence decoy database [25]. Search parameters include 50 ppm peptide mass tolerance, 1.0 Da fragment tolerance, variable modification: Methionine + 15.99492, Lysine + 4.02511 (D4), Lysine + 8.01420 (13C615N2), Arginine + 6.02013 (13C6), Arginine + 10.00827 (13C615N4), and Asparagine + 0.984016, and the following fixed modifications: Cysteine + 57.02510 (carbamidomethylation); semi-tryptic peptides with up to three missed cleavages. PeptideProphet was used to validate the peptide search results from Comet and only peptide identifications with greater than 0.8 probability, with a calculated false positive rate < 4%, were kept for quantification. QuantiMORE (formerly IsoQuant) was employed to calculate the peptide ratios for the validated peptides in each replicate [26]. The software is available for download at the following web address: http://www.proteomeumb.org/MZw.html. Heat mapping of QuantiMORE peptide ratios was performed using QCanvas version 1.2 [27]. The mass spectrometry proteomics data, including raw MS data, COMET search results, and QuantiMORE result files, have been deposited to the ProteomeXchange Consortium [28] via the PRIDE partner repository with the data set identifier PXD001999.
Cell transfection and RNA interference
A549, H358, H441, and H460 cell lines were cultured in a 6-well format and transfected as previously described [29]. In brief, cells were seeded in DMEM media with 10% fetal bovine serum. After 24 hours, cells were transfected with select siRNA fragment in Opti-MEME media (Invitrogen) using Lipofectamine RNAiMAX (Invitrogen). The RNA interference target site of human KRAS coding sequence was: 5'-CCUUGACGAUACAGCUAAU-3' (245-264), of human CREG1 coding sequence: 5'-CCAGCCATAATTGGTTCTTTT-3' ,and the corresponding scrambled sequence used as a control was 5- GAUACCAAGGGACAUACGCUU-3'. Cells were harvested 24 and 48 hours post-transfection, respectively, and prepared for western blotting analysis.
Real-time quantitative PCR - Quantitative reverse transcriptase-PCR analysis was performed as described previously [29] to measure transcript levels of KRAS and CREG1. All PCR reactions were performed on 7900 fast real-time detection with TaqMan RT-PCR method (Applied Biosystems). Glyceraldehyde 3-phosphate dehydrogenase was used as a reference control for normalization. Primers used were: KRAS: fwd 5'-TACAGTGCAATGAGGGACCA-3', rev 5'-TCCTGAGCCTGTTTTGTGTCT-3'; CREG1: fwd 5'-TGGATATTGCAAAGCATTCG-3', rev 5'-TCTGGTGTCACGATTTTTGG-3'; and GAPDH: fwd 5'TGCACCACCAACTGCTTAGC-3', rev 5'-GGCATGGACTGTGGTCATGAG-3'.
Cell Proliferation Assay
Cell proliferation was measured post-transfection using 3-(4,5-dimethylthiazol-2-yl)-2,5-diphenyltetrazolium bromide (MTT) assay. MTT (5 mg/mL) was added to cells and incubated in cell culturing conditions for 2 h, media removed, and formazan dissolved in DMSO. Assay measured surviving cells and optical density (OD) values were measured using an Epoch plate reader (Biotek) at 570 nm wavelength.
Xcelligence Cell Migration Assay - Cell migration was measured 24-hour post-transfection using 16-well cell invasion and migration (CIM) plates (Acea Biosciences). Cells were grown in reduced FBS (5%) for 24 hours. 160 μL of complete media was added to the lower chamber of the CIM plate. The cells were added to the upper chamber of the CIM plate at a density of 5 x 10⁴/well. The migration of the cells into the bottom chamber was monitored for 72 hours using the Xcelligence RTCA SP instrument (Acea Biosciences), and the cell index recorded approximately every 15 minutes. Data was analyzed using RTCA software (ver. 1.2.1) and reported values are not CI-normalized.
Immunoblotting
For immune detection, cultured cells were lysed in Tris-HCl, pH 7.5 and 4% SDS, sonicated at 90% amplitude, 0.5 s cycle and boiled at 95 ºC. Tumor tissue samples were lysed in 4 mM HEPES, pH 7.5, 0.32 M sucrose, 2% SDS and mechanically lysed using Bullet Blender ® Beads (Next Advance) to ensure complete sample homogenization. Lysates were mixed with Lamellie buffer with 50 mM DTT and separate using 12% SDS-polyacrylamide gels with TGS running buffer. Following electrophoresis, proteins were electrotransferred onto a polyvinylidene fluoride (PVDF) membrane. After being blocked in 5% nonfat milk in TBST for 1 h at RT, the membrane was probed with the appropriate primary antibody overnight at 4 ºC. HRP- conjugated secondary antibodies (goat anti-mouse, or goat anti-rabbit) were diluted 1:5000 and detected using SuperSignal West Pico Chemiluminescent Substrate (Pierce, Rockford, IL).
Statistical Analysis
The results are reported as mean ± s.d., and are indicated in the figure legends. Data sets were analyzed for statistical significance using Student's paired t-test. Statistical significance was reported as p-values < 0.05 (*), < 0.01 (**), and < 0.005 (***).
Results
Overexpressed N-linked glycoproteins in NSCLC cells detected using SILAC
Two distinct, non-overlapping mutations in adenocarcinomas include genomic alterations in the signaling proteins EGFR and KRAS that can result in constitutive activation and enhanced downstream signaling. Since EGFR is located upstream of KRAS in the EGFR-signaling cascade, we aimed to elucidate glycoprotein profile patterns that are common and unique to the respective mutations of these genes in NSCLC cells. To identify and quantify expression levels of N-linked glycoproteins in cells with either EGFR or KRAS mutation, we designed a Triple SILAC-based/N-linked glycopeptide enrichment workflow as illustrated in Figure 1. The two NSCLC cell lines were differentially isotopically labeled: A549 cells which harbor a G12S KRAS mutation were labeled with “medium” (M - K4R6) isotope whereas HCC827 cells which harbor a E745-A750 EGFR deletion were labeled with “heavy” (H - K8R10) isotope. The third cell line, an immortalized bronchial epithelial cell line HBE4, was “light” (L - K0R0) containing endogenous lysine and arginine.
Schematic of our Triple SILAC paired with SPEG quantitative analysis strategy. Three cell lines are differentially labeled isotopically and mixed prior to enzyme digestion. Glycopeptides are conjugated onto a solid support and release with PNGase F prior to LC-MS/MS analysis. Glycopeptides are identified at the MS/MS level and quantified at the MS level using QuantiMORE.
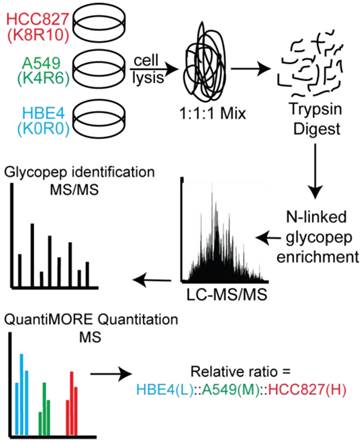
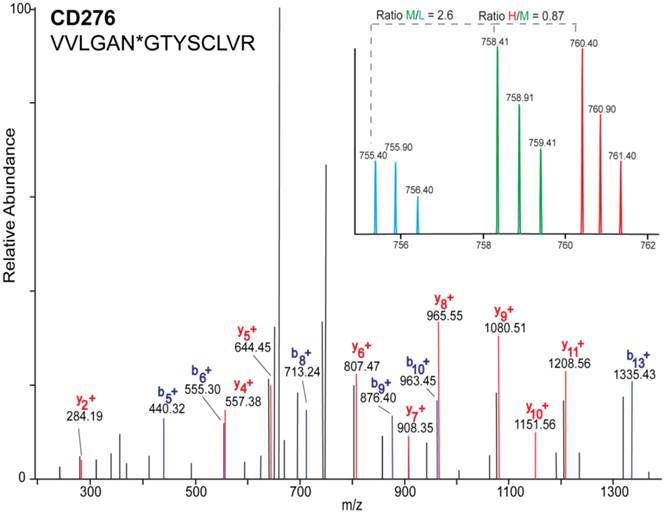
The sample was combined in a 1:1:1 ratio and subjected to trypsin digestion, with the N-linked glycopeptides enriched using solid-phase extraction of N-glycoprotein (SPEG) prior to LC-MS/MS analysis. The MS/MS spectra were searched and validated using the Trans Proteomic Pipeline (TPP) with a Peptide Prophet probability 0.8 filter (FDR < 0.04 for all three replicates). We quantified the expression levels of glycopeptides using QuantiMORE, which reported a median ratio between H/L|M/L|H/M of 1.00|1.05|0.94 for the three technical replicates. The pooled data from three replicates quantified a total of one hundred eighteen unique glycopeptides from eighty-two glycoproteins. These glycopeptides were identified in at least two of the replicates and contained known N-linked glycosylation consensus sequence of N-X-S/T (where X is an amino acid except for proline) (Additional File 1: Table S1). Twenty-seven (23%) of the glycopeptides were found to be overexpressed (peptide ratios > 1.5; H/L and M/L) in both NSCLC cell lines, including glycopeptides derived from the glycoproteins, such as CD166, CD276, and CD97, as well as Tetraspanin 3 and 6, and Desmoglein 2. An example of the identification of a CD276 glycopeptide and the mapping of the glycosite via LC-MS/MS is presented in Figure 2. The inset displays representative MS1 spectra of the identified peptide which QuantiMORE used to quantify the glycopeptide expression levels among the three cell lines. We found six (5%) overexpressed glycopeptides in HCC827 cells, including glycopeptides derived from epidermal growth factor receptor (EGFR), Myelin protein zero-like protein 2 and N-acetylglucosamine-6-sulfatase. In A549 cells, nineteen glycopeptides (16%) were overexpressed, including glycopeptides derived from glycoproteins CD109, Cleft lip palate and transmembrane protein 1 (CLPTM1), Neuroplastin, Transmembrane protein 106B (TMEM106B), and Cellular repressor of E1A-stimulated genes (CREG1). Identification of the respective glycopeptides derived from EGFR and CREG1 with the corresponding MS1-level quantification can be seen in Additional File 2: Figure S1. To visualize differences in the glycopeptide expression between the three cell lines, we generated a heat map of overexpressed glycopeptides with the corresponding log2 fold change comparing HCC827/ HBE4 and A549/HBE4 as seen in Table 1.
Heat map and overexpressed glycopeptides identified. Listed ratios are log2 values of QuantiMORE HCC827/HBE4 (H/L) and A549/HBE4 (M/L) reported ratios. Glycopeptides overexpressed in both NSCLC cell lines (top), KRAS mutant A549 only (middle), and EGFR mutant HCC827 only (bottom) are listed.
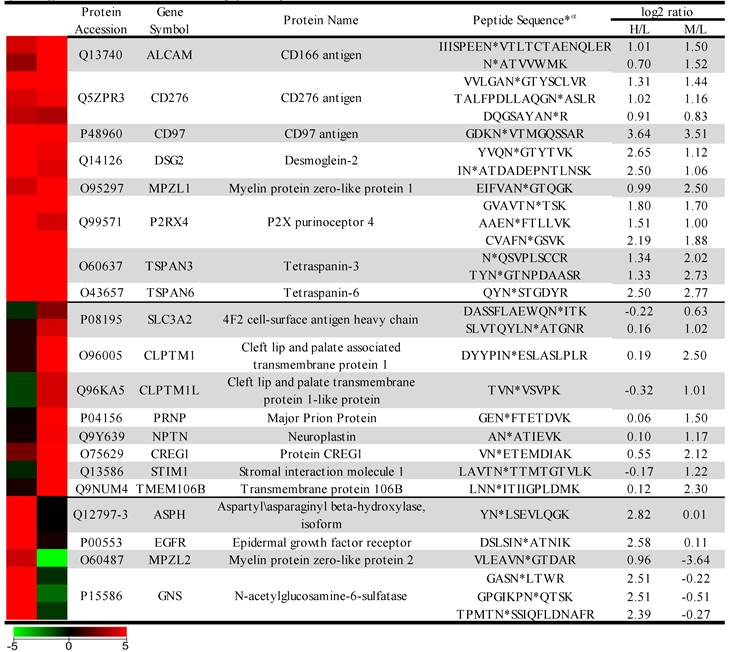
α* denotes location of the identified glycosite in the quantified glycopeptide.
MS/MS mass spectrum of the identified glycopeptide VVLNGTYSCLVR derived from CD276. b- (blue) and y- (red) fragments allow for the mapping of the site of glycosylation as indicated by asterisk(*). Inset is representative MS1 spectrum of the quantified glycopeptide derived from each cell line: HBE4-L (light blue), A549-M (green), and HCC827-H (red).
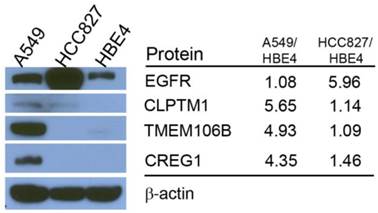
Differences in reported glycopeptide expression values can occur in two ways: similar protein expression levels between the three cell lines with increased glycosite occupancy by glycan structures, or similar glycosite occupancy between the three cell lines with differences in total glycoprotein expression. To determine whether glycopeptide overexpression was due to an increased occupancy of the glycosylation sites or due to an increase protein levels, we analyzed the expression levels of selected proteins using immunoblotting. EGFR protein level was found to be highest in HCC827 cells, which is consistent with the Triple SILAC N-linked glycopeptide data (Fig. 3). The expression levels of TMEM106B and CREG1 were significantly higher in A549 cells, which is also consistent with the glycopeptide data wherein we observed almost a 4-fold difference in the expression levels of these glycoproteins compared with other cell lines (Fig. 3). In the glycopeptide analysis, CLPTM1 was observed to be overexpressed in A549 cells. However, the difference of total protein expression levels was not as dramatic in the immunoblotting with only a modest increase in A549 cells compared to HCC827 and HBE4 cells (Fig. 3).
Comparison of total protein expression differences and glycopeptide ratios determined by QuantiMORE. Western blotting analysis of select glycoproteins (left), with corresponding reported glycopeptide ratios from the Triple SILAC proteomic analysis (right). β-actin served as a loading control.
Impact of KRAS mutation in glycoprotein levels in A549 cells
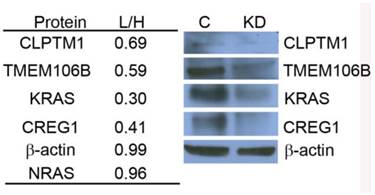
Using the Triple SILAC proteomic analysis, we observed nineteen glycopeptides that were overexpressed in A549 cells (Additional File 1: Table S1). With the larger number of overexpressed glycoproteins unique to this cell line that might serve as candidate biomarkers of constitutive KRAS activity, we chose to focus on elucidating the potential role of KRAS regulating these glycoproteins. A siRNA knockdown strategy was designed to target KRAS expression and assess the expression patterns of selected glycoproteins found to be overexpressed in the cell line A549. To evaluate the impact of reduced KRAS expression on multiple candidate proteins at once, we employed a double SILAC strategy, wherein isotopically labeled A549-K4R6 (H) cells were mixed with siRNA-KRASA549-K0R0 (L) cells and analyzed via LC-MS/MS. In this analysis, we found that the siRNA treated cells had a 3-fold decrease in expression of the KRAS protein as reported by a QuantiMORE protein ratio of siRNA-KRASA549-K0R0/A549-K4R6 (L/H) of 0.30, whereas expression levels of both NRAS and β-actin remained in a close 1:1 ratio (Fig.4). This suggests that our siRNA strategy was successful in reducing the KRAS protein level. We further observed reduced expression levels of several overexpressed N-linked glycoproteins in the siRNA treated A549 cells, including CREG1, TMEM106B and CLPTM1 (Fig. 4 and Additional File 2: Fig. S2). We verified these results via Western blotting, with the expression levels of KRAS, CLPTM1, TMEM106B and CREG1 reduced in the siRNA treated cells (KD) compared to the cells treated with control siRNA (C) as shown in Figure 4. These results together suggest that constitutive activation of KRAS leads to an overexpression of these select glycoproteins, and this identified panel of novel glycoproteins regulated by KRAS might serve as markers of mutant KRAS in NSCLC.
KRAS regulates selected glycoprotein expression in A549. siRNA targeted knockdown of KRAS reduced expression of CLPTM1, TMEM106B, and CREG1. siRNA-KRASA549-K0R0/A549-K4R6 (L/H) QuantiMORE reported protein ratios (left), and Western blotting analysis verifying QuantiMORE data (right). β-actin served as a loading control.
Validation of the role of KRAS mutations in regulating expression of the glycoproteins
Previously it has been shown that mutations in the KRAS gene can vary in NSCLC, most commonly occurring in codon 12, but additional mutations have been observed in codons 13 and 61 [30]. Furthermore, distinct amino acid substitutions in these various codons can result in different progression-free survival rates and downstream signaling pathway activation. To inform the potential clinical biomarker utility of CLPTM1, TMEM106B and CREG1 identified in our glycoproteomic analysis, we determined the overexpression pattern of these glycoproteins in other NSCLC cell lines harboring different KRAS mutations. Cell lines H157 (G12R), H358 (G12C), H441 (G12V), and H460 (Q61H) were included in an immunoblot analysis of glycoprotein expression levels. Two additional NSCLC cell lines with EGFR mutations were also analyzed, including H1975 that carries L858R and T790M mutations and H2279 that contains E745-A750 deletion. Table 2 displays the histology classification of the cell lines, KRAS mutation status and additional mutation statuses of the selected cell lines used in the Western blot analysis. CLPTM1 protein expression was highest in H157 cells, whereas the remaining cell lines displayed low CLPTM1 level, making it difficult to ascertain whether there was a significant difference in expression between the KRAS-mutant cell lines and the remaining cell lines (Fig. 5A). As expected, TMEM106B displayed a strong expression pattern in A549 cells, but also in H157 and H1975 cells. CREG1 was overexpressed in four of the lung adenocarcinoma cell lines harboring KRAS mutations (A549, H358, H441 and H460) but not in NSCLC cell lines with wild-type KRAS or the lung squamous cell carcinoma line (H157), suggesting a relationship between CREG1 expression and KRAS mutations in adenocarcinomas.
NSCLC cell lines for expanded glycoprotein expression analysis
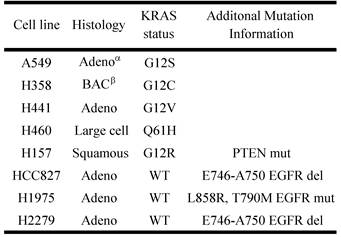
αAdeno - adenocarcinoma; β BAC - bronchialveolar carcinoma
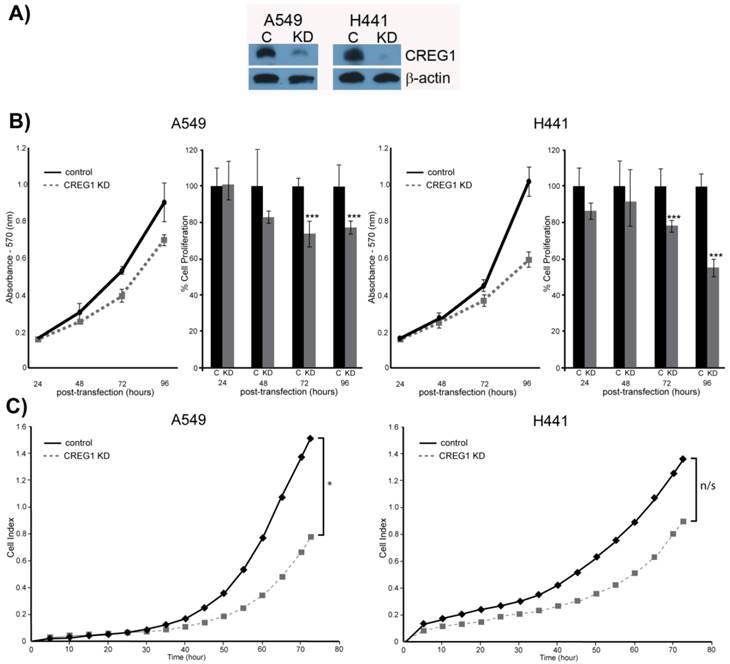
CREG1 is overexpressed in cell harboring KRAS mutations. (A) Total protein expression profile of CLPTM1, TMEM106B, and CREG1 in several NSCLC cell lines with wild-type-KRAS (WT) and varying mutations in KRAS. (B) siRNA targeted knockdown of KRAS reduced expression of CREG1 in KRAS mutant NSCLC cell lines. β-actin served as a loading control. (C) KRAS and CREG1 mRNA levels in H358, H441, and H460 cell lines transfected with KRAS siRNA or control siRNA relative to GAPDH mRNA expression. Error bars represent mean s.d. and **p<0.01. (D) CREG1 expression in lung tumor lysates from patients displaying wild-type (WT) or mutant KRAS.
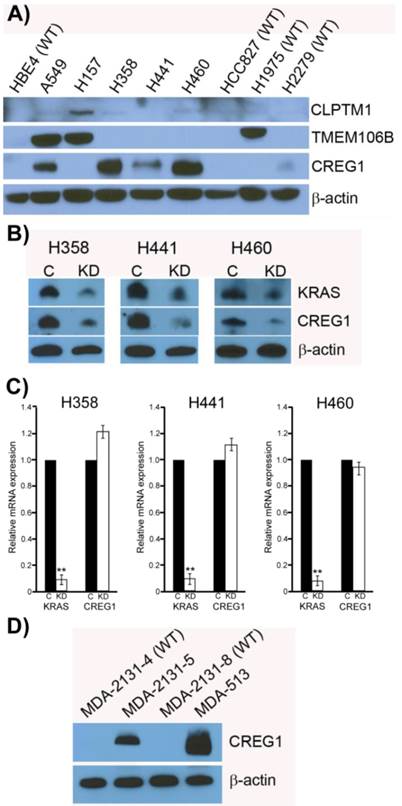
To determine if CREG1 expression was regulated by KRAS in these additional NSCLC cell lines as we observed in A549 cells, we used siRNA strategy to abrogate KRAS protein expression levels and assessed its impact on CREG1 protein levels. As shown in Figure 5B, reducing the expression of KRAS by the siRNA treatment resulted in a similar decrease of CREG1 protein levels in cell lines H358, H441, and H460. To determine whether KRAS regulates CREG expression at either the transcriptional or translational level, we performed quantitative reverse transcriptase-PCR to measure both KRAS and CREG1 mRNA levels after siRNA-mediated KRAS knockdown. In the cell lines H358, H441, and H460, KRAS mRNA levels were reduced to less than 10% of that of controls, whereas CREG1 mRNA levels were not significantly reduced (Fig. 5C). Taken together, these findings are indicative of KRAS regulation of CREG1 occurring at either the translational or post-translational level.
To determine if the relationship between KRAS mutation and CREG1 protein levels is also present in vivo, we analyzed the expression of CREG1 in primary NSCLC graft tissues (Table 3) with either wild-type KRAS or mutant KRAS. These tissues were analyzed for mutations in several cancer “driver” genes including KRAS, revealing tumors MDA-2131-4 and MDA-2131-8 contained no mutations in the KRAS gene, whereas tumor samples MDA-2131-5 and MDA-513 contained a G12C and G12V missense mutation in the KRAS gene, respectively. As seen in Figure 5D, tumor samples harboring a mutation in KRAS displayed high levels of CREG1 protein, relative to tumor samples with wild-type KRAS that displayed no CREG1 expression. Taken together these results indicate that CREG1 expression is regulated by KRAS at the post-transcriptional level and overexpression of CREG1 may serve as a unique protein marker of KRAS mutations in NSCLC.
Clinical and pathological characteristics of selected lung tumors
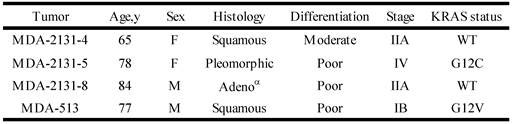
αAdeno - adenocarcinoma
CREG has a functional role in cell proliferation and migration in NSCLC cells
Observing overexpression of CREG1 in NSCLC cells with a KRAS mutation prompted us to explore the potential role of CREG1 in lung carcinogenesis. We examined the impact of CREG1 expression on two aspects of lung cancer progression: cell proliferation and cell migration. Using a targeted siRNA knockdown strategy, we transfected our select NSCLC cell lines (A549 and H441) with CREG1 siRNA, and observed a significant decrease in CREG1 protein levels relative to cells transfected with control siRNA (Fig. 6A). We then investigated the impact of reduced CREG1 expression on cell proliferation in A549 and H441 cell lines. Cells were cultured for a total of four days post-transfection and a MTT assay was utilized to measure differences in cell survival between our two experimental conditions. In both cell lines, we observed a significant decrease (~20%) in cell numbers 72 h post-transfection relative to control as a result of CREG1 knockdown (Fig. 6B); suggesting CREG1 is promoting proliferation of the KRAS mutant NSCLC cells. This significant reduction in cell proliferation was also observed 96 h post-transfection in both cell lines with H441 displaying a more striking reduction of cell numbers (~40%). Next, we determined the impact of CREG1 expression on cell migration in NSCLC cells, measuring the electrical impedance of migrating cells in a dual-chamber plate using the Xcelligence system. Cells were transfected with siRNA targeting CREG1, and seeded 24 h post-transfection. We monitored real-time migration of A549 and H441 cells over 72 h and found that reduced CREG1 expression impaired the cells migration capacity relative to the control (Fig. 6C). This observation was most significant in A549 cells, whereas in H441 cells the impairment was more modest. Collectively, these results indicate that CREG1 expression can affect proliferation and migration of KRAS mutant NSCLC cells.
CREG1 impacts cell proliferation and cell migration. (A) siRNA targeted knockdown of CREG1 reduced expression of CREG1 in select NSCLC cell lines. β-actin served as a loading control. (B) MTT assay measurements comparing siRNA targeted knockdown of CREG1 compared to control in cell lines A549 and H441, and a bar graph displaying percentage of cell proliferation in CREG knockdown condition relative to control. Error bars represent mean s.d. and ***p<0.005. (C) Migration profile obtained using Xcelligence system comparing siRNA targeted knockdown of CREG1 compared to control in cell lines A549 and H441. Cell index measurements were recorded every 15 minutes, but to improve clarity data points from every 5 hours were plotted. *p<0.05, n/s - non-significant.
CREG expression in colorectal cancer cell lines
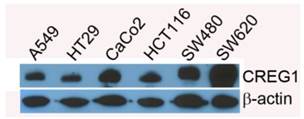
In addition to lung cancer, KRAS mutations occur in a significant number of colorectal cancers (20-35%) [31], which prompted us to evaluate CREG1 expression in a panel of colorectal cancer cell lines harboring either wild-type KRAS or mutant KRAS. For this analysis, we probed cell lines HT29 and CaCo2 which express wild-type KRAS, and cell lines with mutations in KRAS including HCT116 (G13D), SW480 (G12V), and SW620 (G12V). We found that CREG1 to be expressed in all of these colorectal cancer cell lines, displaying similar, or even increased, protein levels of CREG1 relative to A549 (Fig. 7).
CREG1 expression does not correlate with KRAS mutation status in colorectal cancer. Total protein expression profile of CREG1 in several colorectal cancer cell lines with wild-type-KRAS and varying mutations in KRAS.
Discussion
Aberrant protein glycosylation has been associated with cancer and its biological features, with alterations in glycoprotein expression, being correlated with cancer development and progression [32]. To study glycoprotein expression, researchers have developed a strategy called solid-phase extraction of N-linked glycopeptides (SPEG) to isolate N-linked glycopeptides from biological samples, wherein digested peptides are conjugated to a hydrazide resin and specifically released using peptide-N-glycosidase F [33]. This strategy has been used to identify glycoprotein expression patterns and alterations in a variety of cancer types including ovarian [34], prostate cancer [35], breast cancer [36], and lung cancer [12,37]. A limitation of the SPEG technique we used in this study is that it is protein-centric, and information regarding the structure and composition of attached glycan is lost. However, the strategy can be modified [38-40] or paired with lectin-affinity in future experiments to elucidate the associated glycan profile.
In this study, we examined differences in glycopeptide expression that result from two distinct, non-overlapping mutations in the signaling proteins KRAS and EGFR that occur in NSCLC adenocarcinomas using a Triple SILAC approach paired with SPEG enrichment in an attempt to identify protein markers of these respective mutations. Inherent benefits with this strategy include SPEG glycopeptide capture reducing the complexity of our sample analysis while also enriching for low abundant glycoproteins that might not otherwise be identified. In addition, metabolic labeling of our cell lines and combining our samples prior to digestion and enrichment steps allows for more accurate quantitation, as sample variation is reduced. Using this strategy, we identified twenty-seven glycopeptides derived from eighteen glycoproteins that were overexpressed in both A549 and HCC827 cells compared to HBE4 cells, six glycopeptides derived from three glycoproteins that were overexpressed only in HCC827 cells and nineteen glycopeptides derived from seventeen glycoproteins that were overexpressed only in A549 cells, suggesting the presence of common aberrant expression of glycoproteins in lung cancer as well as distinct expression patterns of glycoproteins impacted by different types of oncogene mutations.
Considering approximately 22% of lung adenocarcinomas harbor a KRAS mutation and the fact that we observed more overexpressed glycoproteins in KRAS-mutant A549 cells than EGFR-mutant HCC827 cells, we chose to focus our efforts on elucidating the glycoproteins regulated by mutant KRAS. Targeted knockdown of KRAS using siRNA strategy revealed that three glycoproteins identified in our initial proteomic analysis were indeed regulated by KRAS: CLPTM1, TMEM106B, and CREG1. It should be noted that the total expression levels of one of these glycoproteins, CLPTM1, measured by Western blot were inconsistent with the levels of glycopeptides detected by the Triple SILAC approach, suggesting an increase in glycosylation in CLPTM1 in KRAS mutant cells. It is also possible that the antibody used for CLPTM1 detection was so poor that it prevented accurate measurement of the true protein levels. The glycoprotein TMEM106B was found to be regulated by KRAS, however, its overexpression pattern in our panel of NSCLC cell lines was not unique to cell lines harboring KRAS mutations, suggesting the presence of a secondary regulatory pathway. We found only one of these glycoproteins, CREG1, to be uniquely overexpressed in other KRAS-mutant NSCLC cell lines. Interestingly, the overexpression of CREG1 was not regulated by KRAS at the transcriptional level, as the reduction of overall CREG1 protein levels, in response to KRAS abrogation via targeted siRNA, occurred with no significant change in CREG1 mRNA levels. This latter observation is indicative of KRAS positively regulating CREG1 at either the translational or post-translational levels, and constitutively active KRAS signaling resulting in an increased protein abundance of CREG1 in KRAS-mutant NSCLC. The correlation was also validated in a panel of tumor tissues from lung cancer patients.
Although our initial cell line panel screen suggested an association of CREG1 overexpression with NSCLC adenocarcinomas, the result of identifying increased expression of CREG1 in a tumor classified poorly differentiated as squamous appears conflicting. While KRAS mutations in squamous cell carcinomas are extremely rare [41], the morphological classification is not always accurate, particularly if the tumors are poorly differentiation [42]. With the potential of histological diagnoses of adenocarcinomas and squamous carcinomas varying between pathologist [43], the development of a molecular biomarker unique to sub-types of NSCLC that reflect the biology of the tumor are desired, and the results of this study suggest CREG1 as a promising candidate marker of KRAS mutations in NSCLC.
CREG1 is a 220 amino acid secreted glycoprotein first identified with a functional role in transcriptional repression and abrogation of physiological effects of the adenovirus E1A oncoprotein [44]. Additional studies using embryonal carcinoma cell lines have shown CREG1 as having a role in cell differentiation, and increased expression of CREG1 was observed in differentiated cells [45]. Furthermore, overexpression of CREG1 resulted in a decreased cell proliferation, yet this observation was found to be dependent on the expression and interaction of the mannose-6-phosphate/insulin-like growth factor II receptor (M6P/IGF2R) with CREG1 [46]. However, more recent studies have suggested a paradoxical role of CREG1. A number of studies have implicated CREG1 as an anti-apoptotic protein in both bone marrow-derived mesenchymal stem cells (MSCs) and human umbilical vein endothelial cells (HUVEC) via a AKT/PI3K mediated pathway [47,48]. The finding that TNF-α induced apoptosis can be abrogated by overexpressing CREG1 in MSCs further supports this notion [49]. Recently, Tao et al showed that overexpression of CREG1 could increase proliferation of HUVEC cells through activation of the ERK signaling pathway [50]. In another study, overexpressing CREG1 was found to increase secretion of VEGF and promote migration of HUVEC via signaling of the ILK/AKT/mTOR pathway [51].
Although evidence supporting the function of CREG1 in vascular tissue and angiogenesis is growing [52], little is known regarding the secreted protein's expression pattern and role in cancer. In patients with gastric cancer, Xu et al showed overexpression of CREG1 in gastric cancer tissues compared to adjacent healthy tissues, and CREG1 levels increased in advanced stages and metastatic tumors [53]. Furthermore, the authors found that by reducing CREG1 expression level in gastric cancer cells in vitro, they could reduce the cells' capability of proliferation and migration. In our own analysis, we found CREG1 be overexpressed in KRAS-mutant NSCLC cell lines and tumors only, and to display significant expression in colorectal cancer with the highest expression in the metastatic cell line SW620, although this latter observation is relative to CREG1 expression in NSCLC cell line A549. Distinct from NSCLC, the expression of CREG1 in colorectal cancer cells was not impacted by the KRAS mutation status. KRAS mutations in gastric cancer are also rare, and in the Xu et al study [53], the cell lines examined: SGC-7901, MKN-28, and MKN-45; do not contain KRAS mutations [54,55]. This indicates that overexpression of CREG1 is not exclusive to one cancer type or mutation status of one gene and other mechanisms may contribute to the overexpression of CREG1 in different cancer types. Within a sub-type of NSCLC, CREG1 does have a functional role, wherein siRNA targeted knockdown of CREG1 reduced both cell proliferation and cell migration in NSCLC cell lines. Additional studies are needed to determine the mechanism of CREG1 induced cell proliferation and migration, as well as determine the potential impact of lung tumor-derived CREG1 has on neovascularization, which will enable a better understanding of this protein's role in lung carcinogenesis.
With the high rate of late-stage diagnosis and the heterogeneity that exists in lung cancer, the identification of novel markers that allow for both early detection and differentiation of molecular sub-types of lung cancer is a high priority in the biomedical research field. In this study we identified CREG1 as a novel protein marker of NSCLC cells harboring KRAS mutations, showed CREG1 is regulated by KRAS, and revealed a functional role of CREG1 in cell proliferation and migration. On the basis of these results we conclude that CREG1 is a KRAS down-stream effector that might serve as a biomarker and/or a novel target for NSCLC with a KRAS mutation.
Supplementary Material
Additional File 1Table S1- Quantified glycopeptides from the Triple SILAC glycoproteomic analysis. Table S2 - Identified glycosite with matching MS/MS spectra.Table S3 - Quantified proteins from Double SILAC analysis.
Figure S1 and Figure S2.
Table SI-1 - List of quantified peptides from Triple SILAC analysis; individual replicates.
Competing Interests
The authors have declared that no competing interest exists.
References
1. American Cancer Society. Cancer Facts & Figures 2015. 2015.
2. Hassanein M, Callison JC, Callaway-Lane C, Aldrich MC, Grogan EL, Massion PP. The state of molecular biomarkers for the early detection of lung cancer. Cancer Prev Res. 2012;5:992-1006
3. Aberle DR, Adams AM, Berg CD, Black WC, Clapp JD, Fagerstrom RM. et al. Reduced lung-cancer mortality with low-dose computed tomographic screening. N Engl J Med. United States. 2011Aug;365(5):395-409
4. Brown AF, Sirohi D, Fukuoka J, Cagle PT, Policarpio-Nicolas M, Tacha D. et al. Tissue-preserving antibody cocktails to differentiate primary squamous cell carcinoma, adenocarcinoma, and small cell carcinoma of lung. Arch Pathol Lab Med. 2013;137:1274-81
5. Roberts PJ, Stinchcombe TE. KRAS mutation: Should we test for it, and does it matter. J Clin Oncol. 2013;31(8):1112-21
6. Riely GJ, Marks J, Pao W. KRAS mutations in non-small cell lung cancer. Proc Am Thorac Soc. 2009;6:201-5
7. Kim ES, Herbst RS, Wistuba II, Jack Lee J, Blumenschein GR, Tsao A. et al. The BATTLE trial: Personalizing Therapy for Lung Cancer. Cancer Discov. 2011;1:44-53
8. Apweiler R, Hermjakob H, Sharon N. On the frequency of protein glycosylation, as deduced from analysis of the SWISS-PROT database. Biochim Biophys Acta - Gen Subj. 1999;1473:4-8
9. Drake PM, Cho W, Li B, Prakobphol A, Johansen E, Anderson NL. et al. Sweetening the pot: Adding glycosylation to the biomarker discovery equation. Clin Chem. 2010;56:223-36
10. Heo SH, Lee SJ, Ryoo HM, Park JY, Cho JY. Identification of putative serum glycoprotein biomarkers for human lung adenocarcinoma by multilectin affinity chromatography and LC-MS/MS. Proteomics. 2007;7:4292-302
11. Hongsachart P, Huang-Liu R, Sinchaikul S, Pan FM, Phutrakul S, Chuang YM. et al. Glycoproteomic analysis of WGA-bound glycoprotein biomarkers in sera from patients with lung adenocarcinoma. Electrophoresis. 2009;30:1206-20
12. Li QK, Shah P, Li Y, Aiyetan PO, Chen J, Yung R. et al. Glycoproteomic analysis of bronchoalveolar lavage (BAL) fluid identifies tumor-associated glycoproteins from lung adenocarcinoma. J Proteome Res. 2013;12:3689-96
13. Soltermann A, Ossola R, Kilgus-Hawelski S, Von Eckardstein A, Suter T, Aebersold R. et al. N-glycoprotein profiling of lung adenocarcinoma pleural effusions by shotgun proteomics. Cancer. 2008;114:124-33
14. Sudhir P-R, Chen C-H, Pavana Kumari M, Wang M-J, Tsou C-C, Sung T-Y. et al. Label-free Quantitative Proteomics and N-Glycoproteomics Analysis of KRAS-activated Human Bronchial Epithelial Cells. Mol Cell Proteomics. 2012;11:901-15
15. Matsumoto K, Yokote H, Arao T, Maegawa M, Tanaka K, Fujita Y. et al. N-Glycan fucosylation of epidermal growth factor receptor modulates receptor activity and sensitivity to epidermal growth factor receptor tyrosine kinase inhibitor. Cancer Sci. 2008;99(8):1611-7
16. Liu Y-C, Yen H-Y, Chen C-Y, Chen C-H, Cheng P-F, Juan Y-H. et al. Sialylation and fucosylation of epidermal growth factor receptor suppress its dimerization and activation in lung cancer cells. Proc Natl Acad Sci U S A. 2011;108:11332-7
17. Yoshida T, Zhang G, Smith M a, Lopez AS, Bai Y, Li J. et al. Tyrosine phosphoproteomics identifies both codrivers and cotargeting strategies for T790M-related EGFR-TKI resistance in non-small cell lung cancer. Clin Cancer Res. 2014;20:4059-74
18. Zhang X, Belkina N, Jacob HKC, Maity T, Biswas R, Venugopalan A. et al. Identifying novel targets of oncogenic EGF receptor signaling in lung cancer through global phosphoproteomics. Proteomics. 2015;15:340-55
19. Roberts PJ, Stinchcombe TE, Der CJ, Socinski M a. Personalized medicine in non-small-cell lung cancer: Is KRAS a useful marker in selecting patients for epidermal growth factor receptor-targeted therapy? J Clin Oncol. 2010;28(31):4769-77
20. Stella GM, Luisetti M, Inghilleri S, Cemmi F, Scabini R, Zorzetto M. et al. Targeting EGFR in non-small-cell lung cancer: Lessons, experiences, strategies. Respir Med. 2012;106(2):173-83
21. Zhao J, Ma MZ, Ren H, Liu Z, Edelman MJ, Pan H. et al. Anti-HDGF targets cancer and cancer stromal stem cells resistant to chemotherapy. Clin Cancer Res. 2013;19(13):3567-76
22. Ramirez RD, Sheridan S, Girard L, Sato M, Kim Y, Pollack J. et al. Immortalization of human bronchial epithelial cells in the absence of viral oncoproteins. Cancer Res. 2004;64(24):9027-34
23. Tian Y, Zhou Y, Elliott S, Aebersold R, Zhang H. Solid-phase extraction of N-linked glycopeptides. Nat Protoc. 2007;2(2):334-9
24. Chambers MC, Maclean B, Burke R, Amodei D, Ruderman DL, Neumann S. et al. A cross-platform toolkit for mass spectrometry and proteomics. Nat Biotechnol. 2012;30(10):918-20
25. Eng JK, Jahan TA, Hoopmann MR. Comet: an open-source MS/MS sequence database search tool. Proteomics. 2013;13(1):22-4
26. Liao Z, Wan Y, Thomas SN, Yang AJ. IsoQuant: A Software Tool for Stable Isotope Labelling by Amino Acids in Cell Culture-Based Mass Spectrometry Quantitation. Anal Chem. 2012;84(10):4535-4543
27. Kim N, Park H, He N, Lee HY, Yoon S. QCanvas: An Advanced Tool for Data Clustering and Visualization of Genomics Data. Genomics Inform. 2012;10(4):263-5
28. Vizcaíno J, Deutsch E, Wang R. ProteomeXchange provides globally coordinated proteomics data submission and dissemination. Nat Biotechnol. 2014;32(3):223-6
29. Mei Y, Zhang P, Zuo H, Clark D, Xia R, Li J. et al. Ebp1 activates podoplanin expression and contributes to oral tumorigenesis. Oncogene. 2013;33:3839-3850
30. Ihle NT, Byers L a, Kim ES, Saintigny P, Lee JJ, Blumenschein GR. et al. Effect of KRAS oncogene substitutions on protein behavior: Implications for signaling and clinical outcome. J Natl Cancer Inst. 2012;104(3):228-39
31. Fernández-Medarde A, Santos E. Ras in cancer and developmental diseases. Genes Cancer. 2011;2:344-58
32. Reis C a, Osorio H, Silva L, Gomes C, David L. Alterations in glycosylation as biomarkers for cancer detection. J Clin Pathol. 2010;63:322-9
33. Zhang H, Li X-J, Martin DB, Aebersold R. Identification and quantification of N-linked glycoproteins using hydrazide chemistry, stable isotope labeling and mass spectrometry. Nat Biotechnol. 2003;21(6):660-6
34. Tian Y, Yao Z, Roden RBS, Zhang H. Identification of glycoproteins associated with different histological subtypes of ovarian tumors using quantitative glycoproteomics. Proteomics. 2011;11:4677-87
35. Tian Y, Bova GS, Zhang H. Quantitative glycoproteomic analysis of optimal cutting temperature-embedded frozen tissues identifying glycoproteins associated with aggressive prostate cancer. Anal Chem. 2011;83:7013-9
36. Whelan S a, Lu M, He J, Yan W, Saxton RE, Faull KF. et al. Mass Spectrometry ( LC-MS / MS ) Site-Mapping of N-Glycosylated Membrane Proteins for Breast Cancer Biomarkers research articles. J Proteome Res. 2009:4151-60
37. Zeng X, Hood BL, Sun M, Conrads TP, Day RS, Weissfeld JL. et al. Lung Cancer Serum Biomarker Discovery Using Glycoprotein Capture and Liquid Chromatography Mass Spectrometry. J Proteome Res. 2010;9:6440-9
38. Tian Y, Esteva FJ, Song J, Zhang H. Altered Expression of Sialylated Glycoproteins in Breast Cancer Using Hydrazide Chemistry and Mass Spectrometry. Mol Cell Proteomics. 2012;11:M111.011403-M111.011403
39. Almaraz RT, Tian Y, Bhattarcharya R, Tan E, Chen S-H, Dallas MR. et al. Metabolic Flux Increases Glycoprotein Sialylation: Implications for Cell Adhesion and Cancer Metastasis. Mol Cell Proteomics. 2012;11:M112.017558-M112.017558
40. Nilsson J, Rüetschi U, Halim A, Hesse C, Carlsohn E, Brinkmalm G. et al. Enrichment of glycopeptides for glycan structure and attachment site identification. Nat Methods. 2009;6(11):809-11
41. Hammerman PS, Lawrence MS, Voet D, Jing R, Cibulskis K, Sivachenko A. et al. Comprehensive genomic characterization of squamous cell lung cancers. Nature. 2012;489(7417):519-25
42. Thunnissen E, Noguchi M, Aisner S, Beasley MB, Brambilla E, Chirieac LR. et al. Reproducibility of histopathological diagnosis in poorly differentiated NSCLC: an international multiobserver study. J Thorac Oncol. 2014Sep;9(9):1354-62
43. Li T. Patient selection in non-small cell lung cancer: Histologic versus molecular subtypes? J Thorac Dis. 2010;2(4):189-91
44. Veal E, Eisenstein M, Tseng ZH, Gill G. A cellular repressor of E1A-stimulated genes that inhibits activation by E2F. Mol Cell Biol. 1998;18(9):5032-41
45. Veal E, Groisman R, Eisenstein M, Gill G. The secreted glycoprotein CREG enhances differentiation of NTERA-2 human embryonal carcinoma cells. Oncogene. 2000;19:2120-8
46. Di Bacco A, Gill G. The secreted glycoprotein CREG inhibits cell growth dependent on the mannose-6-phosphate/insulin-like growth factor II receptor. Oncogene. 2003;22:5436-45
47. Deng J, Han Y, Yan C, Tian X, Tao J, Kang J. et al. Overexpressing cellular repressor of E1A-stimulated genes protects mesenchymal stem cells against hypoxia- and serum deprivation-induced apoptosis by activation of PI3K/Akt. Apoptosis. 2010;15:463-73
48. Wang N, Han Y, Tao J, Huang M, You Y, Zhang H. et al. Overexpression of CREG attenuates atherosclerotic endothelium apoptosis via VEGF/PI3K/AKT pathway. Atherosclerosis. 2011;218:543-51
49. Peng CF, Han YL. et al. Overexpression of cellular repressor of E1A-stimulated genes inhibits TNF-α-induced apoptosis via NF-κB in mesenchymal stem cells. Biochem Biophys Res Commun. 2011;406(4):601-7
50. Tao J, Yan C, Tian X, Liu S, Li Y, Zhang J. et al. Creg promotes the proliferation of human umbilical vein endothelial cells through the ERK/cyclin E signaling pathway. Int J Mol Sci. 2013;14:18437-56
51. Zhang H, Han Y, Tao J, Liu S, Yan C, Li S. Cellular repressor of E1A-stimulated genes regulates vascular endothelial cell migration by The ILK/AKT/mTOR/VEGF165 signaling pathway. Exp Cell Res. 2011;317(20):2904-13
52. Yan C, Pu F, Zhang H, Tao J, Tian X, Li Y, Zhang J, Sun M, Li S, Wang H, Han Y. CREG1 promotes neovasculairzation and angiogenesis. Front Biosci. 2015;19:1151-61
53. Xu L, Wang F, Liu H, Xu XF, Mo WH, Xia YJ. et al. Increased expression of cellular repressor of E1A-stimulated gene (CREG) in gastric cancer patients: A mechanism of proliferation and metastasis in cancer. Dig Dis Sci. 2011;56:1645-55
54. Mita H, Toyota M, Aoki F, Akashi H, Maruyama R, Sasaki Y. et al. A novel method, digital genome scanning detects KRAS gene amplification in gastric cancers: involvement of overexpressed wild-type KRAS in downstream signaling and cancer cell growth. BMC Cancer. 2009;9:198
55. Shi M, Shi H, Ji J, Cai Q, Chen X, Yu Y. et al. Cetuximab inhibits gastric cancer growth in vivo, independent of KRAS status. Curr Cancer Drug Targets. 2014;14(2):217-24
Author contact
![]() Corresponding author: Department of Oncology and Diagnostic Sciences, University of Maryland School of Dentistry, 650 W. Baltimore St., Baltimore, MD 21201, USA. E-mail: Lmaoedu
Corresponding author: Department of Oncology and Diagnostic Sciences, University of Maryland School of Dentistry, 650 W. Baltimore St., Baltimore, MD 21201, USA. E-mail: Lmaoedu