Impact Factor
- Issue 12; 2026
- Issue 11; 2026
- Issue 10; 2026
- Issue 9; 2026
- Issue 8; 2026
- Volume 16; 2026
- Advance Articles
- Past Issues
- Cover Images
- Cover Suggestion
- Index & Coverage
- Special Issues
Introduction
Materials and Methods
Results and Discussion
Conclusion
Supplementary Material
Abbreviations
Acknowledgements
References
International Journal of Biological Sciences
International Journal of Medical Sciences
 Global reach, higher impact

Theranostics 2016; 6(9):1353-1361. doi:10.7150/thno.16093 This issue Cite
Research Paper
Accurate Quantification of Disease Markers in Human Serum Using Iron Oxide Nanoparticle-linked Immunosorbent Assay
Linlin Zhang1,2*, Sheng Tong1*, Jun Zhou2,3, Gang Bao1 ![]()
1. Department of Bioengineering, Rice University, Houston, TX 77005, USA.
2. State Key Laboratory of Medicinal Chemical Biology, College of Life Sciences, Nankai University, Tianjin 300071, China;
3. Institute of Biomedical Sciences, College of Life Sciences, Key Laboratory of Animal Resistance of Shandong Province, Key Laboratory of Molecular and Nano Probes of the Ministry of Education, Shandong Normal University, Jinan 250014, China.
*These authors contributed equally to this work.
Received 2016-3-8; Accepted 2016-5-9; Published 2016-6-15
Abstract

Accurate and reliable quantification of biomarkers in the blood is essential in disease screening and diagnosis. Here we describe an iron oxide nanoparticle (IONP)-linked immunosorbent assay (ILISA) for detecting biomolecules in human serum. Sandwich ILISA was optimized for the detection of four important serological markers, IgA, IgG, IgM, and C-reactive protein (CRP), and assessed with normal sera, simulated disease-state sera and the serum samples from patients infected with West Nile virus (WNV) or human herpes virus (HHV). Our study shows that using the detection assay formulated with 18.8 nm wüstite nanocrystals, ILISA can achieve sub-picomolar detection sensitivity, and all four markers can be accurately quantified over a large dynamic range. In addition, ILISA is not susceptible to variations in operating procedures and shows better linearity and higher stability compared with ELISA, which facilitates its integration into detection methods suitable for point of care. Our results demonstrate that ILISA is a simple and versatile nanoplatform for highly sensitive and reliable detection of serological biomarkers in biomedical research and clinical applications.
Keywords: iron oxide nanoparticle, immunosorbent assay, serological biomarker, quantification.
Introduction
Recent advances in proteomics and lipidomics have led to extensive analysis of the molecular signature of human blood [1-4]. A large number of biomolecules in the blood such as antibodies, cytokines and metabolites have been identified as the markers of specific pathological conditions, since the plasma concentration of these biomarkers correlates with disease onset, disease progression as well as patient responses to therapeutic interventions [5, 6]. It has been demonstrated that accurate quantification of biomolecules in human blood samples holds great promises for the detection and diagnosis of a variety of diseases including infectious disease [7-9], autoimmune disease [10, 11], cardiovascular disease [12-15] and cancer [5, 6, 16-18]. Requiring only a small amount of blood, the simplicity and noninvasive nature of the blood test make it an ideal choice for point-of-care disease diagnosis with low cost. Therefore, developing highly quantitative and robust techniques for blood tests is of great significance for a broad range of clinical applications, and has the potential to shift the paradigm of disease diagnosis and treatment.
Accurate characterization of disease state using blood samples often requires quantification of a panel of disease markers in a complex mixture of blood components with high specificity, sensitivity, and reliability. Current clinical blood testing methods are mostly derived from enzyme-linked immunosorbent assays (ELISA) and nephelometric assays [19-24]. These assays are inherently unstable because small changes in the reagents or operating procedures can lead to large variations in enzyme catalysis or protein agglomeration. For this reason, clinical blood tests are typically performed in laboratories with well-trained technicians, special instruments and stringent quality control, which significantly increase the cost and time required for disease diagnosis. There is an unmet clinical need for simpler, more robust and cost-effective blood testing techniques. An alternative approach is to develop a nanocrystal-based method for biomolecule detection [25-28]. Compared with the protein- or small organic molecule-based probes in conventional detection methods, the detection signal generated with a nanocrystal is associated with the whole crystal structure, which is very stable upon exposure to UV radiation, heat and oxidants. Nanocrystal-based detection probes can therefore improve the reliability of blood tests.
We have previously shown that a particular type of nanocrystal, iron oxide nanoparticles (IONPs) can be used for colorimetric detection in immunosorbent assays [29]. In the iron oxide nanoparticle-linked immunosorbent assay (ILISA), the IONPs bound to immobilized target molecules are dissolved into individual metal ions, which are then quantified through a stable chromogenic reaction [29]. Detection sensitivity of ILISA is determined by the number of iron atoms in each IONP, i.e., the size of the iron oxide nanocrystal in a probe. In this study, we further developed the sandwich ILISA for the detection of a group of serological markers, IgA, IgG, IgM and CRP. IgA, IgG and IgM are three isotypes of antibodies that are involved during different stages or types of immune reactions. The changes in the concentration of these molecules are indicative of many diseases. For example, lower levels of IgA may be linked to certain types of leukemia, kidney damage, and enteropathy, while higher IgA concentrations may imply multiple myeloma, autoimmune diseases, and certain infectious diseases. Further, elevated levels of IgG, IgM and CRP are associated with infectious diseases, autoimmune diseases, and inflammation. Here we show the development of a detection method with large wüstite nanocrystals and a highly sensitive chromogenic iron chelator, Ferene S, which can be readily incorporated into various forms of immunosorbent assays. The performance of ILISA was thoroughly examined with sera that mimic the normal and disease states. The serum levels of total IgG and IgM in the patients with infectious diseases were also quantified with sandwich ILISA.
Materials and Methods
Materials
Iron acetylacetonate, oleic acid, oleylamine, Ferene S, hydrochloric acid, sodium hydroxide, ammonium acetate, hydroxylamine hydrochloride, and purified human IgA, IgG, IgM, and CRP were purchased from Sigma-Aldrich. 2-mercaptoethylamine (2-MEA) and 2,2'-Azinobis [3-ethylbenzothiazoline-6-sulfonic acid]-diammonium salt (ABTS) were purchased from Thermo Scientific. DSPE-n-methoxy-PEG(2000) and DSPE-PEG(2000)-maleimide were purchased from Avanti Polar Lipids. Polystyrene ELISA microplates and BSA concentrate were purchased from R&D systems. Micro cuvettes were purchased from VWR.
Mouse anti-human IgA monoclonal antibody (BD Biosciences), rabbit anti-human IgA polyclonal antibody (Sigma-Aldrich), rabbit anti-human IgG polyclonal antibody (Sigma-Aldrich), mouse anti-human IgM monoclonal antibody (Abcam), rabbit anti-human IgM polyclonal antibody (Abcam), mouse anti-human CRP monoclonal antibody (Abcam), rabbit anti-human CRP polyclonal antibody (Cell Biolabs), horseradish peroxidase-conjugated rabbit anti-mouse IgG polyclonal antibody (Abcam), and pooled normal human serum (Innovative Research) were obtained from the indicated sources. The serum samples from WNV- and HHV-infected patients were kindly provided by Dr. Susan Wootton at the University of Texas Health Science Center. The use of these human serum samples has received approval from the Institutional Biosafety Committee at Rice University.
Synthesis of maleimide-functionalized IONPs
Maleimide-functionalized IONPs were synthesized using a method described previously [29, 30]. In brief, wüstite (Fe1-xO) nanocrystals were synthesized by thermodecomposition of Fe(acac)3 in oleic acid and oleylamine [31]. As-synthesized nanocrystals were hydrophobic and dispersed in toluene. Average diameter of the nanocrystals was 18.8 nm as measured in TEM images using ImagePro Plus software. To generate maleimide-functionalized and water-dispersible IONPs, the nanocrystals were coated with a mixture of DSPE-n-methoxy-PEG(2000) and DSPE-PEG(2000)-maleimide using a dual solvent exchange method.
Synthesis of antibody-conjugated IONP probes
Antibody-conjugated IONP probes were synthesized by reacting the maleimide-functionalized IONPs with fragmented detection antibodies carrying free sulfhydryl groups. The isotype of all detection antibodies in this study is immunoglobulin G (IgG). The antibodies were reduced with 2-MEA to generate fragments with an active epitope binding site and free sulfhydryl groups. In a typical reduction reaction, the antibody was concentrated in PBS with 100 mM phosphate and 10 mM EDTA and mixed with 2-MEA at designated concentrations. The mixture was incubated at 37oC for 2 hours followed by washes with 100 mM potassium acetate (pH 5.5). The resulting antibody fragments were examined with polyacrylamide gel electrophoresis (PAGE). The optimal concentration of 2-MEA was determined for each antibody. Then the maleimide-functionalized IONPs were mixed with antibody fragments in PBS and incubated at room temperature overnight. The molar ratio between IONPs and the antibodies was fixed at 1:3. After reaction, unconjugated antibody fragments were removed by ultracentrifugation.
IONP-linked immunosorbent assay (ILISA)
All biomarkers were quantified using sandwich ILISA in either 96-well microplates or micro cuvettes. In a microplate-based assay, the microplate was first prepared by incubating with designated capture antibodies at 10 μg/mL at 4oC overnight and blocking with 1% BSA. For biomarker quantification, the sample solutions were added to the microplate and incubated at ambient temperature for 1 hour. After washing, the plate was incubated with the IONP probes (100 μg Fe/mL) at ambient temperature for 1 hour with vigorous shaking. Unbound probes were removed by washing with PBS containing 0.05% Tween-20. To detect bound IONPs, 50 μL of 6 M HCl was added to each well and incubated for 15 min at ambient temperature. Then 70 μL of 4 M NaOH and 80 μL of color development solution (0.75 M ammonium acetate, 1.5% hydroxylamine hydrochloride, and 0.05% Ferene S) were added to each well. Light absorbance at 592 nm was measured immediately using a microplate reader. The micro cuvette-based assay was developed similarly except that light absorbance was measured with a UV spectrometer.
Results and Discussion
Characterization of sandwich ILISA
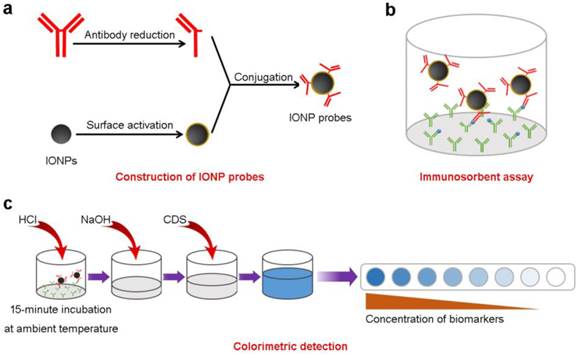
Sandwich ILISAs are designed for quantitative detection of biomolecules in the blood (Scheme 1). In a typical sandwich ILISA, the samples are incubated with capture antibodies (against target molecules) adsorbed onto a solid support. IONPs conjugated with antibody fragments are used as the detection probes. After IONP probes bind to the immobilized target molecules and unbound probes are removed, the bound IONP nanocrystals are dissolved by acid lysis and the amount of released iron atoms are quantified through a chromogenic reaction. The light absorbance of the resulting iron chelates at 592 nm is determined. The concentration of target molecules can then be quantified using a standard curve corresponding to the specific IONP probe [29]. The detection sensitivity of the assay is controlled by the size of the IONP probe, i.e., the number of iron atoms per IONP (Supplementary Figure S1), the binding avidity between the target molecule and the probe, and the light absorbance of the iron chelates.
The iron oxide nanoparticle linked immunosorbent assay (ILISA). (a) Detection probes are constructed by conjugating IONPs with fragmented antibodies. (b) The samples containing target molecules are incubated with capture antibodies immobilized on to a solid support. Surface bound target molecules are detected with the IONP probes. (c) The probes bound to the target molecules were measured using a colorimetric assay. CDS, color development solution.
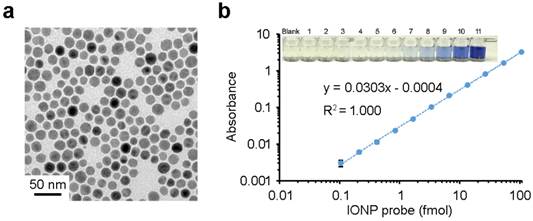
In this study, the wüstite nanocrystals used for ILISA have a mean diameter of 18.8 nm (Figure 1a). After the IONPs are dissolved by acid, the resulting iron atoms are reacted with a chromogenic agent Ferene S to form a complex with ferrous ion (Fe2+). The molar extinction coefficient of Fe2+-Ferene S complexes is 3.55×10⁴/M•cm at 592 nm [32]. In a standard 96-well microplate, the light absorbance of the Fe2+-Ferene S complexes correlates linearly with the concentration of IONPs over a range of three orders of magnitude (Figure 1b), with the detection limit of the IONP probes reaching 0.1 fmol. In the case that there is a one-to-one binding between an IONP and a target antigen in a sandwich ILISA, this is also the detection limit for target antigen.
Detection sensitivity of ILISA. (a) A typical TEM image of wüstite nanocrystals. (b) Quantification of IONP probes in a 96-well microplate. IONP probes were lysed with acid, reduced to ferrous ions, and quantified with a Ferene S assay. Data represent means ± SD of three measurements.
We systematically investigated the reliability, sensitivity, linearity and stability of sandwich ILISA, which are critical for its clinical use. We first examined the effects of IONP probe concentration and incubation time on ILISA measurements. As shown in Figure 2a, at IgA concentration of 125 ng/mL, the measured absorbance changed less than 4% when the IONP probe concentration increased from 50 μg/mL to 200 μg/mL, suggesting that the use of excess amount of probes would not cause a large variation in the measurement. Further, we found that, when incubation time increased from 15 min to 60 min, the ratio of IgA measurements at two different concentrations (500 and 125 ng/mL) had only negligible changes (Figure 2b). Shortening the incubation time to ~15 min, therefore, will not affect the results much as long as the standard curve is measured and the assays are performed consistently under the same experimental conditions. Taken together, these findings suggest that ILISA is very robust and not susceptible to variations in operating procedures.
The reliability and sensitivity of sandwich ILISA. (a) The effects of probe concentrations on ILISA measurements. (b) The effects of incubation time on ILISA measurements. Y-axis indicates the ratio of absorbance measurements with IgA concentration of 500 ng/mL and 125 ng/mL respectively. (c) Detection sensitivity was further increased with a two-step sandwich ILISA. Shown is the measured absorbance as a function of IgA concentration using the two-step and one-step ILISA assays respectively. The ratio of the slopes of the two curves (6.07 and 1.52 respectively) indicates the average number of secondary IONP probes bound to each primary probe. (d) IgA was quantified with a two-step sandwich ILISA, demonstrating high detection sensitivity. Data represent means ± SD of three measurements.
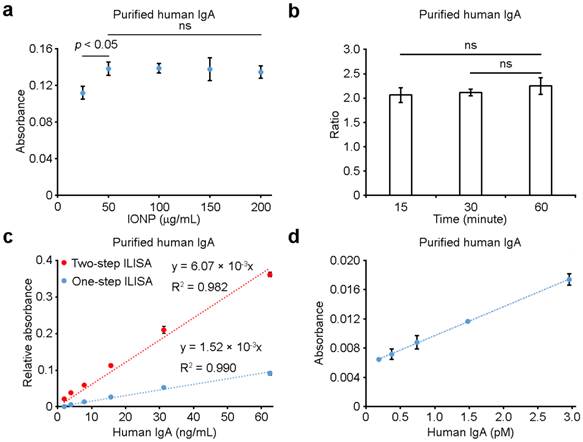
In many biological and clinical applications, the concentration of disease biomarker is ultra-low, which requires highly sensitive detection. For this reason, we designed a two-step detection scheme to increase the detection sensitivity of sandwich ILISA where secondary IONP probes were bound to the primary IONP probes for further signal amplification. As shown in Figure 2c, the use of secondary probes can significantly enhance the detection sensitivity. At low analyte concentrations, the fold increase in signal amplification was ~3.99, suggesting that on average ~3 secondary IONP probes bound to each primary probe (Figure 2c, Supplementary Figure S2). With this two-step sandwich ILISA, the detection limit of IgA concentration can be as low as 0.2 pM (Figure 2d), comparable to the detection limit of commonly used commercial ELISA kits.
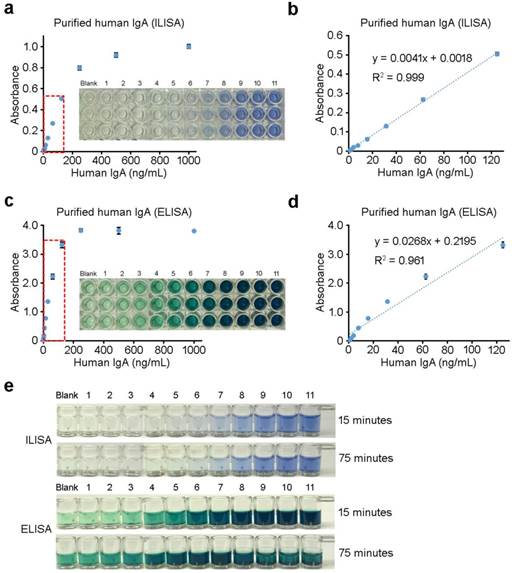
We further compared the linearity and stability of sandwich ILISA with that of sandwich ELISA for purified human IgA. As shown in Figures 3a-3d, sandwich ILISA showed a much better linearity than sandwich ELISA in the same IgA concentration range of 1-125 ng/mL. We found that, with reaction time of 15 min and 75 min respectively, the signal intensity of sandwich ILISA did not change (Figure 3e), whereas that of sandwich ELISA varied significantly, as demonstrated by the color changes of the solutions after 15 min and 75 min incubation (Figure 3e). Therefore, sandwich ILISA is a reliable, sensitive, and stable method with exceptional linearity and wide dynamic range, making it a potentially powerful tool for clinical use.
Comparison of the linearity and stability of ILISA with ELISA. (a) and (c) show the quantification of purified human IgA using sandwich ILISA (a) and sandwich ELISA (c) respectively. (b) and (d) are magnified views of the boxed portions of the curves outlined in (a) and (c) respectively. (e) shows the representative images of the micro-wells used in ILISA and ELISA. Images were taken after 15 min or 75 min incubation.
Quantification of IgA, IgG, IgM and CRP in human sera mimicking normal and disease states
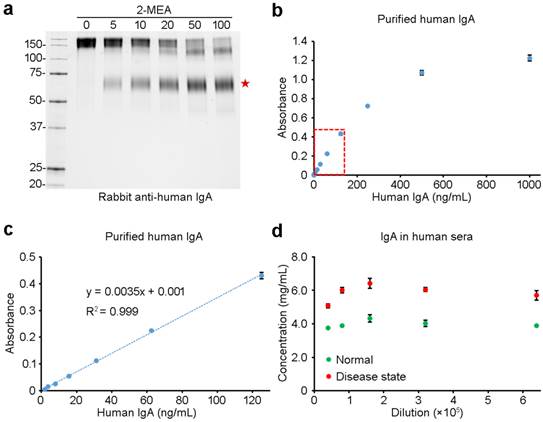
As with other sandwich immunosorbent assays, a pair of antibodies was used against the target molecule in sandwich ILISA. One of the antibodies, the capture antibody, was immobilized onto 96-well microplates, while the other was conjugated with IONPs. To ensure high binding affinity of the IONP probes to the target molecules, antibodies were reduced with 2-MEA at optimal conditions and linked to IONPs through site-specific conjugation (Figures 4a, Supplemental Figures S3 and S4). The ILISA assay was first tested with purified proteins to generate the standard curve. A representative result of the sandwich ILISA for IgA measurement is shown in Figures 4b. The shape of the light absorbance-concentration curve is typical of a Michaelis-Menten equation, which reflects the binding kinetics between IgA and the immobilized capture antibody on the microplate surface. As shown in Figure 4c, with low IgA concentrations, the absorbance is linear, providing a reliable and accurate quantification for IgA in dilute samples. The absorbance-concentration curve shown in Figure 4c serves as the standard curve for IgA quantification. We then measured IgA levels in human serum samples. A pooled normal human serum was used as a control, and normal serum spiked with known amount of IgA was used to mimic a disease state. Similar to clinical blood test, a serial dilution of the sera was prepared and IgA concentrations were measured with sandwich ILISA. This ensures that the concentration of IgA falls into the detection range shown in the standard curve (Figure 4c). With the dilution ratios from 1:40000 to 1:640000, only small variations in IgA concentration were found (Figure 4d). The measured concentrations of IgA in the normal serum range from 3.76 to 4.33 mg/mL, consistent with published results [24]. The concentrations of IgA in the disease-state sera were measured to be 5.08 to 6.42 mg/mL, in good agreement with the calculated concentrations based on the IgA concentration measured in the normal serum (from 5.8 to 6.5 mg/mL). The small difference between the measured and the calculated concentrations was mainly due to non-specific adsorption of analytes onto the test tubes during serial dilution.
IgA measurements using sandwich ILISA. (a) Titration of 2-MEA (mM) for fragmentation of a rabbit anti-human IgA antibody. The resulting antibody fragments were examined with PAGE. The red star marks the IgG fragment resulted from the reduction of the disulfide bond at the hinge region. (b) A representative standard curve generated using purified human IgA. The red-dotted rectangle marks the linear portion of the curve shown in (c). (d) Human IgA in both normal and disease-state serum samples was quantified with sandwich ILISAs. Data represent means ± SD of three measurements.
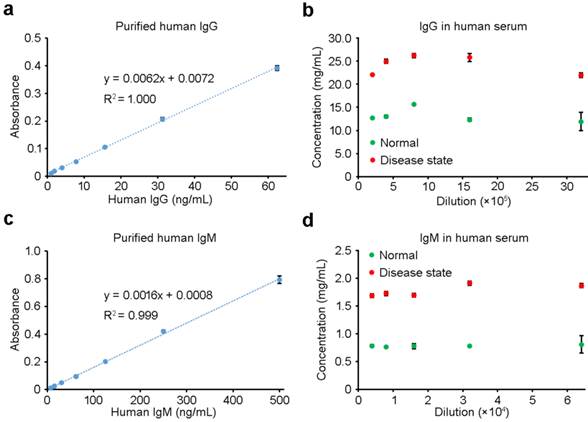
Similar to that of IgA, sandwich ILISA was employed to measure the concentrations of IgG, IgM and CRP (Figures 5 and 6, Supplementary Figure S5,). All three proteins, either in purified form or in human sera, could be readily quantified with high accuracy. With purified IgG and IgM at low concentrations, the ILISA measurements showed perfect linear relationship between the absorbance and the concentration, and the results shown in Figures 5a and 5c serve as the standard curves for IgG and IgM quantification respectively. For serum samples representing normal and disease states, ILISA gave consistent measurements within a wide titration range (Figures 5b and 5d). Figures 6a and 6b show the ILISA quantification of purified CRP, which is an important indicator of infectious diseases and inflammatory conditions. The level of CRP in normal-state sera (N) is lower than 10 μg/mL, while the concentration increases to 10-40 μg/mL in patients with low level of inflammation and viral infection (V) and exceeds 40 μg/mL in patients with severe inflammation and bacterial infection (B) [33]. To mimic these conditions, designated amounts of CRP proteins were added to the normal serum and ILISA measurements were performed with a serial dilution of each sample. As shown in Figure 6c, for the entire concentration range, the ILISA results showed a good linear correlation with the calculated values (Figure 6c).
IgG and IgM measurements using sandwich ILISA. (a) and (c) are magnified views of the linear portions of the standard curves shown in Figures S5a and S5b, respectively. The levels of IgG (b) and IgM (d) in both normal and disease-state serum samples were quantified with sandwich ILISAs. Data represent means ± SD of three measurements.
CRP measurements using sandwich ILISA. (a) A representative standard curve generated using purified human CRP. The red-dotted rectangle indicates the linear portion of the curve magnified in (b). (c) CRP in the sera mimicking bacterial and viral infections was detected with sandwich ILISA. The CRP concentrations measured with ILISA were plotted against the calculated concentrations. N, normal serum samples; V, serum samples mimicking viral infection; B, serum samples mimicking bacterial infection. Data represent means ± SD of three measurements.

ILISA for individualized tests
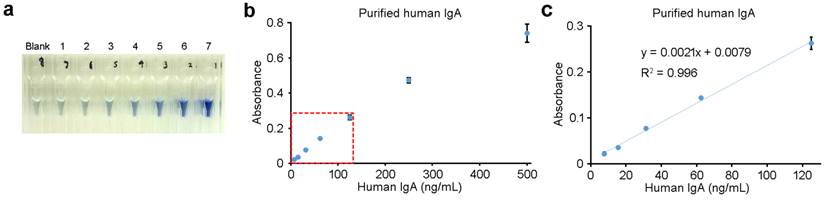
Robust blood testing methods for individual patients or normal persons are desirable for point-of-care applications. As a proof of concept, we developed a new form of sandwich ILISA for individualized tests in which capture antibodies of IgA were coated onto micro cuvettes, and subsequent steps of ILISA were performed without changing the protocol. Similar to that of microplate-based ILISA, the micro cuvette-based ILISA showed a good dynamic range and a high linearity for accurate IgA quantification (Figure 7). Importantly, the variations among independent measurements are negligible, making it feasible to accurately determine the target molecule concentration with a single micro cuvette. It is conceivable that ILISA can be incorporated into other testing platforms designed for processing individual patient samples with low cost.
Sandwich ILISA in micro cuvettes. (a) A representative image of a sandwich ILISA performed in micro cuvettes. (b) A typical standard curve generated using purified human IgA in micro cuvettes. The red-dotted rectangle indicates the linear portion of the curve. (c) A magnified view of the portion of the standard curve outlined in (b). Data represent means ± SD of three measurements.
Quantification of immunoglobulins in clinical samples
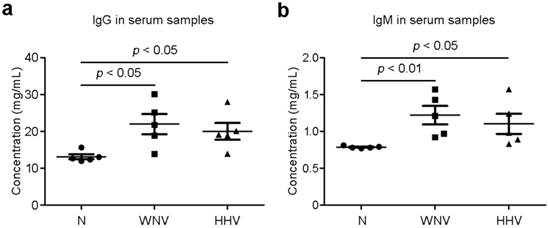
To further demonstrate the capability of sandwich ILISA in quantifying the biomarkers in clinical samples, we measured total IgG and IgM from the sera of patients infected with WNV or HHV. As shown in Figure 8, the IgG and IgM levels in the sera from patients infected respectively with WNV and HHV are both increased compared with that of normal persons (N), consistent with the well-established fact that persons contracted the WNV or HHV infection have elevated IgG and IgM levels.
Serological immunoglobulin levels in patient samples. Total IgG and IgM in patient sera were measured with sandwich ILISA. Compared with healthy subjects (N), the patients infected with West Nile virus (WNV) and human herpes virus (HHV) show elevated levels of IgG and IgM in the sera. Data represent means ± SEM.
Conclusion
We developed different formats of iron oxide nanoparticle-linked immunosorbent assay (ILISA) for detecting biomolecules in human serum with high sensitivity and large dynamic range. With both microplate-format for high-throughput detection and micro cuvettes for single sample analysis, ILISA provides a simple and sensitive detection method for quantifying disease markers. The concentration of serological markers can be accurately quantified over a wide concentration range and titration ratios. In particular, the high linearity of ILISA measurement makes it a universal and robust assay format for the characterization of changes in serological markers associated with disease progression.
Supplementary Material
Supplementary figures.
Abbreviations
ILISA: iron oxide nanoparticle-linked immunosorbent assay; IONP: iron oxide nanoparticle; ELISA: enzyme-linked immunosorbent assay; CRP: C-reactive protein; DSPE: 1,2-distearoyl-sn-glycero-3-phosphoethanolamine; MEA: mercaptoethylamine; WNV: West Nile virus; HHV: human herpes virus.
Acknowledgements
This work was supported by the Cancer Prevention and Research Institute of Texas (RR140081 to GB).
Competing interests
The authors have declared that no competing interest exists.
References
1. Anderson NL, Anderson NG. The human plasma proteome: history, character, and diagnostic prospects. Molecular & cellular proteomics: MCP. 2002;1:845-867
2. Shen Y, Kim J, Strittmatter EF, Jacobs JM, Camp DG 2nd, Fang R. et al. Characterization of the human blood plasma proteome. Proteomics. 2005;5:4034-4045
3. Anderson NL, Polanski M, Pieper R, Gatlin T, Tirumalai RS, Conrads TP. et al. The human plasma proteome: a nonredundant list developed by combination of four separate sources. Molecular & cellular proteomics: MCP. 2004;3:311-326
4. Sandra K, Pereira Ados S, Vanhoenacker G, David F, Sandra P. Comprehensive blood plasma lipidomics by liquid chromatography/quadrupole time-of-flight mass spectrometry. J Chromatogr A. 2010;1217:4087-4099
5. Sahab ZJ, Semaan SM, Sang QX. Methodology and applications of disease biomarker identification in human serum. Biomark Insights. 2007;2:21-43
6. Ludwig JA, Weinstein JN. Biomarkers in cancer staging, prognosis and treatment selection. Nat Rev Cancer. 2005;5:845-856
7. Diez-Padrisa N, Bassat Q, Roca A. Serum biomarkers for the diagnosis of malaria, bacterial and viral infections in children living in malaria-endemic areas. Drugs Today (Barc). 2011;47:63-75
8. Goulart LR, Vieira CU, Freschi AP, Capparelli FE, Fujimura PT, Almeida JF. et al. Biomarkers for serum diagnosis of infectious diseases and their potential application in novel sensor platforms. Crit Rev Immunol. 2010;30:201-222
9. Hou FQ, Song LW, Yuan Q, Fang LL, Ge SX, Zhang J. et al. Quantitative hepatitis B core antibody level is a new predictor for treatment response in HBeAg-positive chronic hepatitis B patients receiving peginterferon. Theranostics. 2015;5:218-226
10. Prince HE. Biomarkers for diagnosing and monitoring autoimmune diseases. Biomarkers. 2005;10(Suppl 1):S44-49
11. Mazzara S, Sinisi A, Cardaci A, Rossi RL, Muratori L, Abrignani S. et al. Two of Them Do It Better: Novel Serum Biomarkers Improve Autoimmune Hepatitis Diagnosis. PLoS One. 2015;10:e0137927
12. Vasan RS. Biomarkers of cardiovascular disease: molecular basis and practical considerations. Circulation. 2006;113:2335-2362
13. van Holten TC, Waanders LF, de Groot PG, Vissers J, Hoefer IE, Pasterkamp G. et al. Circulating biomarkers for predicting cardiovascular disease risk; a systematic review and comprehensive overview of meta-analyses. PLoS One. 2013;8:e62080
14. Upadhyay RK. Emerging risk biomarkers in cardiovascular diseases and disorders. J Lipids. 2015;2015:971453
15. Wallace C, Newhouse SJ, Braund P, Zhang F, Tobin M, Falchi M. et al. Genome-wide association study identifies genes for biomarkers of cardiovascular disease: serum urate and dyslipidemia. Am J Hum Genet. 2008;82:139-149
16. Brand RE, Nolen BM, Zeh HJ, Allen PJ, Eloubeidi MA, Goldberg M. et al. Serum biomarker panels for the detection of pancreatic cancer. Clin Cancer Res. 2011;17:805-816
17. Cima I, Schiess R, Wild P, Kaelin M, Schuffler P, Lange V. et al. Cancer genetics-guided discovery of serum biomarker signatures for diagnosis and prognosis of prostate cancer. Proc Natl Acad Sci U S A. 2011;108:3342-3347
18. Wingren C, Sandstrom A, Segersvard R, Carlsson A, Andersson R, Lohr M. et al. Identification of serum biomarker signatures associated with pancreatic cancer. Cancer Res. 2012;72:2481-2490
19. Kibuuka H, Berkowitz NM, Millard M, Enama ME, Tindikahwa A, Sekiziyivu AB. et al. Safety and immunogenicity of Ebola virus and Marburg virus glycoprotein DNA vaccines assessed separately and concomitantly in healthy Ugandan adults: a phase 1b, randomised, double-blind, placebo-controlled clinical trial. Lancet. 2015;385:1545-1554
20. Chang LJ, Dowd KA, Mendoza FH, Saunders JG, Sitar S, Plummer SH. et al. Safety and tolerability of chikungunya virus-like particle vaccine in healthy adults: a phase 1 dose-escalation trial. Lancet. 2014;384:2046-2052
21. Santolaya ME, O'Ryan ML, Valenzuela MT, Prado V, Vergara R, Munoz A. et al. Immunogenicity and tolerability of a multicomponent meningococcal serogroup B (4CMenB) vaccine in healthy adolescents in Chile: a phase 2b/3 randomised, observer-blind, placebo-controlled study. Lancet. 2012;379:617-624
22. de Souza Zago VH, Tanus-Santos JE, Gardin Danelon MR, Parra ES, Alexandre F, Vieira IC. et al. Chemical modification of high density lipoprotein subfractions - HDL2 and HDL3 - after use of atorvastatin. Int J Clin Pharmacol Ther. 2014;52:277-283
23. Obiols J, Bargnoux AS, Kuster N, Fesler P, Pieroni L, Badiou S. et al. Validation of a new standardized cystatin C turbidimetric assay: evaluation of the three novel CKD-EPI equations in hypertensive patients. Clin Biochem. 2013;46:1542-1547
24. Liimatainen S, Fallah M, Kharazmi E, Haapala AM, Isojarvi J, Peltola J. High concentration of immunoglobulin A is associated with temporal lobe epilepsy. Epilepsy Res. 2013;103:54-61
25. Jain KK. Nanotechnology in clinical laboratory diagnostics. Clinica chimica acta; international journal of clinical chemistry. 2005;358:37-54
26. Jain KK. Applications of nanobiotechnology in clinical diagnostics. Clinical chemistry. 2007;53:2002-2009
27. Choi YE, Kwak JW, Park JW. Nanotechnology for early cancer detection. Sensors (Basel). 2010;10:428-455
28. Perfezou M, Turner A, Merkoci A. Cancer detection using nanoparticle-based sensors. Chemical Society reviews. 2012;41:2606-2622
29. Tong S, Ren B, Zheng Z, Shen H, Bao G. Tiny grains give huge gains: nanocrystal-based signal amplification for biomolecule detection. ACS Nano. 2013;7:5142-5150
30. Tong S, Hou S, Ren B, Zheng Z, Bao G. Self-assembly of phospholipid-PEG coating on nanoparticles through dual solvent exchange. Nano Lett. 2011;11:3720-3726
31. Hou YL, Xu ZC, Sun SH. Controlled Synthesis and Chemical Conversions of FeO Nanoparticles. Angewandte Chemie-International Edition. 2007;46:6329-6332
32. Artiss JD, Vinogradov S, Zak B. Spectrophotometric Study of Several Sensitive Reagents for Serum Iron. Clin Biochem. 1981;14:311-315
33. Clyne B, Olshaker JS. The C-reactive protein. The Journal of emergency medicine. 1999;17:1019-1025
Author contact
![]() Corresponding author: Gang Bao, Department of Bioengineering, Rice University, Houston, TX 77005, USA E-mail: gang.baoedu.
Corresponding author: Gang Bao, Department of Bioengineering, Rice University, Houston, TX 77005, USA E-mail: gang.baoedu.