Theranostics
13.3
Impact Factor
- Issue 9; 2026
- Issue 8; 2026
- Issue 7; 2026
- Issue 6; 2026
- Issue 5; 2026
- Volume 16; 2026
- Advance Articles
- Past Issues
- Cover Images
- Cover Suggestion
- Special Issues
Top
Introduction
Materials and Methods
Results
Discussion
Conclusion
Supplementary Material
Acknowledgements
References
Introduction
Materials and Methods
Results
Discussion
Conclusion
Supplementary Material
Acknowledgements
References
International Journal of Biological Sciences
International Journal of Medical Sciences
 Global reach, higher impact

Theranostics 2016; 6(10):1588-1600. doi:10.7150/thno.15492 This issue Cite
Research Paper
Label-free CEST MRI Detection of Citicoline-Liposome Drug Delivery in Ischemic Stroke
Huanling Liu1,2*, Anna Jablonska1*, Yuguo Li1,3*, Suyi Cao4, Dexiang Liu1,5, Hanwei Chen1,5, Peter CM Van Zijl1,3, Jeff W.M. Bulte1,3, Miroslaw Janowski1,6, Piotr Walczak1, Guanshu Liu1,3 ![]()
1. Russell H. Morgan Department of Radiology and Radiological Science, Johns Hopkins University School of Medicine, Baltimore, MD, United States;
2. Department of Ultrasound, Guangzhou Panyu Central Hospital, Guangzhou, Guangdong, China;
3. F.M. Kirby Research Center for Functional Brain Imaging, Kennedy Krieger Institute, Baltimore, MD, United States;
4. Department of Anesthesiology, Johns Hopkins University School of Medicine, Baltimore, MD, United States;
5. Department of Radiology, Guangzhou Panyu Central Hospital, Guangzhou, Guangdong, China;
6. NeuroRepair Department, Mossakowski Medical Research Centre, PAS, Warsaw, Poland.
*These authors contributed equally.
Received 2016-3-9; Accepted 2016-5-1; Published 2016-6-18
Citation:
Liu H, Jablonska A, Li Y, Cao S, Liu D, Chen H, Van Zijl PCM, Bulte JWM, Janowski M, Walczak P, Liu G. Label-free CEST MRI Detection of Citicoline-Liposome Drug Delivery in Ischemic Stroke. Theranostics 2016; 6(10):1588-1600. doi:10.7150/thno.15492. https://www.thno.org/v06p1588.htm
Other stylesAbstract

ABSTRACT Citicoline (CDPC) is a natural supplement with well-documented neuroprotective effects in the treatment of neurodegenerative diseases. In the present study, we sought to exploit citicoline as a theranostic agent with its inherent chemical exchange saturation transfer (CEST) MRI signal, which can be directly used as an MRI guidance in the citicoline drug delivery. Our in vitro CEST MRI results showed citicoline has two inherent CEST signals at +1 and +2 ppm, attributed to exchangeable hydroxyl and amine protons, respectively. To facilitate the targeted drug delivery of citicoline to ischemic regions, we prepared liposomes encapsulating citicoline (CDPC-lipo) and characterized the particle properties and CEST MRI properties. The in vivo CEST MRI detection of liposomal citicoline was then examined in a rat brain model of unilateral transient ischemia induced by a two-hour middle cerebral artery occlusion. The results showed that the delivery of CPDC-lipo to the brain ischemic areas could be monitored and quantified by CEST MRI. When administered intra-arterially, CDPC-lipo clearly demonstrated a detectable CEST MRI contrast at 2 ppm. CEST MRI revealed that liposomes preferentially accumulated in the areas of ischemia with a disrupted blood-brain-barrier. We furthermore used CEST MRI to detect the improvement in drug delivery using CDPC-lipo targeted against vascular cell adhesion molecule (VCAM)-1 in the same animal model. The MRI findings were validated using fluorescence microscopy. Hence, liposomal citicoline represents a prototype theranostic system, where the therapeutic agent can be detected directly by CEST MRI in a label-free fashion.
Keywords: Ischemia, stroke, citicoline, liposome, theranostic, CEST MRI.
Introduction
Cytidine-5'-diphosphocholine (CDP-choline CDPCho, or CDPC) is the precursor of phosphatidylcholine (Ptd- Cho), a vital component of neuronal membranes, and has been used widely to treat CNS injuries and diseases [1-5]. Numerous preclinical studies have demonstrated the neuroprotective effects of CDPC through stimulation of the synthesis of brain phospholipids, prevention of phospholipase A2 (PLA2) activation, and reduction of oxidative stress [6, 7]. Under the generic name of citicoline, CDPC has been approved in Europe and Japan for the treatment of head trauma, stroke, and neurodegenerative diseases [8]. To date, citicoline is the one of few clinically available substances that have ever shown significant neuroprotective effects in less severe strokes [6]. Clinical data also have shown the significant effect of citicoline on certain slowly developing neurodegenerative diseases, including glaucoma [1], mild vascular cognitive impairment[9], Parkinson's disease[10], and Alzheimer's disease [11].
However, the therapeutic effect of citicoline has been proven to be ineffective in several recent clinical studies on large populations, for instance, the COBRIT (CiticOline Brain Injury Treatment) trial, performed on 1,213 patients to treat traumatic brain injury [9], and the ICTUS (International Citicoline Trial on Acute Stroke) trial, performed in 2,298 patients to treat moderate-to-severe acute ischemic stroke [8]. These disappointing clinical results were somewhat unexpected compared to the exciting preclinical results. Recent studies indicate that this disparity was likely caused by the limited delivery of the administered citicoline to the injured brain region [12]. After administration, citicoline undergoes rapid hydrolysis and dephosphorylation into cytidine and choline, which then enter the brain separately and are used to resynthesize CDP-choline inside brain cells [5]. The bioavailability in the injured brain was reported to be as low as 0.5% and 2% for oral [13] and intravenous (i.v.) administration [7], respectively. Therefore, there is an urgent need to develop new drug delivery routes that can improve the bioavailability, and, consequently, improve the effectiveness of citicoline treatment. It has been shown that liposome-mediated delivery offers a robust way to improve the therapeutic index of citicoline [14-17]. Using this rationale, Agulla et al. showed a significant improvement in bioavailability of up to 23% in rat ischemic brain using heating-block protein-targeted liposome systems [14]. More importantly, that study employed a Gd-DTPA-label to show the distribution of the injected liposomal citicoline in the brain, thus enabling the real-time monitoring of drug delivery in the injured tissue. Interestingly, the molecular structure of citicoline contains cytosine, a molecule that has been previously explored as a chemical exchange saturation transfer (CEST) agent [18, 19]. We therefore hypothesized that citicoline could also be directly detected by CEST MRI, eliminating the need for a synthetic imaging label. CEST is a recently developed MRI technique by which diamagnetic compounds can be exploited to generate MRI contrast, which greatly expands the scope of 1H-based contrast agents from previously paramagnetic-metal-based T1 and T2 contrast to biocompatible and safe diamagnetic compounds, including sugars (glucose [20-22] and myo-inositol [23]), proteins/peptides [24], metabolites (glutamate [25] and creatine [26]), and heterocyclic compounds [27, 28]. The direct CEST imaging of citicoline would make this therapeutic agent MRI-detectable, rendering the drug and drug delivery systems self-trackable, and thus, theranostic [29].
The objective of this study was to demonstrate the use of citicoline as a theranostic agent in citicoline-loaded liposome-mediated drug delivery systems, which is expected to improve the local effective delivered dose of citicoline to injured tissues in the ischemic brain. With the CEST MRI signal of citicoline, we can directly evaluate the efficiency of a citicoline delivery system, without the need for chemical labeling and additional imaging agents. We chose to use a liposome drug delivery system because this currently is the most versatile form of nanoparticle drug delivery. In addition, liposomes can be easily modified to pursue targeted delivery. We therefore designed and prepared liposomes with a targeting vascular cell adhesion molecule 1 (VCAM-1) that is abundantly expressed on inflamed vessels in the ischemic brain [30].
Materials and Methods
Chemicals. All chemicals were purchased from Sigma-Aldrich (St. Louis, MO) unless otherwise noted. Citicoline was dissolved in phosphate buffered saline (PBS) at the desired concentrations. The solutions were then titrated to pH 7.4 for all studies using 1 M hydrogen chloride and 1 M sodium hydroxide. For the pH dependency study solutions were adjusted from pH=6.0 to pH=8.0.
Liposome preparation and characterization. Citicoline encapsulated liposomes (CDPC-lipo) were prepared using a formulation of DPPC:cholesterol:DPPE-PEG-2000=55:40:5 through thin lipid film hydration, an extrusion method [31]. In brief, the aqueous citicoline solution (100 mg/mL) was freshly prepared in PBS buffer (pH=7.3). Lipids were dissolved in chloroform and evaporated to form a thin dry film, followed by nitrogen purging for 30 min. The lipid film was hydrated with aqueous drug solution above the transition temperature of the lipid, and shaken for 30 min to form large multilamellar liposomes (MLVs). The solution was then extruded through 100 nm polycarbonate membranes for 20 times to obtain small unilamellar vesicles. The collected liposome solution was filtered through Sephadex G-50 gel columns (GE Healthcare Life Sciences, Pittsburg, PA) to remove unloaded citicoline. Phospholipid content in the final solution was analyzed using the colorimetric Stewart assay [32]. The size and size distribution were analyzed by dynamic light-scattering measurements using a Nanosizer ZS90 (Malvern Instruments, Southborough, MA). To quantify the concentration of encapsulated citicoline, liposomes were disrupted by 10% v/v Triton X-100 solution and sonication in a water bath (40 oC) for 30 min [31], followed by the measurement of UV absorbance at 286 nm [16].
To prepare VCAM-1-targeted immunoliposomes, liposomes were further conjugated with anti-rat CD106 antibody (clone MR106, Biolegend, San Diego, CA) or IgG-1 (Kappa from human myeloma plasma) using a method reported previously [33, 34]. In brief, liposomes (DPPC:cholesterol:DPPE-PEG-2000: DPPE-PEG(2000)-COOH =55:40:2.5:2.5) were prepared using the procedures described above. Then, a 300 µL solution was incubated with the activating reagents ethylcarbodiimide hydrochloride (EDC, 9 mg) and sulfo-NHS (11 mg) overnight at room temperature to activate the carboxylic groups of DPPE-PEG(2000)-COOH. After removal of the free activating reagents using Sepharose CL-4B columns (GE Healthcare Life Sciences, Pittsburg, PA) with PBS as the eluent, the activated liposome solution was added to 50 μg of either anti-CD106 or IgG-1, followed by a four-hour incubation at room temperature. Using this procedure, antibodies were attached to liposomes through the reaction between the amine and the activated distal terminals (sulfo-NHS ester) of the linker lipid, DPPE-PEG(2000)-COOH, without compromising their specific binding activity. The nonattached antibodies were removed using Sepharose CL-4B columns, as described above.
To determine the release rate of citicoline from liposomes, the retained citicoline in liposomes dialyzed in a sink condition over time were measured according to our previously published procedure[19, 31]. In brief, liposomes were first filtered immediately after formation using a G50 column. Six samples of 0.3 mL liposome solution were placed in a 0.5 mL dialysis cassette (3.5 KD MW cut off, Thermo scientific). Each of them was immersed in 40 mL PBS buffer under continuous stirring, which was sufficient to produce a good sink condition. At each time point, i.e., 0, 1, 2, 3, 5, and 24 hours, one sample was removed for CEST measurement. After the CEST MRI, the sample was suspended in a 10% v/v Triton X-100 solution and sonicated in a water bath at 40 °C for 30 minutes. After centrifugation (21,000 ×g, 10 min), the supernatant was measured for by UV absorbance at 286 nm using a UV-Vis spectrophotometer.
Microfluidic chamber assay. A pre-cleaned glass slide was sonicated in 0.1% (v/v) octadecyltrichlorosilane (OTS) for 30 minutes. The slide was then incubated in FITC-conjugated goat anti-human IgG Fc fragment-specific antibody (Sigma) before being immobilized with recombinant Fc chimera VCAM-1 (R&D systems) at 1 μg/mL. The slide was then blocked in 1% BSA in D-PBS for at least an hour prior to the running of experiments. The microfluidic device was cleaned in ethanol and dried with air before assembly on top of the patterned glass slide. Via a syringe, 0.1% BSA in PBS was introduced into the channel and allowed to flow for three minutes until flow equilibrated. The device was placed on a microscope stage and connected with a syringe pump (KD scientific) to control flow. After the VCAM-1- and fibronectin-coated patches were evaluated and identified via fluorescence visualization using a Nikon TE300 (Tokyo, Japan), 50 μL of the liposome suspension labeled with Texas Red in PBS were perfused through the inlet channel. A 20x field-of-view (450 x 360 μm2) was used and each perfusion lasted 15 minutes and pictures were obtained every five min. Five ROIs (100x100 μm2) were selected for each series of images and fluorescence intensity was measured using ImageJ (NIH, Bethesda, MD, USA) [36] and results presented as the mean ± standard deviation of three independent experiments.
In vitro CEST MRI assessment. In vitro CEST images were acquired on a 9.4T Bruker Avance system equipped with a 15 mm sawtooth RF coil. A modified RARE sequence (TR=6.0 sec, effective TE=43.2 ms, RARE factor=16, slice thickness=0.7 mm, FOV=14x14 mm, matrix size=128x128, resolution=0.11x0.11 mm2, and NA=2) [37], including a magnetization transfer (MT) module (one CW pulse, B =3.6 μT [150 Hz], 3 sec) was used to acquire CEST-weighted images from -4 ppm to 4 ppm (step=0.2 ppm) around the water resonance (0 ppm) [38], total acquisition time = 32 minutes. The absolute water resonance frequency shift was measured using a Lorentzian model-based WAter Saturation Shift Reference (WASSR) method [39]. The same parameters as in CEST imaging were used except TR=1.5 sec, tsat=500 ms, B1=0.5 μT (21.3 Hz) and the saturation frequency swept from -1 ppm to 1 ppm (step= 0.1 ppm). All the in vitro MRI measurements were carried out at 37 oC.
Data processing was performed using custom-written scripts in MATLAB (Mathworks, Waltham, MA). CEST spectra were calculated from the mean of an ROI placed over each sample after B0 correction of the contrast on a per-voxel basis. The CEST signal was quantified using MTRasym at particular offsets of interest (i.e., Δω= +2.0 ppm) using the definition: MTRasym = (S-Δω - S+Δω)/ S0, where and S[-Δω, +Δω] is the water signal intensity in the presence of saturation pulses at offsets ±Δω, and S0 is the water signal intensity in the absence of saturation pulses.
Animals. All animal experiments were performed in accordance with protocols approved by our Institutional Animal Care and Use Committee. Adult (250 to 300 g) male Wistar rats (n=9) were used to induce transient focal cerebral ischemia, as reported previously [40]. In brief, rats underwent a two-hour middle cerebral artery occlusion (MCAO) with an intraluminal suture [41]. Transcranial laser Doppler flowmetry (Moor Instruments DRT4) measurements were used to monitor the relative cerebral blood flow during the entire ischemia experiment and a reduction to 30-50% compared to baseline was maintained throughout the procedure. For rats receiving i.a. injection after 2-hour ischemia, the intracranial right internal carotid artery (ICA) ipsilateral to the MCAO was cannulated with PE20 Intramedic polyethylene tubing (Clay Adams lnc.) after withdrawal of the suture.
Rats were randomly separated into three groups (n=3 each) to receive: A) i.a. administration of non-targeted CDPC-lipo at a rate of 0.1 mL/min (total injection volume=0.5 mL, 50 mg/kg) two hours after withdrawal of the suture; B) i.v. injection of VCAM-1-targeted CDPC-lipo (total injection volume =0.5 mL, 50 mg/kg [42]) 24 hours after withdrawal of the suture; and C) i.v. injection of IgG-CDPC-lipo (total injection volume =0.5 mL, 50 mg/kg) 24 hours after withdrawal of the suture. Each time before the in vivo studies, the CEST contrast of liposomes to be injected was confirmed using in vitro MRI.
In vivo MRI. All MR images were acquired on an 11.7 T Bruker Biospec horizontal bore scanner (Bruker Biosciences, Billerica, MA) equipped with a rat brain surface array RF coil (receiver) and a 72 mm volume coil (T11232V3, transmitter). Animals were kept anesthetized by first applying 4% isoflurane, which was then maintained at 1-2% during the entire imaging session. Liposomes were infused via either the pre-cannulated polyethylene tubing in right ICA for i.a. injection or through a pre-inserted home-built catheter (constructed from PE-60 tubing and a gauge 27 needle) in the tail vein for i.v. injection. For each animal, prior to the acquisition of CEST MR images, the formation and the extent of the ischemic lesion was assessed using T2w MRI. T2w images were acquired using a RARE sequence with TR/TE=2500/46 ms, slice thickness=1 mm, acquisition matrix size=256x256, FOV=25x25 mm, and NA=4 (total acquisition time=2 min 40 sec).
CEST images were acquired using the same imaging scheme described above, with the addition of a fat-suppression pulse (3.4 ms hermite pulse, offset=-3.5 ppm) between the saturation pulse and RARE acquisition. The acquisition parameters were: TR=5.0 sec; effective TE=6 ms; RARE factor=20; tsat=3 sec; B1=2.7 μT; slice thickness=1 mm; acquisition matrix size=64x64; FOV=25x25 mm; and NA=2. For the dynamic study, CEST MR images were repetitively acquired at the offsets of ±1.6, ±1.8, ±2.0, ±2.2, and ±2.4 ppm for 1.5 hours. Each CEST acquisition session took approximately five minutes. The baseline of CEST contrast was determined based the average of the first two scans. The injection was started after the first two sessions were completed. Before and after the dynamic CEST study, two full Z spectra were also acquired from -4 to +4 ppm (0.2 ppm steps). Two WASSR acquisitions were acquired after each Z-spectral CEST acquisition, with the saturation frequencies swept from -1 ppm to +1 ppm (in 0.1 ppm steps), which should have covered the entire range of the B0 field inhomogeneity and ensured accurate B0 mapping and correction. Data were processed using custom-written MATLAB scripts. The dynamic CEST contrast was quantified by ΔMTRasym(t)=MTRasym(t) - MTRasym (t=0).
Fluorescence microscopy. Animals were anesthetized with sodium pentobarbital (50 mg/kg, i.p.), and transcardially perfused with 10 mL 0.9% heparinized saline followed by 10 mL 4% paraformaldehyde in phosphate-buffered saline. After dissection, the brains were post-fixed, cryoprotected with 20% sucrose and frozen in dry ice. 20 μm thick brain slices were stained with DAPI (Sigma) for the cell nuclei and anti-von Willebrand factor (vWF, Santa Cruz) for activated endothelial cell visualization. Using a Zeiss microscope, whole brain slice images were analyzed for localization of red-stained liposomes.
Statistics. Data is presented as mean ± standard deviation. Student's t-test (two-tailed, unpaired) was performed to compare the difference in two groups. Cohen's d effect sizes were calculated by d=(meanpre-meanpost)/sqrt([SDpre2+SDpost2]x[n-1]/2n) and d>0.8 is considered as a large effect size. [43]
Results
Citicoline as a theranostic CEST agent. To confirm the CEST MRI detectability of citicoline, we first examined T1, T2 and CEST MRI properties of citicoline in vitro at pH 7.4 and 37 oC. The r1 and r2 relaxivities were measured to be 7x10⁻⁴ s-1mM-1 and 1.4x10⁻² s-1mM-1 respectively (Supplementary Materials), indicating a negligible T1 and T2 contrast. As shown in Figures 1b and 1c, citicoline has two CEST peaks at 1.0 and 2.0 ppm, attributed to the exchangeable amine (NH2) and hydroxyl (OH) protons. The Z-spectra (S/S0) and MTRasym data are shown in Figures 1b and 1c, respectively. As shown in Figure 1d, there is a good linearity between the CEST MRI signal, as quantified by MTRasym, and the concentration of citicoline up to about 5 mM. The CEST contrasts generated by 1 mM citicoline were 1.0±0.1% and 1.5±0.15% for NH2 and OH, respectively, which is specific for our acquisition conditions (i.e., B1=3.6, Tsat=3 sec). At this concentration, the contrast-to-noise ratio (CNR) for these PBS samples was approximately 29 and 45 for NH2 and OH, respectively, indicating that the detection limit of CEST MRI is far less than 1 mM[44]. CEST MRI, therefore, can be used to detect citicoline without the need for other imaging probes. As shown in Figure 1e, our in vitro MRI results demonstrate that CEST MRI can be used to detect citicoline at a high spatial resolution (~100x100 µm2).
To study the pH dependence of the CEST contrast of citicoline, we varied the pH of citicoline samples from 6.0 to 8.0. As shown in Figure 2, the CEST signal of OH protons was strongly pH-sensitive in terms of both the intensity and apparent chemical shift (CEST frequency) change - when the pH was lowered, the intensity of the OH markedly increased, with the CEST peak shifting from 1.0 ppm to 1.3 ppm. In contrast, the CEST signal at 2.0 ppm for NH2 protons was relatively pH-insensitive between pH 6.0 to pH 7.5. Considering the potential variation in pH during pathological progression, the pH-independence of the CEST signal of NH2 at 2.0 ppm makes it more suitable for in vivo drug detection purposes.
Figure 1
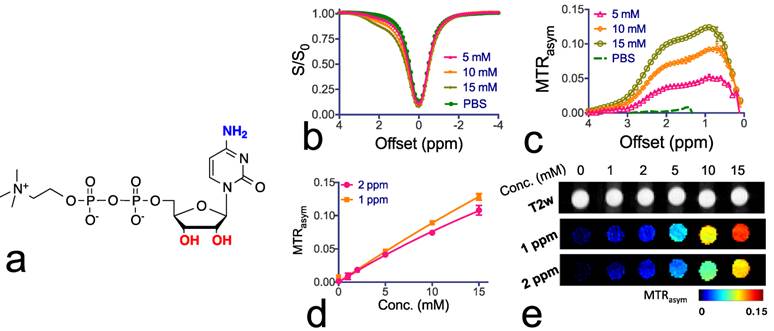
Chemical structure and CEST properties of citicoline. (a) Molecular structure of citicoline with the exchangeable protons marked in blue (NH2) and red (OH). (b) Z-spectra and (c) MTRasym plots of the CEST contrast of citicoline at 5, 10, and 15 mM. (d) Concentration dependence of the CEST contrast at frequency offsets 1 ppm (OH) and 2 ppm (NH2), respectively. (e) T2w images (top row) and corresponding CEST parametric maps at 1 ppm (middle row) and 2 ppm (bottom row). CEST MRI data were acquired at 37oC using B1=3.6 µT and Tsat= 3 seconds. All samples were at pH 7.4 in PBS buffer. Data are presented as mean ± standard deviation of three replicates.
Figure 2
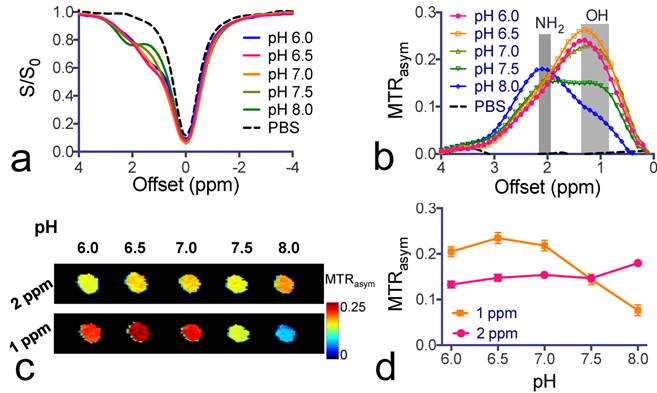
pH-dependence of citicoline CEST contrast. (a) Z-spectra and (b) MTRasym plots of the CEST contrast of citicoline at pH values ranging from 6.0 to 8.0. (c) CEST parametric maps at 1 ppm (OH) and 2 ppm (NH2), respectively. (d) pH-dependence of the CEST contrast at 1 and 2 ppm, respectively. CEST MRI data were acquired at 37oC using B1=3.6 µT and Tsat= 3 seconds. All samples were at a concentration of 20 mM in PBS buffer. Data are presented as mean ± standard deviation of three replicates.
Citicoline-liposomes can be detected by CEST MRI. We sought to improve the efficiency of citicoline drug delivery by means of liposome encapsulation (Figure 3a). This not only prevents the drug from being catabolized after systemic administration, but also provides an effective way to pursue targeted delivery using surface-modified immunoliposomes. We chose to use DPPC to prepare liposomes because it was reported to obtain a higher loading rate than other phospholipids[45]. As measured using DSL, the prepared liposomes had a narrow distribution of hydrodynamic radii around 120 nm. Based on the citicoline concentration measured by UV absorbance at 286 nm[16], the encapsulation efficiencies of citicoline were determined to be 13.8% and 7.0% for liposomes dialyzed for 3 and 24 hours, respectively. This corresponds to drug contents of 24.4% and 13.9%, respectively.
Figure 3
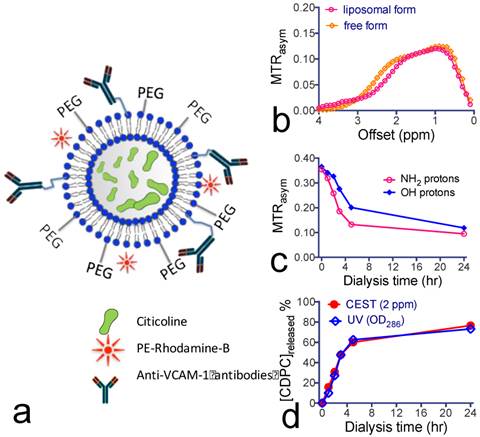
Construction and characterization of citicoline-encapsulated liposomes. (a) Illustration of the construction of liposomes for CEST MRI-guided, VCAM-1-targeted delivery of citicoline. (b) CEST signal of citicoline liposomes (~ 40 nM per liposome and 21.5 per citicoline) with a 15 mM free citicoline solution (pH 7.4) as the reference. (c) Dynamic CEST signal changes during dialysis at 1 ppm and 2 ppm, respectively, associated with the release of citicoline from liposomes. (d) Kinetics of the drug release at different time points studied by CEST (2 ppm) and UV absorption (OD286), respectively.
The in vitro results in Figure 3b show that the encapsulated citicoline exhibited a CEST pattern nearly identical to the nonencapsulated citicoline. As a comparison, ~40 nM liposomes (estimated [citicoline]= 21.5 mM) produced a similar CEST signal as that of 15 mM citicoline in its free form. The CEST MRI signal allowed the direct quantification of liposomal citicoline. We used this method to quantify the stability of citicoline inside the lumen of liposomes. As shown in Figure 3c, there was a biphasic release of citicoline: a rapid drug release in the first four hours followed by a much slower, gradual drug release in the next 20 hours. The rapid initial citicoline leakage was likely due to residual drug molecules absorbed on the surface of the liposome bilayer during the preparation. The later gradual release of the drug was attributed to normal permeation through the liposome lamellae. Using the MTRasym values at the final time point and the concentration-dependence study shown in Figure 1d, we estimated that approximately 9 mM citicoline remained in the liposomes (lipid concentration = 28 mg/mL) after a 24-hour dialysis. As shown in Figure 3d, the kinetics of citicoline release from liposomes obtained by CEST MRI was consistent with the measurement by OD286. After dialysis for 24 hours, there was still more than 20% of loaded citicoline retained inside liposomes.
CEST MRI after intra-arterial delivery of citicoline-liposomes. We applied our CEST MRI-guided delivery of CDPC-lipo to rat brain after the induction of acute ischemic stroke. As shown in Figure 4, a hyper-intense area was visible after a two-hour middle cerebral artery occlusion (MCAO) and a two-hour reperfusion, indicative of ischemic brain injury in these areas. Following MCAO, rats received an i.a. injection of CDPC-lipo on the ipsilateral side of the MCAO at a dose of 50 mg/kg. CEST parametric maps obtained at 1.5 hours after the injection showed a strongly elevated CEST signal (Figures 4b and 4c). Specifically, more than 18.3% of the area in the ipsilateral hemisphere exhibited a CEST enhancement >3%, whilst only 3.6% of the area in the contralateral hemisphere had the same level of CEST enhancement. The same conclusion can be drawn from the histogram analysis (Figure 4d), in which the populations of the MTRasym values at 2.0 ppm of all the pixels in the rat brain before and after the injection of CDPC-lipo are compared. We then computed the ∆CEST (∆MTRasym) map to directly visualize the scope and distribution of the increase in CEST signal in the rat brain. As shown in Figure 4e and Figure 4f, the distribution of CDPC-lipo was highly correlated with the distribution of CDPC-lipo detected by fluorescence microscopy of the brain section, in which liposomes were visualized as red spots by conjugated rhodamine-B, except in some areas. These regions, where very high CEST elevation (i.e., ∆MTRasym >10%) was observed, coincided with the hyperintensive areas shown in the T2w image (Figure 4a) and correspond exactly to the anatomical location of the large arteries: the lenticulostriate artery and the middle cerebral arteries. The high increase of CEST signal in these areas was likely due to either a high concentration citicoline or these compartments have long T1 and T2 relaxation times [46]. The mismatch between the CEST MRI and fluorescence microscopy is likely due to the citicoline in vascular compartments washing away during the perfusion procedure. As revealed by the ROI analysis on the two representative ROIs (Figure 4g), an increase in the CEST signal could be observed in the ROI on the ipsilateral side, with increased peaks at around 2 ppm, and an average contrast increase of 4.3 ± 3.6% (Figure 4h, mean ± standard deviation in the ROI), while a negligible effect (i.e., 0.3 ± 2.2%) was observed in the contralateral side (Figure 4i). The uptake of citicoline in the rat brain in this group of animals (n=3) resulted in a 1.4% average signal increase in terms of ∆MTRasym at 2.0 ppm, which corresponded to a 100% CEST signal change (the averaged pre- and post- CEST signals in the brain were 1.4 ± 0.6% and 2.8 ± 2.0% respectively, and Cohen's d effect size =0.83; data are presented as mean ± standard deviation of three animals). According to the in vitro calibration study (Figure 1d), this effect corresponds to an average uptake of roughly 2 mM citicoline in these regions.
Figure 4
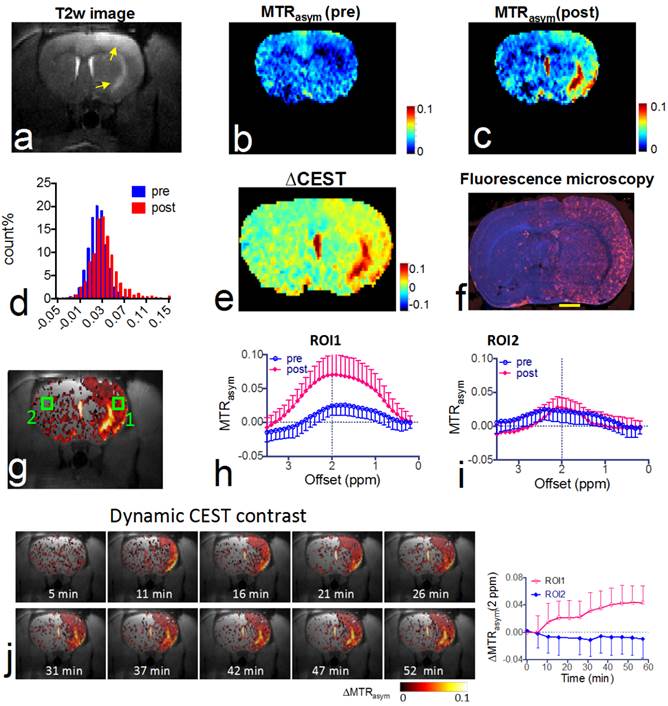
In vivo CEST MRI detection of the delivery of citicoline- liposomes in rat brain after acute ischemic injury. (a) T2w MRI showing hyperintensity in the injured areas. (b) CEST images (MTRasym maps at 2.0 ppm) before and (c) at 1.5 hours after i.a. injection of CDPC-lipo, showing the elevated CEST signal in the ischemic region. (d) Histogram of the CEST signal before and after administration. (e) ∆CEST map as calculated by ∆MTRasym= MTRasym(post)-MTRasym(pre). (f) Fluorescence microscopy of nuclei (blue, stained with DAPI) and liposomes (red, rhodamine-B-labeled). Scale bar= 2 mm. (g) Overlay image of the ∆CEST map and the T2w image with the two ROIs chosen for ROI analysis. (h) MTRasym plots before (blue) and (i) at 1.5 hours after (red) i.a. injection of CDPC-lipo for ROI 1 and ROI 2, respectively. (j) The dynamic CEST contrast change of the stroke within the first 1.5 hours after i.a. injection of CDPC-lipo. Left: dynamic CEST images calculated by The dynamic CEST contrast was quantified by ΔMTRasym(t)=MTRasym(t) - MTRasym(t=0); Right: the mean ROI CEST signal change of the two ROIs shown in g, where data are presented as mean ± standard deviation.
Figure 5
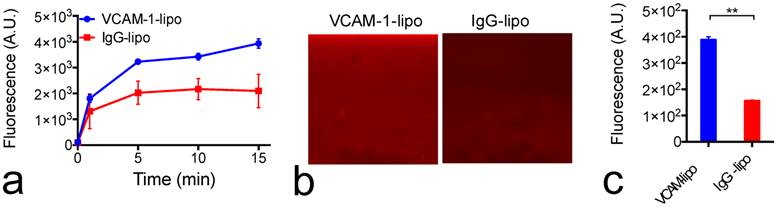
VCAM-1 and immunoliposome microfluidic chamber binding assay. (a) Dynamic binding of VCAM-1-lipo and IgG-lipo to the VCAM-1-coated channel, as studied by changes in the fluorescence signal. Each point represents the mean and standard deviation of five ROIs at each time point. (b) Two representative fluorescence images of the microfluidic channels at the end of the 15-minute perfusion period for IgG liposomes (left) and VCAM-1-targeted liposomes (right). (c) Fluorescence intensities of VCAM-1-coated channels perfused with VCAM-1-lipo and IgG-lipo at the end of the 15-minute perfusion period. Each point represents the mean and standard deviation of five ROIs. ** Indicates significant difference (P<0.01, two-tailed paired Student's t-test).
Construction of VCAM-1-targeted citicoline-liposomes. While i.a. administration offers a powerful means for enhanced drug delivery, not every patient is suitable for such a procedure. Alternatively, we also designed and prepared VCAM-1-targeted immunoliposomes (Figure 3a) that could be applied through a more convenient systemic administration route—i.v. injection with the ability to selectively enhance the citicoline uptake in the inflammatory blood vessels associated with the progress of ischemic stroke. As measured by DSL, the addition of anti-VCAM-1 antibodies to CPDC-lipo did not significantly change the size and stability of liposomes. The ability to selectively bind to VCAM-1-expressing endothelial cells was examined using a microfluidic channel assay (Figure 5). When fluorescently-labeled liposomes perfused through the VCAM-1-coated microfluidic channel, VCAM-1-targeted liposomes showed a significantly higher binding affinity than non-specific-IgG-conjugated liposomes, as early as two to five minutes after the perfusion started (Figure 5a). At the end of the 15-minute continuous flow, the VCAM-1 channels perfused with VCAM-1-liposomes showed a two-fold higher fluorescence signal than that perfused with non-targeted liposomes (Figures 5b &5c), showing the strong binding ability of the prepared targeted liposomes with VCAM-1.
CEST MRI after intravenous injection of VCAM-1-targeted citicoline-liposomes. After having confirmed the affinity of targeted liposomes to bind VCAM-1 in vitro, we applied VCAM-1-targeted CDPC-liposomes (VCAM-1-CDPC-lipo) in a rat MCAO model. I.v. injection was performed 24 hours after the onset of stroke (Figure 6a and Figure 7a), as at this point expression of neuroinflammatory vascular adhesion molecules is highly elevated [47]. Compared to liposomes conjugated with non-targeted IgG antibodies (IgG-CDPC-lipo), VCAM-1-CDPC-lipo was found to be taken up preferentially by the ischemic rat brain (Figures 6d-6e and Figures 7d-7e ). This was verified by fluorescence microscopy (Figure 6f, Figure 7f and Figure 8). Histogram analysis (Figure 6g vs Figure 7g) also confirmed the shift of the populations of the pixel-wise CEST signal in the rat brains before and after the injection of VCAM-1-CDPC-lipo, but not in those injected with IgG-CDPC-lipo. The net increase in CEST signal at 2.0 ppm in the rat brains was estimated to be 0.3% in MTRasym or a 29% relative CEST signal increase (MTRasympre=1.7 ± 0.1% and MTRasympost= 2.0 ± 0.3%, Cohen's d effect size= 1.6) among the rats that received VCAM-1-CDPC-lipo (P=0.028; two-tailed, unpaired Student's t test, n=3). Conversely, there was no significant change in the control group (P=0.77; two-tailed, unpaired Student's t test, n=3). However, the uptake of VCAM-targeted liposomes in the rat brains after ischemic injury was approximately 4-fold lower and showed a more dispersed distribution than that of i.a. injection. It should be noted that there was some discrepancy between fluorescence and CEST images. We speculated it was caused by two reasons: 1) CEST might not be sensitive enough to catch all the liposomes shown on the fluorescence images; 2) The CEST contrast comes from the MRI slice of 1 mm thickness, and fluorescence from a slice of 20 µm thickness.
Discussion
In this study, we showed that the clinically available neuroprotective agent citicoline is an inherent theranostic agent for CEST MRI detection. Such a 'label-free' approach could eliminate the barriers that prevent the rapid translation to the clinic of new nanoparticle drug delivery systems. As an example, we used liposomes as a platform drug carrier for the delivery of citicoline and demonstrated its ability to image drug delivery to areas of ischemic stroke. We chose liposomes because they are very well known biocompatible carriers, capable of enhancing cross-BBB transport in the appropriate size range, and are easily modified with targeting moieties [14, 15]. A recent report has also shown that, by conjugating heat shock protein HSP72 targeting anitbodies, the delivery of citicoline-encapsulated liposomes to ischemic brain tissues could be markedly improved [48]. Conventionally, Gd-DTPA- conjugated liposomes [48-50] or super paramagnetic iron oxide (SPIO) nanoparticle-filled magnetoliposomes [51, 52] have been constructed to make liposomes MRI-detectable. With sophisticated designs, iron oxide nanoparticles and Gd-based agents have been demonstrated to enable monitoring not only drug delivery but also drug release by observing the change in T1 and T2/T2* contrast after the drugs are released from liposomes[53, 54]. However, the requirement of additional elements and additional steps for chemical conjugation or labeling may hinder the clinical translation of these systems, especially with recently raised concerns about the safety of Gd-DTPA [55]. Moreover, these labeling strategies are indirect—the detectable MRI signal reflects only the location of the drug carriers rather than the encapsulated drug itself. Our approach for citicoline utilized the CEST MRI signal carried by the drug molecules, effectively avoiding these drawbacks of conventional methods and providing a safe and direct way to monitor the drug delivery. This not only can aid in the development of novel delivery systems for citicoline, but also will provide a useful means by which to monitor the effectiveness of citicoline delivery in individual patients to achieve personalized medicine. Using liposome-mediated drug delivery has been proven to be an effective strategy to improve the outcome of citicoline treatment [16, 17, 42, 45, 48]. However, while liposome encapsulation could effectively improve the bioavailability of citicoline in injured brain regions, the actual outcome might be highly dependent on the status of perfusion and BBB integrity. Directly using the CEST MRI signal carried by citicoline to monitor the drug delivery of the encapsulated citicoline makes such nanoparticulate drug delivery systems inherently MRI-trackable.
Figure 6
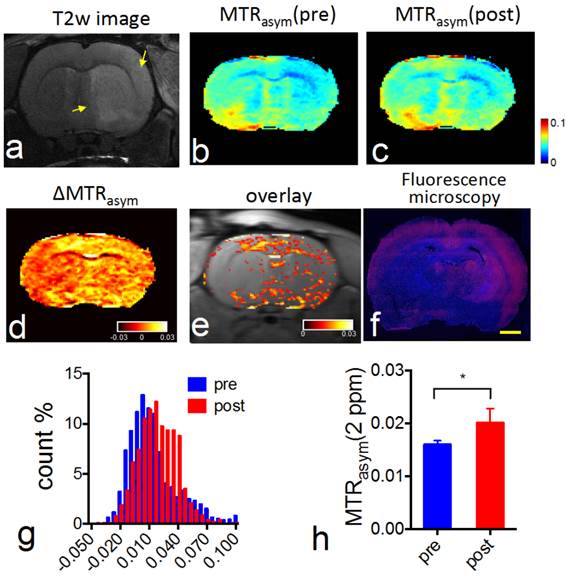
In vivo CEST MRI detection of the delivery of CDPC-lipo conjugated with anti-VCAM-1 (VCAM-1-CDPC-lipo) in ischemic rat brain. (a) High resolution T2 weighting image showing the ischemic stroke region (yellow arrow). (b) CEST images (MTRasym maps at 2.0 ppm) before and (c) 1.5 hours after injection. (d) ∆CEST map (-0.03<∆MTRasym< 0.03) as calculated by ∆MTRasym= MTRasym(post)-MTRasym(pre). (e) Overlay images of the ∆CEST map (0<∆MTRasym< 0.03) and T2w image. (f) Fluorescence microscopy of nuclei (blue, stained with DAPI) and liposomes (red, rhodamine-B-labeled). Scale bar= 2 mm. (g) Histogram of CEST signal before and after the administration of VCAM-1-CDPC-lipo. (h) The average pre- and post- CEST signal at 2 ppm in the brains of the groups injected with VCAM-1-CDPC-lipo (P=0.028; n=3).
Figure 7
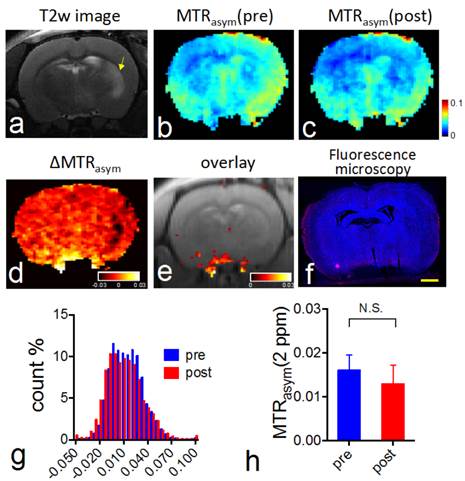
In vivo CEST MRI detection of the delivery of CDPC-lipo conjugated with control IgG-CDPC-lipo in ischemic rat brain. (a) High resolution T2 weighting image showing the ischemic stroke region (yellow arrow). (b) CEST images (MTRasym maps at 2.0 ppm) before and (c) 1.5 hours after injection. (d) ∆CEST map (-0.03<∆MTRasym< 0.03) as calculated by ∆MTRasym= MTRasym(post)-MTRasym(pre). (e) Overlay images of the ∆CEST map (0<∆MTRasym< 0.03) and T2w image. (f) Fluorescence microscopy of nuclei (blue, stained with DAPI) and liposomes (red, rhodamine-B-labeled). Scale bar= 2 mm. (g) Histogram of CEST signal before and after the administration of IgG-CDPC-lipo. (h) The average pre- and post- CEST signal at 2 ppm in the brains of the groups injected with IgG-CDPC-lipo (P= 0.77, n=3).
Figure 8
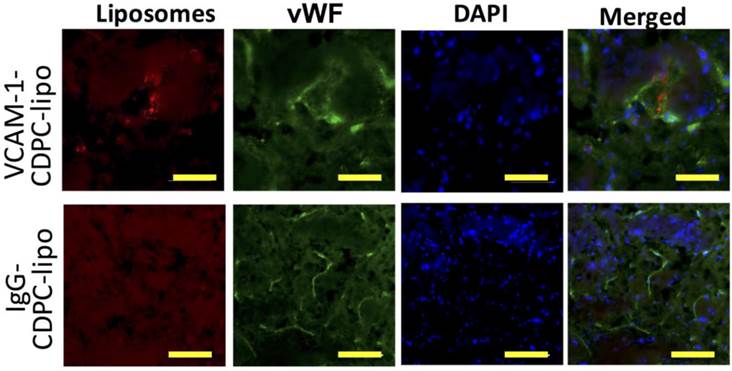
Immunofluorescence microscopy showing the distribution of VCAM-1-CDPC-lipo (top row) and IgG-CDPC-lipo (bottom row) in rat brain. red: Liposomes labeled with Rhodamine-B; Green: endothelium stained with anti-von Willebrand factor (vWF); and Blue: nuclei stained with DAPI. Scale bar= 50 µm.
We demonstrated that CEST MRI guidance could be used to improve the effectiveness of the nanoparticle-mediated drug delivery of citicoline, either through the design of new nanoparticle drug delivery systems or through the optimal use of currently available systems. For example, our MRI results showed that the i.a. delivery of citicoline-encapsulated liposomes offered a very powerful way to deliver a markedly high amount of citicoline to the injured rat brains. Notably, interventional neuroradiology procedures are becoming a standard of care for stroke patients, offering a unique opportunity for locally targeted i.a. injection of drugs to the injured regions through cerebral arteries at the end of intervention. Nowadays, intra-arterial (i.a.) reperfusion therapy has attracted broad interest and several clinical trials have been carried out with a clear benefit in stoke patients [56, 57]. Direct delivery of drugs to infarcted areas can be achieved after reperfusion therapy, which can exert additive or synergic benefits in treating stroke patients. Image-based navigation of i.a. injection procedure can assure the sufficient drug delivery to the targeted brain territory, which hence is highly desirable [58].
On the other hand, however, not all patients qualify for recanalization at the acute stage and i.v. administration should be considered for this group. Thus, we also sought to construct immunoliposomes that could be used as i.v.-administered agents. We chose VCAM-1 as the target for drug delivery in our study because VCAM-1 is an important mediator of mononuclear leukocyte recruitment and lesion initiation. VCAM-1 is expressed highly only in association with neuroinflammation in ischemic stroke [40, 59, 60], and has been used as an effective target for drug delivery in numerous preclinical studies [30, 61]. The results showed that the conjugation of VCAM-1-specific antibodies significantly enhanced the brain uptake of citicoline liposomes compared to that of non-targeted liposomes. However, i.a. delivery of non-targeted liposomes was still more effective, and offered an approximately 10 times higher average increase in terms of the CEST MRI signal (amount of citicoline) in the rat brain than i.v. injection of VCAM-1-targeted liposomes.
Another advantage of CEST MRI contrast is its unique property of being “switchable”— i.e. contrast is only visible when the saturation RF pulses are turned on. In other words, contrary to conventional T1 and T2 MRI contrast agents, the presence of CEST MRI contrast will not markedly compromise the inherent tissue T1 and T2 properties. Our experimental results showed that both the r1 and r2 relaxivities are very low, indicating that low concentration of citicoline (i.e., ~ mM) would not cause a significant impact on tissue T1 and T2 relaxation times. Because the tissue T1, T2, diffusion, and perfusion are clinically important parameters for the evaluation of the progression of ischemic stroke, the preservation of inherent tissue MRI contrast makes it possible to combine CEST MRI-guided drug delivery with these inherent MRI tissue contrasts.
Our approach has several limitations. First, the sensitivity of CEST MRI should be considered. Our in vitro results showed that the detection limit for citicoline is less than 1 mM. However, in vivo detectability may be reduced considering there is a substantially higher physiological noise level, as the MRI detectability is determined by the contrast-to-noise ratio (CNR) [44]. It should also be noted that, when citicoline is encapsulated in liposomes, the CEST signal of liposomal citicoline is lower than its free form because a single-compartment CEST now is replaced by a compartmental exchange model, in which both the exchange rate of the CEST agents encapsulated in the liposomes and the exchange rate of water molecules across the membrane (typically 102 - 103 Hz)[62] contribute jointly to the apparent CEST signal. Fortunately, as a supplemental and therapeutic agent that has been used in the clinic for a long time, citicoline has a well-established safety profile and can be used at an extremely high dose (500-2000 mg daily, administered i.v.), and a high dose would greatly ease the CEST MRI detection and quantification [8, 63]. The median lethal doses (LD50) for acute single i.v. application of citicoline are reportedly as high as 4,600 and 4,150 mg/kg in mice and rats, respectively[64]. Second, CEST contrast can be affected significantly by tissue T1 relaxation times as reported previously [44, 46, 65] and shown by our present phantom study on samples doped with different concentrations of Gd-DTPA or MnCl2 (Supplementary Materials). For an accurate quantification of citicoline concentration in different tissues with different T1 relaxation times, relaxation-corrected CEST metrics such as the labile proton concentration-weighted chemical exchange rate (kws) [65] and the apparent exchange-dependent relaxation (AREX) [66] should be considered. Third, the endogenous CEST signal, i.e., amide protons (APT), would decrease as a result of the progression of ischemic damage [67, 68], which may complicate the interpretation of CEST MRI after the administration of citicoline-encapsulated drug delivery. Fortunately, the dominant chemical shift for amide protons is 3.5 ppm, which can be separated from the effect of citicoline at 1 and 2 ppm. Moreover, several new CEST MRI techniques [69, 70] have been invented recently with the ability to filter out CEST MRI effects based on exchange rates, which could also be used for the accurate quantification of citicoline. For example, the exchange rate of citicoline is measured as ~1200 Hz at pH 7.4 and 37 oC (supplementary materials), which in principle can be separated from other CEST species, i.e., protein amide protons (3.5 ppm, Kex~30 Hz and 60 Hz for in vivo [71] and cross-linked serum albumin phantom respectively [72]), glutamine (~3 ppm, Kex~5,500 Hz [25]) and sugars (i.e., glucose, ~1 ppm, Kex~2,300 Hz [20], myo-inositol, ~ 1 ppm, Kex~ 600 Hz [73]). Finally, although we developed our technique using an 11.7T high-field, small animal MRI scanner, it has been shown that CEST technologies can be quickly translated from pre-clinical scanners (e.g., 9.4T or 11.7T) to clinical 3T [74, 75] and 7T scanners [76]. While the CEST MRI detection of exchangeable protons resonant at 1-2 ppm could be challenging, several recent clinical studies have demonstrated that it is feasible to detect glycosaminoglycan (GAG) [77, 78] and glycogen [79] using clinical 3T scanners. Hence, there are no formidable technical hurdles for future clinical translation, and we expect that, after being fully validated in preclinical studies, our approach will potentially have an immediate clinical impact.
Conclusion
Chemical exchange saturation transfer (CEST) imaging is a relatively new magnetic resonance imaging contrast approach that makes it possible to directly detect diamagnetic drugs that contain exchangeable protons. In the present study, we demonstrated a direct way to detect the therapeutic agent CDPC via its inherent CEST MRI contrast, making it a theranostic agent. Subsequently, we demonstrated that CDPC-loaded liposomes could be detected directly through the CEST MRI signal of citicoline in the rat brain after ischemia, without the need for any extra imaging agents. This approach is versatile for developing citicoline-based, (self-) image-guided, nanoparticulate therapeutics for the treatment of ischemic stroke.
Supplementary Material
Supplementary figures.
Acknowledgements
The authors thank Mary McAllister for editorial assistance. This research was supported by NIH grants R21EB015609, R01EB015032. H. Liu, D. Liu and H. Chen were supported by Key Medicine Discipline Construction of Guangzhou Municipality (grant number 2013-21).
Competing Interests
The authors have declared that no competing interest exists.
References
1. Roberti G, Tanga L, Michelessi M, Quaranta L, Parisi V, Manni G. et al. Cytidine 5'-Diphosphocholine (Citicoline) in Glaucoma: Rationale of Its Use, Current Evidence and Future Perspectives. Int J Mol Sci. 2015;16:28401-17
2. Grieb P. Beneficial effects of exogenous CDP-choline (citicoline) in EAE. Brain. 2015;138:e388
3. Ghosh S, Das SK, Nath T, Ghosh KC, Bhattacharyya R, Mondal GP. The effect of citicoline on stroke: A comparative study from the Eastern part of India. Neurol India. 2015;63:697-701
4. Overgaard K. The effects of citicoline on acute ischemic stroke: a review. J Stroke Cerebrovasc Dis. 2014;23:1764-9
5. Grieb P. Neuroprotective properties of citicoline: facts, doubts and unresolved issues. CNS Drugs. 2014;28:185-93
6. Secades JJ. Citicoline: pharmacological and clinical review, 2010 update. Rev Neurol. 2011;52:S1-S62
7. Adibhatla RM, Hatcher JF, Dempsey RJ. Citicoline: neuroprotective mechanisms in cerebral ischemia. J Neurochem. 2002;80:12-23
8. Dávalos A, Alvarez-Sabín J, Castillo J, Díez-Tejedor E, Ferro J, Martínez-Vila E. et al. Citicoline in the treatment of acute ischaemic stroke: an international, randomised, multicentre, placebo-controlled study (ICTUS trial). The Lancet. 2012;380:349-57
9. Zafonte RD, Bagiella E, Ansel BM, Novack TA, Friedewald WT, Hesdorffer DC. et al. Effect of citicoline on functional and cognitive status among patients with traumatic brain injury: Citicoline Brain Injury Treatment Trial (COBRIT). JAMA. 2012;308:1993-2000
10. Eberhardt R, Birbamer G, Gerstenbrand F, Rainer E, Traegner H. Citicoline in the treatment of Parkinson's disease. Clin Ther. 1989;12:489-95
11. Alvarez X, Mouzo R, Pichel V, Perez P, Laredo M, Fernandez-Novoa L. et al. Double-blind placebo-controlled study with citicoline in APOE genotyped Alzheimer's disease patients. Effects on cognitive performance, brain bioelectrical activity and cerebral perfusion. Methods Find Exp Clin Pharmacol. 1999;21:633-44
12. D'Orlando K, Sandage Jr BW. Citicoline (CDP-choline): mechanisms of action and effects in ischemic brain injury. Neurol Res. 1995;17:281
13. Agut J, Font E, Sacristan A, Ortiz J. Bioavailability of methyl-14C CDP-choline by oral route. Arzneimittelforschung. 1983;33:1045
14. Ramos-Cabrer P, Campos F. Liposomes and nanotechnology in drug development: focus on neurological targets. Int J Nanomedicine. 2013;8:951-60
15. Ramos-Cabrer P, Campos F, Sobrino T, Castillo J. Targeting the ischemic penumbra. Stroke. 2011;42:S7-11
16. FRESTA M, PUGLISI G, GIACOMO C, RUSSO A. Liposomes as In-vivo Carriers for Citicoline: Effects on Rat Cerebral Post-ischaemic Reperfusion. J Pharm Pharmacol. 1994;46:974-81
17. Puglisi G, Fresta M, La Rosa C, Ventura C, Panico A, Mazzone G. Liposomes as a potential drug carrier for citicoline (CDP-choline) and the effect of formulation conditions on encapsulation efficiency. Die Pharmazie. 1992;47:211-5
18. Liu G, Liang Y, Bar-Shir A, Chan KW, Galpoththawela CS, Bernard SM. et al. Monitoring enzyme activity using a diamagnetic chemical exchange saturation transfer magnetic resonance imaging contrast agent. J Am Chem Soc. 2011;133:16326-9
19. Li Y, Chen H, Xu J, Yadav NN, Chan KW, Luo L. et al. CEST theranostics: label-free MR imaging of anticancer drugs. Oncotarget. 2016;7:6369-78
20. Chan KW, McMahon MT, Kato Y, Liu G, Bulte JW, Bhujwalla ZM. et al. Natural D-glucose as a biodegradable MRI contrast agent for detecting cancer. Magn Reson Med. 2012;68:1764-73
21. Walker-Samuel S, Ramasawmy R, Torrealdea F, Rega M, Rajkumar V, Johnson SP. et al. In vivo imaging of glucose uptake and metabolism in tumors. Nat Med. 2013;19:1067-72
22. Song X, Airan RD, Arifin DR, Bar-Shir A, Kadayakkara DK, Liu G. et al. Label-free in vivo molecular imaging of underglycosylated mucin-1 expression in tumour cells. Nat Commun. 2015;6:6719
23. Haris M, Singh A, Cai K, Nath K, Crescenzi R, Kogan F. et al. MICEST: a potential tool for non-invasive detection of molecular changes in Alzheimer's disease. J Neurosci Methods. 2013;212:87-93
24. Gilad AA, McMahon MT, Walczak P, Winnard PT Jr, Raman V, van Laarhoven HW. et al. Artificial reporter gene providing MRI contrast based on proton exchange. Nat Biotechnol. 2007;25:217-9
25. Cai K, Haris M, Singh A, Kogan F, Greenberg JH, Hariharan H. et al. Magnetic resonance imaging of glutamate. Nat Med. 2012;18:302-6
26. Kogan F, Haris M, Singh A, Cai K, Debrosse C, Nanga RP. et al. Method for high-resolution imaging of creatine in vivo using chemical exchange saturation transfer. Magn Reson Med. 2014;71:164-72
27. Ward KM, Aletras AH, Balaban RS. A new class of contrast agents for MRI based on proton chemical exchange dependent saturation transfer (CEST). J Magn Reson. 2000;143:79-87
28. Yang X, Song X, Li Y, Liu G, Ray Banerjee S, Pomper MG. et al. Salicylic acid and analogues as diaCEST MRI contrast agents with highly shifted exchangeable proton frequencies. Angew Chem Int Ed Engl. 2013;52:8116-9
29. Sumer B, Gao J. Theranostic nanomedicine for cancer. Nanomed. 2008;3:137-40
30. Gorelik M, Orukari I, Wang J, Galpoththawela S, Kim H, Levy M. et al. Use of MR cell tracking to evaluate targeting of glial precursor cells to inflammatory tissue by exploiting the very late antigen-4 docking receptor. Radiology. 2012;265:175-85
31. Liu G, Moake M, Har-el YE, Long CM, Chan KW, Cardona A. et al. In vivo multicolor molecular MR imaging using diamagnetic chemical exchange saturation transfer liposomes. Magn Reson Med. 2012;67:1106-13
32. Stewart JC. Colorimetric determination of phospholipids with ammonium ferrothiocyanate. Anal Biochem. 1980;104:10-4
33. Maruyama K, Takizawa T, Takahashi N, Tagawa T, Nagaike K, Iwatsuru M. Targeting efficiency of PEG-immunoliposome-conjugated antibodies at PEG terminals. Adv Drug Deliv Rev. 1997;24:235-42
34. Danila D, Partha R, Elrod DB, Lackey M, Casscells SW, Conyers JL. Antibody-labeled liposomes for CT imaging of atherosclerotic plaques: in vitro investigation of an anti-ICAM antibody-labeled liposome containing iohexol for molecular imaging of atherosclerotic plaques via computed tomography. Tex Heart Inst J. 2009;36:393-403
35. MAGIN RL, NIESMAN MR. Temperature-dependent drug release from large unilamellar liposomes. Cancer Drug Deliv. 1984;1:109-17
36. Schneider CA, Rasband WS, Eliceiri KW. NIH Image to ImageJ: 25 years of image analysis. Nat Methods. 2012;9:671-5
37. Liu G, Ali MM, Yoo B, Griswold MA, Tkach JA, Pagel MD. PARACEST MRI with improved temporal resolution. Magn Reson Med. 2009;61:399-408
38. Liu G, Gilad AA, Bulte JW, van Zijl PC, McMahon MT. High-throughput screening of chemical exchange saturation transfer MR contrast agents. Contrast Media Mol Imaging. 2010;5:162-70
39. Kim M, Gillen J, Landman BA, Zhou J, van Zijl PC. Water saturation shift referencing (WASSR) for chemical exchange saturation transfer (CEST) experiments. Magn Reson Med. 2009;61:1441-50
40. Walczak P, Zhang J, Gilad AA, Kedziorek DA, Ruiz-Cabello J, Young RG. et al. Dual-modality monitoring of targeted intraarterial delivery of mesenchymal stem cells after transient ischemia. Stroke. 2008;39:1569-74
41. Belayev L, Alonso OF, Busto R, Zhao W, Ginsberg MD. Middle cerebral artery occlusion in the rat by intraluminal suture neurological and pathological evaluation of an improved model. Stroke. 1996;27:1616-23
42. Ramos-Cabrer P, Agulla J, Argibay B, Perez-Mato M, Castillo J. Serial MRI study of the enhanced therapeutic effects of liposome-encapsulated citicoline in cerebral ischemia. Int J Pharm. 2011;405:228-33
43. Thalheimer W, Cook S. How to calculate effect sizes from published research: A simplified methodology. Work-Learning Research. 2002:1-9
44. Liu G, Ali MM, Yoo B, Griswold MA, Tkach JA, Pagel MD. PARACEST MRI with improved temporal resolution. Magn Reson Med. 2009;61:399-408
45. Suresh Reddy J, Venkateswarlu V, Koning GA. Radioprotective effect of transferrin targeted citicoline liposomes. J Drug Target. 2006;14:13-9
46. Liu G, Chan KW, Song X, Zhang J, Gilad AA, Bulte JW. et al. NOrmalized MAgnetization Ratio (NOMAR) filtering for creation of tissue selective contrast maps. Magn Reson Med. 2013;69:516-23
47. Deddens LH, van Tilborg GA, van der Toorn A, van der Marel K, Paulis LE, van Bloois L. et al. MRI of ICAM-1 upregulation after stroke: the importance of choosing the appropriate target-specific particulate contrast agent. Mol Imaging Biol. 2013;15:411-22
48. Agulla J, Brea D, Campos F, Sobrino T, Argibay B, Al-Soufi W. et al. In vivo theranostics at the peri-infarct region in cerebral ischemia. Theranostics. 2013;4:90-105
49. Torchilin VP. Targeted pharmaceutical nanocarriers for cancer therapy and imaging. AAPS J. 2007;9:E128-E47
50. Mulder WJ, Strijkers GJ, Habets JW, Bleeker EJ, van der Schaft DW, Storm G. et al. MR molecular imaging and fluorescence microscopy for identification of activated tumor endothelium using a bimodal lipidic nanoparticle. FASEB J. 2005;19:2008-10
51. Skouras A, Mourtas S, Markoutsa E, De Goltstein MC, Wallon C, Catoen S. et al. Magnetoliposomes with high USPIO entrapping efficiency, stability and magnetic properties. Nanomed. 2011;7:572-9
52. Bulte JW, de Cuyper M, Despres D, Frank JA. Preparation, relaxometry, and biokinetics of PEGylated magnetoliposomes as MR contrast agent. J Magn Magn Mater. 1999;194:204-9
53. Kato Y, Artemov D. Monitoring of release of cargo from nanocarriers by MRI/MR spectroscopy (MRS): significance of T2/T2* effect of iron particles. Magn Reson Med. 2009;61:1059-65
54. Torres E, Mainini F, Napolitano R, Fedeli F, Cavalli R, Aime S. et al. Improved paramagnetic liposomes for MRI visualization of pH triggered release. J Control Release. 2011;154:196-202
55. Kanda T, Fukusato T, Matsuda M, Toyoda K, Oba H, Kotoku Ji. et al. Gadolinium-based contrast agent accumulates in the brain even in subjects without severe renal dysfunction: evaluation of autopsy brain specimens with inductively coupled plasma mass spectroscopy. Radiology. 2015:142690
56. Campbell BC, Mitchell PJ, Kleinig TJ, Dewey HM, Churilov L, Yassi N. et al. Endovascular therapy for ischemic stroke with perfusion-imaging selection. N Engl J Med. 2015;372:1009-18
57. Goyal M, Demchuk AM, Menon BK, Eesa M, Rempel JL, Thornton J. et al. Randomized assessment of rapid endovascular treatment of ischemic stroke. N Engl J Med. 2015;372:1019-30
58. Janowski M, Walczak P, Pearl MS. Predicting and optimizing the territory of blood-brain barrier opening by superselective intra-arterial cerebral infusion under dynamic susceptibility contrast MRI guidance. J Cereb Blood Flow Metab. 2015:0271678 X15615875
59. Blann A, Kumar P, Krupinski J, McCollum C, Beevers DG, Lip GY. Soluble intercellular adhesion molecule-1, E-selectin, vascular cell adhesion molecule-1 and von Willebrand factor in stroke. Blood Coagul Fibrinolysis. 1999;10:277-84
60. Brea D, Sobrino T, Ramos-Cabrer P, Castillo J. Inflammatory and neuroimmunomodulatory changes in acute cerebral ischemia. Cerebrovasc Dis. 2009;27:48-64
61. Hoyte LC, Brooks KJ, Nagel S, Akhtar A, Chen R, Mardiguian S. et al. Molecular magnetic resonance imaging of acute vascular cell adhesion molecule-1 expression in a mouse model of cerebral ischemia. J Cereb Blood Flow Metab. 2010;30:1178-87
62. Terreno E, Sanino A, Carrera C, Castelli DD, Giovenzana GB, Lombardi A. et al. Determination of water permeability of paramagnetic liposomes of interest in MRI field. J Inorg Biochem. 2008;102:1112-9
63. Clark W, Warach S, Pettigrew L, Gammans R, Sabounjian L. A randomized dose-response trial of citicoline in acute ischemic stroke patients. Neurology. 1997;49:671-8
64. Schauss A, Somfai-Relle S, Financsek I, Glavits R, Parent S, Endres J. et al. Single-and repeated-dose oral toxicity studies of citicoline free-base (choline cytidine 5′-pyrophosphate) in Sprague-Dawley rats. Int J Toxicol. 2009;28:479-87
65. Wu R, Liu CM, Liu PK, Sun PZ. Improved measurement of labile proton concentration-weighted chemical exchange rate (k(ws)) with experimental factor-compensated and T(1) -normalized quantitative chemical exchange saturation transfer (CEST) MRI. Contrast Media Mol Imaging. 2012;7:384-9
66. Zaiss M, Xu J, Goerke S, Khan IS, Singer RJ, Gore JC. et al. Inverse Z-spectrum analysis for spillover-, MT-, and T1 -corrected steady-state pulsed CEST-MRI-application to pH-weighted MRI of acute stroke. NMR Biomed. 2014;27:240-52
67. Sun PZ, Zhou J, Sun W, Huang J, van Zijl PC. Detection of the ischemic penumbra using pH-weighted MRI. J Cereb Blood Flow Metab. 2007;27:1129-36
68. Sun PZ, Cheung JS, Wang E, Lo EH. Association between pH-weighted endogenous amide proton chemical exchange saturation transfer MRI and tissue lactic acidosis during acute ischemic stroke. J Cereb Blood Flow Metab. 2011;31:1743-50
69. Xu J, Yadav NN, Bar-Shir A, Jones CK, Chan KW, Zhang J. et al. Variable delay multi-pulse train for fast chemical exchange saturation transfer and relayed-nuclear overhauser enhancement MRI. Magn Reson Med. 2014;71:1798-812
70. Song X, Xu J, Xia S, Yadav NN, Lal B, Laterra J. et al. Multi-echo length and offset VARied saturation (MeLOVARS) method for improved CEST imaging. Magn Reson Med. 2015;73:488-96
71. Zhou J, Payen JF, Wilson DA, Traystman RJ, van Zijl PC. Using the amide proton signals of intracellular proteins and peptides to detect pH effects in MRI. Nat Med. 2003;9:1085-90
72. Xu J, Yadav NN, Bar-Shir A, Jones CK, Chan KW, Zhang J. et al. Variable delay multi-pulse train for fast chemical exchange saturation transfer and relayed-nuclear overhauser enhancement MRI. Magn Reson Med. 2014;71:1798-812
73. Haris M, Cai K, Singh A, Hariharan H, Reddy R. In vivo mapping of brain myo-inositol. NeuroImage. 2011;54:2079-85
74. Zhu H, Jones CK, van Zijl PC, Barker PB, Zhou J. Fast 3D chemical exchange saturation transfer (CEST) imaging of the human brain. Magn Reson Med. 2010;64:638-44
75. Zhou J, Blakeley JO, Hua J, Kim M, Laterra J, Pomper MG. et al. Practical data acquisition method for human brain tumor amide proton transfer (APT) imaging. Magn Reson Med. 2008;60:842-9
76. Xu X, Yadav NN, Knutsson L, Hua J, Kalyani R, Hall E. et al. Dynamic Glucose-Enhanced (DGE) MRI: Translation to Human Scanning and First Results in Glioma Patients. Tomography. 2015;1:105-14
77. Muller-Lutz A, Schleich C, Pentang G, Schmitt B, Lanzman RS, Matuschke F. et al. Age-dependency of glycosaminoglycan content in lumbar discs: A 3t gagcEST study. J Magn Reson Imaging. 2015;42:1517-23
78. Liu Q, Tawackoli W, Pelled G, Fan Z, Jin N, Natsuaki Y. et al. Detection of low back pain using pH level-dependent imaging of the intervertebral disc using the ratio of R1rho dispersion and -OH chemical exchange saturation transfer (RROC). Magn Reson Med. 2015;73:1196-205
79. Chen SZ, Yuan J, Deng M, Wei J, Zhou J, Wang YJ. Chemical exchange saturation transfer (CEST) MR technique for in-vivo liver imaging at 3.0 tesla. Eur Radiol. 2016;26:1792-800
Author contact
![]() Corresponding author: Guanshu Liu, Ph.D. 707 N. Broadway, Baltimore, MD 21205. Phone (office): 443-923-9500, Fax: 410-614-3147 Email: guanshujhu.edu.
Corresponding author: Guanshu Liu, Ph.D. 707 N. Broadway, Baltimore, MD 21205. Phone (office): 443-923-9500, Fax: 410-614-3147 Email: guanshujhu.edu.
Citation styles
APA
Liu, H., Jablonska, A., Li, Y., Cao, S., Liu, D., Chen, H., Van Zijl, P.CM., Bulte, J.W.M., Janowski, M., Walczak, P., Liu, G. (2016). Label-free CEST MRI Detection of Citicoline-Liposome Drug Delivery in Ischemic Stroke. Theranostics, 6(10), 1588-1600. https://doi.org/10.7150/thno.15492.
ACS
Liu, H.; Jablonska, A.; Li, Y.; Cao, S.; Liu, D.; Chen, H.; Van Zijl, P.CM.; Bulte, J.W.M.; Janowski, M.; Walczak, P.; Liu, G. Label-free CEST MRI Detection of Citicoline-Liposome Drug Delivery in Ischemic Stroke. Theranostics 2016, 6 (10), 1588-1600. DOI: 10.7150/thno.15492.
NLM
Liu H, Jablonska A, Li Y, Cao S, Liu D, Chen H, Van Zijl PCM, Bulte JWM, Janowski M, Walczak P, Liu G. Label-free CEST MRI Detection of Citicoline-Liposome Drug Delivery in Ischemic Stroke. Theranostics 2016; 6(10):1588-1600. doi:10.7150/thno.15492. https://www.thno.org/v06p1588.htm
CSE
Liu H, Jablonska A, Li Y, Cao S, Liu D, Chen H, Van Zijl PCM, Bulte JWM, Janowski M, Walczak P, Liu G. 2016. Label-free CEST MRI Detection of Citicoline-Liposome Drug Delivery in Ischemic Stroke. Theranostics. 6(10):1588-1600.
This is an open access article distributed under the terms of the Creative Commons Attribution (CC BY-NC) License. See http://ivyspring.com/terms for full terms and conditions.