Impact Factor
- Issue 12; 2026
- Issue 11; 2026
- Issue 10; 2026
- Issue 9; 2026
- Issue 8; 2026
- Volume 16; 2026
- Advance Articles
- Past Issues
- Cover Images
- Cover Suggestion
- Index & Coverage
- Special Issues
Introduction
Material and methods
Results
Discussion
Summary and conclusions
Supplementary Material
Abbreviations
Acknowledgements
References
International Journal of Biological Sciences
International Journal of Medical Sciences
 Global reach, higher impact

Theranostics 2017; 7(2):493-512. doi:10.7150/thno.17559 This issue Cite
Research Paper
A specific dietary intervention to restore brain structure and function after ischemic stroke
Maximilian Wiesmann1,2†, Bastian Zinnhardt3†, Dirk Reinhardt3, Sarah Eligehausen3, Lydia Wachsmuth4, Sven Hermann3, Pieter J Dederen1, Marloes Hellwich1, Michael T Kuhlmann3, Laus M Broersen5, Arend Heerschap6, Andreas H Jacobs3,7‡, Amanda J Kiliaan1‡ ![]()
1. Department of Anatomy, Radboud university medical center, Donders Institute for Brain, Cognition & Behaviour, Nijmegen, The Netherlands
2. Department of Geriatric Medicine, Radboud university medical center, Donders Institute for Brain, Cognition & Behaviour, Nijmegen, The Netherlands
3. European Institute for Molecular Imaging (EIMI), Westfälische Wilhelms University Münster, Münster, Germany
4. Department of Clinical Radiology of the University Hospital, Westfälische Wilhelms University Münster, Münster, Germany
5. Advanced Medical Nutrition, Nutricia Research, Utrecht, The Netherlands
6. Department of Radiology & Nuclear Medicine, Radboud university medical center, Nijmegen, The Netherlands
7. Department of Geriatrics, Johanniter Hospital, Evangelische Kliniken, Bonn, Germany
† Bastian Zinnhardt and Maximilian Wiesmann contributed equally to the present work and share first authorship.
‡ Andreas H Jacobs and Amanda J Kiliaan share last authorship.
Received 2016-9-13; Accepted 2016-10-6; Published 2017-1-6
Abstract

Occlusion of the middle cerebral artery (MCAo) is among the most common causes of ischemic stroke in humans. Cerebral ischemia leads to brain lesions existing of an irreversibly injured core and an ischemic boundary zone, the penumbra, containing damaged but potentially salvageable tissue. Using a transient occlusion (30 min) of the middle cerebral artery (tMCAo) mouse model in this cross-institutional study we investigated the neurorestorative efficacy of a dietary approach (Fortasyn) comprising docosahexaenoic acid, eicosapentaenoic acid, uridine, choline, phospholipids, folic acid, vitamins B12, B6, C, and E, and selenium as therapeutic approach to counteract neuroinflammation and impairments of cerebral (structural+functional) connectivity, cerebral blood flow (CBF), and motor function. Male adult C57BL/6j mice were subjected to right tMCAo using the intraluminal filament model. Following tMCAo, animals were either maintained on Control diet or switched to the multicomponent Fortasyn diet. At several time points after tMCAo, behavioral tests, and MRI and PET scanning were conducted to identify the impact of the multicomponent diet on the elicited neuroinflammatory response, loss of cerebral connectivity, and the resulting impairment of motor function after experimental stroke. Mice on the multicomponent diet showed decreased neuroinflammation, improved functional and structural connectivity, beneficial effect on CBF, and also improved motor function after tMCAo. Our present data show that this specific dietary intervention may have beneficial effects on structural and functional recovery and therefore therapeutic potential after ischemic stroke.
Keywords: Cerebral Ischemia, Neuroinflammation, Cerebral Connectivity, Cerebral Blood Flow, MRI, PET, Animal Model
Introduction
Stroke is the second leading cause of morbidity and mortality [1], and the most common cause of serious adult long-term disability in the United States [2, 3]. Ischemic strokes have been the target of many failed drug trials [4] and only few treatment options are available, but many patients still show significant poststroke disabilities [5-7]. Until now, thrombolysis and thrombectomy are the common treatments for ischemic stroke, but not many patients benefit from these therapies due to the narrow therapeutic window and complexity of administration [3, 8].
There is therefore an urge for restorative interventions supporting better recovery and improving quality of life. Damaged brain networks have been shown to be responsible for absence of recovery or even for progressive disease, leading to increased mortality [9]. Furthermore, 87% of all strokes are ischemic [10], indicating that specific treatments should aim to improve impairments in cerebral blood flow (CBF) [4]. Therefore, stroke studies are needed investigating the effects of stroke and its interaction with a novel treatment on parameters being alternated after a stroke CBF, structural and functional connectivity, neuroinflammation, neuro- and synaptogenesis, vascular density, cognition, and behavioral parameters (motor coordination, activity etc.). Novel approaches targeting CBF, neuroinflammation, and brain networks may provide new avenues for stroke treatment [11]. In particular, dietary approaches could facilitate recovery after stroke [12, 13] because it has been shown that increased adherence to a Mediterranean-style diet is associated with a lowered risk of ischemic stroke and myocardial infarction [14]. Following MCA occlusion, mice fed a rapeseed oil-enriched diet revealed a decreased mortality rate, lowered levels of lipid peroxidation, and a reduced infarct size [15]. Also low fish consumption may already decrease the incidence of ischemic stroke [16]. In women, intake of omega-3 long-chain polyunsaturated fatty acids (n3-LCPUFA) is associated with a lowered risk of total stroke, while dietary cholesterol has been found to be positively associated with risk of total stroke and cerebral infarction [17]. In several other studies n3-LCPUFA have shown to diminish severity of vascular risk factors, like atherosclerosis [18], high blood pressure [19], and other cardiovascular diseases [18, 20-22]. Ozen et al. demonstrated a protective effect of n3-LCPUFA against cerebral ischemia in rats, showing a reduced number of apoptotic neurons in the prefrontal cortex when fed a standard diet combining eicosapentaenoic acid (EPA) and docosahexaenoic acid (DHA) [23]. Moreover, combined administration of DHA and UMP improved learning abilities in rats [24] and combined administration of DHA and EPA improves (cerebral) vascular health in human [25, 26]. Supplementation of DHA and choline to normal adult gerbils also enhanced performance on several maze tests, being even further enhanced by coadministering UMP [27]. Additionally, in several studies a specific combination of nutrients called Fortasyn, comprising precursors and cofactors for membranes (DHA, EPA, uridine monophosphate (UMP), choline, phospholipids, folic acid, vitamins B12, B6, C, and E, and selenium), has been shown to support synergistically neuronal membrane synthesis [28, 29], increasing levels of brain phospholipids, dendritic spines and neurite outgrowth, cerebral blood flow, and to beneficially affect cognition [30-34]. Recently, we showed that this latter Fortasyn diet increased cortical CBF and synaptic density, and improved white matter integrity and functional connectivity (FC) in aging apoE4 mouse. Furthermore, we demonstrated that protective mechanisms on vascular and synapse health are enhanced by Fortasyn, independent of apoE genotype [35]. In another AD murine model, we showed that this multi-nutrient supplementation diet improved cerebrovascular health and protected against neuronal degeneration [36]. This neurorestorative potential of Fortasyn has recently been obtained in a rodent model of spinal cord injury as well [37].
Thus, in present experiment we wanted to investigate the possible efficacy of this multicomponent diet as therapeutic intervention after transient ischemic stroke on both structural and functional parameters. Using state-of-the-art imaging techniques, we measured CBF, and the neuroinflammatory response after ischemia. Notably, upon activation during the neuroninflammatory response, microglial cells express the translocator protein (TSPO) [38, 39]. In vivo positron emission tomography (PET) for imaging of microglial activation has focused on a variety of radiolabeled compounds binding to TSPO. In particular, the second generation TSPO tracer N,N-diethyl-2-(2-(4-(2-[18F]fluoroethoxy)phenyl)-5,7-dimethylpyrazolo[1,5-a]pyrimidin-3-yl)acetamide ([18F]DPA-714) has been assessed for temporal and spatial evaluation of inflammatory alterations in models of cerebral ischemia, experimental autoimmune encephalomyelitis and cancer [40].
Material and methods
Animals and diets (Nijmegen, The Netherlands; Münster, Germany)
In total 48 3-4 months old C57BL/6J mice (Nijmegen, 24 mice: Harlan Laboratories Inc., Horst, the Netherlands; Münster, 24 mice 3-4 months old in-house bred C57BL/6J mice) were used for this cross-institutional, randomized, and double-blind controlled study (blinded for investigators and outcomes assessor) conducted at the preclinical imaging center (PRIME) of the Radboudumc (Nijmegen, the Netherlands) and the European Institute for Molecular Imaging (EIMI, Münster, Germany). Before tMCAo, the animals were housed socially with a maximum of six animals per cage, with room temperature at 21°C, and artificial 12:12h light: dark cycle (lights on at 7 a.m.). After stroke induction, the mice were housed separately to control the food intake of the experimental diets (see below). Food and water were available ad libitum. Samples sizes were determined by power analysis during the animal ethics dossier application. The experiments (Nijmegen) were performed according to Dutch federal regulations for animal protection and were approved by the Veterinary Authority of the Radboud university medical center, Nijmegen, The Netherlands. Experiments (Germany) were in accordance with the German Law on the Care and Use of Laboratory Animals and approved by the Landesamt für Natur, Umwelt und Verbraucherschutz of North Rhine-Westphalia. All experiments (Nijmegen & Münster) of this international multicenter preclinical study were exerted in accordance to the ARRIVE [41] and the (updated) STAIR guidelines [42-44]. All applicable international, national, and institutional guidelines for the care and use of animals were followed.
Before tMCAo all mice were fed a standard Control diet (Ssniff rm/h V1534-000, Bio Services, Uden, The Netherlands). Starting right after tMCAo, mice were randomly divided in two groups; animals were fed either Control or Fortasyn diet that differed with respect to their fatty acid composition and some additional nutrients. All diets were isocaloric and based on AIN-93M (Reeves et al., 1993) with 5% fat. The Control diet contained 1.9% soy oil, 0.9% coconut oil and 2.2% corn oil. The Fortasyn diet contained 0.1% coconut oil, 1.9% corn oil and 3.0% fish oil. The Fortasyn diet contains a specific multi-nutrient composition comprising uridine, omega-3 PUFAs, choline, B vitamins, phospholipids and antioxidants as specified in Table 1. To assure intercenter-comparability and accordance to the ARRIVE and (updated) STAIR guidelines in this study, all experiments were performed in line with the following predefined experimental rules. In this experiment we used a study design with pre-set endpoints for all participating centers (Münster & Nijmegen). Both diets were manufactured and pelleted by Ssniff (Soest, Germany) and stored at -20°C until use. All mice underwent behavioral tests before and after tMCAo. 35 days poststroke, MRI measurements were performed and all animals were euthanized after completion of the study. Post mortem immunohistochemical procedures were performed on all brains. The time line of the experimental design is illustrated in figure 1. No potential disparities in verum/ control group allocation are given. The random allocation of each mouse into its test group was performed by a blinded researcher. To insure intercenter-comparability, all surgeries were performed by the same experienced researcher (D. R.) in Münster, Germany, and in Nijmegen, the Netherlands. For all surgeries, the same type of filaments (70SPRePK5, Doccol Corp., Sharon, MA, USA) for the occlusion of the MCA was used in Münster, Germany, and in Nijmegen, the Netherlands and the same batch of diets were tested in both centers. Furthermore, in Nijmegen, the Netherlands, all imaging and behavioral procedures were performed by the same researchers. In accordance, in Münster, Germany, all imaging procedures were performed by the same investigator. Moreover, all analyses of behavioral, imaging, and immunohistochemical data were performed by blinded researchers.
Oil sources and additives in the isocaloric experimental diets.
| 5% Fat | Diets | ||
|---|---|---|---|
| Control [g/100 g] | Fortasyn [g/100 g] | ||
| Oils | |||
| Soy oil | 1.9 | - | |
| Coconut oil | 0.9 | 0.1 | |
| Corn oil | 2.2 | 1.9 | |
| Fish oil | - | 3.0 | |
| Additives | |||
| Pyridoxine-HLC | - | 0.00328 | |
| Folic acid (90%) | - | 0.00067 | |
| Cyanocobalamin | - | 0.00350 | |
| Ascorbic acid | - | 0.160 | |
| Dl-α-tocopheryl acetate | - | 0.465 | |
| Uridine monophosphate (UMP) | - | 1.0 | |
| Choline chloride (74.6%) | - | 0.402 | |
| Sodium selenite (46%) | - | 0.00023 | |
| Soy lecithin (Emulpur) | - | 0.755 | |
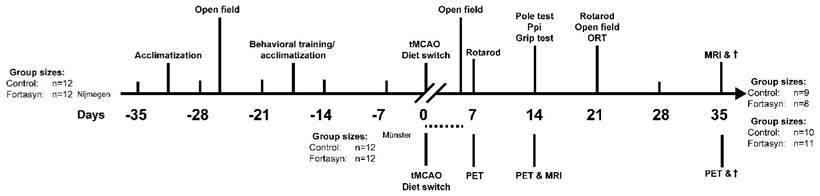
Study design. Behavioral and MRI studies were performed in Nijmegen, the Netherlands. After a transient occlusion of the middle cerebral artery (tMCAo) for 30 min, mice were divided into two dietary groups (Control or Fortasyn). At 7 and 14 days post tMCAo all mice underwent MRI. In between, all mice were tested on motor and cognitive impairments via several behavioral tests, like the Open field, Rotarod, Pole test, Prepulse inhibition (Ppi), grip strength test, and novel object recognition test (ORT). After MRI, all brains were processed for immunohistochemical stainings. PET imaging studies were conducted in parallel in Münster, Germany. [18F]DPA-714 PET was conducted 7, 14 and 35 d after tMCAo in two dietary groups (Control or Fortasyn). T2w MRI for anatomical localization of stroke was conducted 14 d post tMCAo. The group sizes at the start and at the end of the experiments performed in Nijmegen, the Netherlands, and in Münster, Germany, are given. The group sizes shown in brackets indicates the number of mice used for the behavioral or imaging procedures and quantification. The dashed line indicates the period of time of exclusion of mice due to i.e. surgical problems, humane endpoint.
Transient Middle Cerebral Artery Occlusion Surgery (Nijmegen, The Netherlands; Münster, Germany)
3 months old, male C57BL/6J mice underwent right tMCAo (30 minutes), using an intraluminal occlusion model as described elsewhere with minor modifications [45, 46]. This stroke model of transient occlusion of the MCA mimics one of the most common types of ischemic stroke in patients [45, 47]. The MCA was transiently occluded for 30 min. This ischemia time leads to moderate pathological changes within the infarct core, perilesional and remote regions [48-50]. In accordance with human stroke this reperfusion model involves a substantial degree of reperfusion via collateralization through the circle of Willis and leptomeningeal collaterals, and via early clot lysis [51]. In summary, mice were anesthetized with 1.5% isoflurane (Abbott Animal Health, Abbott Park, IL, USA) in a 2:1 air and oxygen mixture. After preparing the right common carotid artery, a 7-0 monofilament (tip diameter 190 to 200 μm, coating length 2 to 3 mm, 70SPRePK5, Doccol Corp., Sharon, MA, USA), was inserted in the common carotid artery and positioned at the point where the MCA branches out. Successful occlusion was maintained for 30 minutes before retracting the filament allowing reperfusion. Reduction in blood flow was monitored intraoperatively via a Laser Doppler probe (Nijmegen, moorVMS-LDF2, Moor Instruments, UK; Münster, Periflux 5000, Perimed Instruments, Järfälla, Sweden) attached to the skull of the mouse. Using the Laser Doppler Flow measurement, we considered an induction of ischemia as valid, when during the occlusion a decrease in regional CBF of more than 80% of baseline values at filament insertion is reached (inclusion criterion). Mice were kept under 1.5% isoflurane anesthesia in a 2:1 air and oxygen mixture throughout the procedure. Body temperature was maintained at physiological levels with a custom built heating pad. Exclusion criteria were: a decreased motor activity (<50% of the baseline measurements combined from the baseline values of each behavioral test) or extreme weight loss (>20% within three consecutive days). Using a T2-weighted RARE sequence to measure lesion size, all animals showed a comparable lesion size and no dietary effect on lesion size (data not shown). In all animals N=3 Control animals and n=4 animal on Fortasyn diet died during first week poststroke in Nijmegen, the Netherlands. N=2 Control animals and n=1 animal on Fortasyn diet died during the experiments in Münster, Germany.
Behavioral and cognitive tests (Nijmegen, The Netherlands)
Open field
Locomotion and explorative behavior were evaluated for 10 minutes in the open field prior to the tMCAo, and also 3 and 23 days poststroke as previously described [52-55]. Using EthoVision XT10.1 (Noldus, Wageningen, The Netherlands), locomotion was automatically recorded. The floor of the arena was divided into center, periphery, and corners. The frequency of entering these zones was measured automatically. In addition, exploration was manually scored (walking, sitting, wall leaning, jumping, rearing, grooming) and analyzed as described previously [56, 57].
Grip strength test
Grip strength test was performed at 14 days poststroke using a grip strength meter (Grip-Strength Meter, 47200, Ugo Basile, Italy) to determine forelimb and also total limb (fore- and hindlimbs combined) muscle strength. Each mouse was trained prior to tMCAo to perform this test. The grip strength meter was arranged horizontally on the table. While holding the tails, the mice were lowered towards the grip strength meter to enable to grasp the grip trapeze with the forepaws or the grid with both their fore- and hindpaws. After grasping the trapeze or the grid, the mice were pulled backwards till the grasp was released. The test was repeated five consecutive times first with the trapeze and one hour later with the grasping grid. For each session the average value of the peak force (in gf) was calculated from the last three trials [58] and the first two trials were used as acclimatization. Additionally, trials were only analyzed, in which the mouse grasped with either two forepaws (trapeze) or all four paws (grid).
Pole test
The pole test was performed at day 15 poststroke, as previously described [59]. The mice were placed head upward just below the top of a vertical rough-surfaced pole (diameter 2.5 cm; height 60 cm) and then allowed to descend. This procedure was repeated five times. Each mouse was trained prior to tMCAo to perform this behavioral test. The time taken to turn completely downward and the rotation direction were measured manually, while the time to reach the floor was determined in EthoVision XT10.1 (Noldus, Wageningen, The Netherlands) to measure downward velocity (cm/s). Laterality index is determined by the averaged turn direction of each mouse (0= left/ contralateral turn, 1= right/ ipsilateral turn). A laterality index of 0.5 indicates that no lateralization is present, while a laterality index of 0.0 respectively 1.0 suggests a laterality of more contralateral respectively ipsilateral turns. Results for downward velocity and rotation time are displayed as the mean of minimal three successful trials. The first acquisition trial was excluded from the statistical analysis and used as acclimatization trial.
MRI protocol (Nijmegen, The Netherlands)
MRI measurements were performed at 7 and 35 days poststroke on a 11.7 T BioSpec Avance III small animal MR system (Bruker BioSpin, Ettlingen, Germany) equipped with an actively shielded gradient set of 600 mT/m and operating on Paravision 5.1 software platform (Bruker, Karlsruhe, Germany). We used a circular polarized volume resonator for signal transmission and an actively decoupled mouse brain quadrature surface coil with integrated combiner and preamplifier for receiving (Bruker BioSpin). For the imaging procedure, the animals were anesthetized with isoflurane (3.5% for induction and 1.8% for maintenance) in a 2:1 oxygen and N2O mixture, and placed in a stereotactic holder to prevent unwanted movement during the scanning. Body temperature was monitored with a rectal probe and maintained at 37˚C with heated airflow. Respiration of the animal was monitored using a pneumatic cushion respiratory monitoring system (Small Animal Instruments Inc, NY, USA). First gradient echo images were acquired using previously described image parameters [36].
Cerebral blood flow
MR perfusion data were acquired under resting conditions using established methods with a flow-sensitive alternating inversion recovery (FAIR) technique [60, 61].
Regional perfusion was evaluated in the cerebral cortex (all cortical regions above corpus callosum), hippocampus, thalamus [36] accordingly to the atlas of Franklin and Paxinos [62]. To calculate regional CBF we used the same protocol as previously described [36].
Diffusion tensor imaging
Diffusion of water was imaged as described previously [63, 64]. In short, 22 axial slices covering the whole brain were acquired with a four-shot SE-EPI protocol. B0 shift compensation, navigator echoes and an automatic correction algorithm to limit the occurrence of ghosts and artefacts were implemented. Encoding b-factors of 0 s/mm2 (b0 images; 5×) and 1000 s/mm2 were used and diffusion-sensitizing gradients were applied along 30 non-collinear directions in three-dimensional space.
The diffusion tensor was estimated for every voxel using the PATCH algorithm [65]; mean water diffusivity (MD) and fractional anisotropy (FA) were derived from the tensor estimation following a protocol as described elsewhere [64]. MD and FA values were measured in several white matter (WM) and grey matter (GM) areas, manually selected based on an anatomical atlas [62], as described previously in [35].
Resting state fMRI
The resting state fMRI (rsfMRI) datasets were first realigned using a least-squares method and rigid-body transformation with Statistical Parametric Mapping (SPM) mouse toolbox (SPM5, University College London; http://www.fil.ion.ucl.ac.uk/spm/; [66]). Mean and maximum displacement across the six degrees of freedom (along the x-, y-, and z-axes and on three rotation parameters pitch, roll, and yaw) were measured in each mouse. The mean SE-EPI images of each mouse were then used to generate a study-specific template through linear affine and nonlinear diffeomorphic transformation (ANTs. v1.9; http://picsl.upenn.edu/ANTS/). Visual inspection of the normalized dataset was performed to screen for possible normalization biases. On the template, 14 areas were selected in left and right hemisphere. The selected regions were based on previous work in functional connectivity in mice [67], and includes: left and right dorsal hippocampus, left and right ventral hippocampus, left and right auditory cortex, left and right motor cortex, left and right somatosensory cortex, and left and right visual cortex. All cortical ROI were selected 1-2 voxels away from the edge of the cortex, to minimize the impact of susceptibility-weighted artefacts, which are more prominent in areas of different tissues interface (e.g., near the skull or near the ear canals). After motion regression, in-plane spatial smoothing (0.4 × 0.4 mm), linear detrending, and temporal high-pass filtering (cut-off at 0.01 Hz) were applied to compensate for small across-mouse misregistration and temporal low-frequency noise. FC group comparisons between ROI were calculated from the BOLD time series using total correlation and partial correlation analyses implemented in FSLNets (FSLNets v0.3; www.fmrib.ox.ac.uk/fsl). Pearson's correlation values were Fisher transformed to Z-scores for group comparisons and statistical analysis.
[18F]DPA-714 Positron Emission Tomography (PET, Münster)
During image acquisition, mice were anesthetized with 1.5% isoflurane (Abbott Animal Health) in pure oxygen. For tracer application, the lateral tail vein was cannulated using a 26 Ga catheter (Vasculon Plus, BD, Heidelberg, Germany) connected to a 15-cm polyethylene tubing (27 Ga, Smith Medical, Kent, UK).
[18F]DPA-714 was prepared following the procedure described previously with a radioactive purity of 99% and a decay corrected yield (rcy) of 25.1 ± 4.9% [68].
Mice were injected with 15.7 ± 1.5 MBq of [18F]DPA-714 and imaged consecutively 7 (n=5/group), 14 (n=8/group), and 35 (n=8/group) days poststroke. Only animals with complete imaging set (n=5 group) could be taken into consideration for repeated measurement ANOVA analysis. N=2 animals per group without measureable infarction and DPA-714 PET changes were excluded from the analysis. PET data were acquired 45-55 min p.i. on a high-resolution small animal PET scanner (32 module quadHIDAC, Oxford Positron Systems Ltd., Oxford, UK) with uniform spatial resolution (1 mm FWHM (full-width at halfmaximum)) over a large cylindrical field-of-view (165 mm diameter, 280 mm axial length). Images were reconstructed with a one-pass list mode expectation maximization algorithm with resolution recovery. CT images were acquired on a small animal CT scanner (Inveon, Siemens Medical Solutions, Knoxville, TN, USA) with a spatial resolution of 80 μm. For data analysis, CT images were coregistered to PET, followed by co-registration to MRI data using a landmark-based approach as described previously [46]. Magnetic Resonance Imaging studies were performed with a 9.4-T small animal MR scanner with 20 cm bore size (Bios-Spec 94/20; BrukerBioSpin MRI GmbH, Ettlingen, Germany). The system was operated using the software ParaVision 5.1. (BrukerBioSpin MRI GmbH). Anatomic T2w RARE brain images were obtained in three imaging planes (28 planes, slice thickness 0.5 mm, in-plane resolution 78 μm (repetition time 3,000 to 5,500 ms, echo time 50 ms, rare factor 16, 6 averages, 14 to 28 contiguous slices, slice thickness 0.5 mm, field of view 20 mm2, 256 matrix, in-plane resolution 78 μm2, scan time 5 to 9 minutes, respectively). Image analysis was conducted with the VINCI software (Version: 4.19.0; http://www.nf.mpg.de/vinci3/) [69] by drawing a volume of interest (VOI) over the infarcted area depicted by T2w MRI. A duplicate VOI was mirrored to the contralateral hemisphere and served as control. Mean and maximum lesion-to-background (Lmean/Bmean and Lmax/Bmean) ratios were calculated.
Immunohistochemical procedures (Nijmegen, The Netherlands; Münster, Germany)
After the last scanning session, the mice were sacrificed by transcardial perfusion using 0.1M phosphate-buffered saline (PBS) followed by 4% paraformaldehyde in 0.1M PBS. The brains were harvested and stored separately. The brains were postfixed overnight in 4% paraformaldehyde at 4°C and transferred to 0.1M PBS containing 0.01% sodium azide the next day. One part of the brain (Bregma: -0.7 to -4.36) was cut in 30 μm frontal sections using a sliding microtome (Microm HC 440, Walldorf, Germany) equipped with an object table for freeze-sectioning at -60°C. 24 Hours before cutting, the brains were transferred in 30% sucrose in 0.1M phosphate buffer. 8 Series were cut and stored in 0.1M PBS with 0.01% sodium azide so multiple immunohistochemical stainings could be performed.
All sections were stained in one session to minimize differences in staining intensity.
In total three stainings were performed for vascular integrity measured via glucose transporter-1 (GLUT-1), for activated microglia via ionized calcium-binding adapter molecule 1 (IBA-1) as indicator for neuroinflammation, and for immature neurons (measure for neurogenesis) with antibodies against doublecortin (DCX) on free-floating brain sections on shaker tables at room temperature.
Immunohistochemistry was performed using standard free-floating labelling procedures, using previously described protocols [70].
The GLUT-1 amount was visualized using polyclonal rabbit anti-GLUT-1 antibody (1:40.000,Chemicon AB 1340, Chemicon International, Inc., Temecula, CA, USA) and as secondary antibody donkey anti-rabbit biotin (1:1500 Jackson ImmunoResearch, West Grove,PA, USA).
For IBA-1, as primary antibody against IBA-1 polyclonal goat anti-IBA-1 (1:3000; Abcam) and for DCX, polyclonal goat anti-DCX (1:8000; Santa Cruz Biotechnology Inc., Santa
Cruz, CA, USA) was used as a primary antibody to assess neurogenesis. For both as secondary antibody donkey anti-goat biotin (1:1500; Jackson ImmunoResearch, West Grove, PA, USA) was used.
From a more frontal part of the brain tissue (Bregma: -0.10 to 0.98) was fixed in 4% paraformaldehyde in 0.1 M phosphate buffer (pH 7.4) and embedded in paraffin according to a standard protocol.
Synaptophysin (SYN; measure for synaptic plasticity) immuno reactive presynaptic boutons with antibodies against synaptophysin and postsynaptic density (measure for synaptic plasticity) with antibodies against postsynaptic density protein 95 (PSD-95) was demonstrated immunohistochemically on 5 μm thin paraffin sections.
We used monoclonal rabbit anti-synaptophysin clone EP1098Y (1:500; Abcam Inc., Cambridge, UK) as a primary antibody to visualize synaptophysin in presynaptic boutons. For PSD-95, polyclonal rabbit anti-PSD95 (1:800; Abcam Inc.) was used as a primary antibody to reveal the postsynaptic density. After washing 3 times with 0.1M PBS, for both the synaptophysin and PSD-95 staining, the secondary antibody used was donkey anti-rabbit biotin (1:200; Jackson ImmunoResearch), followed again by 3 washes, Vector ABC-Elite (1:50) and the above mentioned DAB-Ni incubation
Immunohistochemistry for TSPO (1:250, NBP1-95674, Novus Biologicals, Cambridge, UK) and GFAP (1:1000; Abcam Inc., Cambridge, UK) was performed on paraffin embedded slices. The slides were boiled in citrate buffer for antigen retrieval (pH 6; 30 minutes), before being treated with blocking solution for 30 minutes (1%BSA and 0.5% Triton-X in PBS), Primary antibodies were subsequently incubated with the primary antibodies (4°C, overnight). TSPO immunoreactivity was visualized through a multi-step process, including incubation with a biotinylated goat anti-rabbit (1:800, 45 minutes, B21078, Life Technologies, Darmstadt, Germany), followed by HRP-Streptavidin incubation (20 minutes, K1016, DAKO, Hamburg, Germany) and 3,3-Diaminobenzidine (D-5637, 5 min, Sigma, Hamburg, Germany). Sections were counterstained with hematoxylin, dehydrated, cleared with xylol and mounted using Entellan (Merck, Darmstadt, Germany). For double immunohistochemistry slides were incubated with Alexa Fluor 488-conjugated anti-rabbit secondary antibody (1:800, A-21206, Life Technologies, Carlsbad, CA, USA), or Alexa Fluor 555 conjugated anti-goat (1:800, A-21432, Life Technologies, Carlsbad, CA, USA). Slides were mounted in DAPI containing mounting medium (Vectashield, H-1500, Vector Laboratories, Burlingame, CA, USA). Images were acquired with a combined fluorescence-light microscope (Nikon Eclipse NI-E, Nikon, Tokyo, Japan).
Quantification (SYN and PSD-95)
The stained sections (Bregma: 0.02 to 0.62) were analyzed using a Zeiss Axioskop microscope equipped with hardware and software of Microbrightfield. Brain regions were based on the mouse brain atlas of Paxinos and Franklin [62] and quantified in four regions of the hippocampus: left cortex, right cortex, left caudate putamen, and right caudate putamen. The relevant regions were digitized with a 40x objective and using Stereo Investigator software for finding the right location for the image. The quantification of the images was performed using ImageJ (National Institute of Health, Bethesda, MD, USA).
Quantification (GLUT-1, IBA-1 and DCX)
Brain sections (Bregma: -1.46 to -2.30) were preselected for quantification accordingly to the atlas of Franklin and Paxinos [62]. Quantification was done on images at a 5x objective using an Axio Imager A2 (Zeiss Germany). ImageJ (National Institute of Health, Bethesda, MD, USA) was used to analyze the regions of interest (GLUT-1+IBA-1: Cortex, hippocampus and thalamus; DCX: Hippocampus, and the subventricular zone, called SVZ).
Statistics
For the statistical analysis, IBM SPSS 22 software (IBM Corporation, New York, NY, USA) was used. Multivariate ANOVA or univariate ANOVA both with Bonferroni corrections (using Repeated measures ANOVA, when necessary, for example open field and PET data) was conducted with between-group-factor diet and if necessary also time to analyze possible differences in all the other parameters.
Statistical significance was set at p ≤ 0.05: #, 0.05 < p < 0.08 (tendency); *, p ≤ 0.05; **, p ≤ 0.01; ***, p ≤ 0.001. Degrees of freedoms, f-values and p-values are given for each statistical analysis. All data are expressed as mean ± SD. #, 0.05 < p < 0.08 (tendency); *, p ≤ 0.05; **, p ≤ 0.01; ***, p ≤ 0.001.
Results
A summary of all experimental results is given in table 2.
Summary of all significant results. Used abbreviations: CBF (cerebral blood flow), DTI (diffusion tensor imaging), FA (fractional anisotropy), MD (mean diffusivity), rsfMRI (resting state functional MRI), Total (total correlations), Partial (partial correlations), IHC (Immunohistochemistry), GLUT-1 (glucose transporter-1), IBA-1 (ionized calcium-binding adapter molecule 1), DCX (doublecortin), SYN (synaptophysin), PSD-95 (postsynaptic density protein 95).
| Parameter | Results | |||||
|---|---|---|---|---|---|---|
| Body weight | ↓ in both groups at 7D; ↑ in both groups at 35D | |||||
| Food intake | ↑ in both groups at 35D; (↑) at 7D+35D in Fortasyn mice | |||||
| Open field | Distance | ↓ in both groups at 3D | ||||
| Velocity | ↓ in both groups at 3D | |||||
| Frequency of entering: | Corners | ↓ in both groups at 3D | ||||
| Periphery | ↓ in both groups at 3D; ↑ in both groups at 23D | |||||
| Center | ↓ in both groups at 3D; (↑) in both groups at 23D | |||||
| Manual scoring (frequency): | Walking | ↓ in both groups at 3D; ↑ at 23D in Fortasyn mice | ||||
| Leaning | ↓ in both groups at 3D | |||||
| Rearing | ↓ in both groups at 3D | |||||
| Grooming | (↑) in both groups at 3D | |||||
| Stitting | ↑ in both groups at 23D | |||||
| Grip strength test | Grid (All limbs) | (↑) in Fortasyn mice | ||||
| Pole test | Rotation Time | ↓ in Fortasyn mice | ||||
| Rotation direction | (No laterality present in Fortasyn mice) | |||||
| FAIR-ASL | Cortex | CBF | ↓ in right cortex of both groups at 7D; ↑ in right cortex of Fortasyn mice than control mice at 7D; ↓ in right cortex of control mice at 35D; ↓ in left cortex of control mice over time | |||
| Loss | ↓ in Fortasyn mice than in control mice at 7D; ↓ over time in both groups | |||||
| Hippocampus | CBF | ↓ in right hippocampus of both groups at 7D; ↓ in right hippocampus of control mice at 35D; ↑ in right hippocampus of Fortasyn mice than control mice at 35D; (↓) in left hippocampus of control mice over time; ↑ in right hippoampus of Fortasyn mice over time | ||||
| Loss | ↓ in both groups over time; ↓ in Fortasyn mice than in control mice at 35D | |||||
| Thalamus | CBF | ↓ in right thalamus of both groups at 7D; ↓ in right thalamus of both groups at 35D; ↑ in left thalamus of Fortasyn mice than control mice at 35D; ↑ in right thalamus of Fortasyn mice over time | ||||
| Loss | ↓ in Fortasyn mice over time | |||||
| DTI | FA | Corpus callosum | (↑) in left corpus callosum of both groups over time | |||
| Hippocampus | ↑ in left+right hippocampus of both groups over time | |||||
| Motor cortex | (↑) in right motor cortex of Fortasyn mice at 7D+35D | |||||
| Optic tract | (↑) in left corpus callosum of both groups over time | |||||
| Visual cortex | ↓ in right visual cortex of control mice at 35D | |||||
| Cpu+GP | ↓ in right Cpu+GP at 7D; ↑ in right Cpu+GP of Fortasyn mice over time | |||||
| MD | Fornix | (↓) in both groups over time | ||||
| Motor cortex | (↓) in right motor cortex of Fortasyn mice at 7D+35D | |||||
| Cpu+GP | (↓) in left Cpu+GP of control mice over time; ↑ in right Cpu+GP of control mice at 35D | |||||
| rsfMRI | Partial | Overall | ↓ in Fortasyn mice at 7D + ↑ in Fortasyn mice at 35D; less negative effects over time in Fortasyn mice; ↑ in motor cortex of Fortasyn mice at 35D | |||
| PET | DPA-714 in infarct | ↓ in Fortasyn mice | ||||
| IHC | GLUT-1 | +cells | Cortex | ↑ in Fortasyn mice; ↑ in right cortex of Fortasyn mice | ||
| IBA-1 | +area | Cortex | (↓) in Fortasyn mice | |||
| Hippocampus | (↓) in Fortasyn mice | |||||
| Thalamus | ↑ in right thalamus; (↑) in Fortasyn mice | |||||
| +cells | Hippocampus | ↓ in Fortasyn mice; ↓ in right hippocampus of Fortasyn mice | ||||
| Thalamus | ↑ in right thalamus | |||||
| DCX | +area | SVZ | ↑ in right SVZ of Fortasyn mice | |||
| SYN | +area | Cpu | ↓ in right Cpu | |||
| PSD-95 | +area | Cortex | ↓ in right cortex | |||
| Cpu | ↓ in right Cpu | |||||
| TSPO | ↓ in Fortasyn mice | |||||
Food intake and body weight (Nijmegen, The Netherlands)
Body weight of both dietary groups decreased poststroke, while it increased significantly over time, comparing the first with the second to fifth week poststroke in all mice, for further details see supplemental material and supplemental figure 1A.
The daily food intake increased over time on both diets in all mice. Fortasyn diet tended to increase food intake compared to Control diet, for further details see supplemental material and supplemental figure 1B.
Behavioral and cognitive tests (Nijmegen, The Netherlands)
Open field
Open field was performed for 10 minutes to measure locomotion (total walking distance, velocity), frequency of zone enters (corners, center, periphery), exploration frequency (walking, wall leaning, rearing, sitting) and grooming, prior to tMCAo (baseline), 3 and 23 days after tMCAo.
Both diet groups exhibited a decreased total distance walked (Figure 2A; F(1,12)=87.8, p<.001) and velocity (Figure 2B; F(1,12)=84.2, p<.001) three days poststroke compared to baseline.
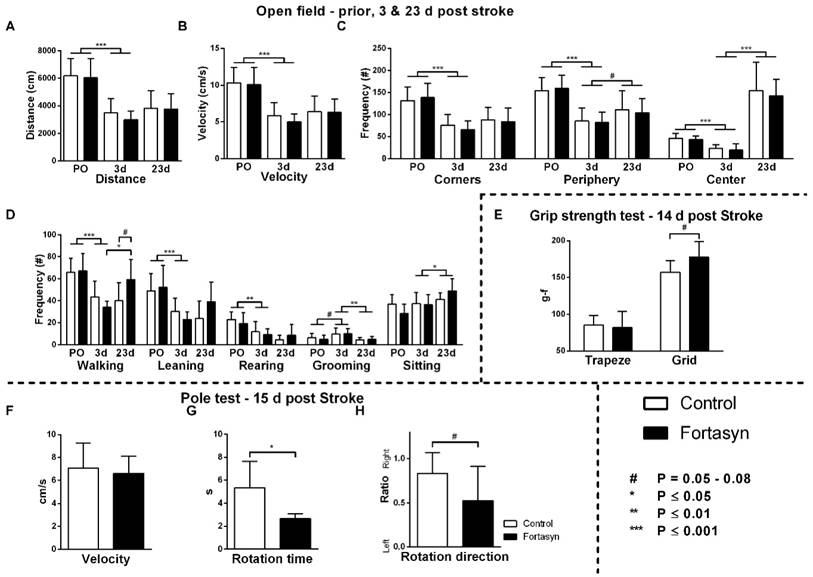
Effects of Fortasyn on locomotion (A+B), time spent in different zones (C), and exploration in open field measured prior to tMCAo (PO), and 3 and 23 days poststroke (E) grip strength test 14 days poststroke g-f; gram-force (F-H) motor coordination determined via pole test 15 days poststroke. Values represent mean±SD. (A+B) Both diets exhibited decreased total distance walked (p<.001) and velocity (p<.001) comparing before, and three days poststroke. (C) Frequency of entering corners (p<.001), periphery (p<.001), and the center (p<.001) were decreased in both diet groups comparing before, with three days poststroke. From three to 23 days after tMCAo, both diet groups increased frequency of entering center (p<.001) and periphery (p<.065). (D) Frequencies of walking (p<.001), wall leaning (p<.001), and rearing (p<.002) were decreased. All mice showed increased frequency of sitting (p<.042), and decreased frequency of grooming (p<.006) poststroke. Mice on Fortasyn walked more at 23 days compared to 3 days poststroke (p<.019). At 23 days poststroke, Fortasyn fed mice tended to walk more frequently than Control fed mice (p<.052). (E) No diet effect was found in muscle strength of the forepaws (trapeze). Measuring total limb strength (grasping grid), revealed higher muscle strength on Fortasyn tended (p<.057). (F) No diet effects were observed concerning velocity to descend along the pole. (G) Control fed mice needed a longer turning time than Fortasyn fed mice when placed head-upwards on top of the pole (p<.010). (H) Mice fed Control diet displayed an ipsilateral bias to fully turn head-down (p<.058, trend).
The frequency of entering the three zones of the open field (Figure 2C), corners (F(1,12)=61.5, p<.001), periphery (F(1,12)=55.9, p<.001), and center (F(1,12)=35.3, p<.001) were also decreased in both diet groups comparing before and three days poststroke. From three to 23 days poststroke, both diet groups increased their frequency of entering the center (F(1,13)=81.9, p<.001) and periphery (F(1,13)=4.1, p<.065) again.
Measured via manual scoring (Figure 2D), frequencies of walking (F(1,12)=39.4, p<.001), wall leaning (F(1,12)=28.2, p<.001), and rearing (F(1,12)=17.4, p<.002) were decreased, and frequency of grooming (F(1,12)=3.7, p<.079) was increased in both diet groups comparing before with three days after tMCAo. In contrast, from 3 to 23 days poststroke, mice showed an increase in frequency of sitting (F(1,13)=5.1, p<.042), and decrease in frequency of grooming (F(1,13)=11.1, p<.006).
Notably, a diet effect was shown over time on frequency of walking (F(1,13)=8.1, p<.014). Only mice on Fortasyn diet walked more often overtime (F(1,13)=10.2, p<.019). 23 days poststroke, Fortasyn fed mice walked more frequently than Control fed mice (F(1,13)=4.6, p<.052, trend).
Grip strength test
The grip strength test was performed to quantify muscle strength (of forepaws respectively of fore- hindlimbs combined) at 14 days poststroke.
No diet effects in muscle strength of the forepaws was found (Figure 2E). The grasping grid revealed that mice on Fortasyn diet tended to have higher muscle strength than mice on Control diet (F(1,13)=4.5, p<.057).
Pole test
Motor coordination was measured with the pole test: turning time, rotation direction, and the downwards walking velocity. No differences were detected between the dietary groups concerning velocity to descend along the pole (Figure 2F, F(1,14)=0.2, p<.909). Mice on Control diet needed more time to turn than mice on Fortasyn diet when being placed head-upwards on top of the pole (Figure 2G, F(1,14)=9.0, p<.010). The turning phase requires fine-tuned and coordinated movements demanding on the potential motor coordination [59]. Notably, mice fed Control diet tended to turn more frequently to the right to fully turn head-down than mice fed Fortasyn diet indicating reduced laterality in the Fortasyn fed mice (Figure 2H, F(1,14)=4.3, p<.058).
Cerebral blood flow (Nijmegen, The Netherlands)
CBF was measured with flow-sensitive alternating inversion recovery (FAIR) MRI; from a series of echo planar imaging (EPI)-images in three different regions of interest (ROI): Cortex, hippocampus and thalamus. Each ROI was drawn double blind. One representative high-resolution voxel-wise analyzed CBF image for each dietary group at 7 and 35 after tMCAo is shown (Figure 3B). CBF was analyzed for each ROI in the unaffected (contralateral/ left) and affected (ipsilateral/ right) hemisphere separately for each dietary group at 7 and 35 poststroke (Figure 3A). Furthermore, loss of CBF in the affected ROI was calculated as the difference in CBF between right and left hemispheric ROI relative to left hemispheric ROI (Figure 3C).
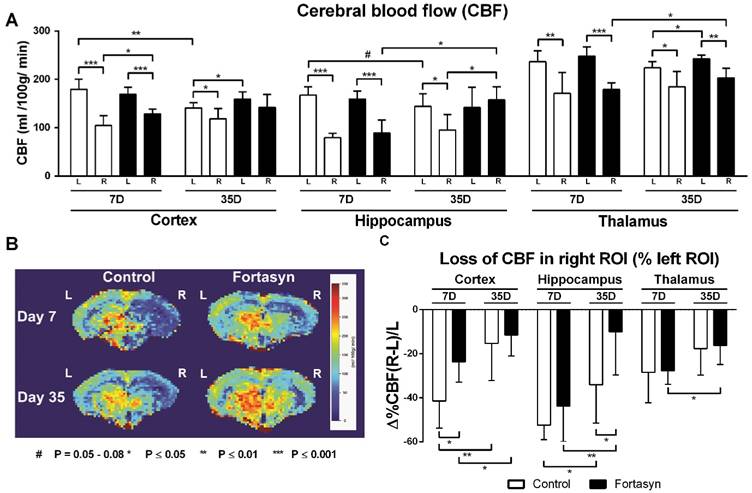
Cerebral blood flow (CBF) determined with flow-sensitive alternating inversion recovery (FAIR) MRI 7 and 35 days after tMCAo in cortex, hippocampus and thalamus of mice on Fortasyn or Control diet. Values represent mean±SD. (B) Representative high-resolution voxel-wise analyzed CBF image at 7 and 35 poststroke. (A) 7 days poststroke CBF in right cortex (Control, p<.001; Fortasyn, p<.001), right hippocampus (Control, p<.001; Fortasyn, p<.001), and in right thalamus (Control, p<.005; Fortasyn, p<.001) were lower than corresponding left ROI for both diets. Mice on Fortasyn showed increased CBF in right affected cortex (p<.017). 35 days poststroke, Control mice demonstrated lower CBF in right cortex (p<.043), right hippocampus (p<.010), and right thalamus (p<.015) compared to left ROI, while Fortasyn mice demonstrated decreased right thalamic CBF (p<.002) and a higher CBF than control mice in left cortex (p<.040), right hippocampus (p<.045), and also left thalamus (p<.020) at day 35. Control mice showed a decreased left cortical (p<.002) and left hippocampal (p<.079) CBF over time, Fortasyn fed animals showed increased CBF in right hippocampus (p<.019) and right thalamus (p<.032) over time. (C) Fortasyn mice exhibited a less diminished cortical CBF at 7 days poststroke (p<.017) and in hippocampal CBF at 35 days poststroke (p<.040). CBF recovery was shown in cortex (Control, p<.007; Fortasyn, p<.040) and hippocampus (Control, p<.024; Fortasyn, p<.009), and thalamus (Fortasyn, p<.018).
7 days poststroke CBF in the right cortex (Control, F(1,12)=46.9, p<.001; Fortasyn, F(1,12)=38.8, p<.001), right hippocampus (Control, F(1,12)=148.2, p<.001; Fortasyn, F(1,12)=34.6, p<.001), and right thalamus (Control, F(1,12)=12.3, p<.005; Fortasyn, F(1,12)=60.7, p<.001) were lower than corresponding left ROI in mice for both diets. At this time point, mice on Fortasyn demonstrated higher CBF in the right affected cortex than mice on Control diet (Fortasyn, F(1,12)=7.7, p<.017).
35 days poststroke only mice on Control diet demonstrated lower CBF in right cortex (F(1,12)=5.2, p<.043), right hippocampus (F(1,12)=9.4, p<.010), and in right thalamus (F(1,12)=8.1, p<.015) compared to corresponding left ROI. Contrarily, mice on Fortasyn showed only a decreased CBF in right thalamus compared to left thalamus (F(1,10)=17.3, p<.002). Moreover, Fortasyn mice had a higher CBF than Control mice in left cortex (F(1,11)=5.4, p<.040), right hippocampus (F(1,11)=5.2, p<.045), and also the left thalamus (F(1,11)=7.4, p<.020) over time.
We also investigated CBF over time from 7 days to 35 days poststroke. While animals on Control diet showed only a decreased CBF in left cortex (F(1,12)=17.7, p<.002) and in left hippocampus (F(1,12)=3.7, p<.079) over time, animals on Fortasyn diet did not show these decreases (left cortex, F(1,11)=1.4, p<.256; left hippocampus, F(1,11)=.0, p<.886), and had an increased CBF in the right hippocampus (F(1,11)=7.6, p<.019) and right thalamus (F(1,11)=6.1, p<.032) over time.
At 7 days poststroke, Fortasyn mice exhibited a lower decrease in cortical CBF than Control mice (F(1,12)=7.7, p<.017). This beneficial effect was also seen at 35 days poststroke in the hippocampus of Fortasyn fed mice compared with Control diet fed mice (F(1,11)=5.5, p<.040). From 7 to 35 days poststroke both dietary groups showed a less impaired CBF in cortex (Control, F(1,12)=10.9, p<.007; Fortasyn, F(1,11)=5.5, p<.040) and hippocampus (Control, F(1,12)=6.7, p<.024; Fortasyn, F(1,11)=10.1, p<.009), while this improvement was also revealed in the thalamus of Fortasyn mice only (Control, F(1,12)=2.4, p<.147; Fortasyn, F(1,11)=7.9, p<.018).
Diffusion tensor imaging (Nijmegen, The Netherlands)
Quantitative assessment of diffusion tensor derived indices (fractional anisotropy, FA, Figure 4B; and mean diffusivity, MD, Figure 4C) was performed for ROI drawn in white and gray matter regions to assess diet and time effects 7 and 35 days poststroke.
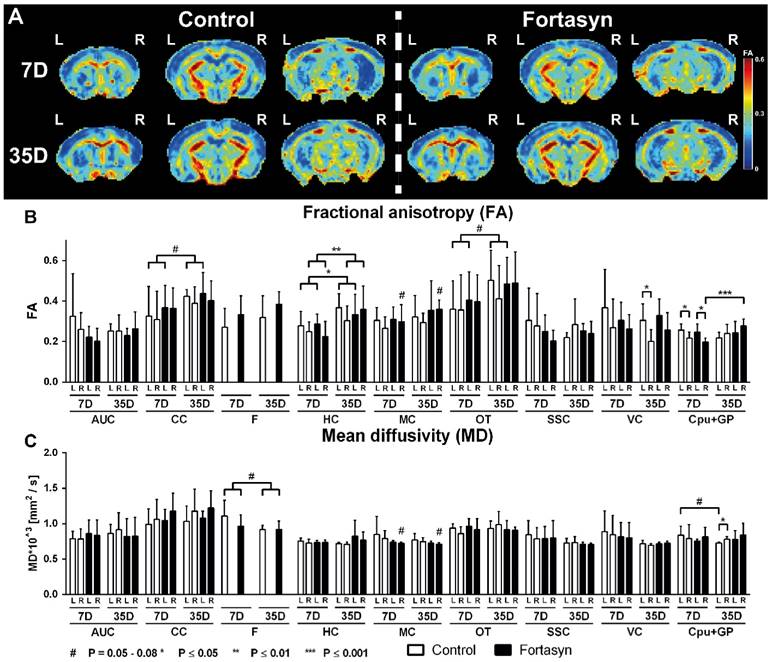
Quantitatively assessed diffusion tensor derived indices at 7 + 35 days poststroke in mice fed Fortasyn or Control diet. Fractional anisotropy (FA) and mean diffusivity (MD) were measured for ROI drawn in white and gray matter regions (AUC=auditory cortex, CC=corpus callosum, F=fornix, HC=hippocampus, MC=motor cortex, OT=optic tract, SSC=somatosensory cortex, VC=visual cortex, Cpu+GP= caudate putamen+globus pallidus). Values represent mean±SD. (A) Representative high-resolution set of three (Bregma: 0.38, -1.34, -2.92) FA images is shown for each dietary group 7 and 35 days poststroke. (B) Fortasyn mice showed a higher FA in the right MC than Control mice (p<.053) 7 and 35 days poststroke. Only mice on Fortasyn showed an increased FA in right Cpu+GP over time (p<.044). In all mice, FA increased from day 7 to day 35 poststroke in left CC (p<.065), left HC (p<.028), right HC (p<.007), and left OT (p<.055). Both dietary groups demonstrated a lower FA in right Cpu+GP compared to left Cpu+GP (Control, p<.027; Fortasyn, p<.011) 7 days poststroke. Control mice showed a lower FA in right VC (p<.030) compared to left VC. (C) Fortasyn mice showed a lower MD in the right MC than Control mice overtime (p<.059, trend). Only Control fed mice showed a non-significant decrease in MD in left Cpu+GP over time (p<.066). In all mice, MD seemed to decrease again from day 7 to day 35 poststroke in the F (p<.065). Only Control mice showed a higher MD in right Cpu+GP (p<.030) than in left Cpu+GP.
Fractional anisotropy
Fortasyn mice showed a trend of an increased FA in the right Motor Cortex (MC) compared to Control (F(1,22)=4.2, p<.053) at 7 and 35 days poststroke. Notably, a diet effect was found over time in the ROI containing the right Caudate, Putamen and Globus Pallidus (Cpu+GP, F(1,22)=3.8, p<.065). More specifically, only mice on Fortasyn showed an increase in FA in the right Cpu+GP over time (F(1,11)=1.2, p<.044), while mice on Control diet did not show this increase.
All mice, showed increased FA over time poststroke in the left Corpus Callosum (CC, F(1,22)=3.8, p<.065), left Hippocampus (HC, F(1,22)=5.6, p<.028), right HC (F(1,22)=9.0, p<.007), and left optic tract (F(1,22)=4.1, p<.055).
7 days poststroke in both dietary groups a lower FA was measured in the right caudate CPu+GP compared with CPu+GP in the left hemisphere (Control, F(1,12)=6.4, p<.027; Fortasyn, F(1,12)=9.1, p<.011).
While Fortasyn mice showed no significant decrease of FA in the right ROI compared with the corresponding left ROI at 35 days poststroke, Control mice showed a lower FA in the right visual cortex (VC, F(1,10)=6.5, p<.030) compared to left VC.
Mean diffusivity
Again, at 7 and 35 days poststroke Fortasyn mice had a lower MD in the right MC than Control mice (F(1,22)=4.0, p<.059, trend). Notably, a diet effect was found over time in the left Cpu+GP (F(1,22)=3.4, p<.078): only mice on Control diet showed a non-significant decreased MD in the left Cpu+GP over time (F(1,11)=4.2, p<.066). In all mice, MD tended to decrease over time in the Fornix (F(1,22)=3.8, p<.065).
While Fortasyn mice showed no MD increase in the right hemisphere ROI compared with the corresponding left hemisphere ROI at 35 days poststroke, Control mice showed a higher MD in the right Cpu+GP (F(1,10)=9.9, p<.030) compared to left Cpu+GP.
Resting state fMRI (Nijmegen, The Netherlands)
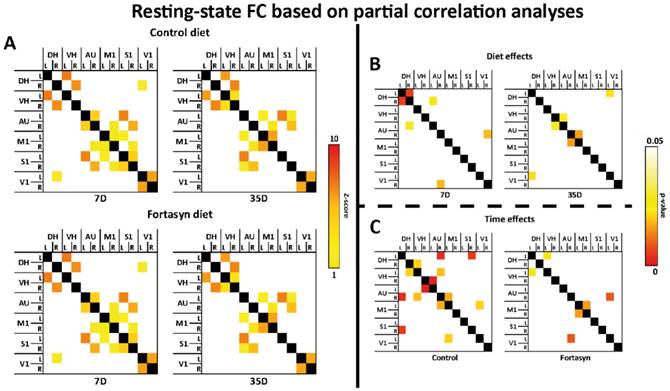
To compare functional connectivity (FC) patterns at 7 and 35 days poststroke and on different diets, rsfMRI data were statistically analyzed based on total (Supplemental figure 2A-C) and partial correlation (Figure 5A-C) in twelve ROI including: left and right dorsal hippocampus (DH), left and right ventral hippocampus (VH), left and right auditory cortex (AU), left and right motor cortex (M1), left and right somatosensory cortex (S1), and left and right visual cortex (V1).
Resting-state functional connectivity (FC) based on partial correlation analyses (A) in the brains of mice fed Fortasyn or Control diet 7 and 35 days poststroke. FC was measured between 12 ROI: dorsal hippocampus (DH), ventral hippocampus (VH), auditory cortex (AU), motor cortex (M1), somatosensory cortex (S1), and visual cortex (V1). (B) 7 days poststroke Fortasyn mice showed decreased FC between DH and right DH p<.011), and between right DH and left AU (p<.050). Fortasyn mice exhibited an increased FC between right AU and right V1 (p<.038) 7 days poststroke. At 35 days after tMCAo Fortasyn mice showed decreased FC between left DH and left V1 (p<.044), while FC between right VH and left AU (p<.048), and between right AU and left M1 (p<.032) was increased in Fortasyn mice. (C) On Control diet, FC was lowered over time between several ROI, e.g. left DH and right S1 (p<.010), while FC was increased between left V1 and left M1 (p<.041). On Fortasyn diet, FC was decreased between left DH to left VH (p<.050) and right AU to left V1 (p<.017). Fortasyn fed mice had a higher FC between left and right M1 over time (p<.032).
Total correlation analyses
With total correlations no significant diet effects nor time effects (Supplemental figure 2B,C) were measured.
Partial correlation analyses
Partial correlation analysis accentuates the direct connectivity between two ROI, while regressing the temporal BOLD signal from all other ROI. For the partial correlations we found significant diet effects at 7 and 35 days poststroke (Figure 5B).
At 7 days after tMCAo Fortasyn mice showed a decreased FC between left and right DH (F(1,8)=11.2, p<.011), and between right DH and left AU (F(1,8)=5.4, p<.050). In contrast, already at 7 days poststroke Fortasyn exhibited an increased FC between right AU and right V1 (F(1,8)=6.2, p<.038).
At 35 days poststroke Fortasyn mice showed only a decreased FC between left DH and left V1 (F(1,8)=5.7, p<.044), while FC between right VH and left AU (F(1,8)=5.5, p<.048), and between right AU and left M1 (F(1,8)=6.8, p<.032) was increased in mice fed the Fortasyn diet.
For the partial correlations we found significant time effects in mice on both diets (Figure 5C). Main findings were less negative effects over time in animals fed Fortasyn than animals fed the Control diet. Furthermore, a beneficial effect on FC between left and right M1 was revealed only in Fortasyn mice.
On Control diet, FC was lowered between left DH and right S1 (F(1,8)=11.6, p<.010), between left VH and right AU (F(1,8)=6.2, p<.038), between right VH and left AU (F(1,8)=22.9, p<.002), and between right AU and left M1 (F(1,8)=6.5, p<.035), while FC was heightened between right DH and left VH (F(1,8)=5.9, p<.041), between right AU and left DH (F(1,8)=13.9, p<.006), and between left V1 and left M1 (F(1,8)=5.9, p<.041).
On Fortasyn diet, FC was decreased only between left DH to left VH (F(1,8)=5.3, p<.050) and right AU to left V1 (F(1,8)=9.1, p<.017). Notably, mice on Fortasyn had a higher FC between left and right M1 over time (F(1,8)=6.8, p<.032).
PET results (Münster, Germany)
N=24 mice underwent tMCAo surgery and were intra-individually followed 7d, 14 d, and 35 d poststroke by PET using the TSPO ligand [18F]DPA-714. [18F]DPA-714 signal appeared within and around the infarct as determined by T2w-MRI (Figure 6A). In accordance, immunohistochemical data showed good spatial agreement as well as reduced TSPO levels in the Fortasyn group (Figure 6B). Double staining immunohistochemistry for TSPO and GFAP indicates astrocytes as source of TSPO at late time points after stroke (Figure 6C).
Positron Emission Tomography (PET) of microglial activation. (A) Representative intra-individual MR images and fusion images over time with PET of mice fed with the Control diet (left) versus mice fed with the Fortasyn diet (right). Fortasyn fed mice showed a reduced uptake of [18F]DPA-714 in the infarction after 35 days. (B) Comparison of [18F]DPA-714 with TSPO immunohistochemistry reveals reduced TSPO staining in Fortasyn animals (Scale bar: 1000µm and 50µm). (C) Irrespective of the dietary intervention, TSPO (red) is also expressed by astrocytes (green) 35d after tMCAo (Scale bar: 100µm. (D) Values represent mean+SD. [18F]DPA-714 mean uptake ratios were significantly reduced from 7 to 35 d after tMCAo in the Fortasyn group when compared to Control animals (p<.029). (E) Comparison of the max [18F]DPA-714 radio uptake ratios highlighted reduced [18F]DPA-714 uptake in the Fortasyn diet group from 7 to 35 d (p<.016).
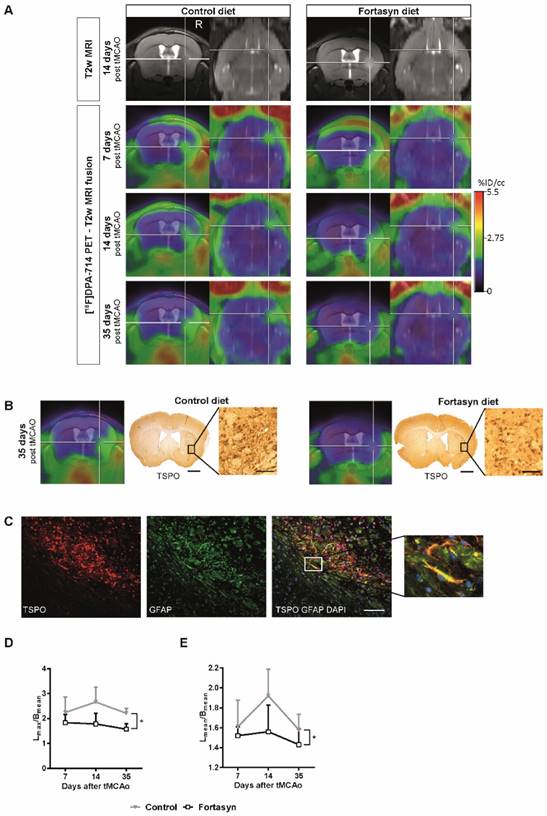
Investigation of diet effects over time revealed that [18F]DPA-714 mean uptake ratios (Figure 6D) were significantly reduced from 7 to 35 d poststroke in the Fortasyn group (Lmean/Cmean: 1.43+/-0.16; n=5) when compared to Control animals (Lmean/Cmean: 1.58+/-0.16; n=5; F(1,8)=7.1, p<.029). Similarly, comparison of the maximum [18F]DPA-714 radio uptake ratios (Figure 6E) highlighted reduced [18F]DPA-714 uptake in the Fortasyn diet group from 7 to 35 d poststroke (Lmax/Cmean: 1.57+/-0.23; n=5) as compared to the Control diet group (Lmax/Cmean: 2.21+/-0.20; n=5; (F(1,8)=9.4, p<.016).
Immunohistochemical procedures
In the supplemental material (supplemental figures 3-7) for each immunohistochemical staining a set of photos is given showing photos of each animal group in each ROI.
GLUT-1 staining (Nijmegen, The Netherlands)
All brains were processed for immunohistochemical staining with GLUT-1 antibody (glucose transporter-1). In order to reveal the changes in total GLUT-1 amount as well as in capillary density, we measured relative GLUT-1+ area and counted manually the amount of GLUT-1+ blood vessels in the cortex, hippocampus, and thalamus (Figure 7A-C).
Immunohistochemical stainings for glucose transporter-1 (GLUT-1, A-C), ionized calcium-binding adapter molecule 1 (IBA-1, D-F), doublecortin (DCX, G-J), synaptophysin (SYN, K-L) and Postsynaptic Density-95 Protein (PSD-95, N-P) on brains of Fortasyn and Control fed mice 35 days after tMCAo. Values represent mean±SD. (C) Fortasyn mice had more GLUT-1+blood vessels in the cortex than Control fed mice (p<.024), especially in the right cortex (p<.034) indicating a higher vascular density. (E) Mice on Fortasyn seemed to have a decreased relative IBA-1+ in cortex (p<.057) and hippocampus (p<.054) compared to Control fed mice. (E+F) The right thalamus showed a larger IBA-1+ area (p<.002) and more IBA-1+ cells (p<.001) than the left thalamus in mice on both diets. (F) Control fed mice had more IBA-1+ cells in the right hippocampus than Fortasyn fed mice (p<.037), whereas Fortasyn mice showed less IBA1+ cells in total hippocampus compared to Control (p<.039). (G-J) DCX+ cells were counted in the subgranular zone of the hippocampus (G+H) and in the subventricular zone (SVZ) (I+J). (J) Fortasyn fed mice had more DCX+ area in the right SVZ than in left SVZ (p<.047), and in the same ROI of Control fed mice (p<.039). (M) All mice showed a decreased relative SYN+ area in the right caudate putamen (Cpu, p<.006) compared to the left Cpu. (O+P) All mice had a lowered PSD-95+ area in the right cortex (p<.003) and in the right Cpu (p<.001) compared to the corresponding left ROI.
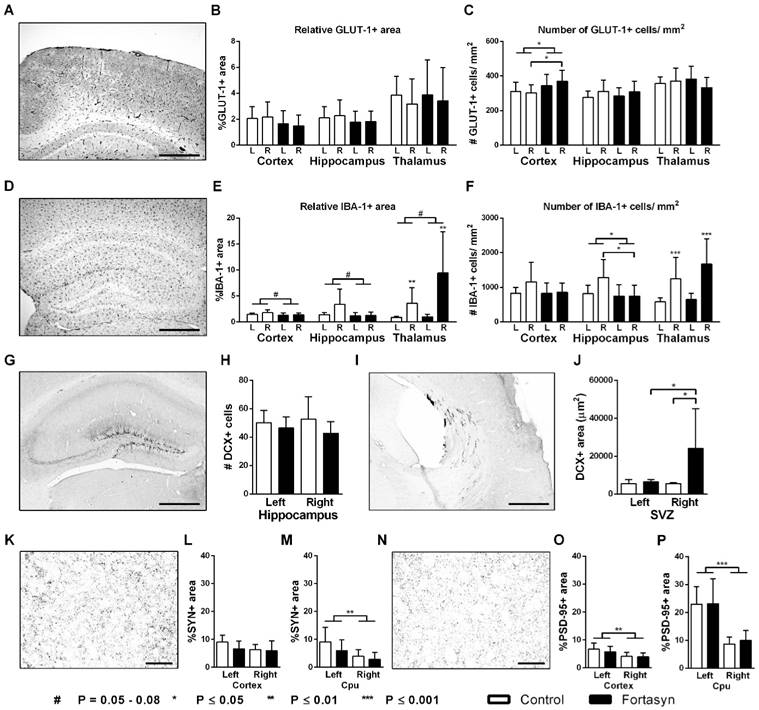
No diet effects were found for total GLUT-1 amount in the cortex, hippocampus, and thalamus (Figure 7B). Notably, Fortasyn mice had more GLUT-1 positive blood vessels in the cortex than Control mice (Figure 7C, F(1,13)=5.8, p<.024), especially in the right cortex (F(1,13)=5.6, p<.034) indicating a higher vascular density.
IBA-1 staining (Nijmegen, The Netherlands)
The brains of all mice were immunohistochemically stained with an antibody against ionized calcium-binding adapter molecule 1 (IBA-1, Figure 7D). IBA-1 is expressed by microglia, but also by phagocytes in general (monocytes and macrophages). We measured relative IBA-1+ area and the amount of IBA-1+ cells in the cortex, hippocampus, and thalamus (Figure 7D-F).
Compared to the left thalamus, the right thalamus revealed an increased relative IBA-1+ area (Figure 7E, F(1,26)=12.2, p<.002) and also an increased amount of IBA-1+ cells (Figure 7F, F(1,26)=21.8, p<.001) in mice on both diets. While mice on Fortasyn seemed to have a decreased relative IBA-1+ area in the cortex (F(1,28)=4.0, p<.057) and the hippocampus (F(1,24)=4.1, p<.054) compared with mice on Control diet, a non-significant increased relative IBA-1+ area was seen in the thalamus of Fortasyn mice (F(1,26)=3.5, p<.074). In addition, mice on Control diet had more IBA-1+ cells in their right hippocampus than mice on Fortasyn (Figure 7F, F(1,12)=5.5, p<.037), and also all mice on Fortasyn showed less IBA1+ cells in the total hippocampus than mice on Control diet. (Figure 7F, F(1,24)=4.8, p<.039).
DCX staining (Nijmegen, The Netherlands)
Immature neurons were visualized in all mice with a polyclonal antibody against doublecortin (DCX). As a measure for neurogenesis, DCX+ cells were counted in the subgranular zone of the hippocampus (Figure 7G+H) and DCX+ area was measured also in the subventricular zone (SVZ, Figure 7I+J).
No diet effects were found in the hippocampus. In the right SVZ Fortasyn fed mice had more DCX+ area than in their left SVZ (Figure 7J, F(1,12)=4.9, p<.047), and than Control fed mice in the same ROI (Figure 7J, F(1,12)=5.4, p<.039).
SYN and PSD-95 staining (Nijmegen, The Netherlands)
The amount of presynaptic boutons was visualized with a monoclonal antibody against synaptophysin (SYN). Whereas, postsynaptic density was stained with a polyclonal antibody against postsynaptic density protein 95 (PSD-95) reflecting synaptic function. Both pre- (Figure 7K-M) and postsynaptic (Figure 7N-P) density were measured in the cortex and caudate putamen (Cpu).
No diet effects were found in the cortex and Cpu for both the relative SYN+ and PSD-95+ area. All mice showed a decreased relative SYN+ area in the right Cpu (Figure 7M, F(1,25)=9.2, p<.006) compared to corresponding left ROI.
All mice had a lowered PSD-95+ area in the right cortex (Figure 7O, F(1,26)=11.3, p<.003) and also in the right Cpu (Figure 7P, F(1,24)=35.5, p<.001) compared to corresponding left ROI.
TSPO immunohistochemistry (Münster, Germany)
Spatial comparison of [18F]DPA-714 with immunohistochemistry for TSPO at 35 days after stroke revealed good spatial agreement. However, reduced TSPO immunohistochemistry was observed in Fortasyn treated animals (Figure 6B). Interestingly, 35 d after stroke astrocytes (GFAP) also expressed TSPO. (Figure 6C).
Discussion
The present data show that the specific nutrient combination Fortasyn may enhance recovery from ischemic stroke in mice, as evidenced by improved cerebral blood flow, reduced loss of functional connectivity, and improved motor performance. Relevant processes for recovery after stroke, such as neurogenesis, angiogenesis, and neuroinflammation, were positively affected by the Fortasyn diet.
Cerebral hemodynamics
CBF was increased already at seven and also at 35 days poststroke in mice on Fortasyn diet. Notably, CBF dropped over time in several brain regions in Control mice from 7 to 35 days poststroke, while this decrease was not seen in Fortasyn mice. These results are in accordance with our previous research showing that this nutrient combination is able to improve cerebral perfusion in mice models of (vascular risk factors for) Alzheimer's disease (AD) [35, 36]. In addition, improved vascular density due to an increased angiogenesis was found in the cortex of Fortasyn fed mice. This improved vascular health may explain the beneficial effects of Fortasyn on cerebral hemodynamics after the ischemic event.
DTI and rsfMRI
In the present study we investigated brain diffusivity with DTI as an imaging biomarker for white and gray matter integrity. FA is a marker of the degree of myelination and fiber density of white matter (WM), while MD characterizes an inverse measure of the membrane density and is sensitive to cellularity, edema, and necrosis in grey matter (GM) [73-75]. Here, we revealed an impaired WM microstructure at seven days poststroke in regions containing the Caudate Putamen and Globus Pallidus of both dietary groups. Notably, microstructural integrity of WM was restored in Fortasyn mice over time in affected regions containing Caudate Putamen and Globus Pallidus of the affected hemisphere. Moreover, at 7 and 35 days poststroke a slight beneficial effect on WM microstructure of the right Motor cortex was also seen only in Fortasyn mice. Also an improved GM microstructure in the right Motor cortex of Fortasyn animals at seven and 35 days, and an impaired GM integrity (an increase in MD) in regions containing the right Caudate Putamen and Globus Pallidus of only mice on Control diet was measured. Thus, Fortasyn may limit the damage to existing structures and may also support the regeneration of lost connectivity. Comparable results were found in other studies showing that intracerebral injection of EPA is able to stimulate the expression of myelin proteins in rat pup brain [76]. Partial correlations of functional connectivity data revealed several beneficial diet effects already at 7 and also at 35 days poststroke. Fortasyn diet increased FC between several brain regions, and over time Fortasyn limited loss of FC compared to Control diet. Notably, Fortasyn mice showed an improved interhemispheric FC between the motor cortices supporting the therapeutic value of Fortasyn already after 35 days. The importance of dietary composition for developing and maintaining distributed brain systems was shown in another preclinical rsfMRI study showing that n3-LCPUFA are crucial for functional connectivity and large-scale system organization in rhesus macaque brains [77]. Additionally, in a 24-week randomized, controlled, double-blind, parallel-group, multi-country study de Waal et al. explored the effect of a nutritional intervention with Fortasyn on brain activity-based networks. They showed that the nutritional intervention preserved the organization of brain networks in patients with mild AD within 24 weeks potentially via counteracting the progressive network disruption over time in AD [78]. In addition, in a recent study Fortasyn ameliorated deficits in FC in a mouse model for asymptomatic AD [35]. Notably, in a longitudinal observational clinical study acquiring rsfMRI data 4 times over a period of 6 months Park et al. demonstrated that FC of the ipsilesional M1 with the contralesional thalamus, supplementary motor area, and middle frontal gyrus at onset was positively correlated with motor recovery at 6 months after stroke [79].
Molecular alterations
The combination of phosphatide precursors like n3-LCPUFA, uridine, and choline, has proven to synergistically increase the synthesis of synaptic proteins and phospholipids in the brain [30-32]. In our study, a decreased amount of pre- and postsynaptic markers in the ipsilateral cortex and caudate putamen was observed indicating a significant negative effect of experimental stroke on synthesis and maintenance of synaptic proteins. Kawakita et al. demonstrated that DHA effectively promotes neurogenesis both in vitro and in vivo [80]. Notably, even in an experimental murine stroke model our specific nutrient combination was able to increase neurogenesis. Here, we measured via DCX a significant enhanced neurogenesis in the right (affected) border zones of the lateral ventricle in Fortasyn fed animals indicating accelerated (neuronal) membrane synthesis.
Neuroinflammation
[18F]DPA-714 is a ligand for the 18 kDa translocatorprotein (TSPO), which is highly expressed by microglial cells upon neuroinflammatory stimuli. Previous studies have shown that the majority of PET signal is due to increased expression of TSPO by microglia [46, 81]. Therefore, [18F]DPA-714 has now already been used in a variety of clinical studies in neurological diseases [82]. However, due to the lack of specific markers and antibodies reliably distinguishing microglia and macrophages it cannot be excluded that macrophages contribute to the signal. We and others have shown that under rather chronic conditions astrocytes faintly express TSPO (see Fig. 7C and [83]), whereas at early-intermediate time points (24h-14 days) after stroke astrocytes seem not play an important role [46]. A decreased neuroinflammation/ microglial activation was observed with Fortasyn for up to 35 days post stroke by PET imaging. The beneficial function of Fortasyn was likely mediated by a reduction of IBA-1 positive cells. IBA-1, which is expressed in activated microglia and macrophages, was reduced at 35 days post stroke in the cortex and the hippocampus of Fortasyn mice. Notably, Harvey et al. could not show an effect of single administration of DHA on IBA-1 at three, 7, and 21 days after TBI on neuroinflammation in post-traumatic brain injury (TBI) in Sprague Dawley rats, indicating that a combination of factors may enhance diet function. However, they also showed that DHA may be able to facilitate the polarization of microglia or macrophages into an anti-inflammatory and reparative microglia phenotype [84]. The reduced neuroinflammatory response might also explain the beneficial effects on functional and structural connectivity. Several recent studies indicated that microglia are crucially involved in processes of synaptic remodeling and plasticity in the healthy brain [85-87]. In future preclinical stroke research the impact of Fortasyn on glial cells needs to be studied, since DHA as single component by itself is already able to modulate glial cell activity by regulating gene expression and release of inflammatory mediators, as well as serving as substrate for specialized pro-resolving mediators [88-90].
Motor function
Fortasyn mice tended to have more grip strength with all four limbs compared to control mice. This effect could partly be due to the beneficial effects of the Fortasyn diet on cerebral regions involved in motor functions. During the turning phase of the pole test set of fine-tuned and coordinated movements are required [59]. In the current study mice on Control diet needed more time to turn on the pole than mice on Fortasyn diet. In addition, Control mice showed a lateral bias at 15 days poststroke which was not present in Fortasyn mice. These latter results are in accordance to the recent study of Bourourou et al.. Here, the dietary supplementation with the omega-3 precursor, alpha-linolenic acid, was more effective in improving motor coordination in a mouse model of ischemic stroke than intravenous treatment [91]. Notably, at 23 days poststroke all Fortasyn mice walked more often than the Control mice and also more often than at three days poststroke indicating an improved locomotion. These latter results are in line with other studies demonstrating that DHA treatment has beneficial effects on locomotor activity [9, 35]. While Cao et al. focused only on the preventive effect of DHA treatment and Hong et al. on the acute phase after stroke, in our study we now finally get one step further towards effective acute treatment for recovery after stroke which is still lacking for many stroke patients. The pole and grip test were not performed at multiple time points after tMCAo like the Rotarod or open field. Future studies should repeat these motor tests at multiple time points to obtain additional indications of the long-term effects of Fortasyn on motor performance at later time points poststroke. Particularly, rodents are well known to be able to compensate functional differences rather than presenting true recovery after an experimental stroke [92]. Notably, an example of functional compensation in our study is the improved functional connectivity over time in our control mice. Here, control mice also showed an improved functional connectivity between several brain regions, being not present in animals on Fortasyn diet. Here, we were able to demonstrate beneficial dietary effects already at 7 and also at 35 days post experimental stroke. Future studies should also focus on more severe stroke models to study the beneficial effects of multi-nutrient interventions.
We showed improvement of long-term outcome using a specific combination of nutrients. Notably, in the current experiments no effect on body weight was detected, but all Fortasyn mice seemed to have a higher food intake during all 35 days after an experimental stroke.
We did not find diet effects on cognition in the novel object recognition test (ORT) measured from 22 to 24 days poststroke. This absent effect is in line with previous research of Wang et al. who demonstrated a significantly reduced preference at 7 and 14 days following stroke, but normal values between 21 and 28 days post-stroke, within the ORT [93]. Therefore in future research, the ORT should be performed earlier after the induction of the experimental stroke to reveal subtle dietary effects.
Summary and conclusions
This international, multicenter preclinical study was exerted according to ARRIVE and STAIR guidelines [41-44] revealing that multimodal neuroimaging combined with behavioral analysis is an excellent approach to assess brain and motor function recovery after stroke. In addition, this experimental setup shows the beneficial effects of an academic-industry collaboration and an industry-relevant translational research covering many aspects and complexities of a multicenter multimodal paradigm [71, 72]. In conclusion, our data indicate that a post-stroke intervention with the specific nutrient combination of Fortasyn is able to support recovery after ischemic stroke, by improving cerebral circulation due to an improved vascularization and increased angiogenesis, protecting white and gray matter integrity, restoring functional connectivity, increasing neurogenesis, decreasing the neuroinflammatory response, and improving motor skills and muscle strength. No therapeutic intervention is available for stroke yet, but the broad range of structural and functional therapeutic benefits observed in the present study indicates clear therapeutic potential of the Fortasyn nutrient combination to support functional recovery after ischemic stroke. This recent study investigating a specific dietary approach which has been tested in several mouse models of (risk factors) AD, is the first step in the development of tailor-based dietary treatments against stroke. Increased adherence to a Mediterranean-style diet lowers the risk of ischemic stroke [14], and future studies should therefore start to focus on optimization of multicomponent combinations targeting dietary components of the Mediterranean diet to improve clinical outcome after a stroke.
Supplementary Material
Supplementary figures.
Abbreviations
[18F]DPA-714: N,N-diethyl-2-(2-(4-(2-[18F]fluoroethoxy)phenyl)-5,7-dimethylpyrazolo[1,5-a]pyrimidin-3-yl)acetamide; BW: Body Weight; DCX: Doublecortin; EPI: Echo Planar Imaging; FA: Fractional Anisotropy; FAIR: Flow-Sensitive Alternating Inversion Recovery; FC: Functional Connectivity; GLUT-1: Glucose Transporter-1; GM: Grey Matter; IBA-1: Ionized Calcium-Binding Adapter Molecule 1; MD: Mean Diffusivity; ORT: Novel Object Recognition Test; PBS: Phosphate-Buffered Saline; pdMCAo: permanent distal MCAo; Ppi: Prepulse Inhibition; PSD-95: Postsynaptic Density Protein 95; rsfMRI: resting state fMRI; SPM: Statistical Parametric Mapping; SYN: Synaptophysin; TBI: Traumatic Brain Injury; TSPO: Translocator Protein; VOI: Volume of Interest; WM: White Matter.
Acknowledgements
The authors thank Bianca Lemmers-van de Weem, Kitty Lemmens-Hermans, Iris Lamers-Elemans, Henk Arnts, Marlena Kattenbeck, Sarah Köster, Christine Bätza, Roman Priebe, Stefanie Bouma, Florian Breuer, Irmgard Hoppe, Maartje Mutsaers, Andor Veltien, and Christa Möllmann, for their excellent experimental support.
Sources of Funding
This work was supported by the EU FP-7 projects LipiDiDiet (Grant Agreement no. 211696) and INMiND (GA no. 278850), and NWO Investment Grants 91106021 and BIG (VISTA). This study was supported by the Internationale Stichting Alzheimer Onderzoek (ISAO; grant no11528), by Nutricia Research, and by the Interdisciplinary Center for Clinical Research (IZKF core unit PIX), Münster, Germany.
Author contributions
M.W., B.Z., A.H.J., and A.J.K. designed research; M.W., B.Z., D.R., S.E., P.J.D., M.H., L.W., and M.P.C.M. performed research; M.W., B.Z., M.H. analyzed data; M.W., B.Z., A.H.J., and A.J.K. wrote the paper; M.T.K., L.W., S.H., A.H., L.M.B., A.H.J., and A.J.K. made critical revision.
Competing Interests
Laus M. Broersen is employed by Nutricia Research. No actual or potential competing interests apply for the remaining authors. Nutricia Research was neither involved in data analyses, statistical analyses, nor writing the manuscript.
References
1. Lozano R, Naghavi M, Foreman K, Lim S, Shibuya K, Aboyans V. et al. Global and regional mortality from 235 causes of death for 20 age groups in 1990 and 2010: a systematic analysis for the Global Burden of Disease Study 2010. Lancet. 2012;380:2095-128
2. (CDC) CfDCaP. Prevalence and most common causes of disability among adults-United States, 2005. MMWR Morb Mortal Wkly Rep. 2009;58:421-6
3. Lyden P. Thrombolytic Therapy for Acute Stroke — Not a Moment to Lose. N Engl J Med. 2008;359:1393-5
4. Doyle KP, Simon RP, Stenzel-Poore MP. Mechanisms of ischemic brain damage. Neuropharmacology. 2008;55:310-8
5. Hong S-H, Belayev L, Khoutorova L, Obenaus A, Bazan NG. Docosahexaenoic acid confers enduring neuroprotection in experimental stroke. J Neurol Sci. 2014;338:135-41
6. MEMBERS WG, Lloyd-Jones D, Adams RJ, Brown TM, Carnethon M, Dai S. et al. Executive Summary: Heart Disease and Stroke Statistics—2010 Update: A Report From the American Heart Association. Circulation. 2010;121:948-54
7. Rost NS, Bottle A, Lee JM, Randall M, Middleton S, Shaw L. et al. Stroke Severity Is a Crucial Predictor of Outcome: An International Prospective Validation Study. J Am Heart Assoc. 2016:5
8. Belayev L, Khoutorova L, Atkins KD, Eady TN, Hong S, Lu Y. et al. Docosahexaenoic Acid therapy of experimental ischemic stroke. Transl Stroke Res. 2011;2:33-41
9. Rutten-Jacobs LC, Arntz RM, Maaijwee NA, Schoonderwaldt HC, Dorresteijn LD, van Dijk EJ. et al. Long-term mortality after stroke among adults aged 18 to 50 years. JAMA. 2013;309:1136-44
10. Lloyd-Jones D, Adams R, Carnethon M, De Simone G, Ferguson TB, Flegal K. et al. Heart Disease and Stroke Statistics—2009 Update. A Report From the American Heart Association Statistics Committee and Stroke Statistics Subcommittee. Circulation. 2008
11. Jacobs AH, Tavitian B, consortium tI. Noninvasive Molecular Imaging of Neuroinflammation. J Cereb Blood Flow Metab. 2012;32:1393-415
12. Aquilani R, Scocchi M, Boschi F, Viglio S, Iadarola P, Pastoris O. et al. Effect of calorie-protein supplementation on the cognitive recovery of patients with subacute stroke. Nutr Neurosci. 2008;11:235-40
13. Aquilani R, Scocchi M, Iadarola P, Franciscone P, Verri M, Boschi F. et al. Protein supplementation may enhance the spontaneous recovery of neurological alterations in patients with ischaemic stroke. Clin Rehabil. 2008;22:1042-50
14. Gardener H, Wright CB, Gu Y, Demmer RT, Boden-Albala B, Elkind MS. et al. Mediterranean-style diet and risk of ischemic stroke, myocardial infarction, and vascular death: the Northern Manhattan Study. Am J Clin Nutr. 2011;94:1458-64
15. Nguemeni C, Delplanque B, Rovère C, Simon-Rousseau N, Gandin C, Agnani G. et al. Dietary supplementation of alpha-linolenic acid in an enriched rapeseed oil diet protects from stroke. Pharmacol Res. 2010;61:226-33
16. He K, Song Y, Daviglus ML, Liu K, Van Horn L, Dyer AR. et al. Fish consumption and incidence of stroke: a meta-analysis of cohort studies. Stroke. 2004;35:1538-42
17. Larsson SC, Virtamo J, Wolk A. Dietary fats and dietary cholesterol and risk of stroke in women. Atherosclerosis. 2012;221:282-6
18. Thies F, Garry J, Yaqoob P, Rerkasem K, Williams J, Shearman CP. et al. Association of n-3 polyunsaturated fatty acids with stability of atherosclerotic plaques: a randomised controlled trial. Lancet. 2003;361:477-85
19. Geleijnse JM, Giltay EJ, Grobbee DE, Donders AR, Kok FJ. Blood pressure response to fish oil supplementation: metaregression analysis of randomized trials. J Hypertens. 2002;20:1493-9
20. Daviglus ML, Stamler J, Orencia AJ, Dyer AR, Liu K, Greenland P. et al. Fish consumption and the 30-year risk of fatal myocardial infarction. N Engl J Med. 1997;336:1046-53
21. Hu FB, Bronner L, Willett WC, Stampfer MJ, Rexrode KM, Albert CM. et al. Fish and omega-3 fatty acid intake and risk of coronary heart disease in women. JAMA. 2002;287:1815-21
22. von Schacky C, Harris WS. Cardiovascular benefits of omega-3 fatty acids. Cardiovasc Res. 2007;73:310-5
23. Ozen O, Cosar M, Sahin O, Fidan H, Eser O, Mollaoglu H. et al. The protective effect of fish n-3 fatty acids on cerebral ischemia in rat prefrontal cortex. Neurol Sci. 2008;29:147-52
24. Holguin S, Huang Y, Liu J, Wurtman R. Chronic administration of DHA and UMP improves the impaired memory of environmentally impoverished rats. Behav Brain Res. 2008;191:11-6
25. von Schacky C. A Review of Omega-3 Ethyl Esters for Cardiovascular Prevention and Treatment of Increased Blood Triglyceride Levels. Vasc Health Risk Manag. 2006;2:251-62
26. Song T-J, Chang Y, Shin M-J, Heo JH, Kim Y-J. Low levels of plasma omega 3-polyunsaturated fatty acids are associated with cerebral small vessel diseases in acute ischemic stroke patients. Nutr Res. 2015;35:368-74
27. Holguin S, Martinez J, Chow C, Wurtman R. Dietary uridine enhances the improvement in learning and memory produced by administering DHA to gerbils. FASEB J. 2008;22:3938-46
28. Wurtman RJ, Cansev M, Sakamoto T, Ulus I. Nutritional modifiers of aging brain function: use of uridine and other phosphatide precursors to increase formation of brain synapses. Nutr Rev. 2010;68:S88-S101
29. Weiss S, Kennedy E. The function of cytidine coenzymes in the biosynthesis of phospholipids. J Biol Chem. 1956;222:193
30. Wurtman RJ, Ulus IH, Cansev M, Watkins CJ, Wang L, Marzloff G. Synaptic proteins and phospholipids are increased in gerbil brain by administering uridine plus docosahexaenoic acid orally. Brain Res. 2006;1088:83-92
31. Cansev M, Wurtman RJ. Chronic administration of docosahexaenoic acid or eicosapentaenoic acid, but not arachidonic acid, alone or in combination with uridine, increases brain phosphatide and synaptic protein levels in gerbils. Neuroscience. 2007;148:421-31
32. Sakamoto T, Cansev M, Wurtman RJ. Oral supplementation with docosahexaenoic acid and uridine-5'-monophosphate increases dendritic spine density in adult gerbil hippocampus. Brain Res. 2007;1182:50-9
33. Zerbi V, Jansen D, Wiesmann M, Fang X, Broersen LM, Veltien A. et al. Multinutrient diets improve cerebral perfusion and neuroprotection in a murine model of Alzheimer's disease. Neurobiol Aging. 2014;35:600-13
34. Wiesmann M, Jansen D, Zerbi V, Broersen LM, Garthe A, Kiliaan AJ. Improved spatial learning strategy and memory in aged Alzheimer AbetaPPswe/PS1dE9 mice on a multi-nutrient diet. J Alzheimers Dis. 2013;37:233-45
35. Wiesmann M, Zerbi V, Jansen D, Haast R, Lütjohann D, Broersen LM. et al. A Dietary Treatment Improves Cerebral Blood Flow and Brain Connectivity in Aging apoE4 Mice. Neural Plast. 2016;2016:15
36. Zerbi V, Jansen D, Wiesmann M, Fang X, Broersen LM, Veltien A. et al. Multinutrient diets improve cerebral perfusion and neuroprotection in a murine model of Alzheimer's disease. Neurobiology of Aging. 2014;35:600-13
37. Pallier PN, Poddighe L, Zbarsky V, Kostusiak M, Choudhury R, Hart T. et al. A nutrient combination designed to enhance synapse formation and function improves outcome in experimental spinal cord injury. Neurobiol Dis. 2015;82:504-15
38. Chen M-K, Guilarte TR. Translocator Protein 18kDA (TSPO): Molecular Sensor of Brain Injury & Repair. Pharmacol Ther. 2008;118:1-17
39. Papadopoulos V, Baraldi M, Guilarte TR, Knudsen TB, Lacapère J-J, Lindemann P. et al. Translocator protein (18 kDa): new nomenclature for the peripheral-type benzodiazepine receptor based on its structure and molecular function. Trends Pharmacol Sci. 2006;27:402-9
40. Jacobs AH, Tavitian B, the Ic. Noninvasive molecular imaging of neuroinflammation. J Cereb Blood Flow Metab. 2012;32:1393-415
41. Kilkenny C, Browne WJ, Cuthill IC, Emerson M, Altman DG. Improving Bioscience Research Reporting: The ARRIVE Guidelines for Reporting Animal Research. PLoS Biol. 2010;8:e1000412
42. (STAIR) STAIR. Recommendations for Standards Regarding Preclinical Neuroprotective and Restorative Drug Development. Stroke. 1999;30:2752
43. Fisher M, Feuerstein G, Howells DW, Hurn PD, Kent TA, Savitz SI. et al. Update of the Stroke Therapy Academic Industry Roundtable Preclinical Recommendations. Stroke. 2009;40:2244-50
44. Boltze J, Wagner D-C, Henninger N, Plesnila N, Ayata C. Phase III Preclinical Trials in Translational Stroke Research: Community Response on Framework and Guidelines. Transl Stroke Res. 2016;7:241-7
45. Engel O, Kolodziej S, Dirnagl U, Prinz V. Modeling Stroke in Mice - Middle Cerebral Artery Occlusion with the Filament Model. J Vis Exp. 2011 e2423
46. Zinnhardt B, Viel T, Wachsmuth L, Vrachimis A, Wagner S, Breyholz H-J. et al. Multimodal Imaging Reveals Temporal and Spatial Microglia and Matrix Metalloproteinase Activity after Experimental Stroke. J Cereb Blood Flow Metab. 2015;35:1711-21
47. Endres M, Dirnagl U. Ischemia and Stroke. In: (ed.) Alzheimer C. Molecular and Cellular Biology of Neuroprotection in the CNS. Boston, MA: Springer US. 2002:455-73
48. Endres M, Namura S, Shimizu-Sasamata M, Waeber C, Zhang L, Gómez-Isla T. et al. Attenuation of Delayed Neuronal Death after Mild Focal Ischemia in Mice by Inhibition of the Caspase Family. J Cereb Blood Flow Metab. 1998;18:238-47
49. Fink K, Zhu J, Namura S, Shimizu-Sasamata M, Endres M, Ma J. et al. Prolonged Therapeutic Window for Ischemic Brain Damage Caused by Delayed Caspase Activation. J Cereb Blood Flow Metab. 1998;18:1071-6
50. Popp A, Jaenisch N, Witte OW, Frahm C. Identification of Ischemic Regions in a Rat Model of Stroke. PLoS ONE. 2009;4:e4764
51. Carmichael ST. Rodent Models of Focal Stroke: Size, Mechanism, and Purpose. NeuroRx. 2005;2:396-409
52. Jansen D, Zerbi V, Arnoldussen IAC, Wiesmann M, Rijpma A, Fang XT. et al. Effects of Specific Multi-Nutrient Enriched Diets on Cerebral Metabolism, Cognition and Neuropathology in AβPPswe-PS1dE9 Mice. PLoS ONE. 2013;8:e75393
53. Jansen D, Zerbi V, Janssen CF, van Rooij D, Zinnhardt B, Dederen P. et al. Impact of a multi-nutrient diet on cognition, brain metabolism, hemodynamics, and plasticity in apoE4 carrier and apoE knockout mice. Brain Struct Funct. 2014;219:1841-68
54. Janssen CIF, Zerbi V, Mutsaers MPC, de Jong BSW, Wiesmann M, Arnoldussen IAC. et al. Impact of dietary n-3 polyunsaturated fatty acids on cognition, motor skills and hippocampal neurogenesis in developing C57BL/6J mice. J Nutr Biochem. 2015;26:24-35
55. Janssen CIF, Zerbi V, Mutsaers MPC, Jochems M, Vos CA, Vos JO. et al. Effect of perinatally supplemented flavonoids on brain structure, circulation, cognition, and metabolism in C57BL/6J mice. Neurochem Int. 2015;89:157-69
56. Streijger F, Oerlemans F, Ellenbroek BA, Jost CR, Wieringa B, Van der Zee CEEM. Structural and behavioural consequences of double deficiency for creatine kinases BCK and UbCKmit. Behav Brain Res. 2005;157:219-34
57. Hooijmans CR, Van der Zee CEEM, Dederen PJ, Brouwer KM, Reijmer YD, van Groen T. et al. DHA and cholesterol containing diets influence Alzheimer-like pathology, cognition and cerebral vasculature in APPswe/PS1dE9 mice. Neurobiol Dis. 2009;33:482-98
58. Lange N, Hamann M, Shashidharan P, Richter A. Behavioural and pharmacological examinations in a transgenic mouse model of early-onset torsion dystonia. Pharmacol Biochem Behav. 2011;97:647-55
59. Balkaya M, Endres M. Behavioral Testing in Mouse Models of Stroke. Dirnagl U, editor. Rodent Models of Stroke: Humana Press. 2010:179-97
60. Kim SG. Quantification of relative cerebral blood flow change by flow-sensitive alternating inversion recovery (FAIR) technique: application to functional mapping. Magn Reson Med. 1995;34:293-301
61. Kwong KK, Chesler DA, Weisskoff RM, Donahue KM, Davis TL, Ostergaard L. et al. MR perfusion studies with T1-weighted echo planar imaging. Magn Reson Med. 1995;34:878-87
62. Paxinos G, Franklin KB. The mouse brain in stereotaxic coordinates / George Paxinos, Keith Franklin. London: Academic. 2004
63. Harsan LA, Paul D, Schnell S, Kreher BW, Hennig J, Staiger JF. et al. In vivo diffusion tensor magnetic resonance imaging and fiber tracking of the mouse brain. NMR Biomed. 2010;23:884-96
64. Zerbi V, Kleinnijenhuis M, Fang X, Jansen D, Veltien A, Van Asten J. et al. Gray and white matter degeneration revealed by diffusion in an Alzheimer mouse model. Neurobiol Aging. 2013;34:1440-50
65. Zwiers MP. Patching cardiac and head motion artefacts in diffusion-weighted images. Neuroimage. 2010;53:565-75
66. Sawiak SJ, Wood NI, Williams GB, Morton AJ, Carpenter TA. Voxel-based morphometry in the R6/2 transgenic mouse reveals differences between genotypes not seen with manual 2D morphometry. Neurobiol Dis. 2009;33:20-7
67. Jonckers E, Van Audekerke J, De Visscher G, Van der Linden A, Verhoye M. Functional Connectivity fMRI of the Rodent Brain: Comparison of Functional Connectivity Networks in Rat and Mouse. PLoS ONE. 2011;6:e18876
68. James ML, Fulton RR, Vercoullie J, Henderson DJ, Garreau L, Chalon S. et al. DPA-714, a New Translocator Protein-Specific Ligand: Synthesis, Radiofluorination, and Pharmacologic Characterization. J Nucl Med. 2008;49:814-22
69. Vollmar SCJ, Sue M, Klein J, Jacobs AH, Herholz K. VINCI-Volume Imaging in Neurological Research, Co-Registration and ROIs Forschung und wissenschaftliches Rechnen 2003. Göttingen: Gesellschaft für Wissenschaftliche Datenverarbeitung. 2004:115-31
70. Janssen CIF, Jansen D, Mutsaers MPC, Dederen PJWC, Geenen B, Mulder MT. et al. The Effect of a High-Fat Diet on Brain Plasticity, Inflammation and Cognition in Female ApoE4-Knockin and ApoE-Knockout Mice. PLoS ONE. 2016;11:e0155307
71. Dirnagl U, Hakim A, Macleod M, Fisher M, Howells D, Alan SM. et al. A concerted appeal for international cooperation in preclinical stroke research. Stroke. 2013;44:1754-60
72. Dirnagl U, Fisher M. International, multicenter randomized preclinical trials in translational stroke research: It's time to act. J Cereb Blood Flow Metab. 2012;32:933-5
73. Le Bihan D, Mangin J-F, Poupon C, Clark CA, Pappata S, Molko N. et al. Diffusion tensor imaging: Concepts and applications. J Magn Reson Imaging. 2001;13:534-46
74. Alexander AL, Hurley SA, Samsonov AA, Adluru N, Hosseinbor AP, Mossahebi P. et al. Characterization of Cerebral White Matter Properties Using Quantitative Magnetic Resonance Imaging Stains. Brain Connect. 2011;1:423-46
75. Feldman HM, Yeatman JD, Lee ES, Barde LHF, Gaman-Bean S. Diffusion Tensor Imaging: A Review for Pediatric Researchers and Clinicians. J Dev Behav Pediatr. 2010;31:346-56
76. Salvati S, Natali F, Attorri L, Di Benedetto R, Leonardi F, Di Biase A. et al. Eicosapentaenoic acid stimulates the expression of myelin proteins in rat brain. J Neurosci Res. 2008;86:776-84
77. Grayson DS, Kroenke CD, Neuringer M, Fair DA. Dietary Omega-3 Fatty Acids Modulate Large-Scale Systems Organization in the Rhesus Macaque Brain. J Neurosci. 2014;34:2065-74
78. de Waal H, Stam CJ, Lansbergen MM, Wieggers RL, Kamphuis PJGH, Scheltens P. et al. The Effect of Souvenaid on Functional Brain Network Organisation in Patients with Mild Alzheimer?s Disease: A Randomised Controlled Study. PLoS ONE. 2014;9:e86558
79. Park C-h, Chang WH, Ohn SH, Kim ST, Bang OY, Pascual-Leone A. et al. Longitudinal Changes of Resting-State Functional Connectivity During Motor Recovery After Stroke. Stroke. 2011;42:1357-62
80. Kawakita E, Hashimoto M, Shido O. Docosahexaenoic acid promotes neurogenesis in vitro and in vivo. Neuroscience. 2006;139:991-7
81. Martín A, Boisgard R, Thézé B, Van Camp N, Kuhnast B, Damont A. et al. Evaluation of the PBR/TSPO Radioligand [18F]DPA-714 in a Rat Model of Focal Cerebral Ischemia. J Cereb Blood Flow Metab. 2010;30:230-41
82. Vivash L, O'Brien TJ. Imaging Microglial Activation with TSPO PET: Lighting Up Neurologic Diseases? J Nucl Med. 2016;57:165-8
83. Lavisse S, Guillermier M, Hérard A-S, Petit F, Delahaye M, Van Camp N. et al. Reactive Astrocytes Overexpress TSPO and Are Detected by TSPO Positron Emission Tomography Imaging. J Neurosci. 2012;32:10809-18
84. Harvey LD, Yin Y, Attarwala IY, Begum G, Deng J, Yan HQ. et al. Administration of DHA Reduces Endoplasmic Reticulum Stress-Associated Inflammation and Alters Microglial or Macrophage Activation in Traumatic Brain Injury. ASN Neuro. 2015;7:1759091415618969
85. Nimmerjahn A, Kirchhoff F, Helmchen F. Resting Microglial Cells Are Highly Dynamic Surveillants of Brain Parenchyma in Vivo. Science. 2005;308:1314-8
86. Tremblay M-È, Lowery RL, Majewska AK. Microglial Interactions with Synapses Are Modulated by Visual Experience. PLoS Biol. 2010;8:e1000527
87. Paolicelli RC, Bolasco G, Pagani F, Maggi L, Scianni M, Panzanelli P. et al. Synaptic Pruning by Microglia Is Necessary for Normal Brain Development. Science. 2011;333:1456-8
88. Kurtys E, Eisel ULM, Verkuyl JM, Broersen LM, Dierckx RAJO, de Vries EFJ. The combination of vitamins and omega-3 fatty acids has an enhanced anti-inflammatory effect on microglia. Neurochem Int. 2016;99:206-14
89. Basil MC, Levy BD. Specialized pro-resolving mediators: endogenous regulators of infection and inflammation. Nat Rev Immunol. 2016;16:51-67
90. Heras-Sandoval D, Pedraza-Chaverri J, Pérez-Rojas JM. Role of docosahexaenoic acid in the modulation of glial cells in Alzheimer's disease. J Neuroinflammation. 2016;13:61
91. Bourourou M, Heurteaux C, Blondeau N. Alpha-linolenic acid given as enteral or parenteral nutritional intervention against sensorimotor and cognitive deficits in a mouse model of ischemic stroke. Neuropharmacology. 2016;108:60-72
92. Boltze J, Lukomska B, Jolkkonen J, consortium M-I. Mesenchymal Stromal Cells in Stroke: Improvement of Motor Recovery or Functional Compensation? J Cereb Blood Flow Metab. 2014;34:1420-1
93. Wang M, Iliff JJ, Liao Y, Chen MJ, Shinseki MS, Venkataraman A. et al. Cognitive deficits and delayed neuronal loss in a mouse model of multiple microinfarcts. J Neurosci. 2012;32:17948-60
Author contact
![]() Corresponding author: Amanda J Kiliaan, Department of Anatomy, Donders Institute for Brain Cognition & Behaviour, Radboud university medical center, Geert Grooteplein noord 21, 6525 EZ Nijmegen, The Netherlands. Phone: +31 24 361 4378; Fax: +31 24 361 3789; Email: Amanda.Kiliaannl
Corresponding author: Amanda J Kiliaan, Department of Anatomy, Donders Institute for Brain Cognition & Behaviour, Radboud university medical center, Geert Grooteplein noord 21, 6525 EZ Nijmegen, The Netherlands. Phone: +31 24 361 4378; Fax: +31 24 361 3789; Email: Amanda.Kiliaannl