Theranostics
13.3
Impact Factor
- Current Issue
- Advance Articles
- Volume 16; 2026
- Volume 15; 2025
- Volume 14; 2024
- Volume 13; 2023
- Volume 12; 2022
- Archive
- Cover Images
- Cover Suggestion
- Special Issues
Top
Introduction
Materials and Methods
Results and Discussion
Conclusions
Abbreviations
Supplementary Material
Acknowledgements
References
Introduction
Materials and Methods
Results and Discussion
Conclusions
Abbreviations
Supplementary Material
Acknowledgements
References
International Journal of Biological Sciences
International Journal of Medical Sciences
 Global reach, higher impact

Theranostics 2017; 7(7):2078-2091. doi:10.7150/thno.19390 This issue Cite
Research Paper
Metabolomics Identifies Metabolic Markers of Maturation in Human Pluripotent Stem Cell-Derived Cardiomyocytes
Vijesh J. Bhute1*, Xiaoping Bao1*, Kaitlin K. Dunn1, Kylie R. Knutson1, Eric C. McCurry1, Gyuhyung Jin1, Wei-Hua Lee2, Sarah Lewis2, Akihiro Ikeda2, Sean P. Palecek1 ![]()
1. Department of Chemical and Biological Engineering, University of Wisconsin-Madison, Madison, WI 53706, USA;
2. Department of Medical Genetics, University of Wisconsin-Madison, Madison, WI 53706, USA.
* These authors contributed equally to this work.
Received 2017-1-29; Accepted 2017-3-22; Published 2017-5-26
Citation:
Bhute VJ, Bao X, Dunn KK, Knutson KR, McCurry EC, Jin G, Lee WH, Lewis S, Ikeda A, Palecek SP. Metabolomics Identifies Metabolic Markers of Maturation in Human Pluripotent Stem Cell-Derived Cardiomyocytes. Theranostics 2017; 7(7):2078-2091. doi:10.7150/thno.19390. https://www.thno.org/v07p2078.htm
Other stylesAbstract

Cardiovascular disease is a leading cause of death worldwide. Human pluripotent stem cell-derived cardiomyocytes (hPSC-CMs) hold immense clinical potential and recent studies have enabled generation of virtually pure hPSC-CMs with high efficiency in chemically defined and xeno-free conditions. Despite these advances, hPSC-CMs exhibit an immature phenotype and are arrhythmogenic in vivo, necessitating development of strategies to mature these cells. hPSC-CMs undergo significant metabolic alterations during differentiation and maturation. A detailed analysis of the metabolic changes accompanying maturation of hPSC-CMs may prove useful in identifying new strategies to expedite hPSC-CM maturation and also may provide biomarkers for testing or validating hPSC-CM maturation. In this study we identified global metabolic changes which take place during long-term culture and maturation of hPSC-CMs derived from three different hPSC lines. We have identified several metabolic pathways, including phospholipid metabolism and pantothenate and Coenzyme A metabolism, which showed significant enrichment upon maturation in addition to fatty acid oxidation and metabolism. We also identified increases in glycerophosphocholine and the glycerophosphocholine:phosphocholine ratio as potential metabolic biomarkers of maturation. These biomarkers were also affected in a similar manner during murine heart development in vivo. These results support that hPSC-CM maturation is associated with extensive metabolic changes in metabolic network utilization and understanding the roles of these metabolic changes has the potential to develop novel approaches to monitor and expedite hPSC-CM maturation.
Keywords: Human Pluripotent Stem Cells, Cardiomyocytes, Maturation, Metabolomics, Biomarkers.
Introduction
The ability of human pluripotent stem cells (hPSCs) to self-renew indefinitely and differentiate to different cell types in the body makes them a valuable source of cells for therapeutic applications and in vitro human tissue models for drug discovery [1]. Our group has recently reported protocols for directed differentiation of hPSCs to functional beating cardiomyocytes (CMs) with high efficiency (>95%) in xeno-free conditions [2-4]. hPSC-derived CMs (hPSC-CMs) can be enriched by culture in glucose-depleted and lactate-rich culture medium [5] to generate virtually pure populations of beating CMs. Despite these advances, the applications of hPSC-derived CMs (hPSC-CMs) in disease modeling and clinical applications is limited by relatively immature structural and functional properties of the differentiated hPSC-CMs [6, 7]. Lundy et al. [8] and Kamakura et al. [9] have shown that long-term culture (90-180 days) of hPSC-CMs in vitro induces significant differences from those cultured for shorter time (20-40 days) and importantly, these older hPSC-CMs exhibit adult-like CM properties, including an increase in cell size and aniosotropy, organized sarcomere structure with higher myofibrillar density and alignment, and slower contraction kinetics as compared to younger hPSC-CMs. This long-term culture of hPSC-CMs improves cell quality but extends the cell production pipeline, complicating utilization of these cells in industrial and clinical applications [6, 7]. Identifying and monitoring the differences between immature and mature CMs is a crucial step to developing strategies to expedite the maturation process of hPSC-CMs [7].
One challenge in developing processes to mature hPSC-CMs is that there is no single physiological property or parameter which has been established as a benchmark or biomarker for maturation. One of the key differences between adult CMs and fetal CMs is the utilization of fatty acids for energy generation in mature CMs [10]. CM maturation is accompanied by changes in several transcriptional regulators including hypoxia inducing factor-1α (HIF-1α), peroxisome proliferator-activated receptor (PPAR) gamma coactivator 1-alpha (PGC-1α)/PPARα, and PGC-1α/PPARδ, which leads to global changes in expression of several proteins involved in energy metabolism including glycolysis and fatty acid oxidation [10, 11].
In this study, we identified time-dependent metabolic changes in hPSC-CMs differentiated from three different human embryonic and induced pluripotent stem cell lines. 3 month (3m) hPSC-CMs showed significant morphological, molecular, and metabolic maturation as compared to 1 month (1m) hPSC-CMs. Global metabolic profiling revealed substantial time-dependent metabolic changes associated with long-term culture and maturation. We identified several metabolic pathways, including the glycerol phosphate shuttle, pantothenate and Coenzyme A (CoA) biosynthesis, and sphingolipid metabolism in addition to beta oxidation of fatty acids, to be enriched in 3m hPSC-CMs compared to 1m hPSC-CMs. Biomarker analysis revealed several metabolites with the potential to distinguish between 1m and 3m hPSC-CMs. Of particular interest were glycerophosphocholine (GPC) and GPC to O-phosphocholine (PC) ratio, both of which increased in 3m hPSC-CMs as compared to 1m hPSC-CMs and day 6 cardiac progenitors. These changes in GPC and GPC:PC were also observed during murine heart development in vivo. Overall this study provides insights into specific metabolic alterations during time-dependent maturation of hPSC-CMs which can be used to test and validate strategies to expedite the maturation of hPSC-CMs. This study also highlights the significance of metabolic profiling in identifying novel pathways which may be involved in inducing or maintaining hPSC-CM maturation.
Materials and Methods
Cell culture
hPSCs were maintained in mTeSR1 medium (STEMCELL Technologies) on Matrigel- (BD Biosciences) coated plates according to previously published methods [2-4]. Cardiac differentiation was performed following the protocol described by Lian et al. [4]. hPSC-CMs were maintained in RPMI (Life Technologies) supplemented with B-27 supplement (Life Technologies). B-27 supplement without insulin (Life Technologies) was used from day 0 to day 6 of differentiation. CHIR99021 (Selleckchem) and IWP2 (Tocris) were added at day 0 and day 3, respectively, according to the protocol.
Mouse maintenance and heart isolation
All experiments were performed in accordance with the National Institute of Health (NIH) Guide for the Care and Use of Laboratory Animals and were approved by the Animal Care and Use Committee at the University of Wisconsin-Madison. 20 days old and 3 month old C57BL/6J wild-type mice were euthanized using CO2 chamber. Hearts were quickly removed and rinsed in ice-cold phosphate-buffered saline (PBS). The hearts were then snap frozen in liquid nitrogen, and stored at -80 oC. The atria were later removed from 3 month old mouse heart before sample metabolite extraction using chloroform, methanol, and water extraction method.
Immunostaining
hPSC-CMs were re-plated at different time points on a 24-well Matrigel-coated plate and immunostaining was performed using the same reagents and antibodies used by Lian et al. [2, 4] (Supplementary Table 1). Single cell imaging was performed on an epifluorescence microscope (DM IRB; Leica) with a QImaging® Retiga 4000R camera.
Flow Cytometry
Cells were singularized with Accutase (Life Technologies) for 10-20 mins and then fixed with 1% paraformaldehyde for 20 min at room temperature and stained with primary and secondary antibodies (Supplementary Table 1) in phosphate buffered saline (PBS) (Life Technologies) plus 0.1% Triton X-100 and 0.5% bovine serum albumin (BSA) (AlbuMAX II). Data were collected on a FACSCaliber flow cytometer (Beckton Dickinson) and analyzed using FlowJo [12].
Mitochondrial respiration assay
The Seahorse XF96 extracellular flux analyzer was used to study oxygen consumption rate (OCR) and assess mitochondrial function. The protocol was similar to that described by Kuppusamy et al. [13] with minor modifications. The plates were pre-treated with 0.1% gelatin. Both 1m and 3m hPSC-CMs were seeded onto the plates at a density of 30,000 cells per XF96 well (2,500/mm2). The Seahorse assays were performed 3 days after the seeding onto the XF96 well plate. One hour before the assay, culture media were exchanged for base media (unbuffered DMEM (Seahorse XF Assay Media) supplemented with 1 mM sodium pyruvate (Life Technologies) and with 25 mM glucose (for MitoStress assay)). 15 min prior to starting the assay, we added etomoxir (ETO) (final concentration 50 µM) or DMSO (stock solution prepared in Seahorse XF assay media) to the wells. Substrates and inhibitors were injected during the measurements to achieve final concentrations of 4-(trifluoromethoxy) phenylhydrazone at 1 μM (FCCP; Seahorse Biosciences), oligomycin (2.5 μM), antimycin (2.5 μM) and rotenone (2.5 μM) for the MitoStress assay. Maximal OCR is defined as the change in OCR in response to FCCP compared to OCR after the addition of oligomycin. The reagents were from Sigma, unless otherwise indicated.
NMR sample preparation
For in vitro hPSC-CMs, sample collection was performed as described in our previous studies [14, 15]. Briefly, the cells in 1 well from a 12 well plate (~1-2 million) were washed twice with ice-cold PBS (pH 7.4) and then the cells were quenched using 3 ml methanol as it gives better extraction efficiency and provides more rapid quenching as compared to other methods [16]. The cells were then detached using a cell scraper and pipetted into a 50 ml centrifuge tube. A dual phase extraction procedure adopted from Martineau et al. [17] was used to extract the intracellular metabolites. Briefly, the quenched cells were suspended in a mixture of chloroform, methanol and water in the ratio of 6:6:5.4 to achieve a final volume of 17.4 ml. After centrifugation for 15 min at 3600 rpm, only the upper aqueous layer was used for further analysis and the organic phase was discarded. Metabolites from mouse heart tissue were extracted using the chloroform water methanol protocol for simultaneous extraction of polar and non-polar metabolites described by Beckonert et al. [18]. Only the aqueous phase was collected and used for further analysis. The aqueous phases from samples were dried at 30 °C using a centrifugal vacuum concentrator and stored at -80 °C until NMR analysis. Prior to NMR analysis, the samples were reconstituted in 0.6 ml of 0.1 M phosphate buffered D2O (pH = 7.0) solution containing 0.5 mM 3-trimethylsilyl-propionate-2, 2, 3, 3,-d4 (TMSP, δ = 0.0 ppm) as an internal standard and 0.2% w/v sodium azide. The samples were centrifuged at 18,000 g for 10 min and 550 μl of the supernatant was transferred to 5 mm NMR tubes (Norell Inc.).
NMR Acquisition
1H NMR spectra were recorded at 298 K on a Bruker Avance III equipped with a 5 mm cryogenic probe operating at 500 MHz (11.74 T). 1D spectra were acquired using standard NOESYPR1D pulse sequence (RD-90°-t1-90°-tm-90°-acquire) with a relaxation delay of 1 s, a mixing time of 100 ms and a pre-scan delay of 30 μs. Each spectrum consisted of 128 transients or free induction decays (FIDs) collected into 48 k complex data points with a spectral width of 12 ppm and an acquisition time of 4 s. Prior to Fourier transformation, the FIDs were zero-filled to 128 k data points and multiplied by an exponential window function (Line broadening factor (LB) = 0.5 Hz). The chemical shifts were referenced to the TMSP peak (δ = 0 ppm), using TopSpinTM software (version 3.1, Bruker).
Data Processing and Statistical Analysis
Spectra were exported to an ACD/1D NMR Processor (Advanced Chemistry Development) for phasing, baseline correction, and solvent region removal (water: 4.7-5.1 ppm and DMSO: 2.72-2.75 ppm). The peaks were annotated through the HMDB [19] and Metabohunter [20] and targeted profiling [21] was accomplished using ChenomX NMR Suite Profiler (version 7.7, ChenomX Inc.). The concentrations were referenced to a TMSP concentration of 0.5 mM. Over 95% of the peaks were assigned to metabolites available in the ChenomX library and the quantified metabolite concentrations were exported to an Excel file (Microsoft). First, the metabolites with low confidence in fitting with confounding peaks due to high overlap or very low abundance were excluded from the analysis. These included glucose, tryptophan, guanidoacetate, beta-alanine, and malate. The concentration data matrix was further normalized by the total concentration of metabolites in each sample to evaluate the metabolite fractions and also to account for the differences in efficiencies of extraction [14, 15, 22]. The concentration data table was processed for statistical analysis using MetaboAnalyst [23, 24] and GENE-E [25]. Hierarchical clustering was performed on auto-scaled concentration data (mean centering followed by dividing by the standard deviation) and two way analysis of variance (ANOVA) was used to identify significantly altered metabolites (p < 0.05). Pathway enrichment analysis was performed in MetaboAnalyst's pathway analysis module. Pathways with a false discovery rate (FDR) < 0.1 and p < 0.05 were considered to be significantly enriched. Univariate biomarker analysis was performed using MetaboAnalyst's biomarker analysis module. Metabolite-metabolite correlation analysis (MMCA) was performed on Pearson correlation data extracted from correlation analysis module in MetaboAnalyst using either 1m hPSC-CMs or 3m hPSC-CMs alone and the network visualization was performed using Metscape [26] plugin in Cytoscape [27]. Correlation coefficients corresponding to p < 0.01 were considered to be significant. The NMR spectral files and processed JCAMP files are available on the MetaboLights database (study ID: MTBLS425) [28]. Raw input data for the analysis and output from each analysis module is provided in Supplementary Table 1. Student's t-test was used for comparisons between two groups while one way ANOVA with Tukey's honest significant difference (HSD) test as post hoc method was used for multiple comparisons, unless otherwise indicated.
Results and Discussion
Extended culture of hPSC-CMs results in matured phenotypes
The goal of this study was to identify metabolic pathways and metabolic biomarkers representative of maturation of hPSC-CMs. We first validated that extended culture of hPSC-CMs in vitro resulted in structural and phenotypic maturation, as reported in the literature [8, 9]. H9 human embryonic stem cells were differentiated to cardiomyocytes via the GiWi directed differentiation protocol [2-4] and maintained in culture in RPMI supplemented with B27 on Matrigel-coated plates for 1 month (1m) or 3 months (3m) starting from initiation of differentiation. We selected these time points to mimic the early hPSC-CMs (day 30) which possess embryonic-like electrophysiology and late hPSC-CMs (day 90) which show more adult-like electrophysiology [8, 9]. We performed immunostaining of cytoskeletal structures to study the differences in sarcomere organization and morphology of CMs (Fig. 1). We observed distinct differences in morphology and aspect ratio of 3m hPSC-CMs as compared to 1m hPSC-CMs (Fig. 1A-D). Myofibrils were more aligned in 3m hPSC-CMs as compared to 1m hPSC-CMs based on immunostaining for α-actinin, F-actin and cTnT (Fig. 1A). 3m hPSC-CMs also possessed a significantly larger perimeter (p<1E-9), area (p<1E-6), and significantly lower circularity (p<1E-6) compared to 1m hPSC-CMs (Fig. 1B-D). In addition, 3m hPSC-CMs were less proliferative than 1m hPSC-CMs, assessed by Ki-67 staining (Fig. 1E-F). This observed structural maturation and decrease in proliferative capacity is consistent with maturation during extended culture reported in other studies [8, 9].
One of the key differences between immature and mature CMs is that the metabolism in mature and adult CMs primarily utilizes fatty acid oxidation while immature and neonatal CMs use glucose and the citric acid cycle as their primary source of energy generation [6]. We performed a Seahorse Assay to quantify the oxygen consumption rate (OCR) in the presence and absence of ETO, an irreversible inhibitor of carnitine palmitoyltransferase-1 (CPT-1) which blocks the transport of fatty acyl chains from the cytoplasm to the mitochondrial intermembrane space, thereby blocking fatty acid oxidation. We observed significantly reduced basal OCR due to ETO treatment exclusively in 3m hPSC-CMs, highlighting that these cells utilize endogenous fatty acid oxidation as a fuel to fulfill their energy requirements (Fig. 1G). Additionally, the maximal mitochondrial respiration rate in the absence of ETO was two-fold higher in 3m hPSC-CMs than in 1m hPSC-CMs (Fig. 1H). Increased maximal respiration rate could be attributed to increased efficiency of energy generation or increased mitochondrial copy number [13]. Mitochondrial copy number was similar in 1m hPSC-CMs and 3m hPSC-CMs assessed by RT-PCR and quantitative RT-PCR (Supplementary Fig. S1). These results demonstrate that 3m hPSC-CMs use endogenous fatty acids as a fuel to fulfill their energy requirements, consistent of metabolic maturation of CMs [7].
Ventricular maturation was tested by staining for myosin light chain atrial (MLC2a) and ventricular (MLC2v) expression (Fig. 2). We observed a greater proportion of cells expressing MLC2v (p<0.05) and fewer cells expressing MLC2a (p<0.05) in 3m hPSC-CMs as compared to 1m hPSC-CMs. Thus, the increased MLC2v/MLC2a in 3m hPSC-CMs is consistent with maturation of ventricular CMs [9] (Fig. 2). Based on these data, we conclude that 3m hPSC-CMs show significant morphological, molecular, and metabolic maturation as compared to 1m hPSC-CMs.
Figure 1
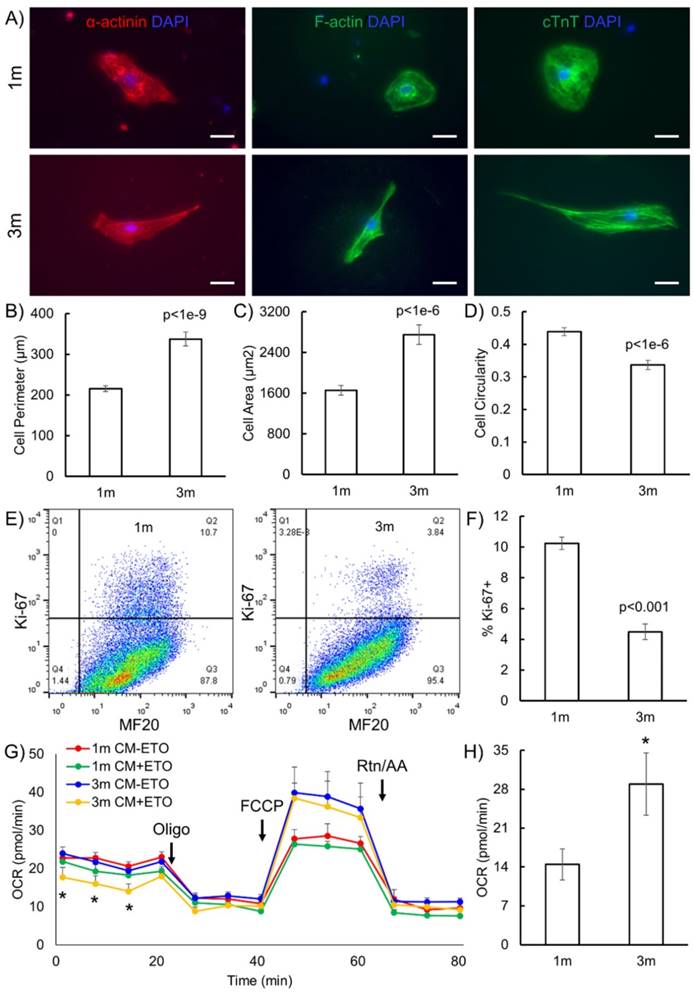
Long term culture of hPSC-CMs induces morphological and metabolic maturation. (A) H9 hESCs were differentiated to CMs and maintained in RPMI supplemented with B27 for 1 month (1m) or 3 months (3m). Single cells were replated on Matrigel-coated 12 well plates and maintained in the same medium for 3 days prior to immunofluorescent staining for α-actinin, F-actin and cTnT. Representative images are shown. Scale bars, 25 µm. Cell morphological parameters including (B) cell perimeter (µm), (C) cell area (µm2), and (D) cell circularity which was defined as 4*π*Area/(Perimeter)2 was calculated using immunostaining images and ImageJ software (N=112 from two independent replicates). (E) Cells were analyzed for Ki-67 and MF20 at indicated time points using flow cytometry and (F) quantification of flow cytometry data using three biological replicates. (G) OCR profiles of hPSC-CMs either pretreated with ETO or DMSO (control) in response to oligomycin, FCCP, and rotenone and antimycin (Rtn/AA) using the Seahorse flux analyzer (*p<0.05 between 3m CM-ETO and 3m CM+ETO). (H) Maximal respiration rate defined as the difference between the OCR after addition of FCCP and OCR after addition of oligomycin to 1m and 3m hPSC-CMs (*p<0.05). Data represent mean +/- S.E.M. from at least three biological replicates.
Figure 2
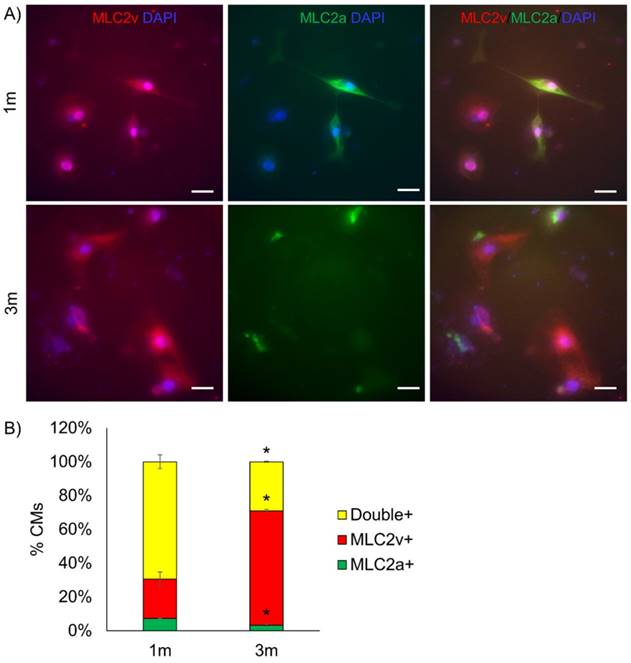
Long term culture of hPSC-CMs induces ventricular maturation. (A) Representative immunostaining for MLC2v and MLC2a in 1m and 3m hPSC-CMs (Scale bars, 25 µm). (B) Quantification of percentage of cells expressing MLC2v, MLC2a or double positive for MLC2v and MLC2a assessed by examination of immunostaining images. Data were collected from two replicates for 1m and 3m hPSC-CMs, with N>120 in each sample. *p<0.05 comparing 1m and 3m hPSC-CMs.
Long-term culture of hPSC-CMs induces significant changes in metabolite concentrations
To identify the specific metabolic changes in hPSC-CMs due to long-term culture in vitro, we performed NMR-based quantitative and targeted metabolic profiling [21] on intracellular metabolites of day 6 cardiac progenitors, day 30 immature hPSC-CMs, and day 90 mature hPSC-CMs. Human induced pluripotent stem cells (19-9-7) and human embryonic stem cells (H9 and ES03) were differentiated to cardiomyocytes using the GiWi directed differentiation protocol and maintained in culture for 1m or 3m from initiation of differentiation. We used three parent hPSC lines to identify global and stem cell line-independent metabolic changes due to maturation induced by long-term culture of hPSC-CMs. Fig. 3A shows the heatmap of all metabolites detected and clustering was performed using Pearson's distance measure and Ward's linkage criteria. We observed that day 6 cardiac progenitors derived from different parent stem cell lines clustered together and separated from 1m and 3m hPSC-CMs, which also formed distinct clusters. Day 6 cardiac progenitor cells are mainly non-contracting Isl1+Nkx2.5+ cells and can form different cell types in the heart, including CMs [2-4] and epicardial cells [29, 30], upon addition of relevant signals. We performed partial least squares-discriminant analysis (PLS-DA), a supervised clustering and data reduction method, to identify the similarities and differences between the samples (Fig. 3B). We observed that time-dependent metabolic differences were dominant and captured along the first component (x-axis) while the parent stem cell line-specific differences were relatively minor, suggesting that majority of the metabolic changes are independent of parent stem cell line (Fig. 3B). An evaluation of prediction accuracy and cross-validation was performed to test the significance of the PLS-DA model (Supplementary Fig. S2). The metabolites which had highest importance in the first component (time-dependent) as calculated by variable importance in projection (VIP score) in the PLS-DA model are shown in Fig. 3C. The top metabolites, which had a VIP score greater than 1.6, were sn-glycero-3-phosphocholine (GPC), O-phosphocholine (PC), fumarate, carnitine and pantothenate.
Figure 3
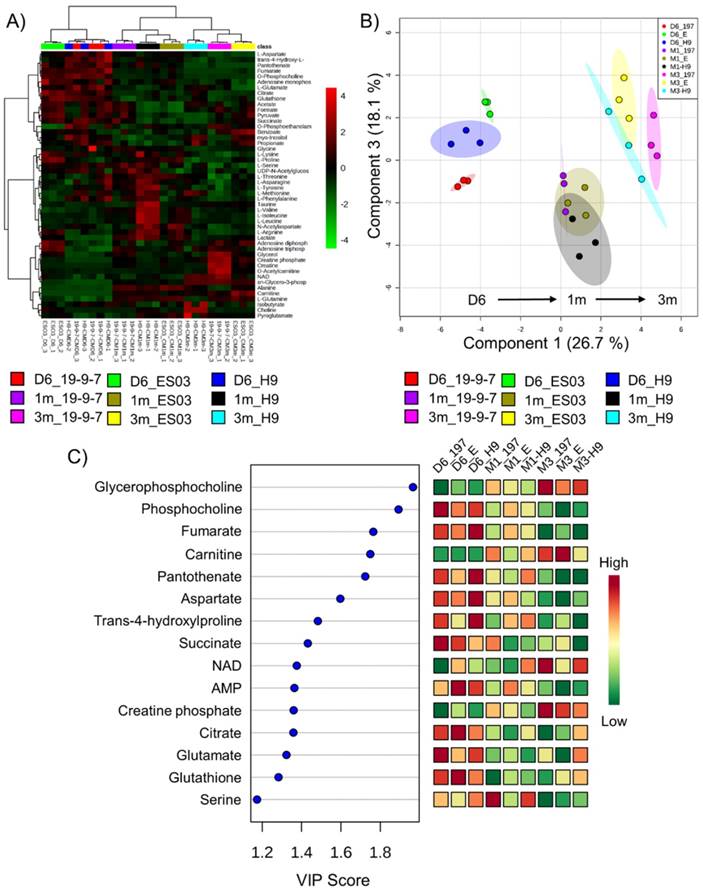
Metabolomics reveal global time-dependent metabolic changes in hPSC-CMs. Three different parent hPSC lines (H9, ES03, 19-9-7) differentiated to either day 6 (D6) cardiac progenitors or to CMs and maintained in culture for 1 month (1m) and 3 months (3m). NMR analysis was performed on cell lysates and concentration data were auto-scaled prior to analysis. (A) Hierarchical clustering was performed using Pearson distance measure and Ward's linkage. (B) PLS-DA scores plot showing the two components accounting for highest variance on x and y axes. Each data point on the plot represents a unique biological sample and ellipses represent 95% confidence intervals. (C) Variable importance in projection (VIP) scores for top 15 metabolites along the first component which account for culture time-dependent metabolic changes. Colors represent average concentrations from three biological replicates.
We next performed two-way ANOVA to identify statistically significant metabolic changes due to two factors: a) time in culture and b) parent stem cell line and we observed that while there were some metabolites whose concentrations differed with parent stem cell line, the majority of the significant changes were associated with time in culture (Table 1). Since the focus of this study is to determine the global metabolic changes associated with maturation due to long term culture, we focus on these time-dependent metabolic changes that were conserved in all three hPSC lines studied.
Long term culture of hPSC-CMs led to significant changes in metabolic pathways
The steady-state metabolite concentration changes can be useful in identifying potential metabolic pathways which are altered or enriched in CMs after extended culture. We performed MMCA to support that maturation leads to significant metabolic changes and to compare the underlying physiological metabolic states in 1m and 3m hPSC-CMs. MMCA allows us to identify the homeostatic variations which maintain the metabolism in steady-state and can provide information about the physiological state of the system [31-33]. We applied MMCA in 1m and 3m hPSC-CMs individually to study the correlation networks at these time points (Fig. 4). We set the threshold of absolute Pearson correlation coefficient to 0.8 (p<0.01). In 1m hPSC-CMs, we observed two clusters connected by GPC, N-acetylaspartate and threonine (Fig. 4A). The first cluster (left) contained amino acids and their derivatives, pantothenate (Vit. B5), and lactate. The second cluster (right) consisted of several metabolites related to pyruvate metabolism including pyruvate, acetate, formate, succinate, and fumarate. In 3m hPSC-CMs, we observed three separate correlation networks (Fig. 4B) with significant differences in correlation network topology as compared to 1m hPSC-CMs. While 1m hPSC-CMs showed significant and high correlations between most of the essential and non-essential amino acids and their derivatives, 3m hPSC-CMs showed a weaker correlation and amino acids no longer exhibited a high correlation with each other. We also observed increased connectivity for phospholipid metabolism related metabolites including choline, O-acetylcarnitine (ALCAR), O-phosphoethanolamine (PE), glycerol, and GPC in the MMCA network for 3m hPSC-CMs. While we observed several differences in overall correlation networks between 1m and 3m hPSC-CMs, some correlations were conserved including those between the branched chain amino acids valine, leucine and isoleucine. The top 20 metabolites whose Pearson correlation coefficients exhibited changes in 1m hPSC-CMs vs. 3m hPSC-CMs are shown in Table 2. These significant changes in correlations between metabolites in hPSC-CMs after 1m and 3m further highlight that extended culture induces significant changes in metabolic homeostasis. We identified several correlation subnetworks which were altered significantly, including those between amino acids and central metabolism-related metabolites including pyruvate, acetate, and formate. Since these correlation networks capture the potential changes in relationships between metabolites and underlying metabolic pathways [31-33], this could imply that metabolic pathways involving pyruvate and glucose metabolism, whose metabolites showed high correlations in 1m hPSC-CMs, were significantly altered after long term culture in 3m hPSC-CMs. Additionally, a subnetwork related to phospholipid metabolism was observed in 3m hPSC-CMs which suggests increased relevance of this metabolic pathway in mature CMs.
We next identified the metabolic pathways enriched in both 1m and 3m hPSC-CMs as compared to day 6 cardiac progenitors. We performed comparative differential enrichment analysis to identify those pathways which were significantly enriched in either 1m or 3m hPSC-CMs (Fig. 5, Supplementary Table 1). We observed significant enrichment (FDR<0.1 and p<0.05) in beta oxidation of branched and very long chain fatty acids exclusively in 3m hPSC-CMs relative to day 6 progenitors and not in 1m hPSC-CMs relative to day 6 progenitors. We also observed that the enrichment score in 3m hPSC-CMs relative to day 6 progenitors for pyruvate metabolism and alanine metabolism was lower as compared to the enrichment score in 1m hPSC-CMs relative to day 6 progenitors. Increased expression in genes and proteins involved in fatty acid metabolism and reduced expression of components of glucose metabolism have been associated with maturation [6, 7], and here we show that these pathways are also significantly affected at the level of metabolites. In addition, we also identified metabolic pathways which have not previously been associated with CM maturation that showed significant enrichment in 3m hPSC-CMs, including taurine metabolism, glycerol phosphate shuttle, nicotinate and nicotinamide metabolism, biotin metabolism, lysine degradation, pantothenate and CoA biosynthesis, beta-alanine metabolism, and sphingolipid metabolism. Some of these enriched pathways were related to cofactor metabolism, including pantothenate and CoA biosynthesis, biotin metabolism, and beta-alanine metabolism, further highlighting significant changes in metabolic utilization and demand as hPSC-CMs age in culture. Another group of pathways, which includes glycerol phosphate shuttle and sphingolipid metabolism, are associated with cell membrane and phospholipid synthesis and were exclusively enriched in 3m hPSC-CMs compared to day 6 progenitors and not in 1m hPSC-CMs relative to day 6 progenitors. These data demonstrate that long term culture of hPSC-CMs led to significant changes in metabolic pathways. The implications of the enrichment in the aforementioned metabolic pathways during maturation and their potential significance for accelerating maturation should be investigated in future mechanistic studies.
Long-term culture of hPSC-CMs is associated with a switch from phosphocholine to glycerophosphocholine
We next identified potential global biomarkers of hPSC-CM maturation by performing univariate biomarker analysis. The metabolites which successfully discriminated between 1m hPSC-CMs and 3m hPSC-CMs in all cell lines tested were GPC, PC, GPC:PC ratio, pantothenate (Vit. B5), alanine, and glycine (Fig. 6A). We identified GPC and PC to be significantly increased and reduced, respectively, in 3m hPSC-CMs as compared to 1m hPSC-CMs. In addition to GPC and PC, we observed a significantly lower abundance of pantothenate (Vit. B5), alanine, glycine and arginine in 3m hPSC-CMs as compared to 1m hPSC-CMs. The complete results from univariate biomarker analysis can be found in Supplementary Table 1.
Table 1
Results from two-way ANOVA using time and parent stem cell lines (parentSC) as factors.
| Metabolite | p-value (Time) | p-value (ParentSC) | p-value (Interaction) |
|---|---|---|---|
| sn-Glycero-3-phosphocholine | 1.24E-18 | N.S. | 2.23E-05 |
| Alanine | 1.13E-13 | 0.001639 | 0.000294 |
| O-Phosphocholine | 6.21E-12 | N.S. | N.S. |
| O-Acetylcarnitine | 1.60E-11 | 1.34E-09 | 7.14E-12 |
| Carnitine | 1.70E-11 | N.S. | 1.82E-05 |
| Creatine phosphate | 1.27E-10 | 4.28E-05 | 2.06E-05 |
| L-Glutamine | 2.22E-10 | 4.93E-06 | 0.025075 |
| Creatine | 6.09E-10 | 1.10E-08 | 4.30E-09 |
| Choline | 2.32E-09 | 2.52E-12 | 2.24E-13 |
| L-Glutamate | 1.06E-07 | 0.000387 | 0.000133 |
| Citrate | 1.93E-07 | N.S. | N.S. |
| Fumarate | 2.70E-07 | N.S. | N.S. |
| Taurine | 1.19E-06 | 1.09E-06 | 7.23E-10 |
| NAD | 2.41E-06 | N.S. | 0.002093 |
| Lactate | 4.55E-06 | N.S. | N.S. |
| L-Proline | 1.33E-05 | 3.46E-07 | 0.013639 |
| L-Arginine | 1.91E-05 | 0.044202 | 0.024153 |
| trans-4-Hydroxy-L-proline | 2.38E-05 | N.S. | 0.022452 |
| Pantothenate | 2.56E-05 | N.S. | N.S. |
| Glutathione | 4.63E-05 | N.S. | N.S. |
| L-Valine | 5.55E-05 | 0.008681 | N.S. |
| L-Aspartate | 8.94E-05 | N.S. | N.S. |
| Glycerol | 0.000158 | 4.23E-05 | 1.33E-05 |
| L-Leucine | 0.000174 | 0.002168 | 0.0118 |
| L-Isoleucine | 0.000202 | 0.010608 | 0.012144 |
| myo-Inositol | 0.000887 | 0.022576 | N.S. |
| Succinate | 0.001751 | N.S. | N.S. |
| N-Acetylaspartate | 0.002637 | N.S. | N.S. |
| L-Serine | 0.006592 | N.S. | N.S. |
| Adenosine monophosphate | 0.007973 | N.S. | N.S. |
| Propionate | 0.010346 | N.S. | N.S. |
| L-Tyrosine | 0.011349 | N.S. | N.S. |
| Acetate | 0.018459 | N.S. | N.S. |
| L-Threonine | 0.021882 | N.S. | N.S. |
| L-Phenylalanine | N.S. | 0.001309 | N.S. |
| L-Methionine | N.S. | 0.000531 | N.S. |
| Adenosine diphosphate | N.S. | 0.001212 | N.S. |
| O-Phosphoethanolamine | N.S. | 0.046637 | 0.00039 |
| Adenosine triphosphate | N.S. | 0.048389 | 0.00613 |
Time factor contained samples from day 6 progenitors, 1m hPSC-CMs and 3m hPSC-CMs organized in three groups representing time. For parentSC factor, the samples were delineated by three distinct hPSC lines. The two-factor analysis module in MetaboAnalyst was used to calculate the significance scores from two-way ANOVA (p-values) shown in the table. N.S.: not significant (p>0.05).
Figure 4
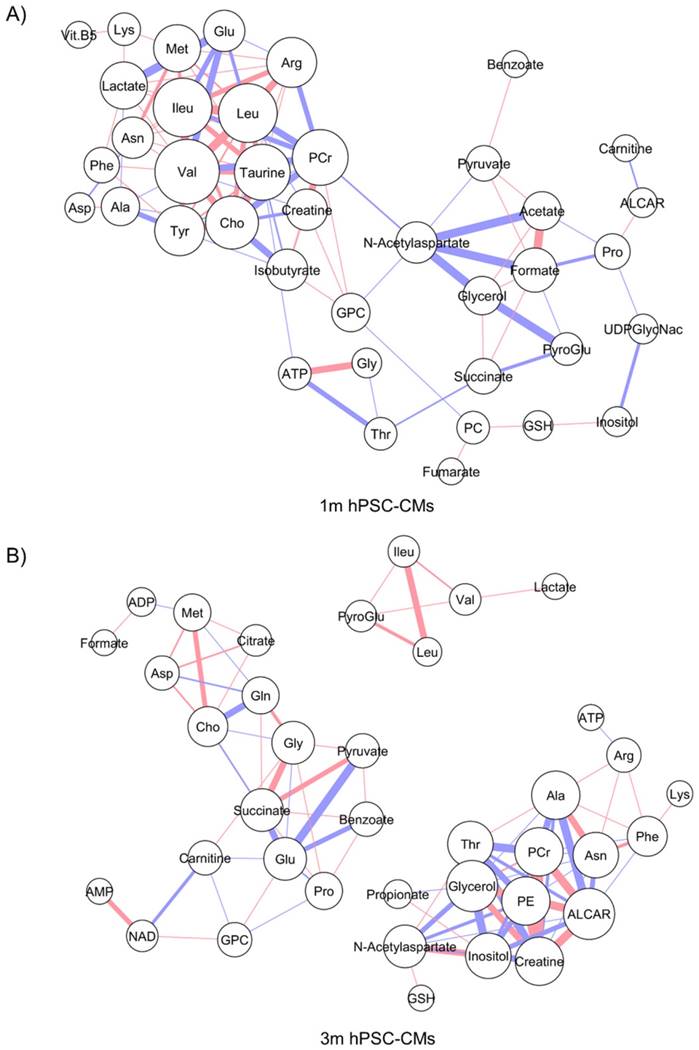
Metabolite-metabolite correlation analysis (MMCA) highlights differences in metabolic physiological states in 1m and 3m hPSC-CMs. The metabolic concentrations from (A) 1m and (B) 3m hPSC-CMs were used to evaluate pairwise Pearson correlation coefficients. The correlation table was imported in Cytoscape and Metscape plugin and the cut-off was set to 0.8 (p<0.01). Organic layout was used for plotting the network. The thickness of the edges is proportional to the magnitude of correlation coefficient and the color represents positive (red) or negative (blue) correlation coefficient. The size of the nodes is proportional to the degree of each node.
Table 2
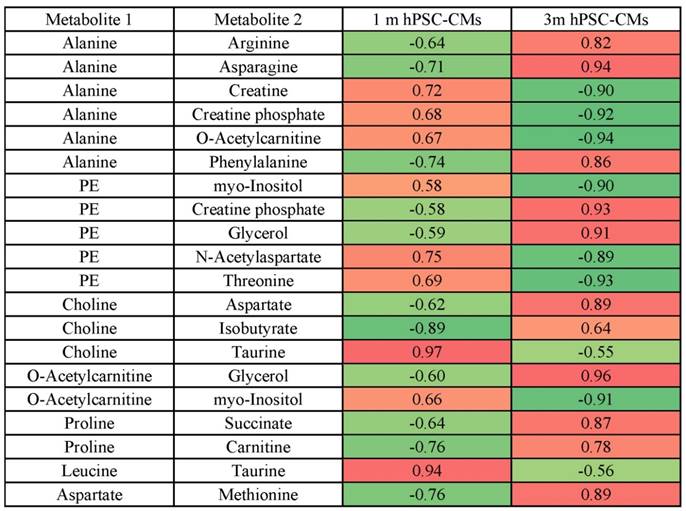
Top 20 highest changes in metabolite-metabolite Pearson correlation coefficients in 1m hPSC-CMs vs. 3m hPSC-CMs.
The color indicates positive (red) or negative (green) Pearson correlation coefficient between metabolite 1 and metabolite 2. Data represent 9 independent experiments. Abbreviations: PE: O-phosphoethanolamine.
Since CoA synthesis is the primary mode of metabolism of pantothenate [34], we hypothesize that a significant reduction in pantothenate in 3m hPSC-CMs could indicate an increase in CoA demand and utilization in aged hPSC-CMs. Increased fatty acid oxidation in 3m hPSC-CMs may cause increased CoA utilization and therefore, a reduction in pantothenate could potentially serve as a biomarker for fatty acid oxidation.
GPC and PC showed a time-dependent switch in abundance and the ratio of GPC to PC increased significantly with time in the hPSC-CMs (Fig. 6A and Supplementary Fig. S3A-C). GPC and GPC:PC were also significantly increased in samples of heart tissue from mice at two different developmental stages (day 20 and 3m old mice) as shown in Fig. 6B and Supplementary Fig. S3D. Other putative metabolic biomarkers identified in hPSC-CMs in vitro (PC, pantothenate, alanine, and glycine) did not exhibit significant difference in heart tissues from mice at different stages of development (Fig. 6B). This may result from the differences in medium/extracellular nutrient conditions in vivo and in vitro. For example, alanine, glycine, and pantothenate are present in the cell culture medium and therefore, differences in extracellular concentrations in these metabolites could potentially lead to differences in intracellular concentrations.
GPC and PC are both involved in phospholipid metabolism where PC is the precursor and GPC is the degradation product of phospholipids. Based on our enrichment analysis and MMCA, we demonstrated that glycerol phosphate shuttle and sphingolipid metabolism were significantly enriched in 3m hPSC-CMs. The implication of this increase in GPC and ratio of GPC:PC is currently not known but a reduction in GPC:PC has been observed in several cancers including breast cancer, prostate cancer and ovarian cancer [35-37]. A reduced GPC:PC ratio was also found to be strongly correlated with growth rate in estrogen-sensitive mammary tumors in rats [38]. Glunde et al. [39] showed that this switch was associated with an increase in choline kinase and phospholipase C activity in cancer cells. Choline kinase has been linked with the cell cycle [40] and since phospholipid synthesis is a key step during mitosis, GPC/PC ratio could be associated with proliferation in cancer cells. Whether these finding hold any relevance in cardiomyocytes is currently not known. Nonetheless, GPC, and GPC:PC can serve as biomarkers of maturation of CMs.
Figure 5
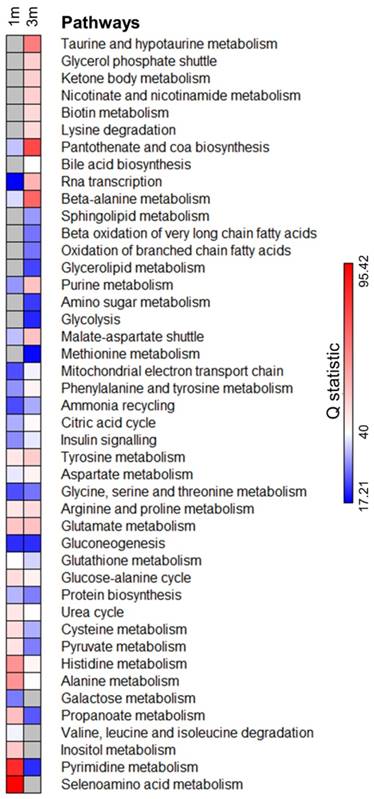
Pathway enrichment analysis identifies significantly enriched metabolic pathways upon extended hPSC-CM culture. Metabolite concentrations from 1m and 3m hPSC-CMs were compared with day 6 cardiac progenitors and the pathways significantly (FDR<0.1 and p<0.05) enriched in either 1m or 3m hPSC-CMs were included in the analysis. Grey color represents pathways which were not significantly enriched (FDR>0.1 or p>0.05). Q statistic was used to evaluate the level of enrichment.
Conclusions
In summary, we have validated that long term culture of hPSC-CMs to 3m can induce significant morphological, molecular and metabolic maturation as compared to 1m hPSC-CMs. We identified culture time-dependent and parent hPSC line-independent metabolic changes by studying metabolism in day 6 cardiac progenitors, 1m hPSC-CMs, and 3m hPSC-CMs. Moreover, the metabolic changes between 1m and 3m hPSC-CMs also led to significant changes in physiological metabolic states of hPSC-CMs. We identified several metabolic pathways which were differentially enriched in hPSC-CMs, some of which were known to be affected due to maturation while others including cofactor metabolism and phospholipid metabolism are described for the first time. Biomarker analysis revealed several potential metabolic biomarkers of hPSC-CM maturation, including GPC and GPC:PC ratio which successfully distinguished between 1m hPSC-CMs and 3m hPSC-CMs with high accuracy. The time-dependent changes in GPC and GPC:PC ratio were also observed in murine heart tissues at different developmental stages. Results from this study highlight changes in several metabolic pathways which may play a critical role in inducing or maintaining maturation. The biomarkers associated with maturation identified in this study can be used to test different strategies which hold potential for expediting the maturation process. Future studies will focus on investigating the relevance of differentially enriched metabolic pathways in maturation process and developing novel strategies to expedite the maturation process.
Abbreviations
hPSC: human pluripotent stem cell; CM: cardiomyocyte; PPAR: peroxisome proliferator-activated receptor; PGC-1α: PPAR gamma coactivator 1-alpha; 1m: 1 month; 3m: 3 month; CoA: coenzyme A; GPC: sn-glycero-3-phosphocholine; PC: O-phosphocholine; RPMI: Roswell park memorial institute medium; DMEM: Dulbecco's modified eagle medium; BSA: bovine serum albumin; OCR: oxygen consumption rate; ETO: etomoxir; FCCP: 4-(trifluoromethoxy) phenylhydrazone; Rtn/AA: rotenone and antimycin; TMSP: 3-trimethylsilyl-propionate-2, 2, 3, 3,-d4; FID: free induction decay; LB: line broadening factor; ACD: advanced chemistry development; HMDB: human metabolome database; ANOVA: analysis of variance; FDR: false discovery rate; MMCA: metabolite-metabolite correlation analysis; HSD: honest significant difference; GiWi: Gsk3 inhibitor and Wnt inhibitor; CPT-1: carnitine palmitoyltransferase-1; RT-PCR: reverse transcription polymerase chain reaction; MLC2a: myosin light chain 2a; MLC2v: myosin light chain 2v; PLS-DA: partial least squares discriminant analysis; VIP: variable importance in projection; Vit.: vitamin; AUC: area under the curve; CI: confidence interval; ALCAR: O-acetylcarnitine; PE: O-phosphoethanolamine; NIH: National Institutes of Health; PBS: phosphate-buffered saline.
Figure 6
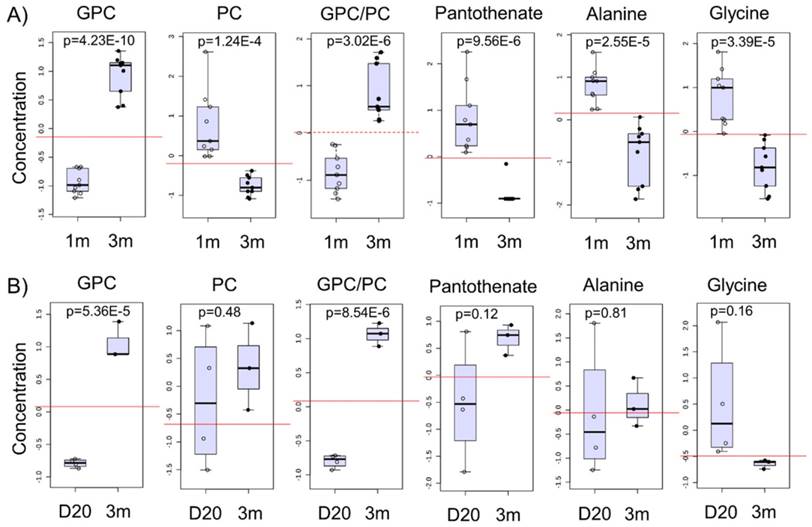
Potential biomarkers of maturation in hPSC-CMs and validation in mice hearts. A) The normalized and auto-scaled concentrations of top six metabolites which showed significant differences between 1m and 3m hPSC-CMs are shown with p values indicated. The red dotted line highlights the cut-off for distinguishing the two groups and achieving highest discrimination (based on receiver operating characteristic (ROC) curve analysis). B) Heart tissues from mice were isolated at day 20 and 3 months and were used for metabolic profiling. The same six metabolite concentrations in 20 day old mice and 3m old mice heart tissues are shown. Student's t-test was used to calculate the significance.
Supplementary Material
Additional File 1Supplementary data.
Supplementary figures and tables.
Acknowledgements
This work was supported by funding from NIH grants R01CA164492 and R01EB007534 and National Science Foundation grants 1547225 and 1508950. X.B was supported by a UW-Madison Stem Cell and Regenerative Medicine Center fellowship and K.K.D. by a NIH Chemistry Biology Interface Training Grand (NIGMS T32 GM008505). A.I. is supported by NIH grant R01 EY022086. The authors would like to acknowledge University of Wisconsin Carbone Cancer Center Small Molecule Screening Facility for training and providing necessary equipment. The authors also thank the National Magnetic Resonance Facility at Madison, which is supported by National Institutes of Health Grants P41GM103399 (National Institutes of General Medical Sciences) and P41GM66326 (National Institute of General Medical Sciences). Equipment in the facility was purchased with funds from the University of Wisconsin, the National Institutes of Health (P41GM66326, P41RR02301, P41GM103399, RR02781, RR08438), the National Science Foundation (DMB- 8415048, OIA-9977486, BIR-9214394), and the U.S. Department of Agriculture.
Author Contributions
V.J.B., X.B., A.I., and S.P.P. designed the study. V.J.B., X.B., K.K.D., E.C.M., and G.J., performed in vitro experiments and W.H.L. and S.L. performed animal experiments. V.J.B. and K.R.K. did the metabolomics analysis. V.J.B. and S.P.P. analyzed the data and wrote the manuscript. All authors read and approved the final manuscript.
Competing Interests
The authors have declared that no competing interest exists.
References
1. Robinton DA, Daley GQ. The promise of induced pluripotent stem cells in research and therapy. Nature. 2012;481:295-305
2. Lian X, Zhang J, Azarin SM. et al. Directed cardiomyocyte differentiation from human pluripotent stem cells by modulating Wnt/β-catenin signaling under fully defined conditions. Nat Protoc. 2012;8:162-175
3. Lian X, Bao X, Zilberter M. et al. Chemically defined, albumin-free human cardiomyocyte generation. Nat Methods. 2015;12:595-596
4. Lian X, Hsiao C, Wilson G. et al. Cozzarelli Prize Winner: Robust cardiomyocyte differentiation from human pluripotent stem cells via temporal modulation of canonical Wnt signaling. Proc Natl Acad Sci. 2012;109:E1848-E1857
5. Tohyama S, Hattori F, Sano M. et al. Distinct Metabolic Flow Enables Large-Scale Purification of Mouse and Human Pluripotent Stem Cell-Derived Cardiomyocytes. Cell Stem Cell. 2013;12:127-137
6. Robertson C, Tran DD, George SC. Concise Review: Maturation Phases of Human Pluripotent Stem Cell-Derived Cardiomyocytes. Stem Cells. 2013;31:829-837
7. Yang X, Pabon L, Murry CE. Engineering Adolescence. Circ Res. 2014;114:511-523
8. Lundy SD, Zhu W-Z, Regnier M. et al. Structural and functional maturation of cardiomyocytes derived from human pluripotent stem cells. Stem Cells Dev. 2013;22:1991-2002
9. Kamakura T, Makiyama T, Sasaki K. et al. Ultrastructural Maturation of Human-Induced Pluripotent Stem Cell-Derived Cardiomyocytes in a Long-Term Culture. Circ J. 2013;77:1307-1314
10. Lopaschuk GD, Jaswal JS. Energy Metabolic Phenotype of the Cardiomyocyte During Development, Differentiation, and Postnatal Maturation. J Cardiovasc Pharmacol. 2010;56:130-140
11. Ellen Kreipke R, Wang Y, Miklas JW. et al. Metabolic remodeling in early development and cardiomyocyte maturation. Semin Cell Dev Biol. 2016;52:84-92
12. Bao X, Lian X, Dunn KK. et al. Chemically-defined albumin-free differentiation of human pluripotent stem cells to endothelial progenitor cells. Stem Cell Res. 2015;15:122-129
13. Kuppusamy KT, Jones DC, Sperber H. et al. Let-7 family of microRNA is required for maturation and adult-like metabolism in stem cell-derived cardiomyocytes. Proc Natl Acad Sci. 2015:201424042
14. Bhute VJ, Palecek SP. Metabolic responses induced by DNA damage and poly (ADP-ribose) polymerase (PARP) inhibition in MCF-7 cells. Metabolomics. 2015;11:1779-91
15. Bhute VJ, Ma Y, Bao X. et al. The Poly (ADP-Ribose) Polymerase Inhibitor Veliparib and Radiation Cause Significant Cell Line Dependent Metabolic Changes in Breast Cancer Cells. Sci Rep. 2016;6:36061
16. Teng Q, Huang W, Collette TW. et al. A direct cell quenching method for cell-culture based metabolomics. Metabolomics. 2008;5:199-208
17. Martineau E, Tea I, Loaëc G. et al. Strategy for choosing extraction procedures for NMR-based metabolomic analysis of mammalian cells. Anal Bioanal Chem. 2011;401:2133-42
18. Beckonert O, Keun HC, Ebbels TMD. et al. Metabolic profiling, metabolomic and metabonomic procedures for NMR spectroscopy of urine, plasma, serum and tissue extracts. Nat Protoc. 2007;2:2692-703
19. Wishart DS, Jewison T, Guo AC. et al. HMDB 3.0-The Human Metabolome Database in 2013. Nucleic Acids Res. 2013;41:D801-7
20. Tulpan D, Léger S, Belliveau L. et al. MetaboHunter: an automatic approach for identification of metabolites from 1H-NMR spectra of complex mixtures. BMC Bioinformatics. 2011;12:400
21. Weljie AM, Newton J, Mercier P. et al. Targeted profiling: quantitative analysis of 1H NMR metabolomics data. Anal Chem. 2006;78:4430-42
22. Cossette SM, Bhute VJ, Bao X. et al. Sucrose Non-Fermenting Related Kinase Enzyme Mediated Rho-Associated Kinase Signaling is Responsible for Cardiac Function. Circ Cardiovasc Genet. 2016:116
23. Xia J, Sinelnikov I V, Han B. et al. MetaboAnalyst 3.0-making metabolomics more meaningful. Nucleic Acids Res. 2015:1-7
24. Xia J, Mandal R, Sinelnikov I V. et al. MetaboAnalyst 2.0-a comprehensive server for metabolomic data analysis. Nucleic Acids Res. 2012;40:W127-33
25. GENE-E. http://www.broadinstitute.org/cancer/software/GENE-E/
26. Gao J, Tarcea VG, Karnovsky A. et al. Metscape: a Cytoscape plug-in for visualizing and interpreting metabolomic data in the context of human metabolic networks. Bioinformatics. 2010;26:971-3
27. Shannon P, Markiel A, Ozier O. et al. Cytoscape: a software environment for integrated models of biomolecular interaction networks. Genome Res. 2003;13:2498-504
28. Haug K, Salek RM, Conesa P. et al. MetaboLights-an open-access general-purpose repository for metabolomics studies and associated meta-data. Nucleic Acids Res. 2013;41:D781-6
29. Bao X, Lian X, Hacker TA. et al. Long-term self-renewing human epicardial cells generated from pluripotent stem cells under defined xeno-free conditions. Nat Biomed Eng. 2016;1:3
30. Ma Y, Zhao J, Cao H. et al. Efficient differentiation of TBX18+/WT1+ epicardial-like cells from human pluripotent stem cells using small molecular compounds. Stem Cells Dev. 2016 scd.2016.0208
31. Steuer R. Review: on the analysis and interpretation of correlations in metabolomic data. Brief Bioinform. 2006;7:151-8
32. Madhu B, Narita M, Jauhiainen A. et al. Metabolomic changes during cellular transformation monitored by metabolite-metabolite correlation analysis and correlated with gene expression. Metabolomics. 2015;11:1848-1863
33. Weckwerth W, Loureiro ME, Wenzel K. et al. Differential metabolic networks unravel the effects of silent plant phenotypes. Proc Natl Acad Sci U S A. 2004;101:7809-14
34. Brown GM. The metabolism of pantothenic acid. J Biol Chem. 1959;234:370-378
35. Aboagye EO, Bhujwalla ZM. Malignant transformation alters membrane choline phospholipid metabolism of human mammary epithelial cells. Cancer Res. 1999;59:80-84
36. Iorio E, Mezzanzanica D, Alberti P. et al. Alterations of Choline Phospholipid Metabolism in Ovarian Tumor Progression. Cancer Res. 2005;65:9369-76
37. Podo F, Canevari S, Canese R. et al. Tumour Phospholipid Metabolism. NMR Biomed. 1999;12:413-39
38. Smith TA, Eccles S, Ormerod MG. et al. The phosphocholine and glycerophosphocholine content of an oestrogen-sensitive rat mammary tumour correlates strongly with growth rate. Br J Cancer. 1991;64:821-6
39. Glunde K, Jie C, Bhujwalla ZM. Molecular Causes of the Aberrant Choline Phospholipid Metabolism in Breast Cancer. Cancer Res. 2004;64:4270-76
40. Ramírez de Molina A, Gallego-Ortega D, Sarmentero-Estrada J. et al. Choline kinase as a link connecting phospholipid metabolism and cell cycle regulation: Implications in cancer therapy. Int J Biochem Cell Biol. 2008;40:1753-1763
Author contact
![]() Corresponding author: Prof. Sean P. Palecek, Department of Chemical and Biological Engineering, University of Wisconsin-Madison, 1415 Engineering Drive, Madison, WI 53706, U.S. Tel: (608) 262-8931; Email: sppalecekedu
Corresponding author: Prof. Sean P. Palecek, Department of Chemical and Biological Engineering, University of Wisconsin-Madison, 1415 Engineering Drive, Madison, WI 53706, U.S. Tel: (608) 262-8931; Email: sppalecekedu
Citation styles
APA
Bhute, V.J., Bao, X., Dunn, K.K., Knutson, K.R., McCurry, E.C., Jin, G., Lee, W.H., Lewis, S., Ikeda, A., Palecek, S.P. (2017). Metabolomics Identifies Metabolic Markers of Maturation in Human Pluripotent Stem Cell-Derived Cardiomyocytes. Theranostics, 7(7), 2078-2091. https://doi.org/10.7150/thno.19390.
ACS
Bhute, V.J.; Bao, X.; Dunn, K.K.; Knutson, K.R.; McCurry, E.C.; Jin, G.; Lee, W.H.; Lewis, S.; Ikeda, A.; Palecek, S.P. Metabolomics Identifies Metabolic Markers of Maturation in Human Pluripotent Stem Cell-Derived Cardiomyocytes. Theranostics 2017, 7 (7), 2078-2091. DOI: 10.7150/thno.19390.
NLM
Bhute VJ, Bao X, Dunn KK, Knutson KR, McCurry EC, Jin G, Lee WH, Lewis S, Ikeda A, Palecek SP. Metabolomics Identifies Metabolic Markers of Maturation in Human Pluripotent Stem Cell-Derived Cardiomyocytes. Theranostics 2017; 7(7):2078-2091. doi:10.7150/thno.19390. https://www.thno.org/v07p2078.htm
CSE
Bhute VJ, Bao X, Dunn KK, Knutson KR, McCurry EC, Jin G, Lee WH, Lewis S, Ikeda A, Palecek SP. 2017. Metabolomics Identifies Metabolic Markers of Maturation in Human Pluripotent Stem Cell-Derived Cardiomyocytes. Theranostics. 7(7):2078-2091.
This is an open access article distributed under the terms of the Creative Commons Attribution (CC BY-NC) license (https://creativecommons.org/licenses/by-nc/4.0/). See http://ivyspring.com/terms for full terms and conditions.