Theranostics
13.3
Impact Factor
- Current Issue
- Advance Articles
- Volume 16; 2026
- Volume 15; 2025
- Volume 14; 2024
- Volume 13; 2023
- Volume 12; 2022
- Archive
- Cover Images
- Cover Suggestion
- Special Issues
Top
Introduction
Results
Discussion
Materials and Methods
Supplementary Material
Acknowledgements
References
Introduction
Results
Discussion
Materials and Methods
Supplementary Material
Acknowledgements
References
International Journal of Biological Sciences
International Journal of Medical Sciences
 Global reach, higher impact

Theranostics 2017; 7(8):2231-2249. doi:10.7150/thno.18835 This issue Cite
Research Paper
Down-regulated miR-23a Contributes to the Metastasis of Cutaneous Melanoma by Promoting Autophagy
Weinan Guo*, Huina Wang*, Yuqi Yang*, Sen Guo*, Weigang Zhang, Yu Liu, Xiuli Yi, Jingjing Ma, Tao Zhao, Lin Liu, Zhe Jian, Ling Liu, Gang Wang, Tianwen Gao, Qiong Shi ![]() , Chunying Li
, Chunying Li ![]()
Department of Dermatology, Xijing hospital, Fourth Military Medical University, Xi'an, Shaanxi, China.
* These authors contributed equally to this work.
Received 2016-12-20; Accepted 2017-3-31; Published 2017-6-1
Citation:
Guo W, Wang H, Yang Y, Guo S, Zhang W, Liu Y, Yi X, Ma J, Zhao T, Liu L, Jian Z, Liu L, Wang G, Gao T, Shi Q, Li C. Down-regulated miR-23a Contributes to the Metastasis of Cutaneous Melanoma by Promoting Autophagy. Theranostics 2017; 7(8):2231-2249. doi:10.7150/thno.18835. https://www.thno.org/v07p2231.htm
Other stylesAbstract

Melanoma is among the most aggressive tumors, and the occurrence of metastasis leads to a precipitous drop in the patients' survival. Therefore, identification of metastasis-associated biomarkers and therapeutic targets will contribute a lot to improving melanoma theranostics. Recently, microRNAs (miRNAs) have been implicated in modulating cancer invasion and metastasis, and are proved as potential non-invasive biomarkers in sera for various tumors. Here, we reported miR-23a as a novel metastasis-associated miRNA that played a remarkable role in modulating melanoma invasive and metastatic capacity and was of great value in predicting melanoma metastasis and prognosis. We found that serum miR-23a level was significantly down-regulated in metastatic melanoma patients and highly correlated with poor clinical outcomes. In addition, miR-23a level was also remarkably decreased in metastatic melanoma tissues and cell lines. Furthermore, overexpressed miR-23a suppressed the invasive and migratory property of melanoma cells by abrogating autophagy through directly targeting ATG12. Specially, miR-23a-ATG12 axis attenuated melanoma invasion and migration through autophagy-mediated AMPK-RhoA pathway. Finally, the overexpression of miR-23a prevented melanoma metastasis in vivo. Taken together, our findings demonstrate that the metastasis-associated miR-23a is not only a potential biomarker, but also a valuable therapeutic target for melanoma.
Keywords: melanoma, miR-23a, biomarker, autophagy, metastasis.
Introduction
Melanoma is among the deadliest forms of cancer, with a drastic increase in its incidence worldwide [1]. Once disseminated to distant sites and visceral organs, melanoma will be almost resistant to clinical therapy and incurable, with a median survival time of only 6-9 months and a 3-year survival of 15% [2-4]. Of note, the occurrence of the invasion and the metastasis is the key transition for melanoma to be aggressive and life-threatening [5]. Therefore, identification of metastasis-associated biomarkers and therapeutic targets will contribute a lot to melanoma treatment.
MicroRNAs (miRNAs) are an abundant class of small non-coding RNAs that negatively modulate gene expression by targeting 3'untranslated region (3'UTR) of mRNAs [6]. Dysregulated expression profiles of miRNAs have been implicated in the development of various cancers, particularly in the procedure of tumor invasion and metastasis [7]. As for melanoma, several miRNAs such as miR-9, miR-145 and miR-182 have been proved to regulate melanoma invasion and metastasis [8-10], indicating the great potential of targeting miRNAs in melanoma therapy. Nevertheless, how aberrant miRNAs modulate melanoma invasion and metastasis has not been fully elucidated.
Recently, miRNAs have been found to exist not only in frozen and paraffin-embedded tumor tissues, but also in peripheral circulation of tumor patients [11]. Due to the rather stability in human blood and the facility of blood sampling, serum miRNAs have emerged as valuable biomarkers in various cancers, including melanoma [11-15]. The currently known histopathologic features and molecular biomarkers such as tumor thickness, ulceration status and Ki-67 have long been used for melanoma detection and prognosis prediction [16-17]. However, the contradictory conclusions and inevitable biases in the measurements of these features impede their application in evaluating melanoma prognosis [18-20]. Therefore, miRNAs may be alternative serological biomarkers for predicting melanoma invasiveness and prognosis, in addition to its potential as therapeutic targets.
Herein, a miRNA microarray study was conducted to identify alterations in the miRNAome of melanoma patients. We discovered that miR-23a level was significantly down-regulated in both sera and tumor tissues of melanoma patients and was associated with an increased risk of worse clinical outcome. Subsequent experiments revealed that miR-23a could inhibit melanoma invasion and metastasis through regulating autophagy level. Thereafter, we further explored the mechanism underlying the inhibition of miR-23a on invasion-metastasis cascade downstream of autophagy. Finally, we proved that overexpression of miR-23a could prevent melanoma metastasis in vivo.
Results
Serum miR-23a is a potential biomarker for predicting melanoma metastasis and prognosis
In view of the possibility to use serum miRNAs as non-invasive disease biomarker, we previously performed a miRNA microarray study and identified that miR-23a was down-regulated in the serum of melanoma patients [21]. Consistently, our real-time quantitative reverse transcription-PCR (qRT-PCR) analysis on another validation cohort that included 192 melanoma patients and 51 matched cancer-free controls showed that serum miR-23a was significantly decreased in melanoma (Fig. 1A, Supplementary Fig. 1A). The down-regulation of serum miR-23a was more prominent in the 92 metastatic melanoma patients than the 100 primary melanoma patients (Fig. 1B, Supplementary Fig. 1B), indicating that the dysregulation of serum miR-23a may be more associated with the metastasis of melanoma. Thereafter, we conducted a receiver operating characteristic curve based on the serum miR-23a level of melanoma patients to testify whether serum miR-23a level could be used to discriminate metastatic melanoma from primary ones. With a cutoff value of 0.024, the sensitivity and specificity were 76.0% and 75.3% respectively, prompting serum miR-23a as a valuable biomarker for reflecting melanoma metastasis (Fig. 1C).
We also analyzed the association between serum miR-23a and melanoma patients' characteristics. It revealed that serum miR-23a levels significantly decreased in patients with tumor thickness > 2 mm, compared with those ≤ 2 mm. Besides, serum miR-23a levels declined markedly in patients with ulceration in comparison to those without ulceration (Table 1). In addition, we analyzed the correlation between serum miR-23a level and lesional Ki-67 expression, which is a canonical biomarker in determining melanoma diagnosis and prognosis [22]. In line with previous studies, our immunohistochemistry assay showed that Ki-67 expression was significantly up-regulated as melanoma progressed (Supplementary Fig. 1C and D). Moreover, serum miR-23a level was highly associated with lesional Ki-67 expression (Supplementary Fig. 1E), indicating the great value of serum miR-23a in evaluating melanoma progression. To further explore whether miR-23a could be a potential prognosticator for melanoma, we performed the survival analysis of the 192 melanoma patients based on their serum miR-23a. The patients were divided into two groups as 'miR-23a low' (n = 95) and 'miR-23a high' (n = 97) by the median value of serum miR-23a levels, and the Kaplan-Meier analysis revealed that low serum miR-23a level was associated with worse clinical outcome (Fig. 1D). Thereafter, we performed Cox proportional hazards regression analysis to assess the association between overall survival and serum miR-23a in the presence of clinicopathologic characteristics. Both of univariate analysis and multivariate analysis showed that serum miR-23a was an independent predictor for patient survival (Table 2).
Further, we examined miR-23a in the tissue samples of 22 melanocytic nevi, 43 primary melanomas and 23 metastatic melanomas. Similar to miR-23 level in sera, it turned out that miR-23a level was also significantly decreased in metastatic melanoma tissues (Fig. 1E). Moreover, through the analysis in a panel of five melanoma cell lines and normal human melanocytes, we showed that miR-23a level was reduced in metastatic melanoma cell lines but not in the primary ones, compared with normal human melanocytes (Fig. 1F). Altogether, these results demonstrated that miR-23a is a metastasis-associated miRNA in melanoma and is of great potential in evaluating melanoma metastasis and patients' prognosis.
Figure 1
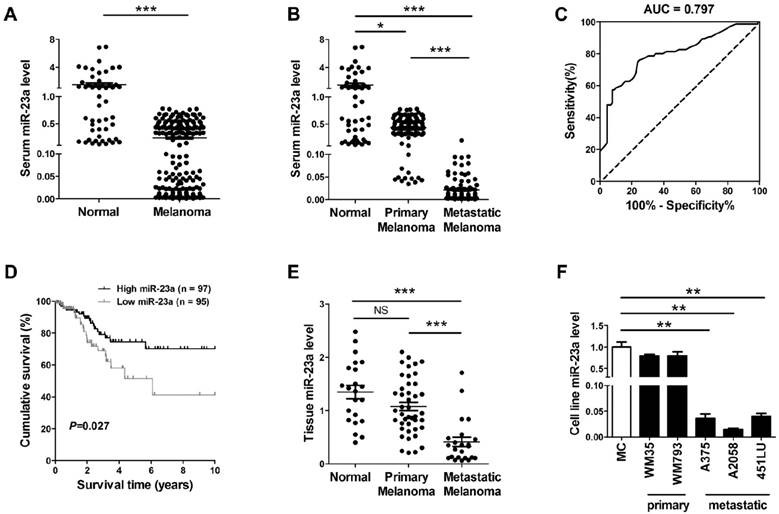
Serum miR-23a is a potential biomarker for predicting melanoma metastasis and prognosis. (A) qRT-PCR measurements of miR-23a level in serum samples of melanoma patients and cancer-free controls. Data represent the mean ± SD. (B) qRT-PCR measurements of miR-23a level in serum samples of melanoma patients at different stages and cancer-free controls. Data represent the mean ± SD. (C) The generated ROC curve based on serum miR-23a level of 192 melanoma patients in distinguishing metastatic melanoma from primary melanoma. (D) Patient serum samples were subdivided into two groups by median serum miR-23a level of all samples. A Kaplan-Meier curve representing the survival of melanoma patients was stratified. P value was determined by log-rank test. (E) MiR-23a expression was analyzed in 22 melanocytic nevi, 43 primary melanoma and 23 metastatic melanoma samples using qRT-PCR. Data represent the mean ± SD. (F) qRT-PCR measurements of miR-23a expression in human normal melanocyte and various melanoma cell lines, including two primary melanoma cell lines WM35 and WM793B and three metastatic melanoma cell lines A375, A2058 and 451LU. Data represent the mean ± SD of triplicates. P value was calculated by two-tailed Student's t-test. *P < 0.05, **P < 0.01, ***P < 0.001. NS, non-significant.
Table 1
Association between serum miR-23a levels and melanoma patients' characteristics and AJCC stages.
| Clinicopathologic features | n (%) | Serum miR-23a expression (mean ± SD) | Pa |
|---|---|---|---|
| All melanomas (n =192) | |||
| Age, y | |||
| ≤ 50 | 75(39.1) | 0.25±0.25 | 0.542 |
| > 50 | 117(60.9) | 0.25±0.23 | |
| Sex | |||
| Male | 91(47.4) | 0.22±0.24 | 0.397 |
| Female | 101(52.6) | 0.25±0.26 | |
| AJCC stage | |||
| Ⅰ-Ⅱ | 100(52.1) | 0.43±0.19 | <0.001 |
| Ⅲ-Ⅳ | 92(47.9) | 0.02±0.03 | |
| Tumor thickness | |||
| ≤ 2 mm | 108(56.2) | 0.31±0.28 | <0.001 |
| >2 mm | 84(43.8) | 0.13±0.16 | |
| Ulceration | |||
| Present | 90(46.9) | 0.19±0.21 | 0.026 |
| Absent | 102(53.1) | 0.27±0.28 | |
| Siteb | |||
| Sun exposed | 97(50.5) | 0.23±0.22 | 0.604 |
| Sun protected | 95(49.5) | 0.25±0.28 |
aStudent's t test.
bSun-exposed sites: head, neck and hands; Sun-protected sites: trunk, arm, leg, and feet.
Table 2
Univariate and multivariate analysis of clinical parameters and serum miR-23a expression levels in association with overall survival.
| Variables | Univariate analysis | Multivariate analysis1 | ||
|---|---|---|---|---|
| HR (95%CI) | P | HR (95%CI) | P | |
| miR-23a expression (≤0.069 vs. >0.069) | 4.153(1.254-13.752) | 0.020 | 5.082(1.459-17.700) | 0.011 |
| Age at diagnosis (≤50 vs. >50) | 1.018(0.993-1.044) | 0.154 | —— | —— |
| Gender (female vs. male) | 1.582(0.835-2.998) | 0.159 | —— | —— |
| AJCC stage (I,II vs. III,IV) | 6.539(2.720-15.720) | <0.001 | 4.738(1.917-11.708) | 0.001 |
| Tumor thickness (≤2mm vs. >2mm) | 4.130(2.149-7.940) | <0.001 | 2.620(1.319-5.208) | 0.006 |
| Ulceration (no vs. yes) | 4.484(2.117-9.498) | <0.001 | 2.950(1.358-6.410) | 0.006 |
| Site (sun exposed vs. sun protected) | 1.322(0.694-2.521) | 0.396 | —— | —— |
Abbreviations: CI, confidence interval; HR, hazard ratio
1. Multivariate Cox regression analyses were adjusted for all factors listed in Table 1.
Overexpression of miR-23a inhibits invasion and migration of melanoma cells
Given that miR-23a down-regulation was associated with advanced stages and worse clinical outcome of melanoma patients, we went on to investigate whether miR-23a could influence the invasion and migration of melanoma cells. We transfected the highly metastatic melanoma cell lines A2058 and A375 with a lentiviral vector encoding the human MIR23A gene, and the overexpression of miR-23a was verified by qRT-PCR (Supplementary Fig. 2A and B). Subsequent transwell assay showed that miR-23a could remarkably impede the invasive and migratory capacity of melanoma cells. In addition, the wound-healing assay revealed the delayed wound closure of miR-23a-overexpressed melanoma cells (Fig. 2A-F). However, miR-23a overexpression had no significant impact on melanoma cell proliferation (Supplementary Fig. 2C-D). Previous studies have revealed that miR-23a targeted p53 expression and apoptosis pathway [23-25]. Therefore, we further investigated whether the suppressive role of miR-23a in invasion and migration was related to cell apoptosis. Through the flow cytometry analysis, we showed that miR-23a overexpression could not induce cell apoptosis in both A2058 and A375 cell lines (Supplementary Fig. 2E-F). Moreover, the expression of p53 was not significantly altered by miR-23a overexpression (Supplementary Fig. 2G), indicating the functional specificity of miR-23a in melanoma. Taken together, miR-23a was a potential tumor suppressor with its specific influence on melanoma invasion and migration, rather than cell proliferation and cell apoptosis.
Figure 2
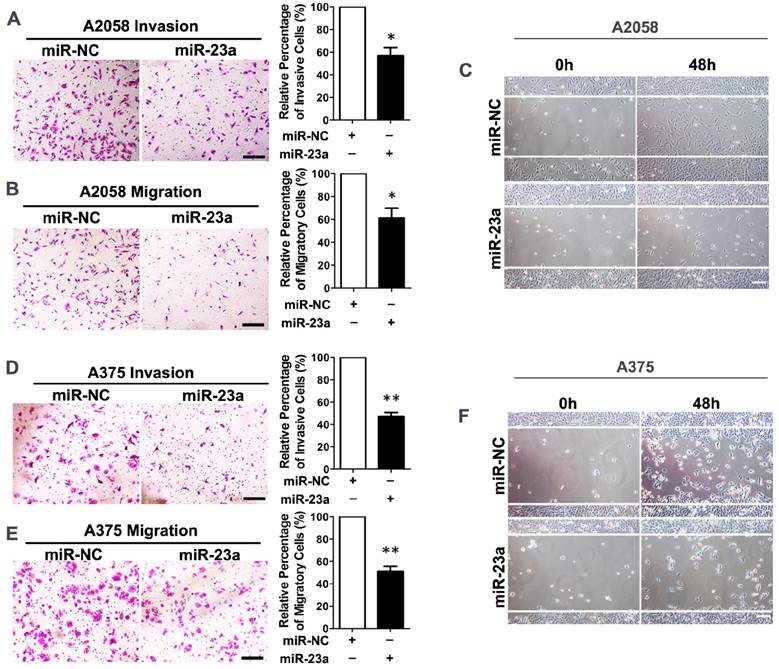
Overexpression of miR-23a inhibits invasion and migration of melanoma cells. (A, B) A2058 cells transfected with miR-23a or control miRNA were subjected to the matrigel invasion assay and transwell migration assay. Representative fields of the invaded and migrated cells are shown. Scale bar = 100μm. The invaded and migrated cells were quantified on the right. Data represent the mean ± SD of triplicates. NC, negative control. (C) A2058 cells transfected with miR-23a or control miRNA were subjected to wound-healing assay. Photos were taken immediately (0 hours) or 48 hours after wounding. Scale bar = 100μm. Experiments were repeated three times with similar results. (D, E) A375 cells transfected with miR-23a or control miRNA were subjected to the matrigel invasion assay and transwell migration assay. Representative fields of the invaded and migrated cells are shown. Scale bar = 100μm. The invaded and migrated cells were quantified on the right. Data represent the mean ± SD of triplicates. NC, negative control. (F) A375 cells transfected with miR-23a or control miRNA were subjected to wound-healing assay. Photos were taken immediately (0 hours) or 48 hours after wounding. Scale bar = 100μm. Experiments were repeated three times with similar results.
MiR-23a directly regulates autophagy by targeting ATG12
Forwardly, we wanted to know the molecular mechanism underlying miR-23a-induced inhibition on melanoma cell invasion and migration. Autophagy has emerged as a vital regulator of the invasion and the migration in cancer [26]. In metastatic melanoma, high level of autophagy before treatment predicts invasiveness, poor response to chemotherapy and shortened survival [27]. Herein, we transfected A2058 cells with siRNA against ATG5, an essential gene for autophagy induction, and an abrogation of cell invasion and migration was observed (Fig. 3A-C, Supplementary Fig. 3A). In addition, we showed that treatment with autophagy inhibitor 3-methyladenine (3-MA) suppressed the invasive and migratory ability of melanoma cells as well (Supplementary Fig. 3B-E), demonstrating that both genetic and pharmacological repression of autophagy inhibited the invasion and the migration of melanoma cells.
Given that autophagy inhibition exerted a similar impact on melanoma invasion and migration as miR-23a overexpression, and that miRNAs are critical components of autophagy regulators in various tissues and cells [28], we speculated that miR-23a could target autophagy, and then regulate the invasion and the migration of melanoma cells. To this end, we detected the aggregation of LC3 proteins, which is a classical marker for autophagosome formation [29], in miR-23a-overexpressed A2058 cells. We found that miR-23a overexpression led to a remarkable reduction of LC3 aggregation, suggesting fewer autophagosome formations (Fig. 3D). Consistently, immunoblotting analysis showed that miR-23a overexpression decreased LC3-II/LC3-I expression ratio and increased p62 expression, further confirming the attenuated autophagy in melanoma cells (Fig. 3E, Supplementary Fig. 3F). Thereafter, we screened for the candidate autophagy-related targets of miR-23a using four common bioinformatics tools, including miRanda, miRWalk, Targetscan and DIANA microT (Supplementary Fig. 3G and Supplementary Table 1), and ATG12 was selected out for its key role in autophagosome formation by forming a complex with ATG5 [30]. Consistent with the bioinformatics prediction, miR-23a suppressed ATG12 expression as well as ATG12-ATG5 complex formation (Fig. 3E, Supplementary Fig. 3F). Subsequent firefly luciferase reporter assay showed that miR-23a reduced the luciferase activity in the cells transfected with plasmid harboring wild-type ATG12 3'UTR (ATG12 WT1 and ATG12 WT2), but failed to influence the reporter activity in the cells transfected with plasmids harboring mutant ATG12 3'UTR (ATG12 MUT1 and ATG12 MUT2) (Fig. 3F-H). Additionally, we analyzed the correlation between miR-23a level and ATG12 expression in 43 metastatic melanoma tissues and 23 primary melanoma tissues. Our immunohistochemistry assay showed that ATG12 expression was remarkably increased in metastatic melanomas compared with the primary ones, which displayed the similar pattern as the autophagy level in melanoma. More importantly, we found that lesional miR-23a level was in a negative associated with ATG12 expression (Supplementary Fig. 4). Taken together, miR-23a was capable to regulate autophagy directly by targeting ATG12.
MiR-23a-ATG12 axis regulates the invasion and the migration of melanoma cells through autophagy
Next, we wondered whether ATG12 reduction and autophagy inhibition was involved in the inhibitory effect of miR-23a on the invasion and the migration of melanoma. A2058 melanoma cells were transfected with siRNA against ATG12, which led to a significant reduction of ATG12 expression, ATG12-ATG5 complex formation, and LC3-II/LC3-I ratio (Fig. 4A). Notably, the knockdown of ATG12 abrogated the invasive and migratory ability of melanoma cells (Fig. 4B-D), which mimicked the impact of 3-MA treatment and ATG5 silencing. Conversely, the re-introduction of ATG12, which obviously reverted ATG12 expression, ATG12-ATG5 complex formation, LC3-II/LC3-I expression ratio and p62 expression level, significantly abolished the inhibition on the invasion and the migration caused by miR-23a (Fig. 4E-H). To further confirm that miR-23a-ATG12 axis regulated the invasion and migration in an autophagy-dependent manner, A2058 cells were transfected with anti-miR-23a oligonucleotide and were then treated with 3-MA. The inhibition of miR-23a promoted the invasion and the migration of melanoma cells, which was remarkably reversed by the treatment of 3-MA (Supplementary Fig. 5). These results suggested that the suppressive role of miR-23a in melanoma invasion and migration depends, at least partly, on its ability to decrease ATG12 expression and autophagy level.
MiR-23a-ATG12 axis suppresses melanoma invasion and migration through autophagy-mediated AMPK-RhoA pathway
We subsequently investigated how miR-23a-induced autophagy inhibition suppressed the invasion and the migration of melanoma cells. Epithelial-mesenchymal transition (EMT) is important in regulating melanoma invasion and metastasis and can be modulated by autophagy [31-34]. Thus, we assessed the mRNA levels of key EMT-related genes in miR-23a-overexpressed cells with or without ATG12 re-introduction. However, we found no significant difference between these two groups, indicating that EMT may not mediate the effect of miR-23a-ATG12 axis (Supplementary Fig. 6).
Figure 3
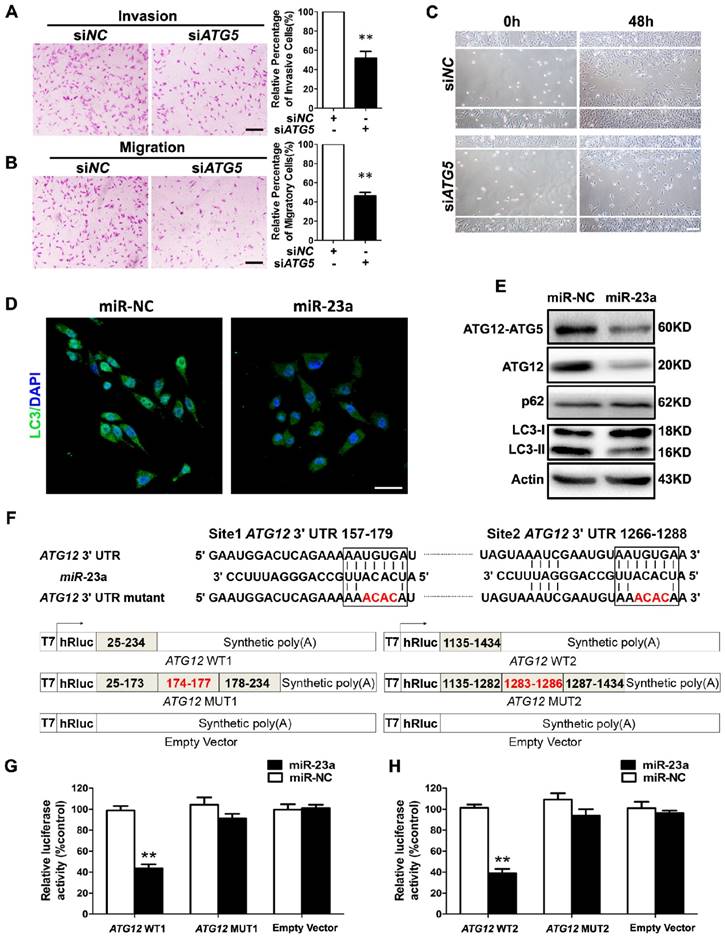
MiR-23a directly regulates autophagy by targeting ATG12. (A, B) A2058 cells transfected with the siRNA against ATG5 or control were subjected to the invasion and migration assay. Representative fields of invaded and migrated cells are shown. Scale bar = 100μm. The invaded and migrated cells were also quantified on the right. Data represent the mean ± SD of triplicates. (C) A2058 cells transfected with ATG5 or control siRNA were subjected to wound-healing assay. Experiments were repeated three times with similar results. Scale bar = 100μm. (D) A2058 cells transfected with miR-23a or control miRNA were observed under a fluorescent microscope. Scale bar = 5μm. (E) Validation of the expression of ATG12-ATG5 complex, ATG12, LC3, and p62 using western blot analysis. Actin was detected as loading control. (F) Schematic illustration of the sequence of hsa-miR-23a and its complementary sequence in 3'UTR of ATG12 mRNA on the top, in which the letters in red represent the four nucleotides we mutated. Structures of firefly luciferase reporter plasmids for ATG12 are also shown. (G, H) Luciferase activity assays using luciferase reporters with wild-type ATG12 3'UTR (ATG12 WT1 and ATG12 WT2) or mutant ATG12 3'UTR (ATG12 MUT1 and ATG12 MUT2) were performed with co-transfection of miR-23a mimics or negative control into A2058 melanoma cells. Data represent the mean ± SD of triplicates. P value was calculated by two-tailed Student's t-test. **P < 0.01.
Figure 4
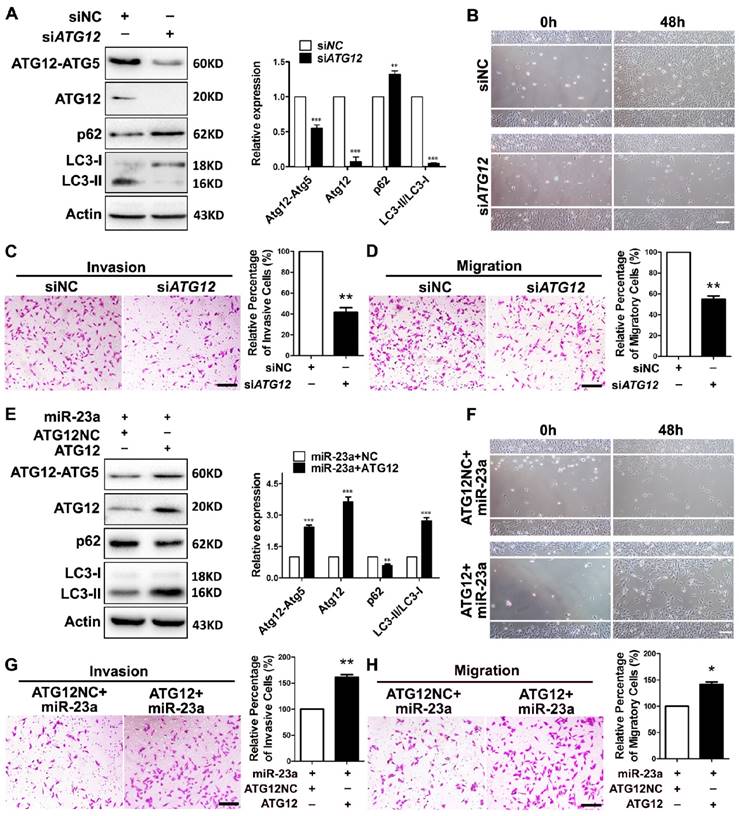
MiR-23a-ATG12 axis regulates the invasive and migratory ability of melanoma cells through autophagy. (A) Protein expression of LC3, ATG12, ATG12-ATG5 complex and p62 was evaluated in A2058 cells with ATG12 knockdown or control. Actin was detected as loading control. Data represent the mean ± SD of triplicates. (B) A2058 cells transfected with ATG12 or control siRNA were subjected to wound-healing assay. Experiments were repeated three times with similar results. Scale bar = 100μm. (C, D) ATG12-silenced and control A2058 cells were subjected to the cell invasion and migration assay. Representative fields of the invaded and migrated cells are shown. Scale bar = 100μm. The invaded and migrated cells were also quantified on the right. Data represent the mean ± SD of triplicates. (E) Expression of LC3, ATG12, ATG12-ATG5 complex and p62 was analyzed by western blot in miR-23a-overexpressed A2058 cells transfected with the 3'UTR deleted or control ATG12 expression vector. Actin was detected as loading control. Data represent the mean ± SD of triplicates. (F) miR-23a-overexpressed A2058 cells transfected with the 3'UTR-deleted or control ATG12 expression vector were subjected to wound-healing assay. Experiments were repeated three times with similar results. Scale bar = 100μm. (G, H) miR-23a-overexpressed A2058 cells transfected with the 3'UTR-deleted or control ATG12 expression vector were subjected to the cell invasion and migration assay. Representative fields of the invaded and migrated cells are shown. Scale bar = 100μm. The invaded and migrated cells were also quantified on the right. Data represent the mean ± SD of triplicates. P value was calculated by two-tailed Student's t-test. *P < 0.05, **P < 0.01.
Previous studies have revealed that autophagy supports the production of ATP [35-36]. AMP-activated protein kinase (AMPK), an evolutionarily conserved sensor of cellular energy status, can be activated by the depletion of ATP level in cells with autophagy deficiency and has anti-metastatic potential in melanoma cells [37-38]. Therefore, the impeded invasion and migration of miR-23a-overexpressed melanoma cells possibly resulted from the decreased ATP production and subsequent AMPK activation. As expected, miR-23a overexpression and ATG12 knockdown significantly reduced cellular ATP levels in A2058 and A375 cells (Fig. 5A, Supplementary Fig. 7A). In parallel, the phosphorylation of AMPK and its downstream acetyl-CoA carboxylase (ACC) was significantly increased (Fig. 5B, Supplementary Fig. 7B-D). In addition, the phosphorylation of AMPK and ACC were significantly repressed after the rescue expression of ATG12 in miR-23a-overexpressed cells, with the expression of total AMPK unchanged (Fig. 5B, Supplementary Fig. 7B-D). Moreover, our immunoprecipitation assay showed no direct association between ATG12 and AMPK (Supplementary Fig. 7E). Therefore, the activation of AMPK was controlled by miR-23a-ATG12 axis probably through the altered energetic status in response to miR-23a-mediated autophagy inhibition, rather than the direct interaction between ATG12 and AMPK.
Figure 5
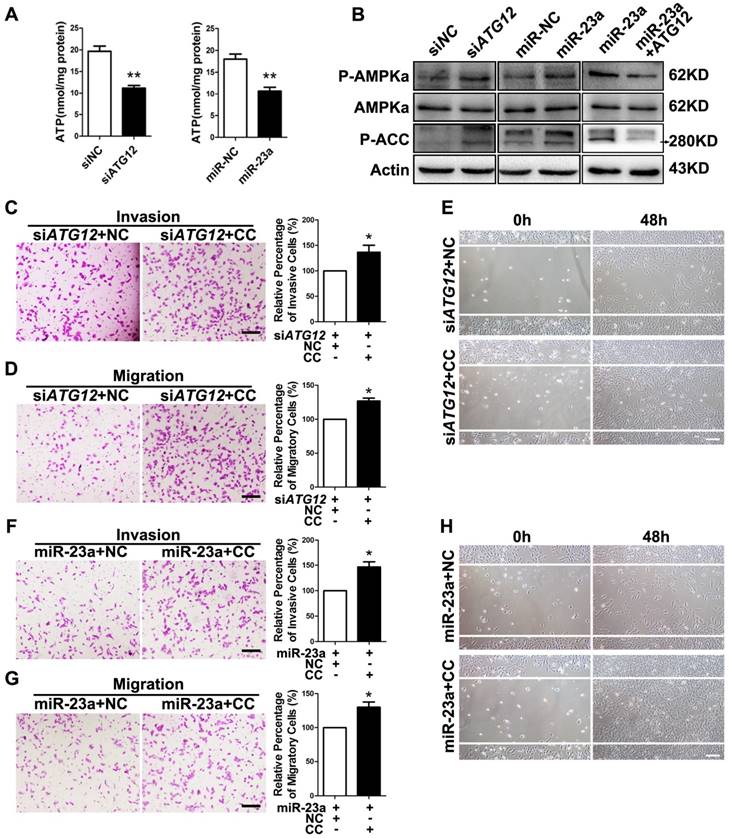
MiR-23a-ATG12 axis suppresses melanoma invasion and metastasis through autophagy-mediated AMPK signaling. (A) Assessment of ATP level in ATG12-silenced and miR-23a-overexpressed A2058 cells. Data represent the mean ± SD of triplicates. (B) Immunoblotting analysis of AMPKα, phosphorylated-AMPKα and phosphorylated-ACC protein expression in A2058 cells treated as indicated. Actin was used for normalization. (C, D) ATG12-silenced A2058 cells treated with or without Compound C (CC) were subjected to the cell invasion and migration assay. Representative fields of the invaded and migrated cells are shown. Scale bar = 100μm. The invaded and migrated cells were also quantified on the right. Data represent the mean ± SD of triplicates. (E) ATG12-silenced A2058 cells treated with or without Compound C were subjected to wound-healing assay. Experiments were repeated three times with similar results. Scale bar = 100μm. (F, G) miR-23a-overexpressed A2058 cells treated with or without Compound C were subjected to the cell invasion and migration assay. Representative fields of the invaded and migrated cells are shown. Scale bar = 100μm. The invaded and migrated cells were also quantified on the right. Data represent the mean ± SD of triplicates. (H) miR-23a-overexpressed A2058 cells treated with or without Compound C were subjected to wound-healing assay. Experiments were repeated three times with similar results. Scale bar = 100μm. P value was calculated by two-tailed Student's t-test. *P < 0.05, **P < 0.01.
Subsequently, we wondered whether AMPK mediated the suppressive effect on melanoma invasion and migration downstream of miR-23a-ATG12 axis. We treated miR-23a-overexpressed and ATG12-silenced melanoma cells with 10uM AMPK inhibitor Compound C, which remarkably repressed AMPK activation but had little influence on the cell viability (Supplementary Fig. 7F and G). Interestingly, the invasive and migratory ability of melanoma cells was prominently enhanced after the inhibition of AMPK, demonstrating that AMPK activation mediated the impact of miR-23a-ATG12 axis on melanoma invasion-metastasis cascade (Fig. 5C-H, Supplementary Fig. 8).
RhoA is a member of the Rho GTPase family that mediates cytoskeletal organization by activating Rho-associated kinases (ROCK)-myosin-binding subunit 1 (MYPT1) pathway during melanoma cell migration and invasion [39-40]. Importantly, AMPK is able to phosphorylate RhoA on Ser188 and to restrain its activity [41]. Therefore, we speculated that RhoA mediated the effect of miR-23a-ATG12 axis on melanoma invasion and migration downstream of AMPK. We first confirmed that Compound C treatment led to decreased phosphorylation of RhoA, and the activated invasion and migration induced by Compound C could be abolished by RhoA knockdown in A2058 and A375 cell lines (Supplementary Fig. 9). We then assessed the alteration of RhoA signaling in miR-23a-overexpressed and ATG12-silenced melanoma cells. Paralleled with the activation of AMPK, the phosphorylation of RhoA was increased while the phosphorylation of MYPT1 was significantly dampened, indicating the suppression of RhoA signaling (Fig. 6A-B). Thereafter, A2058 melanoma cells were transfected with anti-miR-23a oligonucleotide or ATG12 overexpression plasmid first and then co-transfected with siRNA against RhoA. It revealed that RhoA inhibition could abrogate the increased invasion and migration caused by miR-23a knockdown or ATG12 overexpression (Fig. 6C-H). Altogether, these results demonstrated that miR-23a-ATG12 axis suppressed the invasion and the migration of melanoma cells through AMPK-RhoA pathway downstream of autophagy.
The overexpression of miR-23a can prevent melanoma metastasis in vivo
Thereafter, we went on to determine the impact of miR-23a on melanoma progression in vivo. We established a xenograft model by subcutaneous implantation of miR-23a-overexpressed or miR-NC-overexpressed A2058 cells into SCID-NOD mice. Consistent with the results in vitro, overexpression of miR-23a had no impact on melanoma growth as the tumor volume showed little difference between the two groups (Fig. 7A-B). However, we found that the implantation of miR-23a-overexpressed cells resulted in an increased overall survival rate, as the number of viable mice in miR-23a-overexpressed group was 5 while in miR-NC-overexpressed group was 3 after 50 days of subcutaneous implantation (Fig. 7A and C). Remarkably, the implantation of miR-23a-overexpressed cells led to a decreased amount of metastases in the lung and liver, the two organs that melanoma frequently metastasizes to (Fig. 7D and G), indicating that tumor metastasis may be responsible for the survival-prolonging role of miR-23a. Further biopsies showed that all of the ten mice that received the implantation of miR-23a-overexpressed A2058 cells possessed fewer lung and liver metastases (Fig. 7E and H). In parallel, the MelanA immunofluorescence staining analysis, which indicated the origin from implanted melanoma cells, revealed the similar pattern of lung and liver metastases in these mice (Fig. 7F and I). Additionally, we investigated whether rescue expression of ATG12 could reverse the inhibitory effect of miR-23a on melanoma metastasis. Although the tumor volume of was not significantly altered after the combination of ATG12 overexpression compared with miR-23a-overexpressed group, the survival rate was reduced as the viable mice was only 3 after 50 days of subcutaneous implantation (Fig. 7A-C). Moreover, the amount of metastases in the lung and liver regained after the rescue expression of ATG12 (Fig. 7D and G). In line with this, our biopsies and MelanA immunofluorescence staining analysis also showed that ATG12 overexpression promoted melanoma metastasis in the lung and liver compared with miR-23a-overexpressed group (Fig. 7E-F and H-I). Therefore, there results demonstrated that miR-23a was a valuable therapeutic target in melanoma metastasis by inhibiting ATG12.
MiR-23a down-regulation results from the up-regulation of runt-related transcription factor 2 (RUNX2) in melanoma
At last, we investigated how miR-23a was down-regulated in metastatic melanoma. Previously, miR-23a has been found to be suppressed by transcriptional factor RUNX2 during osteoblast differentiation [42]. In addition, up-regulated RUNX2 can promote the invasion and the metastasis of melanoma [43]. Through the sequence analysis of the MIR23A promoter region, we confirmed the presence of one consensus RUNX2-binding site (TGTGGT) upstream of the transcriptional start site (Fig. 8A). Therefore, the down-regulation of miR-23a in metastatic melanoma could result from the up-regulation of RUNX2. Notably, RUNX2 expression was significantly increased in both melanoma cell lines and tissues (Fig. 8B-D). Subsequent knockdown of RUNX2 in A2058 cells successfully induced increased level of miR-23a (Fig. 8E and F). Furthermore, our chromatin immunoprecipitation (ChIP) assays confirmed that RUNX2 was recruited to the binding sites in the MIR23A promoter region (Fig. 8G). We also analyzed the correlation between miR-23a level and RUNX2 expression in melanoma. In line with the qRT-PCR and immunoblotting analysis, our immunohistochemistry assay showed that RUNX2 expression was significantly increased in metastatic melanomas (Fig. 8H-I). More importantly, RUNX2 expression was in a negative association with miR-23a level in melanoma tissues (Fig. 8J). Collectively, these results demonstrated that RUNX2 was a critical transcriptional repressor miR-23a expression in melanoma.
Discussion
In this study, we found that serum miR-23a was significantly down-regulated in melanoma patients and highly correlated with poor clinical outcomes. Meanwhile, lesional miR-23a expression was lower in metastatic melanoma compared with primary melanoma and melanocytic nevus. Furthermore, overexpressed miR-23a strongly impeded melanoma invasion and migration in an autophagy-dependent way by targeting ATG12. Moreover, the attenuation of melanoma invasion and migration mediated by miR-23a was a result of autophagy-regulated AMPK-RhoA pathway inactivation. Finally, the overexpression of miR-23a prevented melanoma metastasis in vivo. In summary, our study supports that miR-23a is a potential prognosticator and therapeutic target in melanoma (Figure 9).
Recent studies have revealed that the measurement of serum miRNAs can be a key approach for the blood-based detection of human cancers [11-15]. To date, some serum miRNAs have been proved as potential biomarkers for melanoma. Serum miR-221 was found remarkably increased in melanoma patients and of great value in diagnosis [44]. In addition, serum miR-206 was also confirmed of prognosis-predictive capacity for melanoma patients [45]. Notably, melanoma can be effectively cured by surgical resection at early stages, while the prognosis will be extremely poor once the tumor metastasizes to distant sites [46]. Therefore, the identification of serum miRNAs that specifically predict invasive property and metastasis is rather crucial for melanoma management. In our study, we discovered that the down-regulation of miR-23a was far more significant in metastatic melanoma both in sera and in tissues. More importantly, the receiver operating characteristic curve showed that serum miR-23a could be used to discriminate metastatic melanoma from primary melanoma with high sensitivity and specificity, demonstrating the great potential of serum miR-23a for predicting melanoma metastasis. Furthermore, our Kaplan-Meier analysis and Cox proportional hazards regression analysis proved serum-23a as an independent prognostic biomarker for melanoma. Therefore, miR-23a was a metastasis-associated and even metastasis-specific miRNA for melanoma.
Dysregulated miRNAs are important in regulating the invasion and the metastasis of various cancers, including melanoma [8-9, 47-48], but the underlying mechanism is far from understood. Herein, we demonstrated that miR-23a could attenuate invasion-metastasis cascade by inhibiting a novel target ATG12, suggesting that autophagy could modulate melanoma aggressiveness under the post-transcriptional regulation of miRNAs. Previously, miR-23a has been regarded as an oncogene that promotes cancer invasion and metastasis by inhibiting diverse anti-metastatic molecules including E-cadherin and metastasis suppressor 1 (MTSS1) [49-50]. Moreover, miR-23a has been reported to suppress the expression of RKIP, which was a metastasis inhibitor and inversely correlated with metastases in uveal melanoma [51-53]. Actually, it has been well established that one specific microRNA is able to target multiple downstream genes and thus determine its biological role, and the biological role of one miRNA could vary a lot, and even be opposite in different types of tumors, including miR-23a [54-56]. Our study proved the anti-metastasis effect of miR-23a in melanoma both in vitro and in vivo, further strengthening the notion that the regulatory role of miR-23a in metastasis is cancer type-specific and tissue-context dependent. In addition, we observed little influence of miR-23a on melanoma proliferation, cell apoptosis and p53 expression, which indicated that the survival-prolonging role of miR-23a is mainly attributed to its suppressive effect on metastasis rather than proliferation and apoptosis. Taken together, these results illustrate the great value of miR-23a in melanoma treatment by restraining metastasis.
Figure 6
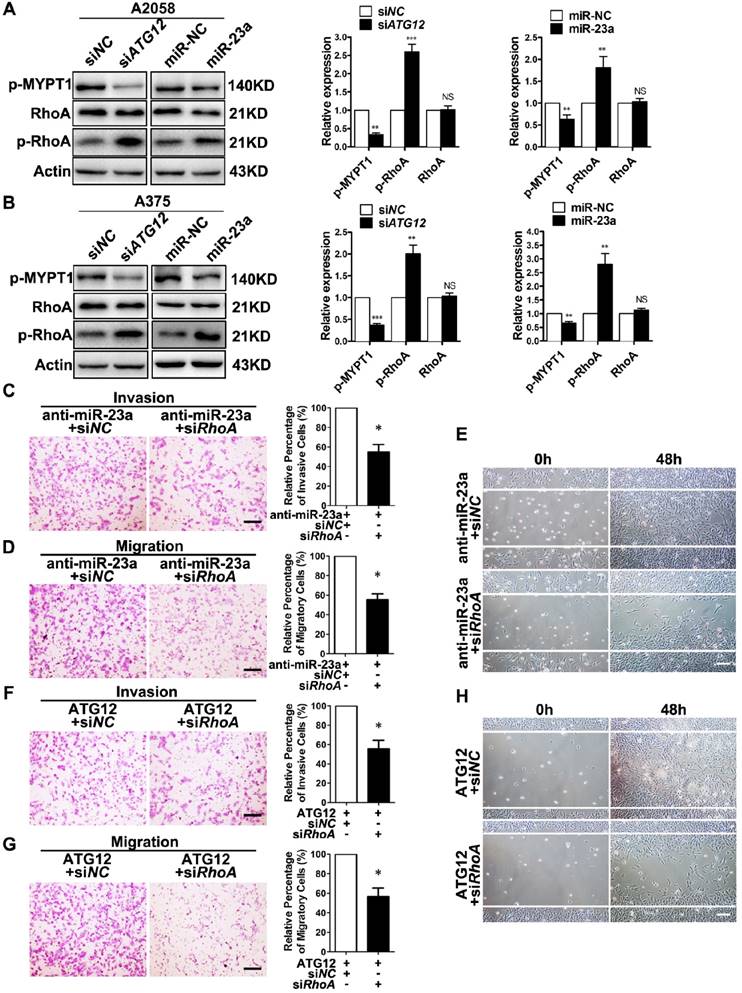
RhoA mediates the effect of MiR-23a-ATG12 axis on melanoma invasion and metastasis downstream of AMPK signaling. (A, B) Immunoblotting analysis of RhoA, phosphorylated-RhoA and phosphorylated-MYPT1 expression in ATG12-silenced and miR-23a-overexpressed A2058 and A375 cells. Actin was used for normalization. Data represent the mean ± SD of triplicates. (C, D) anti-miR-23a-A2058 cells co-transfected with the siRNA against RhoA or control were subjected to the cell invasion and migration assay. Representative fields of the invaded and migrated cells are shown. Scale bar = 100μm. The invaded and migrated cells were also quantified on the right. Data represent the mean ± SD of triplicates. (E) anti-miR-23a-A2058 cells co-transfected with siRNA against RhoA or control were subjected to wound-healing assay. Experiments were repeated three times with similar results. Scale bar = 100μm. (F, G) ATG12-overexpressed A2058 cells co-transfected with the siRNA against RhoA or control were subjected to the cell invasion and migration assay. Representative fields of the invaded and migrated cells are shown. Scale bar = 100μm. The invaded and migrated cells were also quantified on the right. Data represent the mean ± SD of triplicates. (H) ATG12-overexpressed A2058 cells co-transfected with the siRNA against RhoA or control were subjected to wound-healing assay. Experiments were repeated three times with similar results. Scale bar = 100μm. P value was calculated by two-tailed Student's t-test. *P < 0.05.
Figure 7
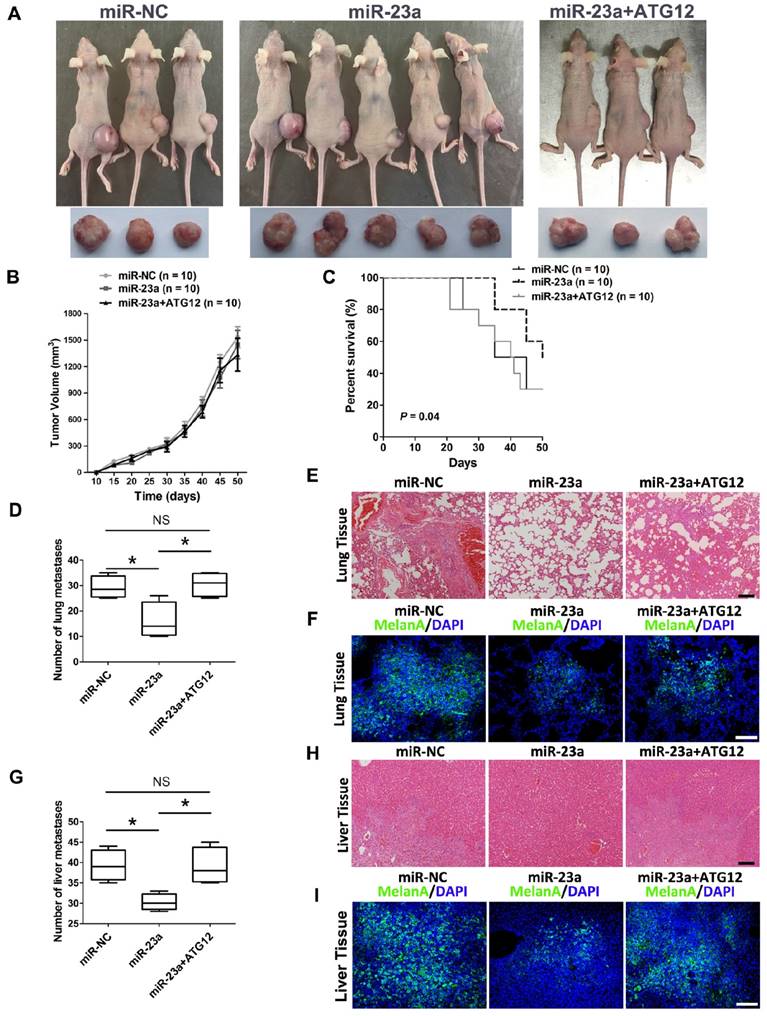
The overexpression of miR-23a prevents melanoma metastasis in vivo. (A) Photographs of viable mice and xenograft tumors of A2058 cells with overexpression of miR-NC or miR-23a or miR-23a and ATG12 after 50 days of implantation. (B) Growth curves of xenografts of A2058 cells with overexpression of miR-NC or miR-23a or miR-23a and ATG12. (n=10, mean ± SD). (C) Survival rate of mice with xenografts overexpressing miR-NC or miR-23a or miR-23a and ATG12. P value was determined by log-rank test, n=10 per group. (D) The number of lung macro-metastases in individual mouse was quantified. Data represent the mean ± SD. (E, F) H&E and MelanA-stained sections of lungs isolated from mice of different groups with treatment as indicated. Scale bar = 100μm. NC, negative control. (G) The number of liver macro-metastases in individual mouse was quantified. Data represent the mean ± SD. (H, I) H&E and MelanA-stained sections of livers isolated from mice of different groups with treatment as indicated. Scale bar = 100μm. P value was calculated by two-tailed Student's t-test. *P < 0.05.
Figure 8
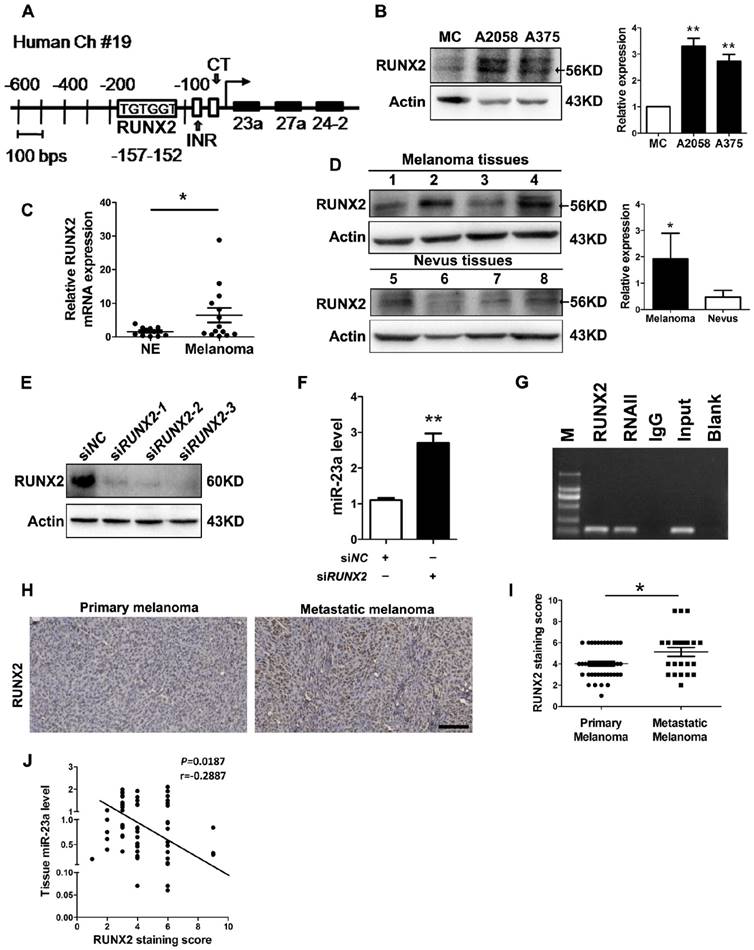
The down-regulation of miR-23a is the result of up-regulated RUNX2 in melanoma. (A) Representation of the human miR-23a-27a-24-2 cluster promoter fragment. Transcription factor (TRANSFAC; TESS) analysis of the proximal promoter identified a RUNX2 binding site (TGTGGT; -152 to -157 for human). Two other important motifs, the INR (Initiator; CCCCACCTCC) motif and the CT motif in sequence at 56 to 34, were characterized in the proximal miR-23a-27a-24-2 cluster promoter. (B) Immunoblotting analysis of RUNX2 expression in normal human melanocytes, A2058 and A375 melanoma cells. Actin was used for normalization. Data represent the mean ± SD of triplicates. (C) Tissue RUNX2 mRNA expressions were measured by qRT-PCR in 11 melanocytic nevi and 14 melanoma specimens. Data represent the mean ± SD of triplicates. (D) RUNX2 protein expressions measured in 4 melanocytic nevi and 4 melanoma samples by western blot. Actin was used for normalization. Data represent the mean ± SD of triplicates. (E) A2058 cells were transfected with three different siRNAs against RUNX2. Whole-cell lysates were immunoblotted for examination of RUNX2 expression level. Actin was used as the internal standard. SiRUNX2-2 was selected out for subsequent study. (F) Analysis of miR-23a level in melanoma cells upon RUNX2 knockdown. Data represent the mean ± SD of triplicates. (G) Binding of RUNX2 to MIR23A promoter was confirmed by performing CHIP assay in A2058 cell line. P value was calculated by two-tailed Student's t-test. *P < 0.05, **P < 0.01. (H) Representative immunohistochemistry images of RUNX2 in primary melanoma and metastatic melanoma. Scale bar = 100μm. (I) Immunohistochemistry analysis of RUNX2 staining score in 43 primary melanoma tissues and 23 metastatic melanoma tissues. P value was calculated by two-tailed Student's t-test. *P < 0.05. (J) Correlation between tissue miR-23 level and RUNX2 staining score was tested by Spearman's rank correlation analysis, with r and P values indicated.
Figure 9
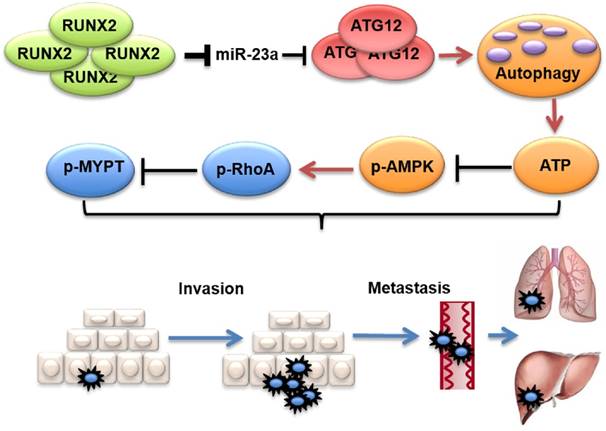
Proposed model of the role of miR-23a in melanoma invasion and metastasis through modulating autophagy. MiR-23a decreases the level of autophagy by directly targeting ATG12, followed by inhibition of AMPK-RhoA pathway, and results in the suppression of invasion and metastasis in melanoma. Moreover, up-regulated RUNX2 leads to the down-regulation of miR-23a in melanoma.
The biological effect of autophagy on melanoma invasion and metastasis is still under debate. On one hand, immunohistochemistry staining of LC3B and electron microscope measurement of autophagosomes have revealed higher autophagy level in metastatic melanoma, and elevated autophagy is significantly correlated with melanoma invasiveness [27, 57-58]. On the other hand, autophagy deficiency in metastatic melanoma cell lines induced the expression of TWIST1, which can facilitate EMT and invasion-metastasis cascade in cancer [32, 59]. In our study, we confirmed that the autophagy induced by down-regulated miR-23a accentuated the invasive and migratory capacity, supporting the pro-metastatic role of autophagy in melanoma. What's more, previous studies have showed that autophagy can induce senescence and inhibit the proliferation of melanoma cells [60]. Therefore, autophagy may play contrary roles in different characteristics of melanoma, at least in terms of proliferation and metastasis.
The link between autophagy and melanoma invasion-metastasis cascade is another concern of the current study. It has been reported that autophagy promotes cancer metastasis by augmenting the secretion of matrix metalloproteinases (MMPs) and cytokines [61]. In contrast, autophagy deficiency can also potentiate tumor invasiveness through the accumulation of p62 and the stabilization of TWIST1 [32,59]. Herein, we showed no significant alterations of EMT-related molecules, implying that alternative mechanisms mediated the invasion and the migration downstream of autophagy. Interestingly, we found that miR-23a overexpression and ATG12 knockdown resulted in the decrease of ATP level and paralleled activation of AMPK in metastatic melanoma cells, which was consistent with the results in other cancer cells and liver cells [34-36]. Pivotally, it is reported that the activation of AMPK by metformin and berberine can inhibit melanoma invasion and metastasis both in vitro and in vivo [37-38]. In line with this, we confirmed that AMPK activation was the cause of impeded invasive and migratory capacity downstream of miR-23a-regulated autophagy, demonstrating the anti-metastatic property of AMPK in melanoma.
AMPK can suppress cancer metastasis by phosphorylating its substrates including NET1A and Pdlim5 [62-63]. As a cytoskeleton formation-regulatory protein greatly involved in tumor cell invasion, RhoA is also a substrate of AMPK and its activity is significantly restrained upon the phosphorylation on Ser188 by AMPK [41]. Therefore, we further investigated whether AMPK-RhoA axis participated in melanoma invasion and migration downstream of miR-23a. In line with the activation of AMPK, the phosphorylation of RhoA was up-regulated in miR-23a-overexpressed and ATG12-silenced melanoma cells. In addition, the phosphorylation of MYPT1, a reflection of the activation of RhoA-ROCK pathway, was remarkably decreased. Furthermore, we proved that the inhibitory effect of miR-23a-ATG12 axis on invasion and metastasis was RhoA-dependent. Thus, we demonstrate that the AMPK-RhoA pathway is a novel linkage between autophagy and invasion-metastasis in melanoma. Moreover, a recent proteomic screen has identified a network of proteins phosphorylated by AMPK that are associated with cell invasion [62]. Therefore, it is possible that additional substrates also mediate the suppressive role of AMPK in melanoma metastasis.
According to previous reports, miR-23a could be regulated by multiple transcription factors including Stat3, c-myc, AP-1 and RUNX2 [42, 64-66]. In the present study, the expression of miR-23a was down-regulated in metastatic melanoma, which was possibly due to potentiated transcriptional repression or impaired transcriptional activation. In fact, the above mentioned Stat3, c-myc and AP-1 are all transcriptional activators of miR-23a and have been proved to be up-regulated in melanoma [67-69]. Therefore, the decreased miR-23a expression could not result from the transcriptional activation of these molecules. Given that RUNX2 is a transcriptional repressor of miR-23a and a tumor promoter in metastatic melanoma [42-43], we speculated that the up-regulation of RUNX2 may lead to the down-regulation of miR-23a expression. Additional upstream regulators are needed for further investigation to fully clarity the dysregulation of miR-23a in melanoma.
Overall, our findings reveal an inhibitory role of miR-23a in melanoma by suppressing autophagy and subsequent metastasis. In addition, serum miR-23a is a potential biomarker for predicting melanoma metastasis and prognosis. Further validations in larger cohorts are needed to confirm the great value of miR-23a in melanoma theranostics.
Materials and Methods
Clinical specimens
Serum samples for qRT-PCR analysis and survival analysis were collected from 192 melanoma patients and 51 matched healthy controls. Tissue samples for qRT-PCR analysis were taken from 66 melanoma patients and 22 nevus cases after the histological confirmation. All the clinical specimens were obtained in Department of Dermatology, Xijing Hospital, Fourth Military Medical University. Demographic information on the melanoma cases included age at primary excision, gender, breslow thickness, time to last follow-up visit and vital status. Survival time was determined from the time of diagnosis to the time of death from melanoma. The research protocol was designed and executed according to the principles of the Declaration of Helsinki and was approved by the ethics review board of Fourth Military Medical University. Written informed consent was obtained from all patients and cancer-free controls.
Cell culture
Human melanoma cell lines WM35, WM793, 451LU, A2058 and A375 were purchased from American Type Culture Collection (ATCC) in 2014. Experiments were performed on cells passaged for no more than 6 months. WM35 cells were cultured in RPMI 1640 medium supplemented with 10% fetal bovine serum (Gibco, CA). WM793 and 451LU were maintained in MCDB153 medium with 2% fetal bovine serum. A2058 and A375 cells were maintained in Dulbecco's Modified Eagle Medium (DMEM) supplemented with 10% fetal bovine serum. All these melanoma cell lines were authenticated by short-tandem repeat (STR) fingerprinting by Beijing Microread Genetics Company Limited in 2016 and tested for mycoplasma contamination. Normal human melanocytes that were isolated from human foreskin specimens obtained during circumcision surgery were cultured in Medium 254 (Invitrogen, Carlsbad, CA) supplemented with Human Melanocyte Growth Supplement (Gibco). All the cells were maintained at 37 °C with 5% CO2.
MicroRNA isolation and qRT-PCR
MiRNA isolation from serum and tissue samples were performed using the miRNeasy Serum/Plasma Kit and Micro Kit (Qiagen, Valencia, CA) following the manufacturer's protocol respectively. Serum and skin cDNA were synthesized from miRNA using miRNA cDNA First Strand Synthesis (Qiagen). QRT-PCR was performed using miRNA SYBR qRT-PCR Kit (Qiagen) with a Bio-Rad Multicolor Real-time PCR Detection System (iQTM5, Bio-Rad, Hercules, CA) using primers and templates that were mixed with SYBR Premix. Serum levels of hsa-miR-23a were normalized to those of cel-miR-39, while tissue levels of hsa-miR-23a were normalized to those of RUNU6. The primers of cel-miR-39, hsa-miR-23a and RUNU6 were purchased from Qiagen.
RNA isolation and qRT-PCR
Total RNA was isolated using Trizol reagent (Invitrogen), and then reversely transcribed to single-strand cDNA using reverse transcription reagents (TaKaRa, Dalian, China) according to the manufacturer's instructions. QRT-PCR experiments were performed using the SYBR Mix (TaKaRa) and Bio-Rad Multicolor Real-time PCR Detection System (iQTM5, Bio-Rad). The resulting amplification and melt curves were analyzed to ensure the identity of the specific PCR product. Threshold cycle values were used to calculate the fold change in the transcript levels by using the 2-ΔΔCT method. The relative mRNA expression levels were normalized to the ACTB gene. The primer sequences are listed in Supplementary Table 2.
Protein preparation and immunoblotting
Total protein extracts were obtained using a boiling buffer containing 0.125 M Tris/HCl, pH 6.8 and 2.5% sodium dodecyl sulphate (SDS). In all, 30 ug proteins were separated by SDS polyacrylamide gel electrophoresis (PAGE) and electroblotted onto polyvinylidene fluoride membranes (Millipore, Billerica, MA). Additional experiments were carried out as previously described [21]. We further used Image J software for the densitometry analysis of each band.
Antibodies and reagents
Primary antibodies were mouse monoclonal anti-ATG12 (1:100, sc-271688, Santa Cruz Biotechnology, Santa Cruz, CA), rabbit polyclonal anti-p53 (1:1000, ab131442, Abcam, Cambridge, MA), rabbit monoclonal anti-LC3 (1:1000, #3868, Cell Signaling Technology, Beverly, MA), rabbit polyclonal anti-SQSTM1/p62 (1:1000, ab91526, Abcam), rabbit monoclonal anti-ATG5 (1:1000, #12994, Cell Signaling Technology), rabbit polyclonal anti-AMPKα (1:1000, #2532, Cell Signaling Technology), rabbit polyclonal anti-phospho-AMPKα (Thr172) (1:1000, #2531, Cell Signaling Technology), rabbit polyclonal anti-phospho-Acetyl-CoA Carboxylase (Ser79) (1:1000, #3661, Cell Signaling Technology), rabbit monoclonal anti-RhoA (1:1000, #2117, Cell Signaling Technology), rabbit polyclonal anti-phospho-RhoA (Ser188) (1:500, ab125275, Abcam), rabbit polyclonal anti-phospho-MYPT1 (Thr696) (1:1000, #5163, Cell Signaling Technology), rabbit monoclonal anti-RUNX2 (1:1000, #12556, Cell Signaling Technology) and mouse monoclonal anti-Actin (1:2000, CW0096, CWBIO, Peking, China). Secondary antibodies were goat anti rabbit IgG (1:5000, 111-035-003, Jackson ImmunoResearch, West Grove, PA) and goat anti mouse IgG (1:5000, 115-035-003, Jackson ImmunoResearch). 3-MA was purchased from Sigma (St. Louis, MO). Compound C was purchased from Abcam.
Luciferase reporter assay
The segment of wild-type ATG12 3'UTR, which contains one of the two putative binding sites for miR-23a, was PCR amplified and inserted into the Renilla luciferase gene (psi-CHECK-2 vector; Promega, Madison, WI) to generate the ATG12 WT1 and ATG12 WT2 plasmids, respectively. Mutant 3'UTR segments of the human ATG12 mRNA, which carried mutated sequences in one of the two complementary sites for the seed regions of miR-23a, were generated by performing site-directed mutation of the wild-type segment and named ATG12 MUT1 and ATG12 MUT2, separately. Transfections of melanoma cells were performed using Lipofectamine 3000 (Invitrogen) according to the manufacturer's recommendations. Luciferase vectors (100 ng) (ATG12 WT, ATG12 MUT1, ATG12 MUT2, and the empty vectors) were individually transfected into A2058 melanoma cells along with 100 nM hsa-miR-23a mimics (Invitrogen) or 100 nM negative control (Invitrogen). Forty-eight hours after transfection, luciferase assays were performed using the Dual-Luciferase Reporter Assay System (Promega). For each transfection, the luciferase activity of three replicates was averaged.
Immunofluorescence
Paraffin-embedded tissue sections were deparaffinized and rehydrated with graded ethanol dilutions. After antigen retrieval in Tris-EDTA Buffer (10 mM Tris Base, 1 mM EDTA Solution, 0.05% Tween 20, pH 9.0), immunofluorescence staining was performed by incubating the paraffin sections with a primary antibody rabbit monoclonal anti-MelanA (1:100, ab51061, Abcam) overnight at 4 °C, followed by 1h incubation with a secondary antibody (Alexa Fluor 488 anti-rabbit IgG, 1:200, #4412, Cell Signaling Technology) at room temperature. DAPI (Dako, Glostrup, Denmark) was used as a counterstain. Tissue sections were analyzed by confocal laser scanning microscopy (FV-1000, Olympus, Tokyo, Japan). For autophagosome detection, experiments are carried out as previously described [70].
Plasmid and lentiviral vector construction
pCMV-myc-Atg12 vector was a gift from Toren Finkel (Addgene plasmid # 24923). For this vector, human 3'UTR-deleted ATG12 mRNA was amplified by RT-PCR and cloned into the pCMV-Myc vector between the EcoRI and NotI restriction sites. The vectors were sequenced to confirm the inserted direction and sequences. MiR-23a was ectopically expressed by the hsa-miR-23a lentiviral vector (GenePharma, Shanghai, China). The lentiviral vector transfection was performed according to the manufacturer's instructions.
siRNA transfections
siRNA oligos against human ATG12, ATG5, RhoA and RUNX2 were purchased from GenePharma. siRNA transfections were performed using the Invitrogen Lipofectamine siRNAmax Kit according to the manufacturer's instructions. Sequences are listed in Supplementary Table 3.
Determination of ATP levels
The level of ATP in melanoma cell lines was determined using the ATP Bioluminescence Assay Kit (S0026, Beyotime, Shanghai, China). Briefly, harvested cultured cells were lysed with a lysis buffer, followed by centrifugation at 10,000 g for 2 mins at 4 °C. Finally, the level of ATP was determined by mixing 50 μl of the supernatant with 50 μl of luciferase reagent, which catalyzed the light production from ATP and luciferin. The emitted light was linearly related to the ATP concentration and measured using a microplate reader (Model 680, Bio-Rad).
Chromatin immunoprecipitation assay
Chromatin immunoprecipitation assay was performed using a ChIP assay kit (Millipore) according to the manufacturer's instructions. Briefly, A2058 cells were incubated in 1% formaldehyde for 10 mins at room temperature to crosslink their DNA. The cells were lysed in lysis buffer, sonicated to generate DNA fragments less than 500 base pairs in length and then diluted by ten folds in ChIP Dilution Buffer. Before immunoprecipitation, nuclear extracts were pre-cleared with 50% protein G-Sepharose slurry, goat normal serum and sheared salmon sperm DNA for 2 hours at 4 °C. Anti-RUNX2 antibody (H-90, 1:50, Santa Cruz) was then added to form complexes with RUNX2 protein and associated chromatin. These immunocomplexes were recovered by protein G-Sepharose beads, and the associated DNA was purified by extraction with phenol/chloroform. Specific primers forward 5'-CGCATGGGCCCTCTAGGTAT-3' and reverse 5'-GGTCCCCAGATGCTTCCTTT-3' were used to measure the enrichment of the putative RUNX2-binding site in the MIR23A promoter.
Invasion and migration assays
Transwell invasion and migration assay
Melanoma cells were transfected with indicated molecules. 36 hours later, cells were starved in serum-free medium for additional 12 hours and then trypsinized for reseeding on the top chambers of 24-well transwell culture inserts (Corning, NY). After 24 hours, cells were fixed in 4% paraformaldehyde for 10 mins at room temperature. For invasion assays, transwell chambers with 8 um-pore size membrane filter inserts (Corning) coated with Matrigel (BD Biosciences, NJ) were used to determine cell invasion. The non-motile or non-invasive cells on the upper side of the filter were removed, while the motile or invasive cells on the lower side were stained with crystal violet. For the quantification of the invasive and migratory cells, we used the “Multi-point” tool in Image software to count the stained cells. Five fields for each well were counted under the inverted system microscope (Ti-S, Nikon, Tokyo, Japan).
Wound-healing assay
Freshly confluent monolayers of melanoma cells transfected with the indicated molecules were wounded by manually scraping off cells with a sterile pipette tip. All the wound sizes were verified to ensure that they were all the same width (approximately 0.8 mm). The cell culture medium was then replaced with serum-free medium containing 4 μg/mL mitomycin C (Sigma, MO), and wound closure was monitored over a 48-hour period with a phase contrast microscope at ×200 magnification (Olympus, Tokyo, Japan).
Cell proliferation analysis
3*105 Melanoma cells were seeded per well in 6-well culture plate and were then transfected with miR-23a expression vector and NC respectively. 24 hous after the transfection, melanoma cells were digested and reseeded in 96-well culture plate with 5*103 cells per well. A cell count kit-8 (CCK-8) assay (Dojindo, Kumamoto, Japan) was employed to quantitatively evaluate cell viability at indicated time points. The absorbance was measured at 450 nm in a Microplate Reader (Model 680, Bio-Rad).
Cell apoptosis analysis
Melanoma cells were transfected with miR-23a expression vector and NC respectively. After transfection for 48h, cells were harvested by trypsinization, washed twice with 4°C PBS, and re-suspended in binding buffer. Annexin V-FITC and Propidium iodide (PI) solution (NeoBioscience, Shanghai, China) were then added to stain the cells before analysis by flow cytometry (Beckman Coulter, Miami, FL).
Immunoprecipitation assay
Immunoprecipitation analysis was performed with a Pierce Co-Immunoprecipitation Kit (Thermo Scientific, Rockford, IL, USA), according to the manufacturer's instructions. Briefly, AminoLink Plus Coupling Resin was added to the Pierce Spin Columns. Anti-AMPKα (#2532, Cell Signaling Technology) or control rabbit IgG (Beyotime) was then incubated with the column at room temperature for 120 min. Cell lysate was then added to the column and incubated at 4∘C overnight. After centrifugation, at 1000g Elution Buffer was added and incubated at room temperature for 5 min. Finally, the flow-through was collected and used for further western blot assays.
Immunohistochemistry analysis
Paraffin-embedded melanoma specimens were rehydrated and then antigen retrieval was performed by incubating sections in citrate buffer and heating in a pressure cooker microwave. After washing the sections, goat serum was added to block nonspecific binding. Sections were incubated at 4°C with rabbit anti-ATG12 polyclonal antibody (1:100, 11122-1-AP, Proteintech, IL, USA) or rabbit anti-RUNX2 polyclonal antibody (1:200, ab135674, Abcam) or rabbit anti-Ki67 polyclonal antibody (1:200, ab15580, Abcam) overnight, followed by anti-rabbit alkaline phosphatase secondary antibody. Sections then were incubated in Fast Red solution, counterstained with hematoxylin and mounted with glycerol.
The evaluation of staining scores was described previously [21]. Briefly, the percentages of staining-positive cells were scored into four categories: 0 (0%), 1 (1-33%), 2 (34-66%), and 3 (67-100%). The staining intensities were scored into four grades: 0 (none), 1 (week), 2 (moderate), and 3 (strong). The final staining score was defined as the product of the percentage and intensity scores.
In vivo study
All experiments performed with live animals complied with ethical animal care. For subcutaneous injection, 8×10⁶ A2058 cells (in PBS) with the indicated transfections were injected into the lower back region of 5-week-old female BALB/C-Nu nude mice (Charles River Laboratories, Wilmington, MA), with ten mice randomly distributed into per group. Tumor diameters were measured on indicated time points. After 50 days, the viable mice were killed and biopsies were performed and tumor volumes were calculated. Lungs and livers were removed and fixed in 4% paraformaldehyde overnight. Metastatic foci on surface of organs were counted by three independent blinded tests with different technicians. Paraffin-embedded sections were processed for haematoxylin and eosin (H&E) and immunofluorescence staining. All animal experiments complied with ethical regulations and were approved by the Subcommittee on Research Animal Care of the Fourth Military Medical University.
Statistical analyses
Survival was analyzed by the Kaplan-Meier and log-rank t-test using R 2.10.0 software. Multivariate analysis was performed by using Cox proportional hazard models of factors related to survival to calculate HRs and identify the factors that affect survival. Correlation analysis was performed using Spearman's rank correlation coefficient analysis with SPSS 19.0. Unless otherwise noted, the results were analyzed by two-tailed Student's t-test, and the results are presented as mean ± S.D. through at least three independent experiments, with *P < 0.05; **P < 0.01; ***P < 0.001 considered to be statistically significant. All statistical analyses were done using SPSS 17.0 (SPSS Inc, Chicago, IL)
Supplementary Material
Supplementary figures and tables.
Acknowledgements
The authors thank the doctors and the patients who participated in our study. This work was supported by National Natural Science Foundation of China (no.81625020, no.81402261, 81602906, no.81502863, no.81572672 and no.81402736) and Program for New Century Excellent Talents in University of China.
Competing Interests
The authors have declared that no competing interest exists.
References
1. Siegel RL, Miller KD, Jemal A. Cancer statistics. CA Cancer J Clin. 2015;65:5-29
2. Eggermont AM, Spatz A, Robert C. Cutaneous melanoma. Lancet. 2014;383:816-827
3. Balch CM, Gershenwald JE, Soong SJ. et al. Final version of 2009 AJCC melanoma staging and classification. J Clin Oncol. 2009;27:6199-6206
4. Korn EL, Liu PY, Lee SJ. et al. Meta-analysis of phase II cooperative group trials in metastatic stage IV melanoma to determine progression-free and overall survival benchmarks for future phase II trials. J Clin Oncol. 2008;26:527-534
5. Orgaz JL, Sanz-Moreno V. Emerging molecular targets in melanoma invasion and metastasis. Pigment Cell Melanoma Res. 2013;26:39-57
6. Ambros V. The functions of animal microRNAs. Nature. 2004;431:350-355
7. Nicoloso MS, Spizzo R, Shimizu M. et al. MicroRNAs-the micro steering wheel of tumour metastases. Nat Rev Cancer. 2009;9:293-302
8. Liu N, Sun Q, Chen J. et al. MicroRNA-9 suppresses uveal melanoma cell migration and invasion through the NF-kappaB1 pathway. Oncol Rep. 2012;28:961-968
9. Dynoodt P, Speeckaert R, De Wever O. et al. MiR-145 overexpression suppresses the migration and invasion of metastatic melanoma cells. Int J Oncol. 2013;42:1443-1451
10. Segura MF, Hanniford D, Menendez S. et al. Aberrant miR-182 expression promotes melanoma metastasis by repressing FOXO3 and microphthalmia-associated transcription factor. Proc Natl Acad Sci U S A. 2009;106:1814-1819
11. Mitchell PS, Parkin RK, Kroh EM. et al. Circulating microRNAs as stable blood-based markers for cancer detection. Proc Natl Acad Sci U S A. 2008;105:10513-10518
12. Resnick KE, Alder H, Hagan JP. et al. The detection of differentially expressed microRNAs from the serum of ovarian cancer patients using a novel real-time PCR platform. Gynecol Oncol. 2009;112:55-59
13. Wang J, Chen J, Chang P. et al. MicroRNAs in plasma of pancreatic ductal adenocarcinoma patients as novel blood-based biomarkers of disease. Cancer Prev Res (Phila). 2009;2:807-813
14. Fleming NH, Zhong J, da Silva IP. et al. Serum-based miRNAs in the prediction and detection of recurrence in melanoma patients. Cancer. 2015;121:51-59
15. Friedman EB, Shang S, de Miera EV. et al. Serum microRNAs as biomarkers for recurrence in melanoma. J Transl Med. 2012;10:155
16. Hill R, Kalathur RK, Colaco L. et al. TRIB2 as a biomarker for diagnosis and progression of melanoma. Carcinogenesis. 2015;36:469-477
17. Abbas O, Miller DD, Bhawan J. Cutaneous malignant melanoma: update on diagnostic and prognostic biomarkers. Am J Dermatopathol. 2014;36:363-379
18. Frahm SO, Schubert C, Parwaresch R. et al. High proliferative activity may predict early metastasis of thin melanomas. Hum Pathol. 2001;32:1376-1381
19. Hazan C, Melzer K, Panageas KS. et al. Evaluation of the proliferation marker MIB-1 in the prognosis of cutaneous malignant melanoma. Cancer. 2002;95:634-640
20. Ostmeier H, Fuchs B, Otto F. et al. Prognostic immunohistochemical markers of primary human melanomas. Br J Dermatol. 2001;145:203-209
21. Guo S, Guo W, Li S. et al. Serum miR-16: A potential biomarker for predicting melanoma prognosis. J Invest Dermatol. 2016;136:985-993
22. Gimotty PA, Van Belle P, Elder DE. et al. Biologic and prognostic significance of dermal Ki67 expression, mitoses, and tumorigenicity in thin invasive cutaneous melanoma. J Clin Oncol. 2005;23:8048e56
23. Li J, Aung LH, Long B. et al. MiR-23a binds to p53 and enhances its association with miR-128 promoter. Sci Rep. 2015;5:16422
24. Liu X, Liu Q, Fan Y. et al. Downregulation of PPP2R5E expression by miR-23a suppresses apoptosis to facilitate the growth of gastric cancer cells. FEBS Lett. 2014;588(17):3160-3169
25. Huang FY, Wong DK, Seto WK. et al. Estradiol induces apoptosis via activation of miRNA-23a and p53: implication for gender difference in liver cancer development. Oncotarget. 2015;6(33):34941-34952
26. Kenific CM, Debnath J. Cellular and metabolic functions for autophagy in cancer cells. Trends Cell Biol. 2015;25:37-45
27. Ma XH, Piao S, Wang D. et al. Measurements of tumor cell autophagy predict invasiveness, resistance to chemotherapy, and survival in melanoma. Clin Cancer Res. 2011;17:3478-3489
28. Zhai H, Fesler A, Ju J. MicroRNA: a third dimension in autophagy. Cell Cycle. 2013;12:246-50
29. Klionsky DJ, Abdelmohsen K, Abe A. et al. Guidelines for the use and interpretation of assays for monitoring autophagy (3rd edition). Autophagy. 2016;12(1):1-222
30. Otomo C, Metlagel Z, Takaesu G. et al. Structure of the human ATG12~ATG5 conjugate required for LC3 lipidation in autophagy. Nat Struct Mol Biol. 2013;20:59-66
31. Caramel J, Papadogeorgakis E, Hill L. et al. A switch in the expression of embryonic EMT-inducers drives the development of malignant melanoma. Cancer Cell. 2013;24:466-480
32. Qiang L, He YY. Autophagy deficiency stabilizes TWIST1 to promote epithelial-mesenchymal transition. Autophagy. 2014;10:1864-1865
33. Lv Q, Hua F, Hu ZW. DEDD, a novel tumor repressor, reverses epithelial-mesenchymal transition by activating selective autophagy. Autophagy. 2012;8:1675-1676
34. Sharifi MN, Mowers EE, Drake LE. et al. Autophagy Promotes Focal Adhesion Disassembly and Cell Motility of Metastatic Tumor Cells through the Direct Interaction of Paxillin with LC3. Cell Rep. 2016;15:1660-1672
35. Guo JY, Chen HY, Mathew R. et al. Activated Ras requires autophagy to maintain oxidative metabolism and tumorigenesis. Genes Dev. 2011;25:460-470
36. Toshima T, Shirabe K, Fukuhara T. et al. Suppression of autophagy during liver regeneration impairs energy charge and hepatocyte senescence in mice. Hepatology. 2014;60:290-300
37. Cerezo M, Tichet M, Abbe P. et al. Metformin blocks melanoma invasion and metastasis development in AMPK/p53-dependent manner. Mol Cancer Ther. 2013;12:1605-1615
38. Kim HS, Kim MJ, Kim EJ. et al. Berberine-induced AMPK activation inhibits the metastatic potential of melanoma cells via reduction of ERK activity and COX-2 protein expression. Biochem Pharmacol. 2012;83:385-394
39. Le Gal K, Ibrahim MX, Wiel C. et al. Antioxidants can increase melanoma metastasis in mice. Sci Transl Med. 2015;7:308re8
40. Sadok A, McCarthy A, Caldwell J. et al. Rho kinase inhibitors block melanoma cell migration and inhibit metastasis. Cancer Res. 2015;75:2272-2284
41. Gayard M, Guilluy C, Rousselle A. et al. AMPK alpha 1-induced RhoA phosphorylation mediates vasoprotective effect of estradiol. Arterioscler Thromb Vasc Biol. 2011;31:2634-2642
42. Hassan MQ, Gordon JA, Beloti MM. et al. A network connecting Runx2, SATB2, and the miR-23a~27a~24-2 cluster regulates the osteoblast differentiation program. Proc Natl Acad Sci U S A. 2010;107:19879-19884
43. Boregowda RK, Olabisi OO, Abushahba W. et al. RUNX2 is overexpressed in melanoma cells and mediates their migration and invasion. Cancer Lett. 2014;348:61-70
44. Kanemaru H, Fukushima S, Yamashita J. et al. The circulating microRNA-221 level in patients with malignant melanoma as a new tumor marker. J Dermatol Sci. 2011;61:187-193
45. Tian R, Liu T, Qiao L. et al. Decreased serum microRNA-206 level predicts unfavorable prognosis in patients with melanoma. Int J Clin Exp Pathol. 2015;8:3097-3103
46. Dickson PV, Gershenwald JE. Staging and prognosis of cutaneous melanoma. Surg Oncol Clin N Am. 2011;20:1-17
47. Liu M, Xu A, Yuan X. et al. Downregulation of microRNA-409-3p promotes aggressiveness and metastasis in colorectal cancer: an indication for personalized medicine. J Transl Med. 2015;13:195
48. Wang H, Guan X, Tu Y. et al. MicroRNA-29b attenuates non-small cell lung cancer metastasis by targeting matrix metalloproteinase 2 and PTEN. J Exp Clin Cancer Res. 2015;34:59
49. Zheng H, Li W, Wang Y. et al. MiR-23a inhibits E-cadherin expression and is regulated by AP-1 and NFAT4 complex during Fas-induced EMT in gastrointestinal cancer. Carcinogenesis. 2014;35:173-183
50. Jahid S, Sun J, Edwards RA. et al. MiR-23a promotes the transition from indolent to invasive colorectal cancer. Cancer Discov. 2012;2:540-553
51. Hatzl S, Geiger O, Kuepper MK. et al. Increased Expression of miR-23a Mediates a Loss of Expression in the RAF Kinase Inhibitor Protein RKIP. Cancer Res. 2016;76(12):3644-3354
52. Das SK, Bhutia SK, Sokhi UK. et al. Raf kinase inhibitor RKIP inhibits MDA-9/syntenin-mediated metastasis in melanoma. Cancer Res. 2012;72(23):6217-6226
53. Caltabiano R, Puzzo L, Barresi V. et al. Expression of Raf Kinase Inhibitor Protein (RKIP) is a predictor of uveal melanoma metastasis. Histol Histopathol. 2014;29(10):1325-1334
54. Yang Z, Wang XL, Bai R. et al. MiR-23a promotes IKKα expression but suppresses ST7L expression to contribute to the malignancy of epithelial ovarian cancer cells. Br J Cancer. 2016;115(6):731-740
55. Liu N, Sun YY, Zhang XW. et al. Oncogenic miR-23a in Pancreatic Ductal Adenocarcinogenesis Via Inhibiting APAF1. Dig Dis Sci. 2015;60(7):2000-2008
56. Wang G, Li B, Fu Y. et al. MiR-23a suppresses proliferation of osteosarcoma cells by targeting SATB1. Tumour Biol. 2015;36(6):4715-4721
57. Kenific CM, Thorburn A, Debnath J. Autophagy and metastasis: another double-edged sword. Curr Opin Cell Biol. 2010;22:241-245
58. Lazova R, Camp RL, Klump V. et al. Punctate LC3B expression is a common feature of solid tumors and associated with proliferation, metastasis, and poor outcome. Clin Cancer Res. 2012;18:370-379
59. Qiang L, Zhao B, Ming M. et al. Regulation of cell proliferation and migration by p62 through stabilization of Twist1. Proc Natl Acad Sci U S A. 2014;111:9241-9246
60. Liu H, He Z, von Rütte T. et al. Down-regulation of autophagy-related protein 5 (ATG5) contributes to the pathogenesis of early-stage cutaneous melanoma. Sci Transl Med. 2013;5:202ra123
61. Lock R, Kenific CM, Leidal AM. et al. Autophagy-dependent production of secreted factors facilitates oncogenic RAS-driven invasion. Cancer Discov. 2014;4:466-479
62. Schaffer BE, Levin RS, Hertz NT. et al. Identification of AMPK Phosphorylation Sites Reveals a Network of Proteins Involved in Cell Invasion and Facilitates Large-Scale Substrate Prediction. Cell Metab. 2015;22:907-21
63. Yan Y, Tsukamoto O, Nakano A. et al. Augmented AMPK activity inhibits cell migration by phosphorylating the novel substrate Pdlim5. Nat Commun. 2015;6:6137
64. Li X, Liu X, Xu W. et al. c-MYC-regulated miR-23a/24-2/27a cluster promotes mammary carcinoma cell invasion and hepatic metastasis by targeting Sprouty2. J Biol Chem. 2013;288(25):18121-18133
65. Zheng H, Li W, Wang Y. et al. MiR-23a inhibits E-cadherin expression and is regulated by AP-1 and NFAT4 complex during Fas-induced EMT in gastrointestinal cancer. Carcinogenesis. 2014;35(1):173-183
66. Wang B, Hsu SH, Frankel W. et al. Stat3-mediated activation of microRNA-23a suppresses gluconeogenesis in hepatocellular carcinoma by down-regulating glucose-6-phosphatase and peroxisome proliferator-activated receptor gamma, coactivator 1 alpha. Hepatology. 2012;56(1):186-197
67. Ross DA, Wilson GD. Expression of c-myc oncoprotein represents a new prognostic marker in cutaneous melanoma. Br J Surg. 1998;85(1):46-51
68. Kappelmann M, Bosserhoff A, Kuphal S. AP-1/c-Jun transcription factors: regulation and function in malignant melanoma. Eur J Cell Biol. 2014;93(1-2):76-81
69. Messina JL, Yu H, Riker AI. et al. Activated stat-3 in melanoma. Cancer Control. 2008;15(3):196-201
70. Ge R, Liu L, Dai W. et al. Xeroderma Pigmentosum Group A Promotes Autophagy to Facilitate Cisplatin Resistance in Melanoma Cells through the Activation of PARP1. J Invest Dermatol. 2016;136(6):1219-1228
Author contact
![]() Corresponding authors: Chunying Li, MD, PhD, Department of Dermatology, Xijing hospital, Fourth Military Medical University, Xi'an 710032, China; Phone: 86 29 8477 5406; Fax: 86 29 8477 5401; E-mail: lichyingedu.cn; or Qiong Shi, MD, PhD, Department of Dermatology, Xijing hospital, Fourth Military Medical University, Xi'an 710032, China; Phone: 86 29 8477 5406; Fax: 86 29 8477 5401; E-mail: qiong_shicom.
Corresponding authors: Chunying Li, MD, PhD, Department of Dermatology, Xijing hospital, Fourth Military Medical University, Xi'an 710032, China; Phone: 86 29 8477 5406; Fax: 86 29 8477 5401; E-mail: lichyingedu.cn; or Qiong Shi, MD, PhD, Department of Dermatology, Xijing hospital, Fourth Military Medical University, Xi'an 710032, China; Phone: 86 29 8477 5406; Fax: 86 29 8477 5401; E-mail: qiong_shicom.
Citation styles
APA
Guo, W., Wang, H., Yang, Y., Guo, S., Zhang, W., Liu, Y., Yi, X., Ma, J., Zhao, T., Liu, L., Jian, Z., Liu, L., Wang, G., Gao, T., Shi, Q., Li, C. (2017). Down-regulated miR-23a Contributes to the Metastasis of Cutaneous Melanoma by Promoting Autophagy. Theranostics, 7(8), 2231-2249. https://doi.org/10.7150/thno.18835.
ACS
Guo, W.; Wang, H.; Yang, Y.; Guo, S.; Zhang, W.; Liu, Y.; Yi, X.; Ma, J.; Zhao, T.; Liu, L.; Jian, Z.; Liu, L.; Wang, G.; Gao, T.; Shi, Q.; Li, C. Down-regulated miR-23a Contributes to the Metastasis of Cutaneous Melanoma by Promoting Autophagy. Theranostics 2017, 7 (8), 2231-2249. DOI: 10.7150/thno.18835.
NLM
Guo W, Wang H, Yang Y, Guo S, Zhang W, Liu Y, Yi X, Ma J, Zhao T, Liu L, Jian Z, Liu L, Wang G, Gao T, Shi Q, Li C. Down-regulated miR-23a Contributes to the Metastasis of Cutaneous Melanoma by Promoting Autophagy. Theranostics 2017; 7(8):2231-2249. doi:10.7150/thno.18835. https://www.thno.org/v07p2231.htm
CSE
Guo W, Wang H, Yang Y, Guo S, Zhang W, Liu Y, Yi X, Ma J, Zhao T, Liu L, Jian Z, Liu L, Wang G, Gao T, Shi Q, Li C. 2017. Down-regulated miR-23a Contributes to the Metastasis of Cutaneous Melanoma by Promoting Autophagy. Theranostics. 7(8):2231-2249.
This is an open access article distributed under the terms of the Creative Commons Attribution (CC BY-NC) license (https://creativecommons.org/licenses/by-nc/4.0/). See http://ivyspring.com/terms for full terms and conditions.