Theranostics
13.3
Impact Factor
- Current Issue
- Advance Articles
- Volume 16; 2026
- Volume 15; 2025
- Volume 14; 2024
- Volume 13; 2023
- Volume 12; 2022
- Archive
- Cover Images
- Cover Suggestion
- Special Issues
Top
Introduction
Materials and Methods
Results
Discussion
Supplementary Material
Acknowledgements
References
Introduction
Materials and Methods
Results
Discussion
Supplementary Material
Acknowledgements
References
International Journal of Biological Sciences
International Journal of Medical Sciences
 Global reach, higher impact

Theranostics 2017; 7(9):2402-2416. doi:10.7150/thno.17994 This issue Cite
Research Paper
In-depth Characterization of a TCR-specific Tracer for Sensitive Detection of Tumor-directed Transgenic T Cells by Immuno-PET
Nahid Yusufi1, Sabine Mall2, 3, Henrique de Oliveira Bianchi2, Katja Steiger4, 5, Sybille Reder1, Richard Klar2, Stefan Audehm2, Mona Mustafa1, Stephan Nekolla1, Christian Peschel2, 3, Markus Schwaiger1, 3, Angela M Krackhardt2, 3*, Calogero D`Alessandria1* ![]()
1. Department of Nuclear Medicine, Klinikum rechts der Isar, Technische Universität München, Germany;
2. III. Medical Department, Klinikum rechts der Isar, Technische Universität München, Germany;
3. German Cancer Consortium (DKTK), partner site Munich and German Cancer Research Center (DKFZ), Heidelberg, Germany;
4. Institute of Pathology Technische Universität München, Germany;
5. Comparative Experimental Pathology, Technische Universität München, Germany.
* Joint senior authorship
Received 2016-10-19; Accepted 2017-3-22; Published 2017-6-15
Citation:
Yusufi N, Mall S, Bianchi HdO, Steiger K, Reder S, Klar R, Audehm S, Mustafa M, Nekolla S, Peschel C, Schwaiger M, Krackhardt AM, D`Alessandria C. In-depth Characterization of a TCR-specific Tracer for Sensitive Detection of Tumor-directed Transgenic T Cells by Immuno-PET. Theranostics 2017; 7(9):2402-2416. doi:10.7150/thno.17994. https://www.thno.org/v07p2402.htm
Other stylesAbstract

A number of different technologies have been developed to monitor in vivo the distribution of gene-modified T cells used in immunotherapy. Nevertheless, in-depth characterization of novel approaches with respect to sensitivity and clinical applicability are so far missing. We have previously described a novel method to track engineered human T cells in tumors using 89Zr-Df-aTCRmu-F(ab')2 targeting the murinized part of the TCR beta domain (TCRmu) of a transgenic TCR. Here, we performed an in-depth in vitro characterization of the tracer in terms of antigen affinity, immunoreactivity, influence on T-cell functionality and stability in vitro and in vivo. Of particular interest, we have developed diverse experimental settings to quantify TCR-transgenic T cells in vivo. Local application of 89Zr-Df-aTCRmu-F(ab')2-labeled T cells in a spot-assay revealed signal detection down to approximately 1.8x10⁴ cells. In a more clinically relevant model, NSG mice were intravenously injected with different numbers of transgenic T cells, followed by injection of the 89Zr-Df-aTCRmu-F(ab')2 tracer, PET/CT imaging and subsequent ex vivo T-cell quantification in the tumor. Using this setting, we defined a comparable detection limit of 1.0x10⁴ T cells. PET signals correlated well to total numbers of transgenic T cells detected ex vivo independently of the engraftment rates observed in different individual experiments. Thus, these findings confirm the high sensitivity of our novel PET/CT T-cell tracking method and provide critical information about the quantity of transgenic T cells in the tumor environment suggesting our technology being highly suitable for further clinical translation.
Keywords: In vivo T-cell imaging, immuno-PET, T-cell quantification, cancer immunotherapy, T-cell receptor (TCR)-transgenic T cells.
Introduction
Adoptive transfer of T-cell receptor (TCR)-transduced T cells targeting tumor-associated or tumor-specific antigens represents a potent strategy to treat malignant diseases and has been already successfully applied in the clinic (1). Non-invasive in vivo imaging of T-cell trafficking is of high interest to reveal the homing sites, to elucidate the temporal and spatial distribution and ultimately to understand patterns of tumor rejection versus escape. For this purpose, cells of interest need to be labeled with appropriate markers to permit their detection in vivo. The use of radiolabeled antibodies or antibody-derived constructs for tracking murine T cells by immuno-Positron Emission Tomography (immuno-PET) has been applied for targeting either general T-cell markers as CD4 and CD8 (2, 3) or murine monoclonal TCR in mouse models (4). Nevertheless, these tracers are mouse specific and cannot be applied in humans. We have recently published the development of a novel highly sensitive F(ab')2-fragment-based imaging approach for mapping TCR-transgenic T cells within the tumor by small animal PET/CT (5). This approach, based on directly targeting a murine sequence introduced in the constant domain of the human TCR construct, has the advantage to be applicable to any TCR independent of the defined specificity. Here, we performed in-depth characterization of the tracer 89Zr-Df-aTCRmu-F(ab')2 in respect to binding properties, stability and radiation burden of the targeted T cells, revealing suitable features for the potential clinical translation of this strategy. Our studies included diverse quantification analyses of T cells and these were related to PET signals present at the target site. Thereby, we were able to prove a high sensitivity of this imaging approach in vivo. Thus, this imaging strategy represents a valuable tool as surrogate biomarker to predict the outcome of novel immunotherapeutic strategies using TCR-transgenic T cells.
Materials and Methods
Primary material and cell lines
Peripheral blood mononuclear cells (PBMC) were isolated from blood of informed and consenting donors as previously described (5) and according to requirements of the local ethical board and principles of the Helsinki Declaration. The genetically modified CD8+ central memory T cells (TCM) were isolated from PBMC and genetically modified by retroviral gene transfer of TCR2.5D6 and the near-infrared fluorescent protein (TCR2.5D6 iRFP) as described (5, 6). The in vitro and in vivo assays were conducted with following cell lines: the acute myeloid leukemia cell line ML2 (The CABRI consortium), the human IL15 producing NSO cells (kindly provided by S.R. Riddell, (7)), the TCRαβdeficient T-cell line Jurkat76 (8), transduced with the CD8 alpha chain (Jurkat76-CD8a; kindly provided by W. Uckert, Molecular Cell Biology and Gene Therapy, Max-Delbrück-Center for Molecular Medicine, Berlin, Germany) and the B cell hybridoma H57-597 (HB-218, ATCC). Transduction of Jurkat76-CD8a cells with TCR2.5D6 to obtain stable Jurkat76-CD8a 2.5D6, and ML2 cells transduced with HLA-B*07:02 or HLA-B*15:01 genes linked to enhanced GFP (eGFP) resulting in ML2-B7GFP (ML2-B7) and ML2-B15GFP (ML2-B15) cell lines, respectively, was performed as described (5). All cell lines were regularly tested for Mycoplasma infection (Venor GeM Mycoplasma Detection Kit, Minerva Biolabs), expression of transgenes or cell line specifying surface markers and HLA-typing.
Generation of the 89Zr-Df-aTCRmu-F(ab')2 tracer
Chromatographic analysis
(Radio)-size exclusion high performance liquid chromatography (SE-HPLC) was performed with a Yarra™ 3 µm SEC-3000 LC column (Phenomenex) using 0.05 M phosphate buffer and 0.15 M NaCl, pH 7.0 as mobile phase at an isocratic flow rate of 1.0 ml·min-1. UV-VIS profiles of the proteins were acquired at 280 nm and radioactive detection was performed via a GABI Star γ-detector (raytest). The chromatographic runs were carried out on a Shimadzu HPLC system and data were analyzed with the Chromeleon 6.8 chromatography data system software. Instant thin layer chromatography (ITLC) was performed on glass microfiber chromatography paper impregnated with silic acid (Agilent Technologies) using 0.1 M sodium citrate pH 5 as mobile phase. The read-out of the chromatography strips was performed using a radio-TLC-scanner (Bioscan, Eckert & Ziegler) and data were analyzed by the Bio-Chrom Lite software.
Anti-TCRmu full antibody and F(ab')2 preparation
The aTCRmu-IgG was affinity purified from the medium supernatant of H57-597 hybridoma cells (HB-218, ATCC) using Protein A-Sepharose column (GE Healthcare). The F(ab')2 fragment of the aTCRmu antibody was generated by pepsin digestion followed by protein A purification according to F(ab')2 Preparation Kit (Thermo Scientific Pierce™). The preparation was analyzed by SDS-PAGE gel electrophoresis under reducing and non-reducing conditions using 10% Tris-HCl Polyacrylamide gel for separation and SE-HPLC.
Conjugation and 89Zr labeling of aTCRmu-F(ab')2
The aTCRmu-F(ab')2, was functionalized by conjugation with the p-isothiocanatobenzyl derivate of desferrioxamine (DFO-Bz-NCS, Macrocyclics Inc., Richardson, TX) for subsequent labeling with zirconium-89 (89Zr; t/2=3.3 days; Emax β+=0.9 MeV). A 3-fold molar excess of the chelator was added to 2-3 mg protein in a total volume of 500 µl followed by incubation at 37 °C for 30 minutes. Purification of the immuno-conjugate from the unbound chelator was performed by size exclusion chromatography (Sephadex G-25 M, PD10 column, cut off >30 kDa, GE Healthcare) according to the protocol described by Perk et al. (9). The immunoconjugate concentration was determined by a Nanophotometer (Implem). The 89Zr-labeling of aTCRmu-F(ab')2 was performed based on the protocol of Vosjan et al. (10) with slight modifications. Briefly, 37.0 to 74.0 MBq of 89Zr in 1 M oxalic acid (BV Cyclotron VU, The Netherland) was adjusted to pH 7.0-7.2 with 2 M sodium carbonate and 0.5 M HEPES (pH 7.0) followed by addition of 100 to 250 µg DFO-aTCRmu-F(ab')2 and 0.5 M HEPES pH 7.0. After incubation of the mixture for 30 min at 37 °C, the 89Zr-Df-immunocomplex was purified using 0.25 M sodium acetate/gentisic acid 5 mg/ml buffer solution (pH 5.5) by size exclusion chromatography (Sephadex G-25M column, GE Healthcare) and radiochemical purity (RCP) was assessed by ITLC and radio-HPLC.
Characterization of the tracer
Binding affinity determination
To determine the dissociation constant (Kd) of the tracer, 3x10⁵ TCR2.5D6 iRFP TCM were incubated in triplicates in presence of different concentrations of 89Zr-Df-aTCRmu-F(ab')2. To measure the unspecific binding for each tracer concentration, cells were additionally incubated with a 100-fold molar excess of non-labeled aTCRmu-F(ab')2. After incubation for 1 h on ice and rinsing with PBS/1% BSA, the cell pellets were measured in a gamma counter (2480 Wizard2, PerkinElmer). Specific binding of the tracer was obtained by subtraction of unspecific binding from total tracer binding to the cells. The dissociation constant was calculated by plotting counts per minute values (cpm) versus tracer concentrations and non-linear regression analysis using the GraphPad Prism 5.01 software.
Immunoreactive fraction determination
The immunoreactivity of the 89Zr-labeled aTCRmu-F(ab')2 was assessed following the method described by Lindmo et al. (11), determining the fraction of immunoreactive tracer by linear extrapolation of tracer binding to conditions representing infinite antigen excess. Serial dilutions of TCR2.5D6 transduced Jurkat76-CD8α cells were prepared in triplicates containing 2.6x10⁶ to 8.13x10⁴ cells/well and incubated for 1 h on ice in human serum to block unspecific binding. Cell samples were incubated with 20 ng of 89Zr-Df-aTCRmu-F(ab')2 for 2 h on ice, while a 1000-fold excess of unlabeled aTCRmu-F(ab')2 was additionally added to the control group for determination of unspecific binding. The cells were rinsed twice with PBS/1% BSA and associated radioactivity was measured in a γ-counter. The obtained data were plotted as the quotient of background corrected total bound and specific bound activity versus the reciprocal of the cell concentrations. Linear regression analysis has been performed using GraphPad Prism 5.01 software. The Y-intercept resulted in the reciprocal of the percentage of the immunoreactive fraction.
In vitro stability analysis of 89Zr-Df-aTCRmu-F(ab')2
The stability of the 89Zr-Df-aTCRmu-F(ab')2 immunocomplex was investigated in vitro in human serum, PBS buffer solution (pH 7.0), 0.25 M sodium acetate/gentisic acid 5 mg/ml buffer solution (pH 5.5) and 50 mM diethylenetriaminepentaacetic acid (DTPA) solution, used as test medium. Therefore, 3.7 MBq (272 µl; SA: 7.9 µCi/µg) of the tracer was added to a total volume of 1 mL of test medium and incubated for up to 96 h at 37 °C. Every 24 h, samples from each test medium were spotted on ITLC silica gel strips and analyzed using 0.1 M sodium citrate pH 5.0 as mobile phase. The percentage of protein-bound activity at the retardation factor (Rf) 0.0-0.2 versus free 89Zr (Rf = 0.8) calculated by the Bio-Chrom Lite software.
In vivo stability analysis of 89Zr-Df-aTCRmu-F(ab')2
The in vivo stability of the radioimmunoconjugate was assessed in mice investigating the presence of intact tracer in the blood pool, kidneys and liver. For this purpose, 8.96 ± 0.39 MBq of 89Zr-Df-aTCRmu-F(ab')2 were injected in 3 groups of NOD.Cg-Prkdcscid Il2rgtm1Wjl/SzJ (NSG) mice (n=3) (Jackson Laboratory) and blood, kidney and liver homogenates were investigated by SDS-PAGE at 6, 24, and 48 h post injection. The presence of intact tracer in selected organs was displayed by exposing phosphorimaging plates (Fujifilm, FUJI) to the SDS-PAGE gels for 24 h followed by read-out with a Phosphor-imager (CR35 BIO, Dürr-Biomedical). Signal intensity in regions of interest (ROI) associated with intact tracer in the autoradiographs was analyzed by AIDA Image analyzer software.
Internalization of 89Zr-Df-aTCRmu-F(ab')2 in TCR2.5D6 iRFP TCM
To assess how the radioimmunoconjugate interact with the target cells, the ratios of internalized and cell membrane bound radiotracer in TCR2.5D6 iRFP TCM at different time points has been evaluated. Two groups of 1×10⁶ T cells/sample (in triplicates) were first pre-incubated in PBS/1% BSA for 1 h on ice, followed by incubation with 20 nM 89Zr-Df-aTCRmu-F(ab')2 for further 1 h on ice, in presence or absence of a 100-fold molar excess of unlabeled aTCRmu-IgG to determine non-specific binding. The unbound tracer was then removed after centrifugation at 500g for 5 min and the cells were transferred in serum-free T-cell medium for incubation at 37 °C for different time points (5, 15, 30, 60, 120 and 240 min). At the defined time points, cells were centrifuged and the supernatant (unbound fraction) and the fraction obtained before rinsing with serum-free T-cell medium were collected and pooled. The membrane-bound fraction was obtained by pooling the supernatant obtained by acidic washing using 0.05 M NaOAc in NaCl pH 2.0 and the rinsing fraction with the acid wash buffer. The T-cell pellets were finally treated in 1 M NaOH. The three fractions were counted for radioactivity in a gamma-counter (2480 Wizard2, PerkinElmer). The percentages of internalized, membrane-bound and total cell-associated activity of initially bound activity were plotted in GraphPad Prism 5.01 software.
Investigation of radiation-induced DNA double-strand breaks in T cells after tracer exposure in vitro
In order to investigate the impact of the radioactive tracer on DNA damage and viability of TCR2.5D6 iRFP TCM, DNA double-strand break (DSB) induction was monitored after exposure of the T cells to the radioactive tracer by measuring the expression of nuclear DSB-marker γH2AX. Two groups of TCR2.5D6 iRFP TCM (3x10⁴ cells/ml each sample) were incubated in triplicates with tracer activities ranging from 0 to 1000 µCi (0.0-37.0 MBq) for 1 h on ice. One group was immediately rinsed with PBS/1% FCS buffer and stained for dead cells using Ethidium Monoazide (EMA; ThermoFischer Scientific). Afterwards, cells were fixed and permeabilized using FIX & PERM kit (Invitrogen) followed by staining with anti-γH2AX-AlexaFluor488® antibody (Novus Biologicals). The other group was maintained in T-cell medium and incubated for further 48 h at 37 °C for assessing long term effects of tracer exposure. The stained cells were rinsed with PBS/1% FCS and analyzed by the LSR II Flow Cytometer system (BD Biosciences). As control group TCR2.5D6 iRFP TCM cells without tracer exposure were used.
Animal studies
All animal experiments were approved by local authorities (animal license 55.2-1-54-2532-52-14) and handled according to guidelines for the welfare and use of animals in cancer research experimentation. The acute myeloid sarcoma (AML) tumor model was used as representative cancer model as previously described (5). The expressed peptide MPO466 in the used acute myeloid cell line ML2 is recognized by the T cell receptor TCR2.5D6 (6).
Investigation of T cell damage after tracer exposure in vivo
For assessing γH2AX and cleaved Caspase-3 expression as markers for radiation damage in T cells being transferred in vivo and exposed to the radiotracer 89Zr-Df-aTCRmu-F(ab')2, NSG mice (Jackson Laboratory) (n=7) were inoculated on the right and left flank subcoutaneously (s.c.) with 1x10⁷ ML2-B7 tumor cells. After 8 days 20x106 TCR2.5D6 iRFP TCM were injected intravenously (i.v.). The mice were additionally injected intraperitoneally (i.p.) with 15x106 hIL-15 producing NSO cells to support TCM expansion and engraftment (previously irradiated with 80 Gray (Gy)). 3 days after adoptive T-cell transfer one group of animals (n=4) received 2.2 ± 0.1 MBq of the radiotracer 89Zr-Df-aTCRmu-F(ab')2 i.v., while the other group (control group; n=3) did not receive the radiotracer. After 2 (n=3), 4 (n=2) and 7 (n=2) days animals were sacrificed and tumors of both flanks were taken for further immunohistochemical (IHC) analysis for CD3, γH2AX and cleaved Caspase-3 as described below.
Evaluation of the detection limit using in vitro labeled transgenic T cells (spot model)
TCR2.5D6 iRFP TCM and non-transduced TCM (control) were co-incubated for 1 h on ice with 14.8 MBq of 89Zr-Df-aTCRmu-F(ab')2 and an excess of Hamster IgG2λ1 isotype antibody (BD Biosciences) to prevent unspecific binding of the tracer. After tracer washout, the cells were rinsed three times with cold PBS and viable cells were counted by trypan blue staining 0.4% (0,4%, Invitrogen) in a Neubauer hemocytometer. An aliquot of the radiolabeled TCR2.5D6 iRFP TCM and non-radiolabeled TCR2.5D6 iRFP TCM were stained in parallel for aTCRmu (anti-murine-TCRβ-FITC; BD Biosciences) and measured by flow cytometry (LSRII, BD Biosciences) to confirm blockade of the TCR2.5D6 binding sites by the radiotracer before s.c. injection. The pellets from the cell dilutions were measured in the gamma counter, mixed 1:1 with Matrigel™ (BD Biosciences) to a total volume of 50 µl, and were subcutaneously injected into the back of NSG mice (Jackson Laboratory), followed by immediate PET/CT scanning using an Inveon Small-Animal PET/CT device (Siemens). 40 min static PET/CT images were acquired using a 400-650 KeV window. Images were reconstructed by a 3-dimensional ordered subsets maximum a posteriori algorithm (OSEM3D/MAP) using 16 subsets and 18 iterations. The resulting matrix was 128 x 128 pixels with 159 transverse slices (voxel size 0.78 x 0.78 x 0.80 mm3). Data were normalized and corrected for randoms, dead time and decay with no correction for attenuation or scatter. No post-reconstruction filter was applied to retain the spatial resolution. For quantification of activity per volume in the cell spots, ROIs were drawn based on the CT image and data were depicted as Maximum intensity projection (MIP) of co-registered PET/CT images.
Investigation of the intratumoral detection limit of adoptively transferred transgenic T cells in vivo
The experimental setting is based on the tumor mouse model previously described (5). Briefly, 1x10⁷ ML2-B7 and ML2-B15 (control tumor) were inoculated s.c. into the right and left flank of NSG mice, respectively. 7 days after tumor inoculation mice were total body irradiated (TBI) with 1 Gy (Gulmay Irradiation Cabinet) to support the engraftment of the i.v. transferred TCR-transgenic TCM cells. At day 8 after tumor injection different numbers of TCR2.5D6 iRFP TCM or non-transduced TCM as control were injected i.v. in the tail vein. At the day of TCM transfer, mice were additionally injected i.p. with hIL-15 producing NSO cells (previously irradiated with 80 Gy). 3 days later, the radiotracer 89Zr-Df-aTCRmu-F(ab')2 was injected i.v. (2.13 ± 0.17MBq corresponding to 10-20 µg). PET/CT imaging was performed 48 h post 89Zr-Df-aTCRmu-F(ab')2 injection. At the day of imaging the mice were sacrificed, blood and organs were taken, weighed, and measured in the gamma-counter (2480 Wizard2, PerkinElmer) for biodistribution analysis. Tumor and organ uptake were expressed as percentage of injected dose per gram (%ID/g).
Tissue based T-cell quantification
To study the distribution and density of transgenic T cells in ML2-B7 tumors and to correlate this information to the PET signal, IHC analysis of tumor sections was performed. In brief, we injected different numbers of TCR2.5D6 iRFP TCM i.v. in ML2-B7 tumor bearing mice. 5 days after adoptive T-cell transfer, PET/CT imaging was performed and the number of tumor-infiltrated TCR2.5D6 iRFP TCM was evaluated subsequently by CD3 staining of centralized tissues slices of the ML2-B7 tumor as described below.
Immunohistochemistry
ML2-B7 tumors were fixed in 10% neutral-buffered formalin solution for minimum 24 h, dehydrated under standard conditions (Leica ASP300S, Wetzlar, Germany) and embedded in paraffin. Serial 2µm-thin sections prepared with a rotary microtome (HM355S, ThermoFisher Scientific, Waltham, USA) were collected and subjected to histological and immunohistochemical analysis. Hematoxylin-Eosin (H.-E.) staining was performed on deparaffinized sections with Eosin and Mayer's Haemalaun according to a standard protocol.
For IHC, slides were deparaffinized in xylene and rehydrated. After heat induced antigen retrieval (target retrieval solution, pH 6.0 (Dako, Glostrup, Denmark, S1699) and unspecific protein and peroxidase binding, IHC was performed with a Dako autostainer (Dako, Glostrup, Denmark) using antibodies against CD3 (clone SP7, DCS, Hamburg, Germany, CI597C01), γH2AX (clone 20E3, Cell Signaling, Danvers, USA, 9718) and cleaved Caspase-3 (Cell Signaling, Danvers, USA, 9661). For antibody detection, the Dako Envision-HRP rabbit labeled polymer (Dako, Glostrup, Denmark, K4003) was used and visualized with diaminobenzidine (DAB) (Medac Diagnostica, Wedel, Germany, BS04-500). Counterstaining was performed using hematoxylin and slides were dehydrated and coverslipped using Pertex® mounting medium (Histolab, Goeteborg, Sweden, 00801).
All slides were scanned with a Leica AT2 (Leica, Wetzlar, Germany) system to an e-slide manager database (Leica, Wetzlar, Germany) and evaluated with the Imagescope Software.
In order to detect double-strand breaks and apoptosis in tumor-infiltrating lymphocytes, consecutive slides visualizing γH2AX, cleaved Caspase-3 and CD3 expression were evaluated simultaneously. The number of positive pixels were evaluated with the positive pixel count algorithm (Leica, Wetzlar, Germany) after immunohistochemical staining for CD3.
Ex vivo quantification of tumor infiltrated TCM
To determine the absolute number of infiltrated and visualized TCR2.5D6 iRFP TCM, cell suspensions of the ML2-B7/ML2-B15 tumors were prepared by tissue homogenization using 40 µm cell strainer (BD Falcon™). Identification of engrafted TCR2.5D6 iRFP TCM in defined tissues was performed via flow cytometry analysis by staining the cell suspensions for the human leukocyte marker hCD45 and the T-cell marker hCD5 (J.33 and BL1a, both Beckman Coulter) and final gating for iRFP positive cells. The quantification of TCR2.5D6 iRFP TCM was carried out by adding 100 µl AccuCheck Counting Beads (Invitrogen) to 100 µl of pre-stained cell suspension. The samples were mixed well and measured by flow cytometry). Data were analyzed by FlowJo Software version 7.6.5 (TreeStar Inc., OR, USA). The absolute number of iRFP positive cells in the measured samples was calculated based on the cell counts of iRFP positive cells and the counts of the quantification beads according to the formula provided by the manufactures protocol. The result was extrapolated to the total volume of the whole cell sample. Image-derived signal quantification was performed using Inveon Research Workplace software (Siemens, Knoxville, TN), by drawing a ROI at the ML2-B7 tumor, to investigate the relation between quantified cell number and PET signal in the 3D-MIP view.
Statistical Analysis
Statistical analysis was performed using GraphPad Prism 5.01 software applying Mann-Whitney test with standard deviations (SD) as indicated in Figure legends.
Results
89Zr-Df-aTCRmu-F(ab')2 is produced with high labeling yields and specific activity
The purified anti-TCRmu antibody was obtained in high yields (37.5 mg/L) and F(ab')2 fragments were produced by pepsin digestion. SDS-PAGE analysis showed a distinct band of 70 kDa and bands with 20/25 kDa under non-reducing and reducing conditions, respectively (supplementary Figure S1A). SE-HPLC showed differences in retention time between anti-TCRmu antibody and F(ab')2 fragment (supplementary Figure S1B). The aTCRmu-F(ab')2 fragment was functionalized with the bifunctional chelator DFO-Bz-NCS (Macrocyclics Inc, Richardson, TX) according to the method provided by Perk et al. (9) and radiolabeling of DFO-aTCRmu-F(ab')2 with [89Zr]Zr-oxalate using a slightly modified protocol of Vosjan et al. (10) resulted in radiochemical yields of 97.0 ± 2.1% and RCP of 96.9 ± 2.1% as shown in the ITLC analysis (supplementary Figures S1C), and a specific activity of 7.0 ± 0.9 µCi/µg (259 ± 33.3 kBq/µg).
89Zr-Df-aTCRmu-F(ab')2 has a high binding affinity and is immunoreactive in vitro
89Zr-Df-aTCRmu-F(ab')2 has been tested for its binding affinity to transgenic TCR2.5D6 iRFP TCM in saturation cell binding assays. The generated saturation binding curves were characteristic for high affinity binding to a single class of antigen (Figure 1A), with an average dissociation constant in the nanomolar range (Kd = 4.64 ± 2.54x10⁻⁹ M). The Kd is comparable to the binding affinity of native aTCRmu-F(ab')2 (5.86x10⁻⁹ M) described by Mall et al. (5). The immunoreactive fraction of the 89Zr-Df-aTCRmu-F(ab')2 formulations was determined by in vitro cell assays performed on serial dilutions of TCR2.5D6-transduced Jurkat76-CD8a cells, in presence or absence of unmodified aTCRmu-F(ab')2. To calculate the immunoreactive fraction, a double inverse plot of total activity applied over specific binding ([TA]/[SB]) as function of the inverse cell concentration (1/[cells]) was employed. By linear regression of the values, the intercept at the ordinate which equals 1/r was determined, where r represents the immunoreactive fraction of the total amount of antibody. Under these conditions the average value for the immunoreactive fraction was 93.7 ± 2.55 % (Figure 1B).
89Zr-Df-aTCRmu-F(ab')2 is highly stable in vitro and in vivo
In vitro stability of 89Zr-Df-aTCRmu-F(ab')2 was tested in PBS buffer (pH 7.0), the storage buffer sodium acetate/gentisic acid (pH 5.0), human serum and DTPA (50 mM, pH 7.0) for up to 4 days at 37 °C. Tracer incubated in human serum, PBS and sodium acetate/gentisic acid revealed a decrease of lower than 3.5% in RCP over 4 days. In contrast, samples incubated in presence of 50 mM DTPA pH 7.0 showed a decrease of bound activity to 79% during 4 days, due to its ability to competitively chelate 89Zr4+ (Figure 1C). The high in vitro stability shown in this investigation makes the 89Zr-Df-aTCRmu-F(ab')2 suitable for the in vivo application. The in vivo stability of the 89Zr-Df-aTCRmu-F(ab')2 tracer has been investigated in NSG mice. Ex vivo assessment of intact tracer in blood, liver and kidneys at defined time points (6, 24 and 48 h) post i.v. injection showed high levels of stable tracer in the blood pool during the first 6 h, which decreases over the next 48 h due to elimination (Figure 1D and supplementary Figure S1D). These results showed that 89Zr-Df-aTCRmu-F(ab')2 is suitable for the in vivo imaging investigations performed in the subsequent experiments.
Internalization of 89Zr-Df-aTCRmu-F(ab')2 in TCR2.5D6 iRFP TCM
The internalization assay (Figure 1E) showed an early slow accumulation of 89Zr-Df-aTCRmu-F(ab')2 in TCR2.5D6 iRFP TCM corresponding to 3.6 ± 0.18% of the initial added activity after 5 minutes of incubation. At the same time point, the percentage of membrane bound activity was 14.5 ± 0.9%. Over the period of the next 240 min the percentage of internalized activity is doubling to 7.1 ± 0.13%, whereas the percentage of cell surface-associated activity decreases to 7.5 ± 0.5%. Over 240 minutes a portion of only 3.5% of overall cell associated activity in TCR2.5D6 iRFP TCM got released to the supernatant.
Figure 1
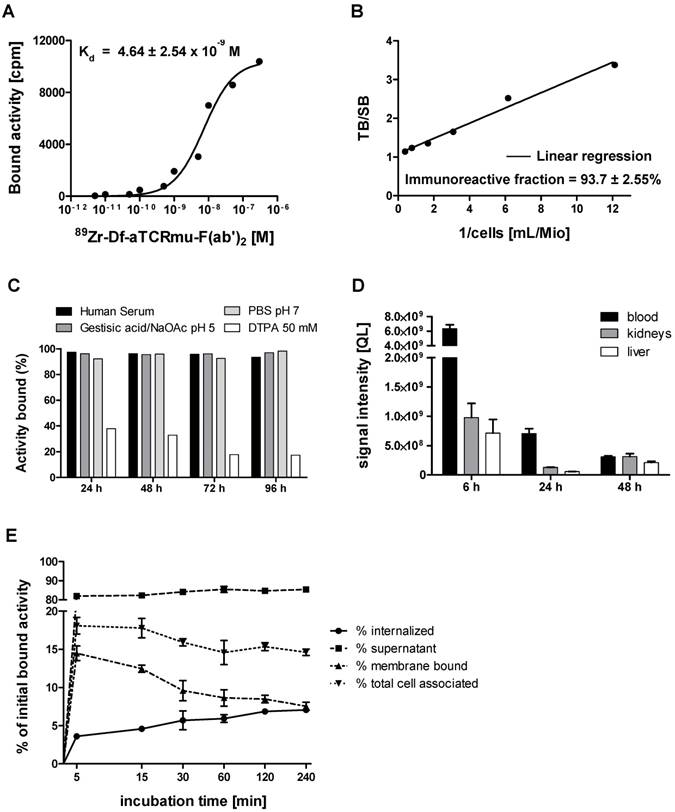
In vitro and in vivo characterization of 89Zr-Df-aTCRmu-F(ab')2 (A) Determination of the dissociation constant (Kd) of 89Zr-Df-aTCRmu-F(ab')2 by saturation binding assays performed on TCR2.5D6 iRFP TCM. The Kd was calculated by non-linear regression analysis and is shown as mean ± SD. (n=4). (B) Determination of the immunoreactive fraction of the radiotracer using serial dilutions of TCR2.5D6-transduced Jurkat76 cells. The y-intercept of the linear regression yields the percentage of the immunoreactive fraction shown here as mean ± SD. (n=3). (C) In vitro evaluation of tracer stability in different media at indicated time points shown as percentage of bound activity after incubation. (D) In vivo stability analysis of the radiotracer post intravenous injection in NSG mice at defined time points (n=3) in blood, kidneys and liver. Organ suspensions were investigated by SDS-PAGE, for the presence of intact tracer. ROIs were drawn and the signal intensities were calculated and reported as quantum level values (QL). (E) Internalization assay of 89Zr-Df-aTCRmu-F(ab')2 in TCR2.5D6 iRFP TCM over 240 min. TCR2.5D6 iRFP TCM were incubated with 20 nM 89Zr-Df-aTCRmu-F(ab')2 for defined time points. Fractions representing unbound (supernatant), membrane bound and internalized activity were collected and are shown as percentage (%) of initially bound activity. Total cell associated activity is presented as sum of internalized and membrane bound radiotracer. Mean ± SD of triplicates are shown.
Exposure of TCR2.5D6 iRFP TCM to 89Zr-Df-aTCRmu-F(ab')2 leads to double-strand breaks (DSBs) and cell death only at higher activities
Since the 89Zr-Df-aTCRmu-F(ab')2 tracer is designated for the diagnostic purpose as a surrogate marker of TCR-transgenic T cells in vivo, radiation-induced DNA double-strand breaks (DSB) induced by binding of the 89Zr-labeled probe was evaluated. The DNA DSB was characterized via detection of the phosphorylated form of the histone γH2AX (12). Functional cells are able to repair double strand breaks caused by ionizing radiation within 30-60 min (13, 14), whereas a fraction of DSB persists at high doses and causes enhanced cell death. Therefore, TCR-transduced TCM were exposed to 89Zr-Df-aTCRmu-F(ab')2 activities ranging from 0 to 1000 µCi (0.0 to 37.0 MBq) for 1 h and were assessed for potential induction of DNA damage and cell death via simultaneous γH2AX and dead cell staining at early time point and after a regeneration time of 48 h. After incubation with the tracer for 1 h we detected enhanced γH2AX expression of 6.1 ± 4,7% when cells were incubated with activities higher than 200 µCi, further increasing at doses of 500 and 1000 µCi with 12.7 ± 3.1% or 27.7 ± 13.5%, respectively (Figure 2A). The sample group incubated with the tracer for 48 h did not show increased γH2AX formation in any activity group. Determination of dead cells via EMA staining directly after 1 h tracer exposure didn't reveal elevated cell death. In contrast, TCR2.5D6 iRFP TCM exposed to tracer activities of 500 and 1000 µCi for 48 h resulted in 4 to 5 times more dead cells than the basic level of non-radiated samples (Figure 2B). On the tissue-level, a high number of tumor-infiltrating T cells were detected 48 h after injection of 2.2 MBq 89Zr-Df-aTCRmu-F(ab')2 (Fig. 2B). While tumor cells expressed γH2AX and cleaved Caspase-3 at high frequencies, no enhanced DSB were observed within the tumor-infiltrating T cells.
Figure 2
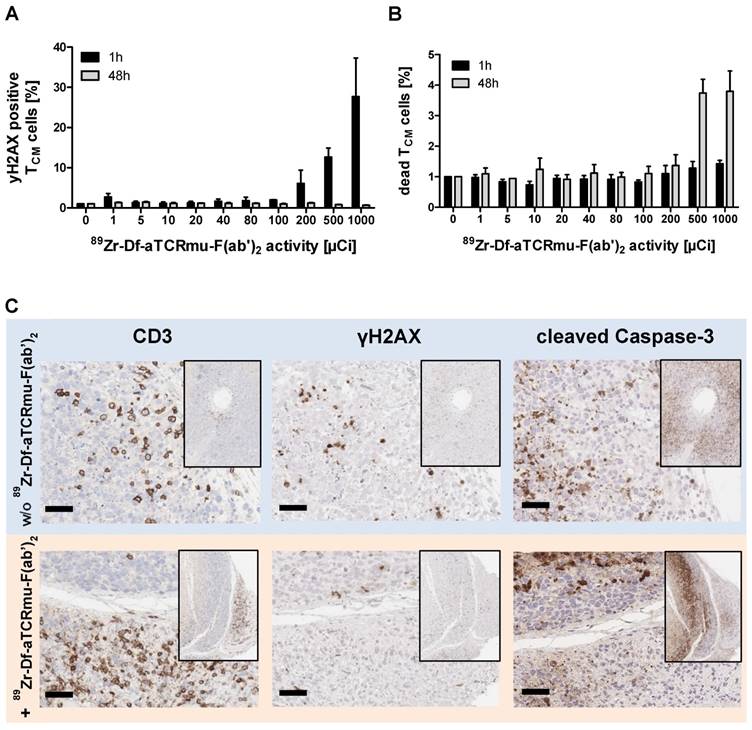
Impact of 89Zr-Df-aTCRmu-F(ab')2 radiation on TCR2.5D6 iRFP TCM (A) Percentage of γH2AX-positive TCR2.5D6 iRFP TCM after 1 h and 48 h of co-incubation with activities of 0 to 1000 µCi (0.0 to 37.0 MBq) 89Zr-Df-aTCRmu-F(ab')2. Mean ± SD of triplicates are shown. (B) Percentage of EMA-positive (dead) TCR2.5D6 iRFP TCM measured 1 h and 48 h after radiotracer exposure at activities of 0 to 1000 µCi (0.0 to 37.0 MBq). Mean ± SD of triplicates are shown. (C) IHC analysis of TCR2.5D6 iRFP TCM infiltrated ML2-B7 tumors after 48 h exposure to 2.2 ± 0.1 MBq i.v. injected 89Zr-Df-aTCRmu-F(ab'). Representative IHC stainings against anti human-CD3, γH2AX and cleaved Caspase-3 of T-cell infiltrated ML2-B7 tumor tissues treated with (lower panel; n=4) and without (upper panel; n=2) radiotracer. Magnification 20X, scale bars equals to 50 µm.
Determination of the detection limit of in vitro 89Zr-Df-aTCRmu-F(ab')2 labeled TCR2.5D6 iRFP TCM by small animal PET
For determining the minimum number of TCR2.5D6 iRFP TCM that can be imaged in vivo by targeting them with 89Zr-Df-aTCRmu-F(ab')2, we established a so-called “spot model” in vivo. To this purpose, serial dilutions of labeled TCR2.5D6 iRFP TCM have been prepared and subcutaneously co-injected with Matrigel™ (BD Biosciences). After in vitro incubation with the tracer, rinsed TCR2.5D6 iRFP TCM showed binding of the aTCRmu antibody (supplementary Figure S2A) and proper dilution of the labeled cells was controlled by γ-counter measurement (supplementary Figure S2B). PET/CT images of animals in the first group, receiving 5x10⁶ to 1.5x10⁵ cell spots, showed prominent signals of the spots up to the lowest dilution of 1.5x10⁵ labeled cells. In contrast, only non-specific background signals were visualized in mice injected with labeled non-transduced TCM due to residual unspecific binding of the radio-tracer to the TCM detectable when higher cell numbers (>1.25x10⁶) were implanted. Image noise is visible due to low number of acquired events, associated to the low implanted activities, during the PET scans (Figure 3A I). Images of the second group, receiving further dilutions from 1.5x10⁵ to 4.7x10³ labeled cells, indicate a detection limit of approximately 1.8x10⁴ in vitro labeled TCR2.5D6 iRFP TCM. For these dilutions, the control group did not reveal any unspecific signal (Figure 3AII). Analysis of the single cell spots by region of interest (ROI) quantification confirmed the steady decrease of activity per labeled TCR2.5D6 iRFP TCM cell spots in both groups (Figure 3B).
In vivo quantification of engrafted TCR2.5D6 iRFP TCM at the tumor site
We next aimed to determine the limit of detection of TCR2.5D6 iRFP TCM in a more clinically relevant model (5) and to provide an estimation of the number of TCR-transduced T cells present in the tumor environment by PET/CT. Therefore, ML2-B7 (right flank) and ML2-B15 (left flank) tumor bearing NSG mice were injected i.v. with different numbers of TCR2.5D6 iRFP TCM ranging from 3x10⁶ to 3x10⁵ TCR-transduced T cells and were compared to animals injected with 5x10⁶ non-transduced TCM. Five days after adoptive T-cell transfer, PET/CT imaging was performed (supplementary Figure S3A), followed by ex vivo biodistribution analysis (supplementary Figure S3B) and TCR2.5D6 iRFP TCM quantification at ML2-B7 and ML2-B15.
Figure 3
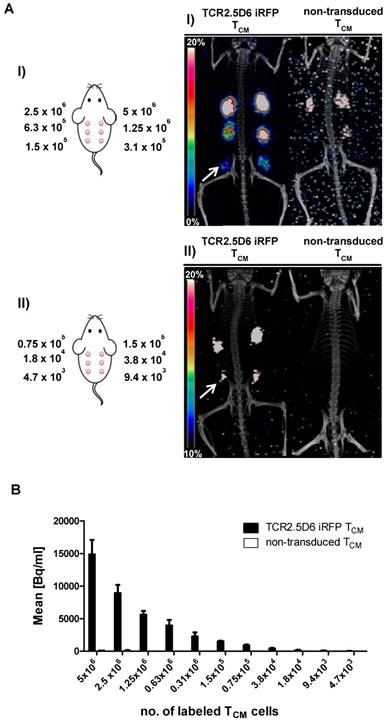
Detection limit assessment of in vitro 89Zr-Df-aTCRmu-F(ab')2-labeled TCR2.5D6 iRFP TCM by small animal PET/CT (A) In vitro 89Zr-Df-aTCRmu-F(ab')2 labeled TCR2.5D6 iRFP TCM and non-transduced TCM were mixed with Matrigel™ and s.c. injected in mice using dilutions ranging from 5x10⁶ to 1.5x10⁵ (I) or 1.5x10⁵ to 4.7x10³ (II) labeled TCR2.5D6 iRFP TCM and non-transduced TCM. The representative 3D-PET/CT Maximum Imaging Projection images (MIP) are shown at the scale 0-20% of injected dose per gram (%ID/g) for group I and 10-20% of %ID/g for group II to allow visualization of low dilutions without noise signal. The white arrows indicate the highest dilution of detectable TCR2.5D6 iRFP TCM in the respective groups. (B) Quantitative region of interest (ROI) analysis of the single injected cell spots, shown as mean activity (Bq/ml) ± SD. (A-B) One representative image of mice injected with labeled TCR2.5D6 iRFP TCM (n=3) for group (I) and group (II) and for non-transduced TCM (n=2) for both groups is shown. Data of one out of two experiments are shown for both groups.
We detected a strong distinct signal at the ML2-B7 tumor site in the group with the strongest T-cell engraftment, receiving the highest number of TCR2.5D6 iRFP TCM in this experiment (Figure 4A, I; 3x10⁶), and a high ML2-B7 tumor-to-muscle ratio of 10.9 ± 1.8 (supplementary Figure S3C). The PET-signal at ML2-B7 was reduced when lower T-cell concentrations were injected (Figure 4A, II; 1.5x10⁶). Animals injected with lower numbers of T cells showed clearly reduced T-cell engraftment in these experiments and the tumor-to-muscle ratio was 6.4 ± 1.4 (supplementary Figure S3C). Very low PET-signals were detected at the ML2-B7 tumor site in these animals indistinguishable from background activity (Figure 4A, III and IV and supplementary Figure S3C). Ex vivo gamma counting of the tumors showed high activity within the ML2-B7 tumors of mice injected with 3x10⁶ cells (6.6 ± 1.2 %ID/g), decreasing in every group to levels comparable to the control group injected with 5x10⁶ non-transduced TCM or the ML2-B15 tumor (< 2.1 %ID/g) (Figure 4B).
Figure 4
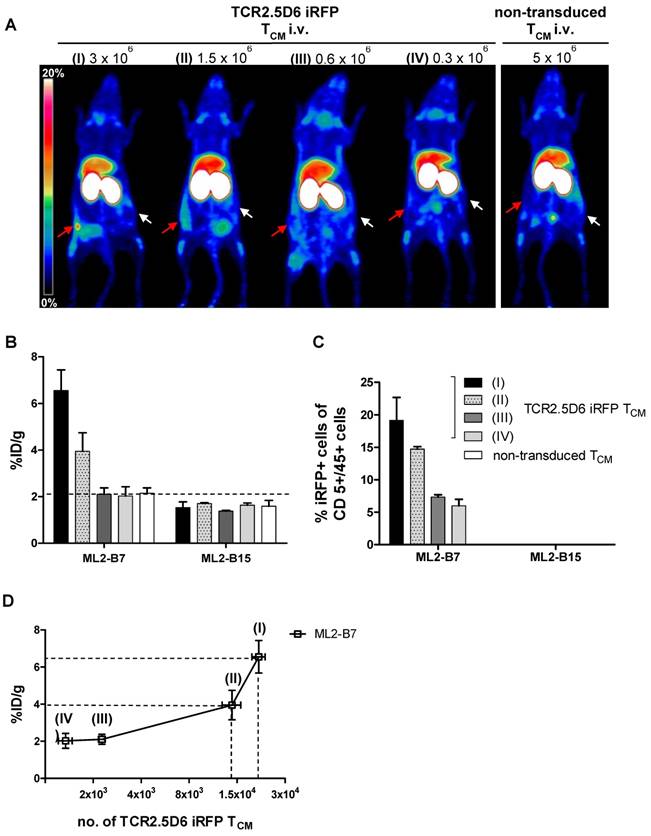
Evaluation of the detection limit of TCR2.5D6 iRFP TCM in vivo by PET imaging and correlation to the quantification of transduced T cells by flow cytometry analysis (A) Representative 3D-PET (MIP) images of animal groups (I) to (IV) (n=2 for group I and IV, n=3 for group II and III) injected with decreasing numbers of TCR2.5D6 iRFP TCM (3x10⁶ to 0.3x10⁶) or non-transduced TCM (5x10⁶) (n=2). The red arrows indicate the signal at the ML2-B7 tumor and white arrows show the control tumor ML2-B15. Scale bar 0-20 %ID/g. (B) The quantitative evaluation of activity accumulation in ML2-B7 and ML2-B15 tumors 48 h after injection of 89Zr-aTCRmu-F(ab')2 by ex vivo biodistribution analysis is shown. Mean ± SD of %ID/g are depicted for the animal groups (n=2 for group I and IV, n=3 for group II and III). The dashed line indicates background level of activity accumulation. (C) Ex vivo flow cytometry analysis of engrafted TCR2.5D6 iRFP TCM at ML2-B7 and ML2-B15 tumors expressed as percentage (%) of iRFP positive cells out of hCD5/hCD45 positive cells is shown for indicated tumor samples. Mean % of iRFP positive cells are shown for the described animal groups (n=2 for group I and IV, n=3 for group II and III). (D) Correlation of detected total numbers of TCR2.5D6 iRFP TCM within ML2-B7 tumors and the %ID/g in the animal groups (I) to (IV). Ranges between dashed lines indicate the detection limit of TCR2.5D6 iRFP TCM and related activity uptake, where mean of %ID/g and total number of TCR2.5D6 iRFP TCM detected by flow cytometry analysis are shown.
Ex vivo quantification of tumor infiltrated TCM
TCR2.5D6 iRFP TCM were detected in respective tumors by ex vivo flow cytometry analysis (supplementary Figure S3D). Investigation for iRFP expressing cells confirmed the decrease of detectable TCR-transduced T cells in groups infused with decreasing numbers of T cells (Figure 4C), whereas no TCR2.5D6 iRFP TCM was found at the control tumor site ML2-B15 (Figure 4C). Quantification of TCR2.5D6 iRFP TCM in the whole tissue samples revealed in average a total number of approximately 2.0x10⁴ TCR-transduced T cells in the first group (I) and 1.2x10⁴ cells in the second group (II) within the ML2-B7 tumor (Figure 4D). In the groups receiving further dilutions (III and IV), we detected only a very low number of TCR2.5D6 iRFP TCM (<3.0x10³).
The number of iRFP positive T cells bears relation to the tracer uptake expressed as %ID/g (Figure 4D). Comparing these findings with the MIP images (I) to (IV) (Figure 4A), a technical detection limit of TCR2.5D6 iRFP TCM can be set between approximately 1.0x10⁴ to 2.0x10⁴ cells.
We observed an equal low detection limit in four different experiments, by involving different donors for the generation of TCR2.5D6 iRFP TCM. Remarkably, in every experiment the T-cell engraftment was different, however numbers of TCR2.5D6 iRFP TCM detected in the ML2-B7 tumor corresponded well to the PET signal (Figure 5A-B). In group (I) PET signals at the ML2-B7 tumor were prominent but of different intensities in different experiments, dependent from the number of engrafted TCR2.5D6 iRFP TCM in the tumor, ranging from 2.2x10⁴ to 6.2x10⁵ cells as quantified ex vivo. In group (II) less TCR2.5D6 iRFP TCM at the ML2-B7 tumor site could be found (2.0x10³ to 1.9x10⁴), revealing no specific PET signal (upper and middle panel), but a marginal specific signal at a related cell number of 1.9x10⁴ (lower panel). In the ML2-B7 tumors of group (III) and in all the ML2-B15 tumors, the quantified TCR2.5D6 iRFP TCM numbers were low (<6.0x10³) without associated distinctive PET signal. Image-derived signal quantification analysis in the ML2-B7 tumor provided mean activity values (Bq/ml) higher than the background level measured in the control groups (Ctrl) injected with non-transduced T cells, which correspond to the determined T-cell numbers and PET signals in group (I) to (III) (Figure 5C and supplementary Figure S4A-C).
According to the different engraftment of the transferred TCR2.5D6 iRFP TCM, ex vivo analyzed ML2-B7 tumors (n=43) can be classified based on strength of T-cell infiltration (Figure 5D) and their corresponding tracer accumulation (Figure 5E and 5F). In the classified group 1 (n=9), T-cell infiltration of > 20.000 T-cells corresponds to an activity accumulation of 6.18 ± 1.7 %ID/g and 60.066 ± 11.616 Bq/ml being significantly higher than accumulation in the classified group 4 (control group), where non-transduced TCM were transferred. A distinct PET signals was associated to this group, as shown in group (I) in Figure 5B. Classified group 2 (n=5) included tumors infiltrated in the middle range with 10.000 - 20.000 T cells, where the detection limit was set. Here activity accumulation still significantly differed from non-infiltrated tumors (classified group 4). Classified group 3 (n=29), T-cell infiltration < 10.000, did not reveal a difference in activity accumulation and signal intensity in the MIP view compared to the control group. Thus, the detection limit can be set to 10.000 to 20.000 cells by this biological relevant experiment which is similar to the detection limit determined by the spot assay.
Tissue based immunohistochemical analysis
The number of T cells quantified in ML2-B7 tumors deriving from four experiments (n=43) show correlation to the corresponding %ID/g of the biodistribution and the image-derived activity accumulation (Bq/ml) (supplementary Figure S5A and B). By IHC based analyses we were able to relate the detection limit of the PET signal (Figure 6A) with number of T cells within the tumor tissues (Figure 6B-C). On the tissue-level, a strong PET signal corresponded to high rate of CD3 positive cells, which is supported by the counts of positive pixel/mm2 (upper panel). T cells were still present in the tissue at a marginal specific PET signal, associated with a lower number of corresponding pixels per area (middle). In PET images lacking specific signals, only very few T cells were detectable and this was related to a low number of pixel/mm2 (lower panel).
Discussion
In the contest of adoptive immunotherapy, the ability to determine in vivo the migration, distribution, location and number of biological active effector cells is crucial for both the development of cell-based personalized therapies and for the elucidation of biological mechanisms in basic oncological research (15). Different imaging modalities have been proposed so far to follow and quantify cell trafficking in vivo, like bioluminescence, PET and MRI imaging (16-18). Mezzanote et al. showed a bioluminescence signal-detection limit of approximately 5x10³ cells, after s.c. implantation of different numbers of pTurboLuc-transfected cells (16). However, the low tissue penetration of the emitting light and the poor spatial resolution makes this modality not feasible for in vivo T-cell tracking and visualization in deeper tissue. In contrast, MRI is depth-independent and allows whole-body scanning due to its high spatial resolution (15) and Kircher et al. provided a detection limit of 3x10⁴ using in vitro labeled T cells with CLIO nanoparticles (19). An even lower detection limit, approximately 1x10³ labeled T cells, using self-assembling nanocomplexes was achieved after intracerebral implantation and MRI imaging (20). Despite the high sensitivity of this method, the implementation is restricted to directly labeled cells and doesn't consider T-cell expansion in vivo leading to an underestimation of the actual amount of effector cells and measurement at later time points after adoptive T-cell transfer is not feasible. Likewise, PET imaging provides exceptional sensitivity in the picomolar tracer concentration range and can reveal dynamic processes with a temporal resolution of several seconds (21). Although PET represents the most appropriate tool to track radiolabeled cells in vivo (22, 23), quantitation of T cells still remains a challenge. In the present work, we have combined an in-depth characterization of the aTCRmu-F(ab')2-fragment labeled with Zr-89 specifically recognizing TCR-transgenic T cells in vivo with the investigation of detection limit of tumor infiltrated T cells.
We have demonstrated a highly sensitive detection of transgenic T cells of up to 1x10⁴-2x10⁴ cells by development and application of two complementary in vivo assays. Applying the “in vivo spot model”, serial dilutions of in vitro labeled TCR2.5D6 iRFP TCM spots were visualized via an animal PET/CT scanner using the 89Zr-Df-aTCRmu-F(ab')2 up to 1.8x10⁴ cells. Low background activity associated to unspecific binding of the tracer was observed in groups implanted with dilutions of non-transduced T cells. The background activities were accompanied by noise signals, which is typical for PET image acquisition in presence of low activities. However, this model does not reflect the physiological migration of T cells to the tumor site and subsequent tumor infiltration. Therefore, we established a more biologically relevant in vivo model by intravenous injection of different dilutions of TCR-transgenic TCM followed by in vivo labeling via i.v. injected 89Zr-Df-aTCRmu-F(ab')2. Using this approach we specifically detected 1.0x10⁴ to 2.0x10⁴ cells as technical detection limit of TCR2.5D6 iRFP TCM at the tumor site, similar to the results obtained by the spot assay.
The results have been confirmed in four individual experiments although the engraftment of injected TCR2.5D6 iRFP TCM substantially differed in the four experiments. This result is of crucial importance as it reflects the clinical reality. For instances, detection of T cells genetically modified by chimeric antigen receptors (CAR) has been demonstrated to be highly individual in different patients independent on the equal quantity of T cells which has been transferred (24). In contrast, we found a strong correlation between TCR2.5D6 iRFP TCM quantified by flow cytometry ex vivo in depicted tissues and probe accumulation visible in the PET images. Moreover, tissue based IHC analysis confirmed that a strong PET signal (high ID%/g or Bq/ml) corresponds to high rate of CD3+ cells in tumor tissue sections, supported by the counts of CD3+ pixels/mm2, whereas less pixels were detectable as the PET signal is fading.
The penetration and distribution of the tracer plays also a crucial role in terms of sensitivity of the methodology. For example, background levels at non-targeted tissue may play a role in our studies due to the enhanced permeability and retention (EPR) effect caused by the high molecular weight of F(ab')2 fragments (25), which in turn increase also the exposure time of the cells to the tracer. In our case, the best image quality using 89Zr-Df-aTCRmu-F(ab')2 was obtained after 48 h (5). The choice of a smaller targeting molecule is a crucial step for optimization of image quality and time, as well as radiation burden (4, 26-28).
In comparison with other PET-imaging approaches applying e.g. reporter genes like HSV-TK (29), our quantitation method uses a tracer which binds directly to the primary transgene, that is not influenced by the replication stage of the transgenic cells [2]. Using HSV-TK transgenic lymphocytes, Koehne et al. only showed a relative percentage of T-cell infiltration versus activity accumulation in the tumor but not a comparative observation between gained PET-imaging signal and the actual number of effector cells (29). A more precise estimation of effector cells has been shown by intratumoral and intravenous injection of hNET-transgenic T cells in mice, revealing a detection limit of 1x10⁴ cells (30), which confirms the sensitivity of Immuno-PET imaging in our studies. However, the introduction of a reporter gene bears the risk of additional background activity and other technical as well as regulatory challenges associated to the transduction of an additional gene.
In our studies, 89Zr-Df-aTCRmu-F(ab')2 demonstrated excellent qualities in terms of radiochemical yield and purity, specific activity and stability over the time, high binding affinity and retained immunoreactivity, which are important preconditions for clinical translation of our methodology. In this respect, lack of radioactivity-induced damage to T cells is also of critical importance. An enhancement of γH2AX detection as well as increase of dead cells was measured in vitro for activities higher than 200 µCi, further increasing at doses of 500 and 1000 µCi in comparison to the control group. The IHC analysis of T-cell infiltrated tumor sections of tumor bearing NSG mice also revealed no signs of DNA damage at 48 h after radiotracer injection. The use of a partially murinized TCR as target for our immuno-imaging approach may induce immune responses, when transferred in clinical application, resulting in early rejection of TCR-transgenic T cells. Patients treated with murine TCR transgenic lymphocytes developed antibodies against the variable domains of a murine TCR, however this didn't affect persistence of transgenic cells and response to therapy (31). On the other hand, we are convinced that it will be really interesting to investigate if the sensitivity reached by the proposed imaging approach can be applied to other T-cell markers, e.g. pan-T-cell markers.
Figure 5
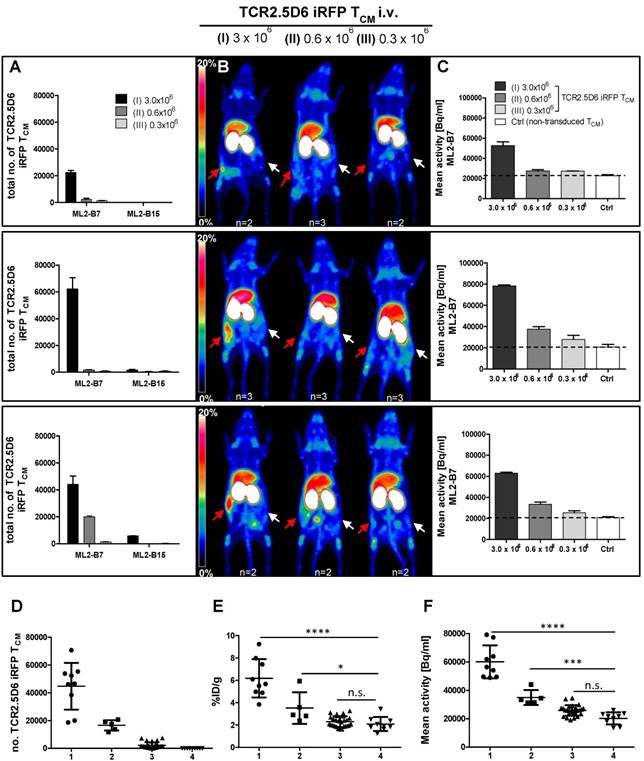
Correlation of TCR2.5D6 iRFP TCM numbers and PET signal in vivo in experiments with different engraftment rates (A) Total numbers of TCR2.5D6 iRFP TCM as determined ex vivo by flow cytometry quantification in ML2-B7 and ML2-B15 tumors in three from four individual experiments injected with 3.0x10⁶ (I), 0.6x10⁶ (II) and 0.3x10⁶ (III) TCR2.5D6 iRFP TCM. (B) Representative 3D-PET (MIP) images in respective three individual experiments injected with 3.0x10⁶, 0.6x10⁶ and 0.3x10⁶ TCR2.5D6 iRFP TCM. Red arrows indicate the PET signal at the ML2-B7 tumors and white arrows show the control tumor ML2-B15. Scale bars 0-20 %ID/g. (C) Quantitative ROI analysis of ML2-B7 tumors in three individual experiments with 3 animal groups injected with 3.0x10⁶, 0.6x10⁶ and 0.3x10⁶ TCR2.5D6 iRFP TCM depicting activity signals related to respective PET images. Mean activity [Bq/ml] of ROI analysis is shown as mean ± SD. Dotted lines indicate the level of background activities based on the control groups (n=2) in the three experiments injected with 5.0x10⁶ non-transduced TCM (Ctrl). (A-C) The upper, middle and lower panels represent one of the three individual experiments. (D-F) Classified groups (group 1: n=9, >20.000 cells [●]; group 2: n=5, 10.000-20.000 cells [■]; group 3: n=29, <10.000 [▲]) of total number of TCR2.5D6 iRFP TCM with corresponding %ID/g and image-based mean activity (Bq/ml) detected in the ML2-B7 tumors derived from four experiments. Classified group 4 (n=9, [▼]) consists of ML2-B7 tumors in mice treated with non-transduced TCM (Control group). Mann-Whitney test; ****, P < 0.0001; ***, P < 0.01; *, P < 0.05; n.s, non-significant.
Figure 6
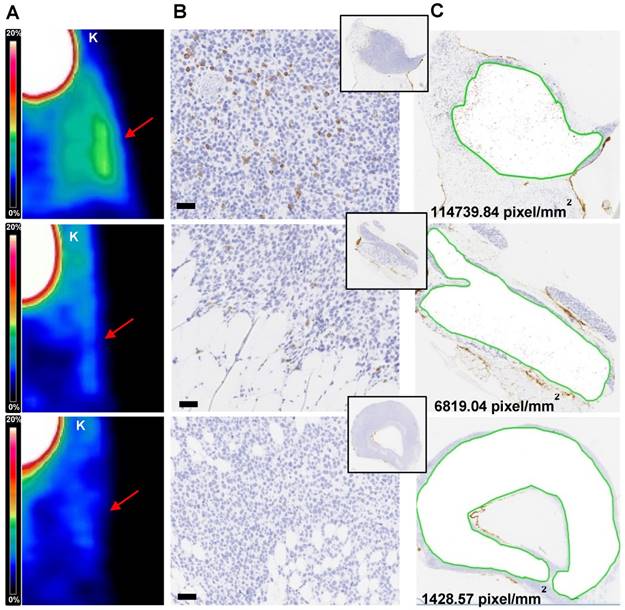
Immunohistochemical analysis of TCR2.5D6 iRFP TCM infiltrated ML2-B7 tumors Quantitative IHC analysis of TCR2.5D6 iRFP TCM infiltrated ML2-B7 tumors after PET/CT imaging. (A) Representative 3D-PET (MIP) images of ML2-B7 tumors (n=3) with different infiltration rates and (B) corresponding IHC for CD3. Red arrows in the 3D PET-images indicate the ML2-B7 tumors. (C) Quantitative analysis of positive CD3 positive pixel based on the tissue area from the CD3 stainings. Magnification 20X, scale bar equals to 50 µm. PET scale bar 0-20 %ID/g. K=kidney.
In conclusion, using our imaging approach and 89Zr-Df-aTCRmu-F(ab')2 as tracer, we are able to sensitively estimate the level of T-cell engraftment and tumor infiltration after adoptive transfer of TCR-transgenic T cells. Our imaging approach may be of great utility for establishment of sensitive quantification algorithms of human transgenic T cells in preclinical models highly relevant with respect to heterogeneous engraftment observed in our model. This approach is therefore of high relevance for understanding pharmacodynamics and pharmacokinetics of T cell-based immunotherapies and may be used for the development of relevant surrogate biomarkers in adoptive T-cell therapy using TCR-transgenic T cells.
Supplementary Material
Supplementary figures.
Acknowledgements
The authors thank Markus Mittelhäuser, Marco Lehman, Jorge Cabello, Stephanie Rämisch Marion Mielke, Olga Seelbach and Irina Fuchs for excellent technical support and we also thank S.R. Riddell for providing the NSO-IL15 cell line.
Funding
This work was supported by a grant from the Deutsche Forschungsgemeinschaft (SFB824/C10 and Z2), funded to A.M.K. and C.D. and K.S., respectively. This work was also partially supported by a Brazilian National Council for Scientific and Technological Development (CNPq-Brazil) fellowship to H.d.O.B. [process number 246708/2012-3].
Authors' Contributions
N. Yusufi: conception and design of the studies together with S. Mall, A.M. Krackhardt, C. D'Alessandria. N. Yusufi: tracer development, radiolabeling and in vitro and in vivo characterization studies; flow cytometry experiments, animal experiments, data acquisition and analysis. S. Mall: transduction of T cells, flow cytometry experiments, all animal experiments. H. Bianchi: experimental support in i.v. injection of mice, maintenance of mice. K. Steiger: tissue based analyses and evaluation. S. Reder: radiotracer i.v. injections of mice, small animal PET/CT scanning. R. Klar: experimental support in i.v. injection of mice. S. Audehm: T cell transduction. N. Yusufi, S. Mall, S. Nekolla, M. Mustafa, A.M. Krackhardt, C. D'Alessandria: interpretation and data analysis. N. Yusufi, M. Schwaiger, C. D'Alessandria: administrative, database construction, technical and material support. N. Yusufi, S. Mall, H. Bianchi, C. Peschel, M. Schwaiger, A.M. Krackhardt, C. D'Alessandria: writing, review, and/or revision of the manuscript. M. Schwaiger, A.M. Krackhardt, C. D'Alessandria: study supervision.
Competing Interests
A.M. Krackhardt and R. Klar are involved in a patent application currently ongoing for the defined MPO peptide and sequences of TCR2.5D6. M. Schwaiger received a commercial research grant from Siemens Medical Research, received speakers' bureau honoraria from Siemens Lunch Symposium, and has ownership interest (including patents) in Siemens. No potential conflicts of interest were disclosed by the other authors.
References
1. Johnson LA, Morgan RA, Dudley ME, Cassard L, Yang JC, Hughes MS. et al. Gene therapy with human and mouse T-cell receptors mediates cancer regression and targets normal tissues expressing cognate antigen. Blood. 2009;114(3):535-46
2. Kanwar B, Gao DW, Hwang AB, Grenert JP, Williams SP, Franc B. et al. In vivo imaging of mucosal CD4+ T cells using single photon emission computed tomography in a murine model of colitis. J Immunol Methods. 2008;329(1-2):21-30
3. Shu CJ, Radu CG, Shelly SM, Vo DD, Prins R, Ribas A. et al. Quantitative PET reporter gene imaging of CD8+ T cells specific for a melanoma-expressed self-antigen. Int Immunol. 2009;21(2):155-65
4. Tavare R, McCracken MN, Zettlitz KA, Salazar FB, Olafsen T, Witte ON. et al. Immuno-PET of Murine T Cell Reconstitution Postadoptive Stem Cell Transplantation Using Anti-CD4 and Anti-CD8 Cys-Diabodies. J Nucl Med. 2015;56(8):1258-64
5. Mall S. et al. Immuno-PET Imaging of Engineered Human T Cells in Tumors. Cancer Res. 2016Jul15;76(14):4113-23
6. Klar R, Schober S, Rami M, Mall S, Merl J, Hauck SM. et al. Therapeutic targeting of naturally presented myeloperoxidase-derived HLA peptide ligands on myeloid leukemia cells by TCR-transgenic T cells. Leukemia. 2014;28(12):2355-66
7. Wang X, Berger C, Wong CW, Forman SJ, Riddell SR, Jensen MC. Engraftment of human central memory-derived effector CD8+ T cells in immunodeficient mice. Blood. 2011;117(6):1888-98
8. Heemskerk MH, Hoogeboom M, de Paus RA, Kester MG, van der Hoorn MA, Goulmy E. et al. Redirection of antileukemic reactivity of peripheral T lymphocytes using gene transfer of minor histocompatibility antigen HA-2-specific T-cell receptor complexes expressing a conserved alpha joining region. Blood. 2003;102(10):3530-40
9. Perk LR, Vosjan MJ, Visser GW, Budde M, Jurek P, Kiefer GE. et al. p-Isothiocyanatobenzyl-desferrioxamine: a new bifunctional chelate for facile radiolabeling of monoclonal antibodies with zirconium-89 for immuno-PET imaging. Eur J Nucl Med Mol Imaging. 2010;37(2):250-9
10. Vosjan MJ, Perk LR, Visser GW, Budde M, Jurek P, Kiefer GE. et al. Conjugation and radiolabeling of monoclonal antibodies with zirconium-89 for PET imaging using the bifunctional chelate p-isothiocyanatobenzyl-desferrioxamine. Nat Protoc. 2010;5(4):739-43
11. Lindmo T, Boven E, Cuttitta F, Fedorko J, Bunn PA Jr. Determination of the immunoreactive fraction of radiolabeled monoclonal antibodies by linear extrapolation to binding at infinite antigen excess. J Immunol Methods. 1984;72(1):77-89
12. Rogakou EP, Pilch DR, Orr AH, Ivanova VS, Bonner WM. DNA double-stranded breaks induce histone H2AX phosphorylation on serine 139. J Biol Chem. 1998;273(10):5858-68
13. Schmid TE, Dollinger G, Beisker W, Hable V, Greubel C, Auer S. et al. Differences in the kinetics of gamma-H2AX fluorescence decay after exposure to low and high LET radiation. Int J Radiat Biol. 2010;86(8):682-91
14. Lomax ME, Folkes LK, O'Neill P. Biological consequences of radiation-induced DNA damage: relevance to radiotherapy. Clin Oncol (R Coll Radiol). 2013;25(10):578-85
15. Kircher MF, Gambhir SS, Grimm J. Noninvasive cell-tracking methods. Nat Rev Clin Oncol. 2011;8(11):677-88
16. Mezzanotte L, Blankevoort V, Lowik CW, Kaijzel EL. A novel luciferase fusion protein for highly sensitive optical imaging: from single-cell analysis to in vivo whole-body bioluminescence imaging. Anal Bioanal Chem. 2014;406(23):5727-34
17. Hong H, Yang Y, Zhang Y, Cai W. Non-invasive cell tracking in cancer and cancer therapy. Curr Top Med Chem. 2010;10(12):1237-48
18. Dobrenkov K, Olszewska M, Likar Y, Shenker L, Gunset G, Cai S. et al. Monitoring the efficacy of adoptively transferred prostate cancer-targeted human T lymphocytes with PET and bioluminescence imaging. J Nucl Med. 2008;49(7):1162-70
19. Kircher MF, Allport JR, Graves EE, Love V, Josephson L, Lichtman AH. et al. In vivo high resolution three-dimensional imaging of antigen-specific cytotoxic T-lymphocyte trafficking to tumors. Cancer Res. 2003;63(20):6838-46
20. Thu MS, Bryant LH, Coppola T, Jordan EK, Budde MD, Lewis BK. et al. Self-assembling nanocomplexes by combining ferumoxytol, heparin and protamine for cell tracking by magnetic resonance imaging. Nat Med. 2012;18(3):463-7
21. Cherry SR. Fundamentals of positron emission tomography and applications in preclinical drug development. J Clin Pharmacol. 2001;41(5):482-91
22. Constantinescu CC, Mukherjee J. Performance evaluation of an Inveon PET preclinical scanner. Phys Med Biol. 2009;54(9):2885-99
23. Yaghoubi SS, Creusot RJ, Ray P, Fathman CG, Gambhir SS. Multimodality imaging of T-cell hybridoma trafficking in collagen-induced arthritic mice: image-based estimation of the number of cells accumulating in mouse paws. J Biomed Opt. 2007;12(6):064025
24. Wang X, Popplewell LL, Wagner JR, Naranjo A, Blanchard MS, Mott MR. et al. Phase 1 studies of central memory-derived CD19 CAR T-cell therapy following autologous HSCT in patients with B-cell NHL. Blood. 2016;127(24):2980-90
25. Heneweer C, Holland JP, Divilov V, Carlin S, Lewis JS. Magnitude of enhanced permeability and retention effect in tumors with different phenotypes: 89Zr-albumin as a model system. J Nucl Med. 2011;52(4):625-33
26. Tavare R, Escuin-Ordinas H, Mok S, McCracken MN, Zettlitz KA, Salazar FB. et al. An Effective Immuno-PET Imaging Method to Monitor CD8-Dependent Responses to Immunotherapy. Cancer Res. 2016;76(1):73-82
27. Tavare R, McCracken MN, Zettlitz KA, Knowles SM, Salazar FB, Olafsen T. et al. Engineered antibody fragments for immuno-PET imaging of endogenous CD8+ T cells in vivo. Proc Natl Acad Sci U S A. 2014;111(3):1108-13
28. Keyaerts M, Xavier C, Heemskerk J, Devoogdt N, Everaert H, Ackaert C. et al. Phase I Study of 68Ga-HER2-Nanobody for PET/CT Assessment of HER2 Expression in Breast Carcinoma. J Nucl Med. 2016;57(1):27-33
29. Koehne G, Doubrovin M, Doubrovina E, Zanzonico P, Gallardo HF, Ivanova A. et al. Serial in vivo imaging of the targeted migration of human HSV-TK-transduced antigen-specific lymphocytes. Nat Biotechnol. 2003;21(4):405-13
30. Doubrovin MM, Doubrovina ES, Zanzonico P, Sadelain M, Larson SM, O'Reilly RJ. In vivo imaging and quantitation of adoptively transferred human antigen-specific T cells transduced to express a human norepinephrine transporter gene. Cancer Res. 2007;67(24):11959-69
31. Davis JL, Theoret MR, Zheng Z, Lamers CH, Rosenberg SA, Morgan RA. Development of human anti-murine T-cell receptor antibodies in both responding and nonresponding patients enrolled in TCR gene therapy trials. Clin Cancer Res. 2010;16(23):5852-61
Author contact
![]() Corresponding author: Calogero D'Alessandria; Klinikum rechts der Isar, Technische Universität München, Department of Nuclear Medicine; Ismaningerstraße 22, 81675 Munich, Germany; calogero.dalessandriade; +49-89/41406332
Corresponding author: Calogero D'Alessandria; Klinikum rechts der Isar, Technische Universität München, Department of Nuclear Medicine; Ismaningerstraße 22, 81675 Munich, Germany; calogero.dalessandriade; +49-89/41406332
Citation styles
APA
Yusufi, N., Mall, S., Bianchi, H.d.O., Steiger, K., Reder, S., Klar, R., Audehm, S., Mustafa, M., Nekolla, S., Peschel, C., Schwaiger, M., Krackhardt, A.M., D`Alessandria, C. (2017). In-depth Characterization of a TCR-specific Tracer for Sensitive Detection of Tumor-directed Transgenic T Cells by Immuno-PET. Theranostics, 7(9), 2402-2416. https://doi.org/10.7150/thno.17994.
ACS
Yusufi, N.; Mall, S.; Bianchi, H.d.O.; Steiger, K.; Reder, S.; Klar, R.; Audehm, S.; Mustafa, M.; Nekolla, S.; Peschel, C.; Schwaiger, M.; Krackhardt, A.M.; D`Alessandria, C. In-depth Characterization of a TCR-specific Tracer for Sensitive Detection of Tumor-directed Transgenic T Cells by Immuno-PET. Theranostics 2017, 7 (9), 2402-2416. DOI: 10.7150/thno.17994.
NLM
Yusufi N, Mall S, Bianchi HdO, Steiger K, Reder S, Klar R, Audehm S, Mustafa M, Nekolla S, Peschel C, Schwaiger M, Krackhardt AM, D`Alessandria C. In-depth Characterization of a TCR-specific Tracer for Sensitive Detection of Tumor-directed Transgenic T Cells by Immuno-PET. Theranostics 2017; 7(9):2402-2416. doi:10.7150/thno.17994. https://www.thno.org/v07p2402.htm
CSE
Yusufi N, Mall S, Bianchi HdO, Steiger K, Reder S, Klar R, Audehm S, Mustafa M, Nekolla S, Peschel C, Schwaiger M, Krackhardt AM, D`Alessandria C. 2017. In-depth Characterization of a TCR-specific Tracer for Sensitive Detection of Tumor-directed Transgenic T Cells by Immuno-PET. Theranostics. 7(9):2402-2416.
This is an open access article distributed under the terms of the Creative Commons Attribution (CC BY-NC) license (https://creativecommons.org/licenses/by-nc/4.0/). See http://ivyspring.com/terms for full terms and conditions.