Theranostics
13.3
Impact Factor
- Current Issue
- Advance Articles
- Volume 16; 2026
- Volume 15; 2025
- Volume 14; 2024
- Volume 13; 2023
- Volume 12; 2022
- Archive
- Cover Images
- Cover Suggestion
- Special Issues
Top
Introduction
Materials and Methods
Results and Discussion
Conclusions
Acknowledgements
Supplementary Material
References
Introduction
Materials and Methods
Results and Discussion
Conclusions
Acknowledgements
Supplementary Material
References
International Journal of Biological Sciences
International Journal of Medical Sciences
 Global reach, higher impact

Theranostics 2017; 7(11):2849-2862. doi:10.7150/thno.19113 This issue Cite
Research Paper
A Combination of DNA-peptide Probes and Liquid Chromatography-Tandem Mass Spectrometry (LC-MS/MS): A Quasi-Targeted Proteomics Approach for Multiplexed MicroRNA Quantification
Feifei Xu1, Weixian Zhou1, Jianxiang Cao1, Qingqing Xu1, Dechen Jiang2, Yun Chen1 ![]()
1. Nanjing Medical University, Nanjing, 211166, China;
2. Nanjing University, Nanjing, 210023, China.
Received 2017-1-8; Accepted 2017-5-8; Published 2017-7-8
Citation:
Xu F, Zhou W, Cao J, Xu Q, Jiang D, Chen Y. A Combination of DNA-peptide Probes and Liquid Chromatography-Tandem Mass Spectrometry (LC-MS/MS): A Quasi-Targeted Proteomics Approach for Multiplexed MicroRNA Quantification. Theranostics 2017; 7(11):2849-2862. doi:10.7150/thno.19113. https://www.thno.org/v07p2849.htm
Other stylesAbstract

The distorted and unique expression of microRNAs (miRNAs) in cancer makes them an attractive source of biomarker. There is much evidence indicating that a panel of miRNAs, termed “miRNA fingerprints”, is more specific and informative than an individual miRNA as biomarker. Thus, multiplex assays for simultaneous quantification of multiple miRNAs could be more potent in clinical practice. However, current available assays normally require pre-enrichment, amplification and labeling steps, and most of them are semi-quantitative or lack of multiplexing capability. In this study, we developed a quasi-targeted proteomics assay for multiplexed miRNA quantification by a combination of DNA-peptide probes and liquid chromatography-tandem mass spectrometry (LC-MS/MS). Specifically, the signal of target miRNAs (i.e., miR-21, miR-let7a, miR-200c, miR-125a and miR-15b) was converted into the mass response of reporter peptides by hybridization of miRNAs with DNA-peptide probes and subsequent tryptic digestion to release the peptides. After a careful optimization of conditions related to binding, conjugation, hybridization and multiple reaction monitoring (MRM) detection, the assay was validated for each miRNA and the limit of quantification (LOQ) for all the miRNAs can achieve 1 pM. Moreover, crosstalk between DNA-peptide probes in multiplex assay was sophisticatedly evaluated. Using this quasi-targeted proteomics assay, the level of target miRNAs was determined in 3 human breast cell lines and 36 matched pairs of breast tissue samples. Finally, simplex assay and qRT-PCR were also performed for a comparison. This approach grafts the strategy of targeted proteomics into miRNA quantification and may offer a new way for multiplexed miRNA profiling.
Keywords: Quasi-Targeted Proteomics, MicroRNAs, Multiplex Assay, Reporter Peptides, DNA-peptide Probes, Liquid Chromatography-Tandem Mass Spectrometry (LC-MS/MS).
Introduction
MicroRNAs (miRNAs) are a class of small (approximately 19-23 nucleotides) RNAs that regulate gene expression via degradation or translational inhibition of their target messenger RNAs (mRNAs) [1]. The recent rise of interest in miRNAs is ascribed to the breakthrough of their role in many cellular processes. For example, miRNAs have been implicated in the occurrence and development of a variety of cancers including breast cancer [2]. This characteristic makes them a potentially attractive biomarker for cancer diagnosis. However, it is unlikely that any single miRNA will achieve the desired level of diagnostic accuracy in clinic, as particular miRNAs can be associated with several different types of tumor [3]. Fortunately, recent evidence has indicated that a panel of miRNAs, termed “miRNA fingerprints”, could be more specific and informative than an individual miRNA as biomarker [4, 5]. In addition, these fingerprints may only require 2-15 miRNAs to distinguish tumor from normal specimens [6]. Therefore, assays for simultaneous quantification of multiple miRNAs may be more potent in clinical practice.
Currently, many detection techniques are available for the analysis of miRNA expression level, including indirect (e.g., polymerase chain reaction (PCR) [7, 8], FRET [9], microarrays [10], electrocatalysis [11] and next-generation sequencing [12]) and direct methods (e.g., electrochemical-based methods [13-15], spectral detection assisted by duplex-specific nuclease [16, 17], differential interference contrast (DIC) imaging [18], and capillary electrophoresis (CE)-based methods [6, 19]). Indirect methods normally require pre-amplification or chemical/enzymatic modification of target miRNA, whereas direct ones do not involve those miRNA pretreatments [20]. While these techniques provide valuable information, most of them are lack of multiplexing capability. Among those techniques that can be multiplexed, the majority of them are indirect or require further steps of gel visualization or labeling with fluorophores [21], all of which are time and labor consuming, and are susceptible to various factors [22].
Mass spectrometry could be an alternative to achieve multiplexing. The attractiveness of this technique is based on its sensitivity, specificity and flexibility, and capability for absolute quantification [23]. Most importantly, it can simultaneously measure several hundred and now even several thousand analytes in a single experiment as long as the analytes can ionize effectively [24]. In recent years, mass spectrometry has become an indispensable tool in proteomics to obtain quantitative information about proteins. Liquid chromatography-tandem mass spectrometry (LC-MS/MS)-based targeted proteomics is one of the recognized mass spectrometric analysis methods [25-27]. The underlying principle of this targeted analysis is specific detection and determination of a protein of interest at the peptide level [28, 29]. Peptides are generated by enzyme digestion of the target proteins to serve as surrogate analytes. Selected or multiple reaction monitoring (SRM or MRM) is used to detect the selected surrogate peptides [26]. So far, the capability of targeted proteomics to monitor multiple surrogate peptides is evident in a number of studies [30, 31].
In contrast to protein analysis, the application of mass spectrometry to direct miRNA analysis encountered some difficulties, probably because of complicated and unresolved mass spectra of miRNA, specially that miRNAs consist of only four nucleotides that the risk of different sequences giving rise to similar mass spectra patterns is potentially greater than protein molecules containing amino acids [32]. This issue could be magnified intensely if a pool of miRNAs is targeted. Other strategies such as small molecule reporter tags [33, 34] could have a rapid cost increase with the involvement of more miRNAs due to the chemical property of tags [35].
The question then arises is whether we can introduce the concept of surrogate peptides from targeted proteomics into miRNA quantification. Recently, a novel quasi-targeted proteomics assay combining a DNA-peptide probe and LC-MS/MS detection has been developed in our lab [36]. In that approach, a reporter peptide was first selected, and then a substrate peptide containing the sequence of reporter peptide and tryptic cleavage site was tagged to a DNA sequence, which was complementary to target miRNA. Subsequently, the newly formed DNA-peptide probe was hybridized with the miRNA that was biotinylated and bound to streptavidin agarose through streptavidin-biotin interaction in advance. After tryptic digestion, the reporter peptide was released and quantified using a targeted proteomics assay. Strictly speaking, it is not a traditional targeted proteomics assay. Therefore, we call it “quasi-targeted proteomics”.
In this study, we advanced the quasi-targeted proteomics strategy for simultaneous quantification of multiple miRNAs (i.e., miR-21, miR-let7a, miR-200c, miR-125a and miR-15b) using a series of DNA-peptide probes differing by several amino acids in reporter peptide sequence. Fig. 1 shows the proposed scheme for this approach. After characterization and optimization of the parameters related to binding, conjugation, hybridization and MRM detection, the assay was validated for each miRNA. Moreover, the multiplexing capability of assay was evaluated using a series of mock mixtures, which contains varying concentrations of each miRNA. A correction method was applied to correct the inherent crosstalk between probes. Finally, the quasi-targeted proteomics assay was applied to determine the level of target miRNAs in the normal cells MCF-10A, the parental drug-sensitive cancer cells MCF-7 and the drug-resistant cancer cells MCF-7/ADR, and 36 pairs of human breast primary tumors and adjacent normal tissue samples. The resulting values were also compared with those obtained with simplex assay.
Figure 1
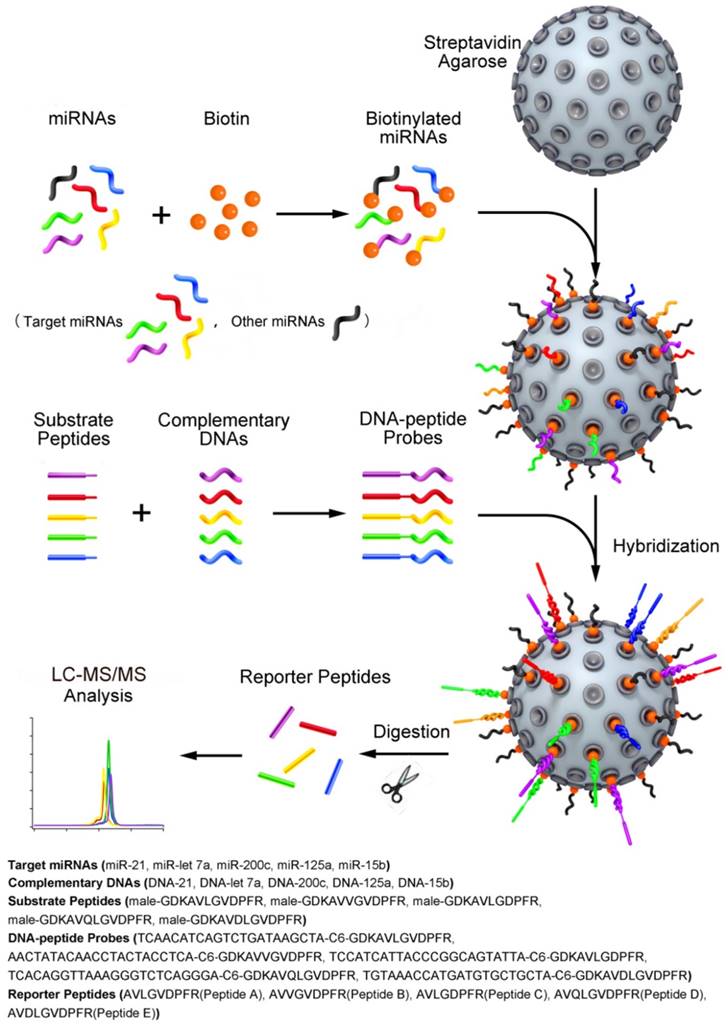
Schematic representation of the quasi-targeted proteomics assay for multiplexed miRNA quantification. Five reporter peptides were first selected, and then the corresponding substrate peptides containing the sequence of reporter peptides and tryptic cleavage site were tagged to DNA sequences at 3' end. The DNA sequences were complementary to those of the target miRNAs (the shorts highlighted in color; the dark shorts represent the other miRNAs). After optimization of hybridization conditions, the DNA-peptide probes were simultaneously hybridized with the miRNAs that were biotinylated at 3' end and bound to streptavidin agarose through streptavidin-biotin interaction in advance. After trypsin digestion, the reporter peptides were released and quantified using LC-MS/MS. In this way, the presence and the quantity of miRNAs can be inferred from the detection of reporter peptides.
Materials and Methods
Chemicals and Reagents
Peptides including maleimide-modified substrate peptide, reporter peptide and internal standard containing stable-isotope labeled amino acids were developed by ChinaPeptides Co., Ltd. (Shanghai, China). Purity of the peptides was also provided by the manufacturer. The stable isotope-labeled amino acid was supplied by Cambridge Isotope Laboratories, Inc. (Andover, MA, USA). miRNAs with/without mismatches and its complementary DNA with a disulfide modification at 3' end were custom synthesized by Realgene (Nanjing, China) and Genscript (Nanjing, China), respectively. Their sequences were provided in Table 1. Ammonium bicarbonate (NH4HCO3) was obtained from Qiangshun Chemical Reagent Co., Ltd. (Shanghai, China). Tris-HCl was supplied by Sigma-Aldrich (St. Louis, MO, USA). Ethylenediaminetetraacetic acid disodium salt (EDTA-2Na) was obtained from Sinopharm Chemical Reagent Company (Shanghai, China). Sequencing grade modified trypsin was purchased from Promega (Madison, WI, USA). Phosphate buffered saline (PBS) was purchased from the Beyotime Institute of Biotechnology (Jiangsu, China). Acetonitrile (ACN) and methanol were obtained from Tedia Company, Inc. (Fairfield, OH, USA). Trifluoroacetic acid (TFA) and formic acid (FA) were provided by Aladdin Chemistry Co., Ltd. (Shanghai, China) and Xilong Chemical Industrial Factory Co., Ltd. (Shantou, China), respectively. Dulbecco's modified eagle media (DMEM), fetal bovine serum and penicillin-streptomycin solution were obtained from Thermo Scientific HyClone (Logan, UT, USA). MEGM mammary epithelial cell growth medium was obtained from LONZA (Basel, Switzerland). Trypan blue and sodium dodecyl sulfate (SDS) were obtained from Generay Biotech Co., Ltd (Shanghai, China). All the solutions used in the experiments were prepared in DEPC-treated water (Beyotime biotechnology, Haimen, China).
Preparation of Stock Solutions, Calibration Standards and Quality Controls (QCs)
Multi-miRNA calibration standards were prepared. In detail, stock solution (100 μM) was prepared by accurately weighing the synthetic miRNAs and dissolving them in DEPC-treated water. The solution was stored at -20°C in a brown glass tube to protect it from light. The calibration standards were prepared by serial dilution of the stock solution. The concentrations of the calibration standards were 1 pM, 10 pM, 100 pM, 1 nM, 10 nM and 100 nM. The QC standards for lower limit of quantification (LLOQ), low QC, mid QC and high QC were prepared at 1 pM, 3 pM, 500 pM and 80 nM and frozen prior to use. Notably, a nuclease-free environment was always used while handling miRNA samples to minimize miRNA degradation [5]. In addition to DEPC-treated water, masking DNA and RNA (tRNA library from baker's yeast; Ambion, TX, USA) were included in each sample to prevent probe and miRNA degradation [37].
Table 1
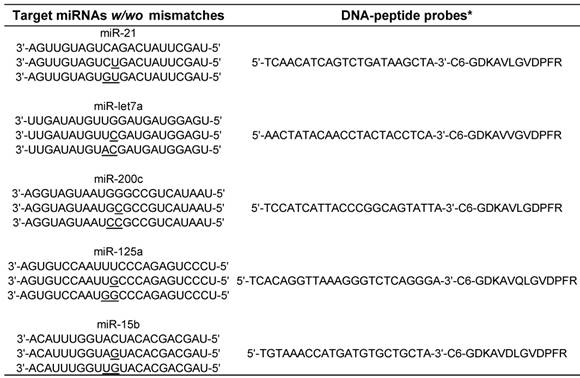
The sequences of target miRNAs and the corresponding DNA-peptide probes.
* C 6 is a 6C-atom spacer linker
With regard to the reporter peptides selected in the next section, the corresponding isotope-labeled synthetic peptides were used as internal standards. The internal standards were also weighed, and stock solution containing 100 μM each internal standard was prepared. Internal standard solution (1 nM) was prepared by diluting the stock solution with an ACN:water mixture (50:50, v/v) containing 0.1% FA.
Cell Culture and Tissue Collection
MCF-7 (ATTC, Manassas, VA) and MCF-7/ADR (Keygen Biotech, Nanjing, China) cells were cultured in a DMEM media supplemented with 10% fetal bovine serum and 1% penicillin/streptomycin at 37°C under a 5% CO2 atmosphere. MCF-10A cells (ATTC, Manassas, VA) were maintained routinely in MEGM media supplemented with 100 ng/mL cholera toxin and 1% penicillin/streptomycin at 37°C under a 5% CO2 atmosphere. Cells were split every 5-7 days by lifting cells with 0.25% trypsin and feeding between splits through the addition of fresh medium. To maintain a highly drug-resistant cell population, MCF-7/ADR cells were periodically reselected by growing them in the presence of 1000 ng/mL DOX [38]. Experiments were performed using the cells incubated without DOX for 48 h. Cells were counted with a hemocytometer (Qiujing, Shanghai, China). Cell viability was assessed by trypan blue (0.4%) exclusion. Cell suspensions, trypan blue and 1 × PBS were mixed in a 2:5:3 ratio and the percentage of viable cells were counted after incubation for 5 min at 37°C.
Breast tissue collection in this study was approved by the institutional review board of Nanjing Medical University. The methods were carried out in accordance with the approved guidelines. Thirty-six pairs of breast tissue samples consisting of tumors and adjacent normal sections were collected consecutively between January 2014 and July 2016 at the First Affiliated Hospital of Nanjing Medical University, Nanjing, China (mean patient age, 51.8 ± 8.3 years; age range, 38-65 years). Tissue sections were confirmed as normal and cancerous by hospital pathologists. Histological evaluation of adjacent normal tissue samples showed no indication of contamination from tumor or other abnormal cells. The patients were biologically unrelated, but all belonged to the Han Chinese ethnic group from the Jiangsu province in China. Informed consent was obtained from the subjects. Tissue samples were stored frozen at -80°C until analysis. Prior to RNA extraction, tissue samples were thawed to room temperature and then rinsed thoroughly with deionized water. Fat tissue was removed and the remaining tissue was cut into small pieces and transferred to tubes. Approximately 50 mg tissue was weighted and homogenized in TRIzol® Reagent (Invitrogen, CA, USA) using a Bio-Gen PRO200 homogenizer (PRO Scientific Inc., Oxford, CT, USA).
Formation of DNA-peptide probes and Biotinylation of miRNAs
The procedure for DNA-peptide probe preparation and miRNAs biotinylation have been described previously [6, 36]. For details, please see the Supporting Information.
Optimization of Hybridization Conditions for the Multiplex Assay
Hybridization was carried out in a MJ Mini thermocycler (Bio-Rad, Hercules, USA). Streptavidin agarose attached with biotinylated miRNAs were incubated with 100 μL of 500 nM each DNA-peptide probe in the presence of 1 μM masking DNA (Brand Realgene, Nanjing, China) and 25 μL of hybridization buffer. Referring to the calculated melting temperature [39], the hybridization conditions including buffers, temperature and time were first optimized for each probe. For the multiplex assay, a suboptimal hybridization was ultimately chosen to allow all the probes have similar hybridization properties. After hybridization, the agarose beads were thoroughly washed and centrifuged to remove any unbound peptide-DNA probe. In parallel, miRNAs with single-base-mismatch and two-base-mismatch sequences were hybridized according to the hybridization procedure described above. To investigate the crosstalk effect between probes, 100 μL of 20 nM synthetic miRNAs were applied to a microarray platform containing 100 μL of DNA-peptide probe mixture composed of 500 nM each probe. Furthermore, each miRNA at various assigned concentrations (i.e., 1 pM-100 nM) were immobilized together with other miRNAs at high concentration (100 nM), followed by hybridization with the DNA-peptide probe mixture described as above. Finally, five samples (S1 to S5) containing miRNAs with known concentrations between 10 pM and 10 nM were analyzed.
In-solution Tryptic Digestion
The procedure for in-solution tryptic digestion has been described previously [6, 36]. For details, please see the Supporting Information.
HPLC and LC-MS/MS Method Development and Validation
The HPLC system consisted of a Shimadzu LC-20AB solvent delivery pump, a Rheodyne manual valve injector and a Shimadzu SPD-20A UV/VIS detector (Shimadzu Corporation, Tokyo, Japan). The samples were analyzed using an Aqua HPLC C8 column (5 μm, 4.6 mm × 150 mm; Thermo scientific, USA) at room temperature. The mobile phase consisted of solvent A (50 mM triethylamine, pH 7.6) and solvent B (ACN). A linear gradient with a flow rate of 1 mL/min was applied in the following manner (duration listed in parentheses): B 5% (0 min) → 16% (5 min) → 20% (20 min) → 5% (25 min) → stop (26 min). The data were acquired and processed with Lab Solutions LC-solution Version 1.2 working station.
An Agilent Series 1290 UPLC system (Agilent Technologies, Waldbronn, Germany) and a 6460 Triple Quad LC-MS mass spectrometer (Agilent Technologies, Santa Clara, CA, USA) were used for the LC-MS/MS studies.
The liquid chromatography separations were performed on an Agilent SB C18 (2.7 µm, 30 mm × 2.1 mm, Agilent, USA) at room temperature. The mobile phase consisted of solvent A (0.1% FA in water) and solvent B (0.1% FA in methanol). A linear gradient with a flow rate of 0.3 mL/min was applied in the following manner: B 10% (0 min) → 10% (1 min) → 90%(4 min) → 90% (8 min) → 10% (9 min). The injection volume was 5 μL.
The mass spectrometer was interfaced with an electrospray ion source and operated in the positive MRM mode. Q1 and Q3 were both set at unit resolution. The flow of the drying gas was 10 L/min and the drying gas temperature was held at 350°C. The electrospray capillary voltage was optimized to 4000 V. The nebulizer pressure was set to 35 psi. The data were collected and processed using the Agilent MassHunter Workstation Software (version B.06.00).
Method validation involves evaluating the linear range, accuracy, precision, limit of quantification (LOQ) and stability. The detailed procedures and the acceptance criteria used to validate the assay have been described in a number of publications [40-42].
Method Verification by Simplex Assay
For simplex assay, we followed the experimental procedure as described in our previous work [36].
Results and Discussion
Selection of Reporter Peptides for the Multiplex Assay
To simultaneously detect multiple miRNAs, different miRNA-probe hybrids must be technically separated. To date, spatial and spectral separations have been primarily employed for this purpose [20]. For spatial separation such as electrophoresis and chromatography, the maximum number of miRNAs that can be analyzed, termed as peak capacity, is subject to average peak width and analysis time [43]. There is evidence indicating that the optimized peak capacity of electrophoretic separation is unlikely to exceed 30-40 peaks [20]. On the other hand, traditional spectral separation that often requires a difference in absorbance, fluorescence, refractive index or reflectivity of pre-treated miRNAs could be more difficult. For instance, signals produced by fluorophores are broad, typically covering around 100 nm in a wavelength window of approximately 600 nm [34]. Thus, multiplexing potential of current techniques is highly limited due to overlapping signals.
Comparatively, signals from mass spectrometry cover in the region of 6 Da, taking into account all isotopic contributions, in a mass window of approximately 1000 Da. This feature has facilitated the simultaneous analysis of many mass tags [34]. In addition, two filtering stages (i.e., precursor ion and product ion) combined with high duty cycle in LC-MS/MS-based targeted proteomics, lead to quantification with unmatched specificity [44]. Previous studies have demonstrated that 120 peptide transitions can be simultaneously processed with scheduled MRM [45]. This high selectivity provides the possibility to monitor multiple reporter peptides in quasi-targeted proteomics.
Following the rationale described in our previous work [36], reporter/surrogate peptides were selected first. There are some empirical rules for the choice of peptides, which may be helpful at the primary stage of searching [46-48]. Furthermore, it is possible to predict which peptides and product ions are most appropriate for MRM by in silico prediction by various algorithms and computational tools [46]. Finally, the reliability of selection can be confirmed by the experimental data. In this way, a peptide with the sequence of AVLGVDPFR was previously employed as the reporter peptide of miR-21.
To simplify the subsequent peptide selection for the other target miRNAs, AVLGVDPFR (Peptide A) was primarily conserved in the newly designed reporter peptides (Peptide B-E) but only differing by several amino acids in sequence (Table 2). So far, these peptides were found not to match with any protein using a BLAST search. Consistent with the result of ESP Predictor (Table S1), the mass response of their doubly charged precursor ions was significant and among the tops of the peptides that we ever processed using targeted analysis [49-51].
The product ion spectra and LC-MS/MS chromatograms of reporter ions are shown in Fig. 2. The characteristic sequence-specific b ions and y ions were indicative of peptides. Notably, the product ion spectrum and LC-MS/MS chromatogram of Peptide A has been provided in our previous work [36]. Then, the corresponding stable isotope-labeled peptides were prepared to serve as internal standards. In detail, stable isotope-labeled [D8]Val was coupled to the sequences (Table S2). Finally, three MRM transitions that gave the best signal-to-noise and limit of quantification (LOQ) for each reporter peptide were selected (Table S3). The peak areas in these three MRM transitions were summed and used in the following quantitative analysis [52].
Table 2
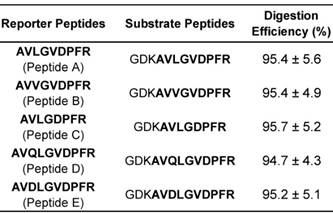
Digestion efficiency of substrate peptides.
Substrate Peptides and Tryptic Digestion
In the scheme, the selected reporter peptides need to be ultimately released from the DNA-peptide probes after hybridization between target miRNAs and their complementary DNAs. Thus, substrate peptides with a tryptic cleavage site prior to reporter peptides were further proposed. According to the previous achievement on maximizing digestion efficiency [53, 54] and reducing the functional interference between reporter peptide and DNA [36], the same three amino acid peptide (GDK) containing a lysine residue at the C-terminus was linked with each reporter peptide. The digestion efficiency was calculated by comparing the response ratios of the tryptic peptide after digestion and the equimolar synthetic reporter peptide standard in the digestion. The estimated values were listed in Table 2.
Characterization of DNA-peptide Probes
The disulfide group at the 3' end of DNA was first reduced prior to conjugation and the thiol group then reacted with a maleimide group at the peptide N-terminus by Michael addition to form a thiol-maleimide linkage [55]. Similar to our previous work [36], HPLC results indicated that each DNA was conjugated with the corresponding substrate peptide completely in the presence of excess peptide (Fig. 3). The newly conjugated DNA-peptide probes can be well separated and collected for the following experiment (Data not shown).
To further confirm the success of conjugation reaction, the collected fraction was subjected to trypsin digestion. Then, the released DNA and tryptic peptide components were monitored using HPLC and LC-MS/MS, respectively. The LC-MS/MS result demonstrated an unambiguous match of retention time between the tryptic peptide and reporter peptide (Fig. 4A). On the other hand, the retention time of the generated DNA part in HPLC was not exactly the same as those of the DNA used for conjugation reaction (Fig. 4B). The slight time shift came from the loss of three amino acid residues from the substrate peptide to DNA. Thus, the detected tryptic DNA was actually DNA-GDK. Finally, the amount of reporter peptide obtained from LC-MS/MS was not significantly different from the reactant amount of DNA-peptide probe for digestion.
Loading Efficiency of miRNAs on Beads and Selection of Suboptimal Hybridization Conditions
As is well known, targeted proteomics offers the capability to measure multiple proteins with higher sensitivity and specificity. Thus, the influence that could reduce the performance of quasi-targeted proteomics assay in this study may largely come from miRNAs. For assay sensitivity, miRNAs loading efficiency on beads and miRNAs hybridization efficiency with DNA-peptide probes are two critical impact factors in addition to the trypsin digestion efficiency described earlier. Our previous work has indicated that the maximum loading capacity of streptavidin agarose beads for biotinylated miRNAs employing biotin and streptavidin as immobilization partners was ~2.1 biotin molecules/streptavidin [36]. Since each streptavidin molecule has four biotin-binding sites, approximately 53% streptavidin was saturated at the maximum level. This incompleteness of binding was probably due to the inherent covalent linkage between agarose and streptavidin formed on active sites of the protein, resulting in its reduced activity [56]. Taking this binding capacity into account, almost all the miRNAs in samples can be captured using the excess of agarose beads (Fig. S1).
The hybridization efficiency was generally calculated using the amount of hybridized DNA-peptide and the amount of immobilized target miRNA [57]. Ideally, all the miRNA molecules hybridized with the corresponding probes at a theoretical ratio 1:1 in the presence of excess probes, whereas hybridization efficiency was influenced by many parameters. In addition to optimization of hybridization condition including buffer, melting temperatures and time, the most critical issue for multiplex assay is the selection of simultaneous or sequential hybridization. Sequential hybridization allows for hybridization at the optimal temperature for each probe but the process is time-consuming and susceptible to more interferences [58]. Comparatively, simultaneous hybridization may be more suitable for multiplex assay. In case where the optimal hybridization temperatures for miRNA-probe pairs were not identical, a suboptimal temperature must be chosen [39]. To obtain this suboptimal temperature more rapidly and accurately, the melting temperatures (Tm) were calculated first using thermodynamic basis sets for nearest neighbor interactions (please see the Supporting Information) [59]. Because the salt concentration can affect the Tm, six buffers were examined [36] and the buffer of choice was 10 mM Tris, 100 mM KCl, 1 mM MgCl2, pH 7.4. Typically, hybridization is performed at 5-10°C below the Tm [60]. According to the actual favorable temperature for each miRNA (Table S4), the suboptimal temperature for all the miRNAs was set as 60°C and the hybridization time was 16 h. The ultimate hybridization efficiency values were shown in Table 3.
Figure 2
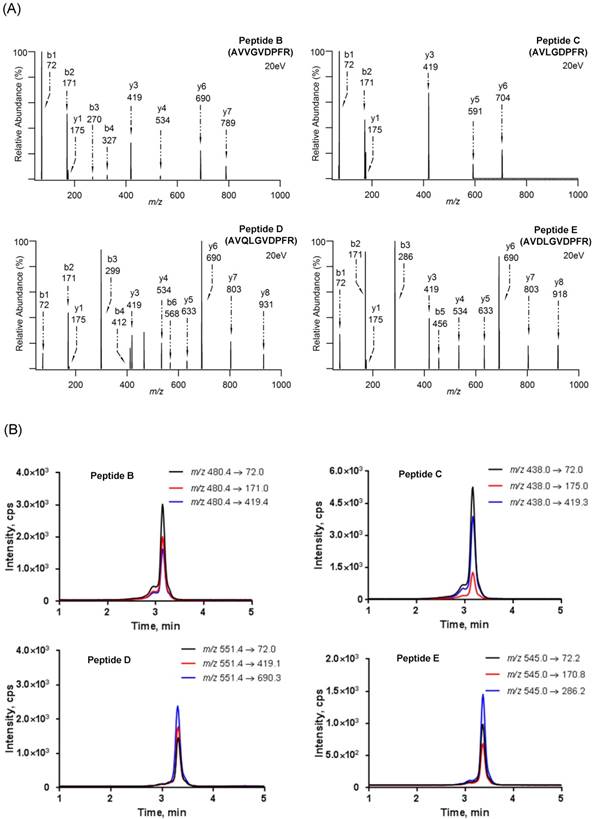
(A) Product ion spectra of reporter peptides (i.e., Peptide B (AVVGVDPFR), Peptide C (AVLGDPFR) , Peptide D (AVQLGVDPFR) and Peptide E (AVDLGVDPFR)) and (B) LC-MS/MS chromatograms of reporter peptides with monitoring three MRM transitions.
Figure 3
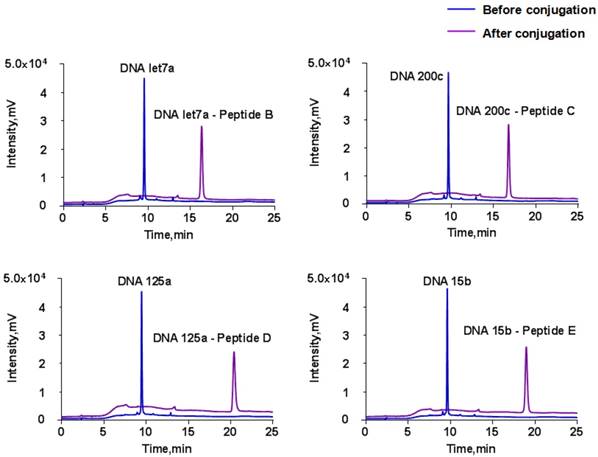
HPLC chromatograms before and after DNA and substrate peptides conjugation at the wavelength of 260 nm. The HPLC conditions are provided in “Materials and Methods”.
Table 3
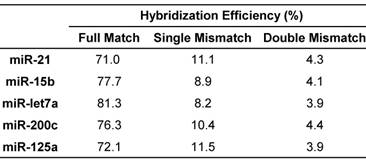
Hybridization efficiency of target miRNAs.
After the optimization of conditions, the limit of quantification (LOQ) of the quasi-targeted proteomics assay for each miRNA can achieve 1 pM. The detection dynamic range spanned about 5 orders of magnitude (i.e., 1 pM-100 nM). The calibration curves were constructed based on the relative peak area ratio of the reporter peptide and the stable isotope-labeled internal standard plotted against concentration (Fig. S2). The other results were provided in the Supporting Information (Assay validation, Fig. S3 and Table S5).
Specificity of the Multiplex Assay
In addition to mass detection of reporter peptides, the hybridization system is another key factor affecting the specificity of multiplex assay. It is essential to exclude cross-hybridization between miRNAs and probes [61]. For simplex assay, a series of miRNAs that formed single or double mismatched duplexes with the DNA-peptide probe were generally designed to evaluate the cross-hybridization effect from other miRNAs especially its highly homologous family members. In this study, each DNA-peptide probe was hybridized with mismatched miRNAs in parallel with the target miRNA using the condition optimized above. The detected peak intensity decreased in the order of matched > single mismatched > double mismatched (Table 3), providing the evidence that DNA-peptide probes can discriminate target miRNAs from mismatched miRNAs. As predicted, non-complementary (random [38]) sample displayed no peak at all. In agreement with this observation, E. coli lysate did not significantly affect the result (Table S6).
Notably, cross-hybridization may also come from the interaction between the target miRNAs and other DNA-peptide probes in multiplex assay. To address this issue, hybridization between each DNA-peptide probe and each target miRNA was monitored [62]. As shown in Fig. 5, low levels of crosstalk were observed. To be more accurate in the following sample quantification, we employed a crosstalk correction method previously used by Hildebrandt's lab [9, 63]. This correction method uses a matrix, which includes all possible crosstalk from probes. Then, the MRM intensities of reporter peptides are multiplied with the matrix to obtain their actual signals (please see the Supporting Information). After crosstalk correction, calibration curves contain all five probes but only one target (with increasing concentration) showed the target-specific signal intensities (Fig. 6). To further demonstrate the ability of the assay to precisely measure target miRNAs under more realistic conditions, we prepared another series of calibration curves. Each calibration curve contains all five target miRNAs and five probes, with one target miRNA with increasing concentration and the other four miRNAs with a constant concentration of 100 nM each (Fig. S4). The result indicated that the presence of other miRNAs at high concentrations did not significantly alter the calibration curves (Table S7). Finally, we prepared five samples with target miRNA concentrations between 10 pM and 10000 pM and measured them with the assay (Fig. S5). The result provided an impressive demonstration of the extremely high specificity even when all five miRNAs were present in the same sample at various concentrations.
Figure 4
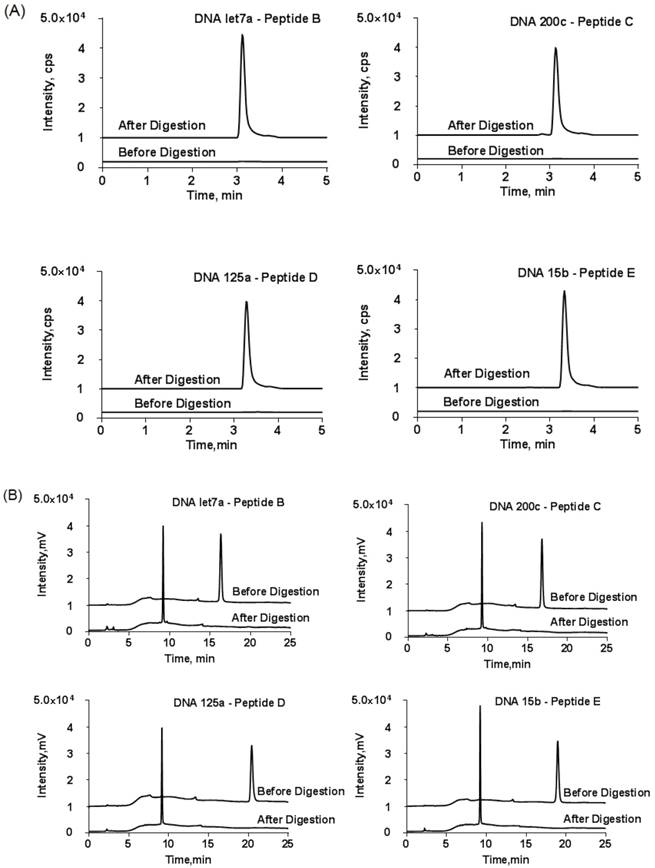
(A) LC-MS/MS chromatograms of DNA-peptide probes before and after tryptic digestion and (B) the corresponding HPLC chromatograms at wavelength of DNA (260 nm). The HPLC conditions were the same as described in Figure 3. y-axis scale was adjusted for clarity. Only one MRM transition per probe is shown.
Figure 5
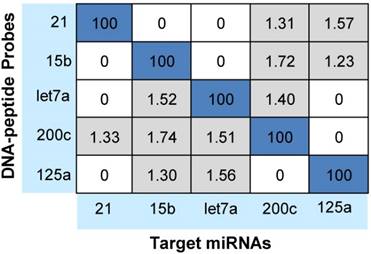
Cross-hybridization of the multiplex assay. Signals were reported as the relative percentages of the intended miRNAs of each DNA-peptide probe (taken as 100%).
Quantification of the Target miRNAs in Breast Cells and Tissue Samples
For overall evaluation of the developed quasi-targeted proteomics assay, we determined the concentrations of target miRNAs in 3 breast cell lines and 36 matched pairs of breast tissue samples. In cellular analysis, the levels of miRNAs were quantified in the normal cells MCF-10A, the parental drug-sensitive cancer cells MCF-7 and the drug-resistant cancer cells MCF-7/ADR. The result is shown in Table 4. Consistent with the previous findings, miR-21 was up-regulated and miR-125a and miR-15b were down-regulated in MCF-7 cells compared with those in MCF-10A cells. In addition, all the studied miRNAs were involved in the acquisition of drug resistance, by comparing MCF-7 cells and MCF-7/ADR cells. Moreover, the results were further confirmed by simplex assay [64]. Finally, target miRNAs were also measured using qRT-PCR in this study. The obtained comparison results are grammatically summarized in Fig. 7. No significant difference was observed by using one-way ANOVA and multiple comparisons in all the target miRNA groups (P = 0.362; GraphPad Prism 6 software, GraphPad Software, La Jolla, CA, USA). The outcome also demonstrated that miRNAs in copies per cell obtained via both simplex and multiplex quasi-targeted proteomics assays were slightly lower than those obtained by qRT-PCR, but the difference was not significant. Such uncertainty could be attributed to the larger variations in the qRT-PCR experiment, which can come from reactivity discrepancy of miRNAs arising from reverse transcription and amplification steps.
Figure 6
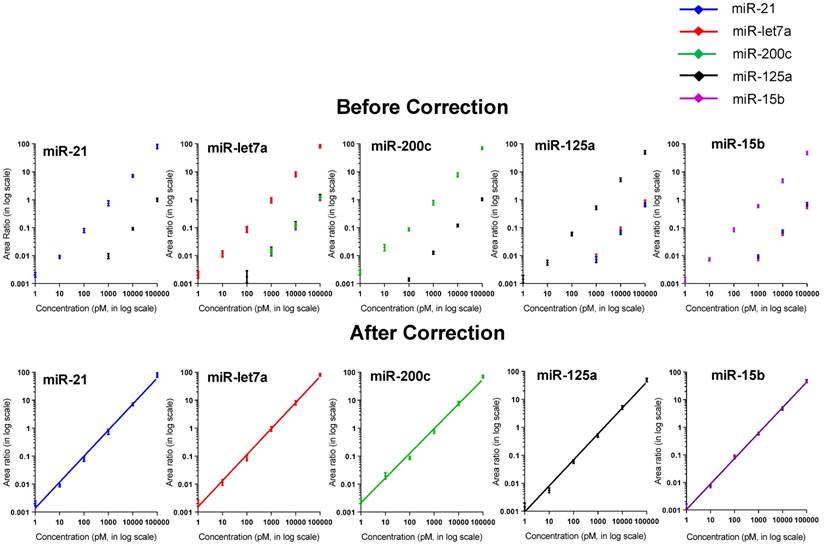
Calibration curves (A) before and (B) after crosstalk correction. The standards contain all five probes and one target miRNA with increasing concentration.
Table 4
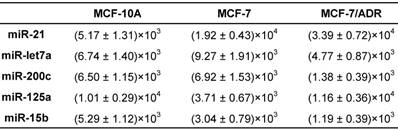
The amounts of target miRNAs in breast cells (copies/cell).
Figure 7
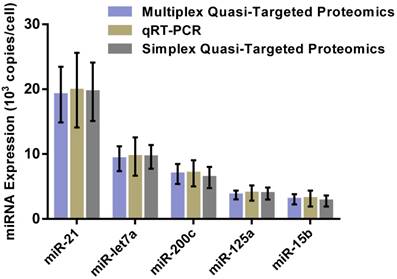
Comparison of multiplex and simplex quasi-targeted proteomics and qRT-PCR for target miRNAs in MCF-7 cells. The upper and lower error bars are symmetrical.
Furthermore, the expression profiles of five targeted miRNAs were measured in breast tissue samples (Fig. 8). A two-way comparison using Mann-Whitney test revealed that the expression levels of all five miRNAs significantly changed when compared with the corresponding normal tissues. However, tissue samples had a substantially different profiling pattern from cell lines, indicating the individual diversity of breast cancer and heterogeneity of tissue [42, 65]. Subsequently, we also compared our results to the values of tumors obtained from qRT-PCR. Passing-Bablok regression analysis was performed using the statistical program MedCalc® software version 11.6.1. As shown in Fig. S6, the quasi-targeted proteomics method was well correlated to the qRT-PCR assay (no significant deviation from linearity (P = NS)). Bland-Altman analysis indicated that quasi-targeted proteomics measures were slightly lower than those of qRT-PCR, as well as the cell samples. Finally, the result of backward logistic regression revealed that tissue expressions of miR-21, miR-let7a and miR-15b were independently associated with breast cancer and had significant influence on the constructed model using MedCalc (p < 0.05; please see the Supporting Information). These miRNAs demonstrated high sensitivity and specificity in distinguishing between cancer and normal tissues samples.
Conclusions
In this report, an advanced quasi-targeted proteomics assay by a combination of DNA-peptide probe and LC-MS/MS was developed for the simultaneous quantification of multiple miRNAs in biological samples, including 3 breast cell lines and 36 pairs of breast tissue samples. Compared to our previous simplex assay, this multiplex assay enables the measurement of multiple miRNAs in one analysis. The high sensitivity and specificity of the assay provides the possibility of using miRNA fingerprints as biomarker for cancer diagnostics or even potentially as predictive and prognostic biomarker. However, the issues on reporter peptide selection, assay optimization and crosstalk correction could become more complicated and deserve more careful evaluation with the involvement of large number of target miRNAs. In particular, large difference in Tm of miRNA-probe pairs might cause difficulty in the application of the assay for large-scale expression profiling. To achieve uniform melting temperatures, locked nucleic acid (LNA) approach that uses modified oligonucleotides could be attempted. Another concern is the bias towards either very low abundant or high abundant miRNAs, being aware of that the target miRNAs in this study have a similar distribution range in samples. Further development of our strategy may be needed to address these issues.
Acknowledgements
The National Natural Science Fund (21675089, 21175071), the Project sponsored by SRF for ROCS, SEM (39), the Jiangsu Six-type Top Talents Program (D) and the Open Foundation of Nanjing University (SKLACLS1102) awarded to Dr. Chen and the National Natural Science Fund (21605086) for Dr. Xu are gratefully acknowledged.
Ethical Approval
This study was approved by the Institutional Review Board of Nanjing Medical University, Nanjing, China.
Supplementary Material
Supplementary figures and tables.
Competing Interests
The authors have declared that no competing interest exists.
Figure 8
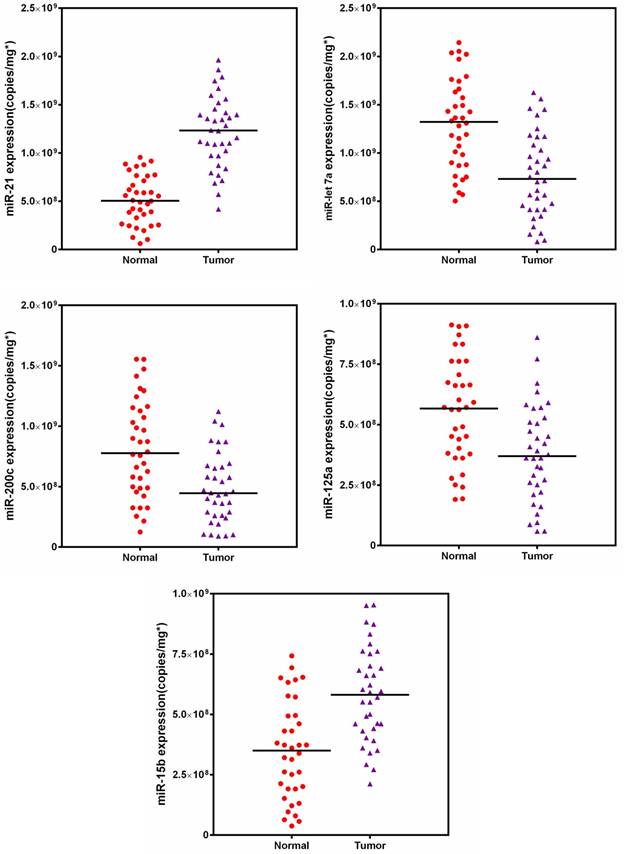
Target miRNAs amounts in 36 matched pairs of breast tissue samples.
References
1. O'Driscoll L. The emerging world of microRNAs. Anticancer Res. 2006;26:4271-8
2. O'Day E, Lal A. MicroRNAs and their target gene networks in breast cancer. Breast Cancer Res. 2010;12:1-10
3. Cho S, Mutlu L, Grechukhina O. et al. Circulating microRNAs as potential biomarkers for endometriosis. Fertil Steril. 2015;103:1252-60.e1
4. Visone R, Rassenti LZ, Veronese A. et al. Karyotype-specific microRNA signature in chronic lymphocytic leukemia. Blood. 2009;114:3872-9
5. Tombelli S, Minunni M, Luzi E. et al. Aptamer-based biosensors for the detection of HIV-1 Tat protein. Bioelectrochem. 2005;67:135-41
6. Wegman DW, Cherney LT, Yousef GM. et al. Universal drag tag for direct quantitative analysis of multiple microRNAs. Anal Chem. 2013;85:6518-23
7. Zhang P, Zhang J, Wang C. et al. Highly sensitive and specific multiplexed microRNA quantification using size-coded ligation chain reaction. Anal Chem. 2013;86:1076-82
8. Zhang P, Liu Y, Zhang Y. et al. Multiplex ligation-dependent probe amplification (MLPA) for ultrasensitive multiplexed microRNA detection using ribonucleotide-modified DNA probes. Chem Commun (Camb). 2013;49:10013-5
9. Jin Z, Geissler D, Qiu X. et al. A rapid, amplification-free, and sensitive diagnostic assay for single-step multiplexed fluorescence detection of microRNA. Angew Chem Int Ed Engl. 2015;54:10024-9
10. Lu J, Tsourkas A. Imaging individual microRNAs in single mammalian cells in situ. Nucleic Acids Res. 2009;37:e100
11. Gao Z, Yang Z. Detection of microRNAs using electrocatalytic nanoparticle tags. Anal Chem. 2006;78:1470-7
12. Wyman SK, Parkin RK, Mitchell PS. et al. Repertoire of microRNAs in epithelial ovarian cancer as determined by next generation sequencing of small RNA cDNA libraries. PLoS One. 2009;4:e5311
13. Wang T, Viennois E, Merlin D. et al. Microelectrode miRNA sensors enabled by enzymeless electrochemical signal amplification. Anal Chem. 2015;87:8173-80
14. Labib M, Khan N, Ghobadloo SM. et al. Three-mode electrochemical sensing of ultralow microRNA levels. J Am Chem Soc. 2013;135:3027-38
15. Zhang GJ, Chua JH, Chee RE. et al. Label-free direct detection of miRNAs with silicon nanowire biosensors. Biosens Bioelectron. 2009;24:2504-8
16. Yin BC, Liu YQ, Ye BC. One-step, multiplexed fluorescence detection of microRNAs based on duplex-specific nuclease signal amplification. J Am Chem Soc. 2012;134:5064-7
17. Wang Q, Li RD, Yin BC. et al. Colorimetric detection of sequence-specific microRNA based on duplex-specific nuclease-assisted nanoparticle amplification. Analyst. 2015;140:6306-12
18. Roy S, Soh JH, Gao Z. A microfluidic-assisted microarray for ultrasensitive detection of miRNA under an optical microscope. Lab Chip. 2011;11:1886-94
19. Wegman DW, Krylov SN. Direct quantitative analysis of multiple miRNAs (DQAMmiR). Angew Chem Int Ed Engl. 2011;50:10335-9
20. Wegman DW, Krylov SN. Direct miRNA-hybridization assays and their potential in diagnostics. Trends Anal Chem. 2013;44:121-30
21. Chaumpluk P, Kerman K, Takamura Y. et al. Accumulation of amplified target DNAs using thiol/biotin labeling, S1 nuclease, and ferrocene-streptavidin-magnetic system and a direct detection of specific DNA signals with screen printed gold electrode. Sci Tech Adv Mater. 2007;8:323-30
22. Shaner NC, Lin MZ, McKeown MR. et al. Improving the photostability of bright monomeric orange and red fluorescent proteins. Nat Methods. 2008;5:545-51
23. Christians U, Klepacki J, Shokati T. et al. Mass spectrometry-based multiplexing for the analysis of biomarkers in drug development and clinical diagnostics-how much is too much? Microchem J. 2012;105:32-8
24. Ye X, Blonder J, Veenstra TD. Targeted proteomics for validation of biomarkers in clinical samples. Brief Funct Genomic Proteomic. 2009;8:126-35
25. Method of the Year 2012. Nat Methods. 2013;10:1
26. Calvo E, Camafeita E, Fernandez-Gutierrez B. et al. Applying selected reaction monitoring to targeted proteomics. Expert Rev Proteomics. 2011;8:165-73
27. Balogh LM, Kimoto E, Chupka J. et al. Membrane protein quantification by peptide-based mass spectrometry approaches: studies on the organic anion-transporting polypeptide family. J Proteomics Bioinform. 2013;6:229-36
28. Elschenbroich S, Kislinger T. Targeted proteomics by selected reaction monitoring mass spectrometry: applications to systems biology and biomarker discovery. Mol Biosyst. 2011;7:292-303
29. Kiyonami R, Schoen A, Prakash A. et al. Increased selectivity, analytical precision, and throughput in targeted proteomics. Mol Cell Proteomics. 2011;10:M110.002931
30. Kim YJ, Gallien S, van Oostrum J. et al. Targeted proteomics strategy applied to biomarker evaluation. Proteomics Clin Appl. 2013;7:739-47
31. Marx V. Targeted proteomics. Nat Methods. 2013;10:19-22
32. Matthiesen R, Kirpekar F. Identification of RNA molecules by specific enzyme digestion and mass spectrometry: software for and implementation of RNA mass mapping. Nucleic Acids Res. 2009;37:e48
33. de Bang TC, Shah P, Cho SK. et al. Multiplexed microRNA detection using lanthanide-labeled DNA probes and laser ablation inductively coupled plasma mass spectrometry. Anal Chem. 2014;86:6823-6
34. Riley JA, Brown T, Gale N. et al. Self-reporting hybridisation assay for miRNA analysis. Analyst. 2014;139:1088-92
35. Rivard MJ, Bobek LM, Butler RA. et al. The US national isotope program: current status and strategy for future success. Appl Radiat Isot. 2005;63:157-78
36. Xu F, Yang T, Chen Y. Quantification of microRNA by DNA-Peptide probe and liquid chromatography-tandem mass spectrometry-based quasi-targeted proteomics. Anal Chem. 2016;88:754-63
37. Javaherian S, Musheev MU, Kanoatov M. et al. Selection of aptamers for a protein target in cell lysate and their application to protein purification. Nucleic Acids Res. 2009;37:e62
38. Pan S, Sun X, Lee JK. Stability of complementary and mismatched DNA duplexes: Comparison and contrast in gas versus solution phases. Int J Mass spectrom. 2006;253:238-48
39. Soe MJ, Moller T, Dufva M. et al. A sensitive alternative for microRNA in situ hybridizations using probes of 2'-O-methyl RNA + LNA. J Histochem Cytochem. 2011;59:661-72
40. 2001. Biopharmaceutics Coordinating Committee in CDER, Guidance for industry-bioanalytical method validation. http://www.fda.gov/downloads/Drugs/GuidanceComplianceRegulatoryInformation/Guidances/ucm070107.pdf
41. Barnidge DR, Dratz EA, Martin T. et al. Absolute quantification of the G protein-coupled receptor rhodopsin by LC/MS/MS using proteolysis product peptides and synthetic peptide standards. Anal Chem. 2003;75:445-51
42. Zhang Y, Li M, Wang H. et al. Profiling of 95 microRNAs in pancreatic cancer cell lines and surgical specimens by real-time PCR analysis. World J Surg. 2009;33:698-709
43. Optimization of Peak Capacity in One- and Two-Dimensional Nano LC. 2010 Haan B, Eeltink S, Sneekes E, et al. http://www.dionex.com/en-us/webdocs/70908-PO-Optimization-Peak-Capacity-19Mar2010-LPN2490-01.pdf
44. Otto A, Bernhardt J, Hecker M. et al. Chapter 3-Proteomics: From relative to absolute quantification for systems biology approaches. Harwood C, ed. Methods in Microbiology, Academic Press. 2012:81-106
45. Oswald S, Gröer C, Drozdzik M. et al. Mass spectrometry-based targeted proteomics as a tool to elucidate the expression and function of intestinal drug transporters. AAPS J. 2013;15:1128-40
46. Fusaro VA, Mani DR, Mesirov JP. et al. Prediction of high-responding peptides for targeted protein assays by mass spectrometry. Nat Biotechnol. 2009;27:190-8
47. Zhang D, Peng Y, Qi H. et al. Label-free electrochemical DNA biosensor array for simultaneous detection of the HIV-1 and HIV-2 oligonucleotides incorporating different hairpin-DNA probes and redox indicator. Biosens Bioelectron. 2010;25:1088-94
48. Wang MZ, Wu JQ, Dennison JB. et al. A gel-free MS-based quantitative proteomic approach accurately measures cytochrome P450 protein concentrations in human liver microsomes. Proteomics. 2008;8:4186-96
49. Xu F, Yang T, Sheng Y. et al. Simultaneous quantification of protein phosphorylation sites using liquid chromatography-tandem mass spectrometry-based targeted proteomics: a linear algebra approach for isobaric phosphopeptides. J Proteome Res. 2014;13:5452-60
50. Xu Q, Zhu M, Yang T. et al. Quantitative assessment of human serum transferrin receptor in breast cancer patients pre- and post-chemotherapy using peptide immunoaffinity enrichment coupled with targeted proteomics. Clin Chim Acta. 2015;448:118-23
51. Yang T, Xu F, Zhao Y. et al. A liquid chromatography-tandem mass spectrometry-based targeted proteomics approach for the assessment of transferrin receptor levels in breast cancer. Proteomics Clin Appl. 2014;8:773-82
52. Kuhn E, Wu J, Karl J. et al. Quantification of C-reactive protein in the serum of patients with rheumatoid arthritis using multiple reaction monitoring mass spectrometry and 13C-labeled peptide standards. Proteomics. 2004;4:1175-86
53. Kutanzi KR, Yurchenko OV, Beland FA. et al. MicroRNA-mediated drug resistance in breast cancer. Clin Epigenetics. 2011;2:171-85
54. Optimization of trypsin digestion for MRM quantification. 2012 Doneanu C, Yang H, Rainville P, et al. http://www.waters.com/webassets/cms/library/docs/720004507en.pdf
55. Nitin N, Santangelo PJ, Kim G. et al. Peptide-linked molecular beacons for efficient delivery and rapid mRNA detection in living cells. Nucleic Acids Res. 2004;32:e58
56. Kim D, Herr AE. Protein immobilization techniques for microfluidic assays. Biomicrofluidics. 2013;7:41501
57. Gingeras TR, Kwoh DY, Davis GR. Hybridization properties of immobilized nucleic acids. Nucleic Acids Res. 1987;15:5373-90
58. Urbanek MO, Nawrocka AU, Krzyzosiak WJ. Small RNA detection by in situ hybridization methods. Int J Mol Sci. 2015;16:13259-86
59. Rychlik W. Reference manual. OLIGO™ version 4.0 for Macintosh. National Biosciences. 1992
60. Budagumpi S, Kulkarni NV, Kurdekar GS. et al. Synthesis and spectroscopy of Co(II), Ni(II), Cu(II) and Zn(II) complexes derived from 3,5-disubstituted-1H-pyrazole derivative: a special emphasis on DNA binding and cleavage studies. Eur J Med Chem. 2009;45:455-62
61. Defoort JP, Martin M, Casano B. et al. Simultaneous detection of multiplex-amplified human immunodeficiency virus type 1 RNA, hepatitis C virus RNA, and hepatitis B virus DNA using a flow cytometer microsphere-based hybridization assay. J Clin Microbiol. 2000;38:1066-71
62. Duan D, Zheng KX, Shen Y. et al. Label-free high-throughput microRNA expression profiling from total RNA. Nucleic Acids Res. 2011;39:e154
63. Geissler D, Stufler S, Lohmannsroben HG. et al. Six-color time-resolved Forster resonance energy transfer for ultrasensitive multiplexed biosensing. J Am Chem Soc. 2012;135:1102-9
64. Madic J, Peytavin de Garam C, Vingadassalon N. et al. Simplex and multiplex real-time PCR assays for the detection of flagellar (H-antigen) fliC alleles and intimin (eae) variants associated with enterohaemorrhagic Escherichia coli (EHEC) serotypes O26:H11, O103:H2, O111:H8, O145:H28 and O157:H7. J Appl Microbiol. 2010;109:1696-705
65. Vrba L, Munoz-Rodriguez JL, Stampfer MR. et al. miRNA gene promoters are frequent targets of aberrant DNA methylation in human breast cancer. PLoS One. 2013;8:e54398
Author contact
![]() Corresponding author: Dr. Yun Chen, School of Pharmacy, Nanjing Medical University, 818 Tian Yuan East Road, Nanjing, 211166, China Phone: 86-25-86868326 Email: ychenedu.cn Fax: 86-25-86868467
Corresponding author: Dr. Yun Chen, School of Pharmacy, Nanjing Medical University, 818 Tian Yuan East Road, Nanjing, 211166, China Phone: 86-25-86868326 Email: ychenedu.cn Fax: 86-25-86868467
Citation styles
APA
Xu, F., Zhou, W., Cao, J., Xu, Q., Jiang, D., Chen, Y. (2017). A Combination of DNA-peptide Probes and Liquid Chromatography-Tandem Mass Spectrometry (LC-MS/MS): A Quasi-Targeted Proteomics Approach for Multiplexed MicroRNA Quantification. Theranostics, 7(11), 2849-2862. https://doi.org/10.7150/thno.19113.
ACS
Xu, F.; Zhou, W.; Cao, J.; Xu, Q.; Jiang, D.; Chen, Y. A Combination of DNA-peptide Probes and Liquid Chromatography-Tandem Mass Spectrometry (LC-MS/MS): A Quasi-Targeted Proteomics Approach for Multiplexed MicroRNA Quantification. Theranostics 2017, 7 (11), 2849-2862. DOI: 10.7150/thno.19113.
NLM
Xu F, Zhou W, Cao J, Xu Q, Jiang D, Chen Y. A Combination of DNA-peptide Probes and Liquid Chromatography-Tandem Mass Spectrometry (LC-MS/MS): A Quasi-Targeted Proteomics Approach for Multiplexed MicroRNA Quantification. Theranostics 2017; 7(11):2849-2862. doi:10.7150/thno.19113. https://www.thno.org/v07p2849.htm
CSE
Xu F, Zhou W, Cao J, Xu Q, Jiang D, Chen Y. 2017. A Combination of DNA-peptide Probes and Liquid Chromatography-Tandem Mass Spectrometry (LC-MS/MS): A Quasi-Targeted Proteomics Approach for Multiplexed MicroRNA Quantification. Theranostics. 7(11):2849-2862.
This is an open access article distributed under the terms of the Creative Commons Attribution (CC BY-NC) license (https://creativecommons.org/licenses/by-nc/4.0/). See http://ivyspring.com/terms for full terms and conditions.