Theranostics
13.3
Impact Factor
- Current Issue
- Advance Articles
- Volume 16; 2026
- Volume 15; 2025
- Volume 14; 2024
- Volume 13; 2023
- Volume 12; 2022
- Archive
- Cover Images
- Cover Suggestion
- Special Issues
Top
Introduction
Materials and Methods
Results and Discussion
Conclusion
Acknowledgements
Supplementary Material
Abbreviations
References
Introduction
Materials and Methods
Results and Discussion
Conclusion
Acknowledgements
Supplementary Material
Abbreviations
References
International Journal of Biological Sciences
International Journal of Medical Sciences
 Global reach, higher impact

Theranostics 2017; 7(18):4537-4550. doi:10.7150/thno.19546 This issue Cite
Research Paper
pH-Responsive Aerobic Nanoparticles for Effective Photodynamic Therapy
Lingyue Shen1, Yu Huang2, Dong Chen2, Feng Qiu3, Chuan Ma1, Xin Jin1, Xinyuan Zhu2, ![]() , Guoyu Zhou1,
, Guoyu Zhou1, ![]() , Zhiyuan Zhang1,
, Zhiyuan Zhang1, ![]()
1. Department of Oral & Maxillofacial-Head & Neck Oncology, Shanghai Key Laboratory of Stomatology Cosmetic Laser Center, Ninth People's Hospital, Shanghai Jiao Tong University School of Medicine, Shanghai 200011, P. R. China.
2. School of Chemistry and Chemical Engineering, Shanghai Key Lab of Electrical Insulation and Thermal Aging, Shanghai Jiao Tong University, 800 Dongchuan Road, Shanghai, 200240, P. R. China.
3. School of Chemical and Environmental Engineering, Shanghai Institute of Technology, 100 Haiquan Road, Shanghai 201418, P. R. China.
Received 2017-2-7; Accepted 2017-8-28; Published 2017-10-13
Citation:
Shen L, Huang Y, Chen D, Qiu F, Ma C, Jin X, Zhu X, Zhou G, Zhang Z. pH-Responsive Aerobic Nanoparticles for Effective Photodynamic Therapy. Theranostics 2017; 7(18):4537-4550. doi:10.7150/thno.19546. https://www.thno.org/v07p4537.htm
Other stylesAbstract

Rationale: Photodynamic therapy (PDT), an O2-dependent treatment for inhibition of cancer proliferation, suffers from the low therapeutic effect in clinical application due to the hypoxic microenvironment in tumor cells.
Methods: To overcome this obstacle, a stimuli-responsive drug delivery system with O2 self-sufficiency for effective PDT was developed. In this study, pH-responsive aerobic nanoparticles were prepared by the electrostatic interaction between the O2-evolving protein Catalase and Chitosan. Subsequently, the photosensitizer Chlorin e6 (Ce6) was encapsulated in the nanoparticles.
Results: The nanoparticles exhibited high stability in aqueous medium and efficient cellular uptake by tumor cells facilitating their accumulation in tumors by enhanced permeability and retention (EPR) effect. In acidic environment, irradiation caused disassembly of the nanoparticles resulting in the quick release of Catalase and the photosensitizer with continuous formation of cytotoxic singlet oxygen (1O2) greatly enhancing the PDT efficacy in hypoxic tumor tissues both in vitro and in vivo biological studies.
Conclusion: Due to the unique O2 self-sufficiency, the nanoparticles, upon irradiation, exhibited higher anticancer activity than free Ce6 both in vitro and in vivo. Our work has identified a new pH-triggered strategy to overcome hypoxia for effective PDT against cancer cells.
Keywords: pH-Responsive, Nanoparticles, Catalase, Hydrogen Peroxide, Photodynamic Therapy
Introduction
Photodynamic therapy (PDT), as a noninvasive treatment technique, holds great promise in the clinical application of anticancer therapy [1, 2], especially for superficial tumors (e.g. esophageal cancer, bladder cancer, and malignant melanoma) [3, 4]. This technique offers unique advantages of selective and irreversible damage to the target lesion and minimal complications from side effects [5, 6]. In PDT, the cytotoxic singlet oxygen (1O2) is generated from O2 by activation of the photosensitizer (PS) with appropriate excitation light, leading to cellular apoptosis in the tumor lesion [7, 8]. Various strategies including nanomicellization, functionalization with antibodies, and two-photon absorption technology have been employed to improve the PDT efficiency [9-16]. However, these strategies fail to enhance the generation of 1O2, due to the O2-dependent nature of PDT [17, 18]. Furthermore, solid tumors are known to have hypoxic microenvironment [19] in which the limited degree of O2 poses a significant obstacle to clinical application of PDT. Thus, development of a novel PDT system with O2 self-sufficiency would be a significant advancement over traditional PDT agents for overcoming tumor hypoxia.
To date, some smart systems containing O2-evolving agents such as Catalase [20], red blood cell-derived vesicles [21], VEGFR-targeting tyrosine kinase inhibitor axitinib [22], hemoglobin [23], and hyperbaric oxygen [24] have been reported to achieve success in inhibiting tumors by traditional PDT treatment. Among these, Catalase, the hydrogen peroxide (H2O2) reduction enzyme, is considered a promising candidate for PDT, due to the high concentration of H2O2 in solid tumors [25]. Recently, Chen and coworkers have exploited a smart nanoparticle by encapsulating Catalase and methylene blue with the poly(D,L-lactic-co-glycolic acid) for PDT [20]. In this system, Catalase, after being released from the nanoparticles, could generate high level of O2 by activating the intracellular H2O2 in the tumor tissue. This is a slow process taking tens of hours for the sustained release of Catalase due to the slow diffusion-controlled mechanism and low H2O2 response ability. For efficient PDT treatment, however, rapid Catalase release after nanoparticles accumulation at the tumor site would enhance generation of O2. In this respect, exploitation of novel polymeric systems with rapid O2-evolving ability in the tumor is highly desirable.
Macropinocytosis is one of the mechanisms for the entry of polymeric nanoparticles into the tumor [26]. Exploiting the acidic tumoral microenvironment of endosomes and lysosomes, pH-responsive polymeric nanomaterials are well developed for drug delivery [27-29]. Compared with conventional nanoparticles containing pH-sensitive covalent linkage, supramolecular nanoparticles based on noncovalent interactions (e.g. hydrogen bonding, host-guest and electrostatic interactions) have been shown to be more sensitive to acidic stimuli. Among these noncovalent interactions, electrostatic interaction is a facile strategy for designing smart nanoparticles with rapid response abilities. Due to the negatively charged characteristics of Catalase, the enzyme could be combined with a biocompatible positively charged polymer, and the resulting supramolecular nanoparticles with rapid O2-evolving property could be used for enhanced PDT.
Scheme 1
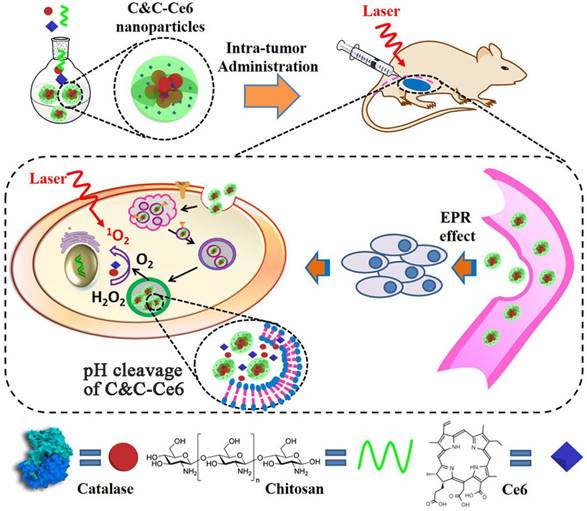
Illustration of self-assembly for Catalase & Chitosan-Ce6 (C&C-Ce6) nanoparticles and the pH-triggered release of Catalase for rapid O2-release for effective PDT.
In the present study, the pH-sensitive aerobic nanoparticles were fabricated successfully by the electrostatic interaction of Catalase with Chitosan, which self-assembled into micelles in an aqueous medium with nanoscale dimension. These novel pH-responsive nanoparticles exhibited rapid responsiveness to acidic stimulus, low cytotoxicity, and excellent cellular uptake and could be used as polymeric carriers to encapsulate Chlorin e6 (Ce6) photosensitizer for PDT. Compared to free Ce6-based PDT, the Ce6-loaded nanoparticles showed high efficiency for inhibiting the proliferation of CAL-27 cells after short incubation time under irradiation at 650 nm laser, since the rapidly releasing of Catalase to overcome the hypoxic microenvironment in tumor tissues.
Materials and Methods
Materials
Chitosan (low molecular weight, 75.0% deacetylation), Catalase, hydrogen peroxide (H2O2), 3-(4,5-dimethylthiazol-2-yl)-2,5-diphenyl-tetrazolium bromide (MTT), and formaldehyde were obtained from Sigma-Aldrich (St. Louis, MO, USA). Chlorin e6 (Ce6) (MW = 596.68, 93-98%) was purchased from J&K Scientific Co (Shanghai, China). 9,10-Diphenylanthracene (DPA) was supplied by Alfa Aesar Co. (Shanghai, China). Dye Hoechst nuclear agent, AnnexinV-FITC apoptosis kit, and 2',7'-dichlorodihydrofluorescein diacetate (H2DCFDA) were purchased from Life Technologies Co. DMEM high glucose medium (HyClone), fetal bovine serum (HyClone), Penicillin-Streptomycin Solution (HyClone), 0.25% trypsin (containing 0.02% EDTA), and phosphate-buffer saline (PBS) were purchased from Corning Costar Co. (Shanghai, China). Ultrapure water was prepared with a Millipore Simplicity System (Millipore, Bedford, USA).
Measurements
Transmission electron microscopy (TEM)
TEM studies of Catalase & Chitosan-Ce6 nanoparticles were performed on a JEOL 2010 microscope at an accelerating voltage of 200 kV. Samples were prepared for measurement by dropping the solution onto a carbon-coated copper grid and following negative staining with 2.0% (w/v) phosphotungstic acid before measurement.
Dynamic light scattering (DLS)
DLS measurements were performed by a Zetasizer Nano ZS90 (Malvern Instruments Ltd.) equipped with a 125 mW laser at 25 °C. The scattering angle was kept at 173° and the wavelength was set as 633 nm.
Fourier transform infrared spectra (FTIR)
FTIR spectra were recorded on a Paragon 1,000 instrument by KBr sample holder method.
Ultraviolet-visible absorption (UV-Vis)
UV-Vis absorption of the sample solutions was measured at room temperature by using a Thermo Electron-EV300 UV-Vis spectrophotometer.
Phosphorescent spectra
The phosphorescent spectra of samples in D2O were performed on QC-4-CW spectrometer, provided by Photon Technology International, Int. USA/CAN. The excitation wavelength was set at 650 nm. The step increment was set as 2 nm, and scan speed was set as 480 nm min-1.
Circular dichroism spectra (CD)
The circular dichroism spectra of samples were measured at room temperature on a JASCO J-600 spectropolarimeter.
Methods
Preparation of Catalase & Chitosan-Ce6 (C&C-Ce6) nanoparticles
Chitosan (2 mg mL-1 in acetic acid aqueous solution) and Ce6 (10 mg in 200 uL DMSO) were mixed in darkness for 2 h, then 10 mg mL-1 Catalase in PBS was added. The solution was kept in an ice bath in darkness for another 2 h. Subsequently, the mixture was dialyzed overnight at 4 °C (MWCO = 100 kD). The reactant was then subjected to ultrafiltration centrifugation at 1000 × g at 4 °C for 10 min to remove free Ce6 and large ghosts. After filtration and purification, the product was stored at -20 °C for later use.
In vitro Ce6 release
A total of 5 mL of C&C-Ce6 nanoparticles (5 mg mL-1) was transferred into a dialysis bag (MWCO = 200 kD). It was immersed in 20 mL of phosphate buffer (pH 7.4) or acetate buffer (pH 5.5) solutions to acquire sink conditions, and we put the solutions in a shaking water bath at 37 oC. We took away 2 mL of the external buffer at predetermined time intervals, and filled the buffer with an equal volume of fresh medium. The amount of released Ce6 was analyzed by UV-Vis spectroscopy with the excitation at 404 nm. We conducted the experiments in triplicate and the results were the average of data points.
1O2 phosphorescence measurements and 1O2 generation capability
C&C-Ce6 nanoparticles and Ce6 were dispersed in D2O (1 mg mL-1) and subsequently used for 1O2 sensitization. The concentration of H2O2 was 50 mmol mL-1. Phosphorescence emission of 1O2 was recorded using a luminescence spectrometer (FLS920, Edinburgh, equipped with a 450 W broadband Xe lamp) with a 1000 nm long pass filter (Isuzu Optics, LP1000) located between the sample and the detector to cut off both the scattering light and stray light of a wavelength < 1000 nm.
O2 generation evaluation
Sodium hydrosulfite was used to produce deoxygenated PBS. C&C-Ce6 nanoparticles, free Ce6, Chitosan+Ce6 nanoparticles, and PBS as control were dispersed in 25 mL of deoxygenated PBS. Then, 10 mL of liquid paraffin was added to isolate deoxygenated PBS and air. Finally, 50 μmol mL-1 H2O2 deoxygenated PBS was added into the solution gradually. A DOG-3082 oxygen dissolving meter was used to measure the O2 generation in real-time.
Measurement of intracellular ROS
Cells (2 × 10⁵) were seeded in clear-bottom black 96-well plates and allowed to adhere overnight. After 24 h, the cells were washed with HBSS (1 × 100 μL) and pre-stained with 2′,7′-dichlorodihydrofluorescein diacetate (H2DCFDA) (15 μM in 100 μL HBSS) for 45 min at 37 °C. After washing with HBSS (1 × 100 μL), the cells were treated with the drug for the indicated duration. The drug was diluted in supplemented HBSS (containing 10% FBS). At the indicated time, the fluorescence signal at the plate bottom (Ex: 485 nm / Em: 535 nm) was read without washing using a microplate reader (BioTek), taking into account background fluorescence.
Cell internalization
Cell internalization was characterized by flow cytometry and confocal laser scanning microscopy (CLSM). Flow cytometry was used to provide statistics on the adhesion of C&C-Ce6 nanoparticles in CAL-27 cells, which were seeded at a density of 5.0 × 10⁵ cells per well in a 6-well tissue culture plate. After 24 h of culture, C&C-Ce6 nanoparticles dissolved in DMEM culture medium with a Hoechst concentration of 10 mg mL-1 were added to different wells, and the cells were incubated at 37 °C for predetermined time intervals. After incubation for 1, 2, 4, and 6 h, samples were prepared for flow cytometry analysis by removing the cell growth media, rinsing the cells with PBS buffer, and treating with trypsin. Data were collected for 1.0 × 10⁴ gated events, and analysis was performed using a BD FACSCalibur flow cytometer and the CELLQuest software. For CLSM, CAL-27 cells (2.0 × 10⁵ cells per well) were seeded on coverslips in a 6-well tissue culture plate. After 24 h of culture, FITC-labelled C&C-Ce6 dissolved in DMEM culture medium with a Ce6 concentration of 10 mg mL-1 was added to the wells, and the cells were incubated at 37 °C for predetermined time intervals. After washing with PBS, the cells were fixed with 4% formaldehyde for 30 min at room temperature, and the slides were washed with PBS three times. The slides were observed with a LSM510 META.
In vitro dark-cytotoxicity of free Ce6 and C&C-Ce6
In vitro dark-cytotoxicity of free Ce6 and C&C-Ce6 was evaluated by MTT assay. Both CAL-27 and L929 cells were seeded in 96-well plates at an initial seeding density of 8.0 × 10³ cells per well in 200 μL of medium. After 24 h of incubation, the culture medium was removed and replaced with 200 μL of medium containing serial concentrations of free Ce6 and C&C-Ce6. The Ce6 concentrations were varied as follows: 1, 5, 10, 20, 30, 60, 120, 240 and 360 μg mL-1. Following 24 h and 48 h incubation with different drugs, 20 μL of MTT assay stock solution (5 mg mL-1) in PBS was added to each well. After incubating the cells for 4 h, the medium containing unreacted MTT was removed. The blue formazan crystals obtained were dissolved in 200 μL per well DMSO, and the absorbance was measured in a Varioskan Flash at a wavelength of 490 nm.
In vitro PDT effect of free Ce6 and C&C-Ce6
The effect of C&C-Ce6-mediated PDT against CAL-27 cells and Hela cells was evaluated in vitro by MTT assay. Here, free Ce6 with the same concentration was used as the control. CAL-27 cells were seeded in 96-well plates at an initial seeding density of 8.0 × 10³ cells per well in 200 μL of medium. After 24 h of incubation, the culture medium was removed and replaced with 200 μL of medium containing serial concentrations of C&C-Ce6, free Ce6, Catalase+Ce6 mixture, Chitoson+Ce6 nanoparticles, free Chitosan, Catalase, and PBS as a control. The Ce6 concentrations were varied as follows: 0.20, 0.39, 0.78, 1.56, 3.13, 6.25, 12.5, 25, and 50 μg mL-1. Following 4 h incubation with the different drugs, the cells were exposed to 25 J cm-2 of 650 nm laser delivered at an irradiance of 100 mW cm-2. Subsequently, 20 μL of 5 mg mL-1 MTT assay stock solution in PBS was added to each well. After incubating the cells for 4 h, the medium containing unreacted MTT was removed. The blue formazan crystals obtained were dissolved in 200 μL per well DMSO, and the absorbance was measured in a Varioskan Flash at a wavelength of 490 nm.
Caspase-3 protein activity assay
CAL-27 cells were seeded in 6-well plates at 5.0 × 10⁵ cells per well in complete DMEM and cultured for 24 h. The cells were treated with C&C-Ce6, free Ce6, Catalase+Ce6 mixture, Chitoson+Ce6 nanoparticles, Chitosan and Catalase at the same Ce6 concentration (15 μg mL-1) and Catalase concentration (10 mg mL-1) for 24 h. Treatment with PBS was used as a control. After 24 h of incubation, the cells were subsequently exposed to 25 J cm-2 of 650 nm laser light delivered at an irradiance of 100 mW cm-2. The culture medium was then removed and the cells were rinsed with PBS twice. Next, 2 mL of cold PBS was added to each plate, the cells were scraped from the plate and collected in centrifuge tubes. The solutions were centrifuged twice at 800 rpm for 8 min at 25 °C. After removal of the supernatant, the cells were resuspended in 200 μL of cell lysis buffer and kept on ice for 30 min. Lysates were transferred in micro-centrifuge tubes and centrifuged at 10,000 rpm for 100 s at 4 °C. The protein content in the supernatant was determined by BCA protein assay and then adjusted to the same concentration. 70 μL of the protein solution was distributed in each well of a 96-well plate. Subsequently, 50 μL of 2 × reaction buffer (containing 10 mM DTT) and 5 μL of the DEVD-pNA caspase-3 substrate were added to reach a final concentration of 200 µM. The absorbance at 405 nm was read after 2 h of incubation at 37 °C with a BioTek Synergy H4 hybrid reader. The blank was subtracted from the measured optical density (OD) values, and the caspase-3 activity was expressed as the fold-change compared to untreated control cells.
Western blot assay
CAL-27 cells were lysed using radio-immunoprecipitation assay (RIPA) buffer 24 h after PDT. Equivalent amounts of protein were electrophoresed on 10% polyacrylamide gels and transferred to a polyvinylidene fluoride membrane. After blocking with 5% skim milk for 1 h, primary antibodies were bound overnight at 4 °C. Each membrane was probed with horseradish peroxidase-labeled goat anti-rabbit IgG antibody for 1.5 h. The grayscale image of each labeled protein band was analyzed using the Quantity One software (version 4.4.0; Bio-Rad).
Animal and tumor model
Specific pathogen-free (SPF) female BALB/c nude mice, 4~6 weeks of age, were obtained from Shanghai Laboratory Animal Center and bred in an axenic environment. All animal operations were in accord with institutional animal use and care regulations approved by the Model Animal Research Center of Shanghai Jiao Tong University. CAL-27 oral squamous cell carcinoma tumor-bearing mice model was set up by subcutaneous injection of CAL-27 cells (1 × 10⁶) into the right side of back of the mice. Length (a) and width (b) sizes of the tumor were measured with a vernier caliper once every two days and the tumor volumes (V) were calculated with the following formula: V = (ab2) / 2. The mice were randomly divided into five groups for intratumoral injection treatment: Group A: C&C-Ce6; Group B: free Ce6; Group C: Catalase+Ce6 mixture; Group D: Chitosan+Ce6 nanoparticles; Group E: normal saline as control.
Drug distribution in tumor-bearing nude mice
The drug biodistribution studies were performed on tumor-bearing nude mice. The mice were intravenously injected via tail vein with C&C-Ce6 and free Ce6 at a Ce6 dose of 1 mg kg-1. The animal imaging was monitored at predetermined time intervals of 5 min, 15 min, 30 min, 1 h, 2 h, 4 h, and 8 h by a ZKKS-MI in vivo fluorescence imager with the 625 nm excitation laser over the course of 12 h.
In vivo PDT study of C&C-Ce6
After tumor volume increased to about 300 mm3, we performed the photodynamic therapy with different drugs by intra-tumor injection. The mice were randomly divided into five groups: Group A: C&C-Ce6; Group B: free Ce6; Group C: Catalase+Ce6 mixture; Group D: Chitosan+Ce6; Group E: normal saline as control. The dose of Ce6 and Catalase was 1 mg kg-1 and 1 mg mL-1, respectively. After 4 h of injection, tumor area was irradiated for 600 s with 650 nm semiconductor laser (100 mW cm-2, 12 J cm-2). To observe the postoperative change, the mice were sacrificed two weeks later. The tumors were harvested and fixed in 10% formaldehyde for H&E staining, as well as HIF-1α and caspase-3 staining.
Statistical analysis
All experiments were conducted at least three times. Data are presented as means ± standard deviation. Statistical significance (p < 0.05) was evaluated using Student's t-test when only two groups were compared. When more than two groups were compared, evaluation of significance was performed using one-way analysis of variance (ANOVA) followed by Bonferroni's post hoc test. In all tests, statistical significance was set at p < 0.05. The software Statistical Package for the Social Sciences (SPSS) was used.
Results and Discussion
The Catalase-containing nanoparticles (C&C) were fabricated successfully through the electrostatic interaction between the negatively charged enzyme and positively charged Chitosan. Due to the existence of a hydrophobic segment in the nanoparticles, Ce6 could be encapsulated to form C&C-Ce6 nanoparticles via one-pot method in the aqueous medium. According to the ultraviolet-visible (UV-Vis) spectra, the encapsulation efficiency of Ce6 in the nanoparticles was calculated to be 17.5%, which is much higher than that of the amphiphilic block polymers. To verify the capture of Ce6 into nanoparticles, the UV-Vis absorption of free Ce6 and C&C-Ce6 was determined by UV-Vis measurement. In Figure 1, free Ce6 (dispersed in the PBS (pH 7.4) with 1% (v/v) DMSO) exhibits an intense Soret band at 390 nm together with two weak Q-bands at 529 nm and 641 nm. After encapsulation into the nanoparticles, remarkable red shift and peak broadening of the UV-Vis spectrum for C&C-Ce6 were observed indicating the non-covalent plasmonic interactions of Ce6 in the nanoparticles under hydrophobic condition. The structure of C&C-Ce6 was further investigated by FTIR spectra (Figure S1), which was in agreement with their UV-Vis result. The ζ potential of C&C-Ce6 nanoparticles was 12.08 ±1.70 mV, which was similar to that of Chitosan (14.99 ± 0.53 mV), demonstrating that the external shell of C&C-Ce6 was covered by positively charged Chitosan and the Catalase was well wrapped in the interior of nanoparticles.
Figure 1
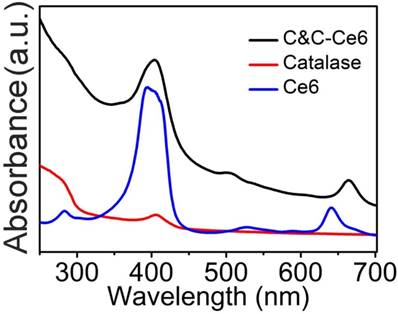
The UV-Vis absorption spectra of free Ce6, native Catalase, and C&C-Ce6 at 0.1 mg mL-1 concentration.
Figure 2
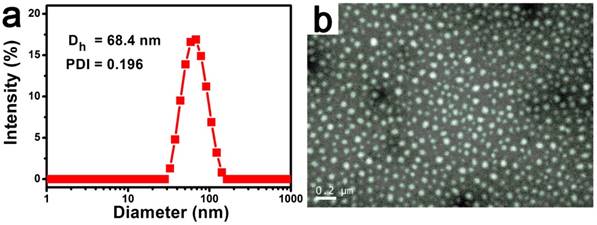
DLS plot (a) and TEM image (b) of C&C-Ce6 nanoparticles.
To further study the properties of complex nanoparticles, the size and morphology of C&C-Ce6 nanoparticles were tested by DLS and TEM measurements. TEM result in Figure 2a shows that complexes of C&C-Ce6 could aggregate into uniform spherical micelles through electrostatic interaction in aqueous solution with the mean diameter from 50 to 80 nm. DLS also revealed that the size of C&C-Ce6 was unimodal distribution with average diameter of 68.5 nm, which was in accordance with the data from TEM Figure 2b. These nanoparticles showed high stability in aqueous solution without any precipitation for several days. DLS results exhibited that the diameter of C&C-Ce6 remained unchanged in the first 7 days (Figure S2a), suggesting the nanoparticles could be isolated by the electrostatic repulsion of Chitosan on the surface of C&C-Ce6 and were stable in aqueous medium. Moreover, the stability of C&C-Ce6 nanoparticles in either PBS at pH 7.4 (comparable to the cytoplasm environment) or acetate buffer at pH 5.5 (comparable to the lysosome environment) has also been investigated. As shown in Figure S2b, the diameter of C&C-Ce6 remained unchanged in the neutral aqueous medium, however, the diameter of nanoparticles decreased dramatically in the first 60 min in the acidic environment, demonstrating the degradation of C&C-Ce6 nanoparticles originating from pH responsive nature between Catalase and Chitosan.
To assess the potential of C&C-Ce6 nanoparticles based on the electrostatic interaction, the pH-triggered release of Ce6 from C&C-Ce6 was investigated. The nanoparticles were suspended in either PBS (pH = 7.4) or acetate buffer (pH = 5.5) in a dialysis membrane tubing at 37 °C. The amount of released Ce6 at predetermined time intervals was monitored by UV-Vis measurement. As illustrated in Figure 3, the Ce6 release profile of C&C-Ce6 in PBS at pH 7.4 showed a fast release in the first 12 h followed by a sustained slow release over a prolonged time. Less than 30% of Ce6 was released in 80 h in the neutral environment probably by concentration gradient of Ce6 between C&C-Ce6 nanoparticles and PBS solution. In an acidic buffer, the cumulative release of Ce6 from C&C-Ce6 was much higher than that at pH 7.4, and could reach to 75% of Ce6 after 80 h. Electrostatic adherence is a weak interaction that can be cleaved at an acidic or basic pH. Thus, at pH 5.5, Ce6 release would be accelerated by the disassembly of C&C-Ce6 nanoparticles.
Figure 3
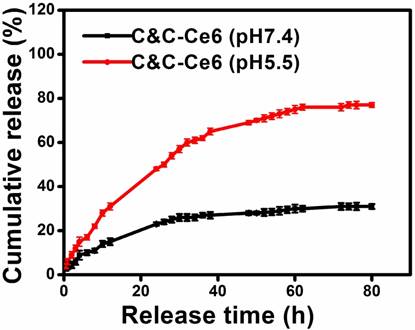
In vitro release profiles of Ce6 from the C&C-Ce6 nanoparticles at pH 7.4 and 5.5 at 37 °C.
With the release of Ce6 and the disassembly of C&C-Ce6 nanoparticles in the acidic condition, Catalase was also released from nanoparticles. We evaluated the enzymatic activity of Catalase before and after its release from C&C-Ce6 nanoparticles. The conformation of Catalase in free state and in C&C-Ce6 was examined by circular dichroism (CD). As displayed in Figure 4a, free Catalase exhibited a set of characteristic UV absorption bands of protein in the far-ultraviolet CD spectrum region (< 250 nm), in which the positive peak at 193 nm and negative peaks at 204 and 228 nm are typically attributed to the α-helical conformation of protein while the negative peak at 216 nm originates from β-sheet conformation of the protein. Thus, the resulting CD spectra suggested that the secondary structure of Catalase was comprised of α-helical and β-sheet peptides. Interestingly, after aggregation with Chitosan to form nanoparticles, the CD spectrum of C&C-Ce6 was similar to the conformation of free Catalase, indicating that the electrostatic interaction had minimal influence on the conformation of Catalase during the formation of nanoparticles. Therefore, the activity of Catalase would be recovered after its release from the nanoparticles. To gain insight into the enzymatic activity of Catalase in nanoparticles, the O2 concentration in different PBS environments was measured. Compared with other control groups, the O2 concentration in PBS was high only in C&C-Ce6 nanoparticles due to the presence of Catalase, which could reduce H2O2 to O2 efficiently (Figure 4b). More importantly, the O2 concentration of C&C-Ce6 nanoparticles increased faster in pH 5.5 than that in pH 7.4 (Figure 4c), demonstrating the release of Catalase from degradation of C&C-Ce6 at acidic pH thereby accelerating the generation of O2.
As discussed above, the activity of Catalase could be recovered with the disassembly of C&C-Ce6 nanoparticles in the acidic environment. Thus, the increased generation of 1O2 could be realized under irradiation via catalysis of H2O2 by Catalase. It has been reported that the 1O2 can be evaluated directly by the phosphorescence spectrometer under the excitation of Ce6 at 650 nm [30]. As shown in Figure 5a, the weak phosphorescence peak at 1270 nm was observed for Ce6 in the D2O. After addition of H2O2, the phosphorescent intensity was changed slightly, indicating that H2O2 could not form 1O2 directly by excitation at 650 nm. For C&C-Ce6 at pH 5.5, the phosphorescent intensity at 1270 nm was still as low as that of free Ce6. However, the phosphorescence of C&C-Ce6 was enhanced greatly in the neutral D2O solution with the presence of H2O2, suggesting that the Catalase on the surface of nanoparticles could be activated for the generation of O2. Subsequently, the phosphorescence at 1270 nm was increased under irradiation (Figure S3). More importantly, the phosphorescent intensity of C&C-Ce6 nanoparticles was increased dramatically when they were suspended in the acidic environment releasing Catalase from C&C-Ce6 nanoparticles (Figure 5b). These results demonstrated that the increase in the phosphorescent intensity of 1O2 was strongly dependent on the enzymatic activity of Catalase in C&C-Ce6.
We used 9,10-diphenylanthracene (DPA) to quantitatively measure the amount of 1O2 generated from C&C-Ce6 nanoparticles in the simulated intracellular environments by monitoring the absorbance of DPA at 376 nm in pH 5.5. Figure 6a exhibits the time-dependent UV-Vis absorption spectra of complexes of DPA and C&C-Ce6 in the absence of H2O2. Under excitation at 650 nm, the UV-Vis absorption profile of DPA was similar to that of DPA before irradiation, and the absorbance at 376 nm decreased a little. After addition of H2O2, the intensity of absorbance peak at 376 nm of DPA decreased gradually with the increase of irradiation time (Figure 6b). The plot of absorption at 378 nm as a function of irradiation time in Figure 6c shows that the pH-triggered 1O2 generation from C&C-Ce6 nanoparticles was much efficient in the H2O2-containing solution.
Figure 4
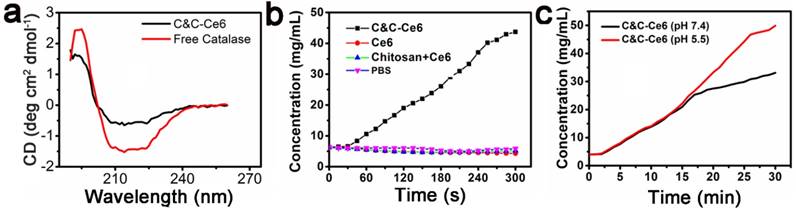
(a) Circular dichroism spectra of free Catalase and C&C-Ce6; (b) the O2 concentration in different groups of C&C-Ce6 nanoparticles, Ce6, Chitosan+Ce6, and PBS; (c) the O2 concentration of C&C-Ce6 nanoparticles in PBS at pH 7.4 & 5.5.
Figure 5
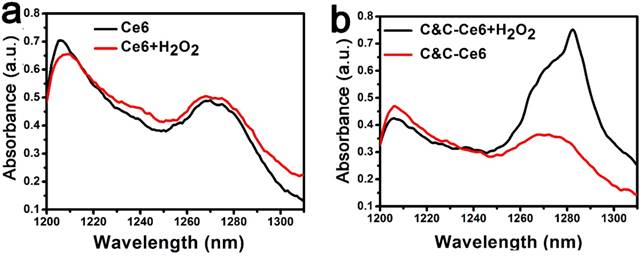
(a) The 1O2 phosphorescence spectra of Ce6 and Ce6+H2O2 upon excitation at 650 nm; (b) the 1O2 phosphorescence spectra of C&C-Ce6 and C&C-Ce6+H2O2 upon excitation at 650 nm in the acidic medium (pH 5.5).
Figure 6
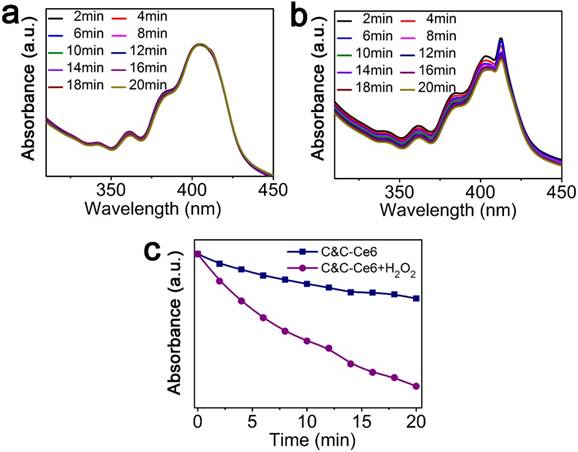
UV-Vis spectra of DPA+C&C-Ce6 in the absence (a) and presence (b) of H2O2 following irradiation for different time periods; (c) absorbance of DPA+C&C-Ce6 at 376 nm as a function of irradiation time in the absence and presence of H2O2.
Prior to using C&C-Ce6 for PDT, the cellular uptake of nanoparticles was evaluated with Ce6 concentration of 15 μg mL-1 by using flow cytometry. The results exhibited that the relative geometrical mean fluorescence intensities (GMFI) of both CAL-27 and L929 cell-associated C&C-Ce6 were much higher than that of non-pretreated cells (Figure S4). With increasing incubation time, the GMFIs of cells increased gradually. The prominent fluorescence signal of Ce6 associated with cells demonstrated the successful internalization of C&C-Ce6 nanoparticles by living cells. The endocytosis of FITC-labelled C&C-Ce6 nanoparticles was also evaluated by using a confocal laser scanning microscopy. As shown in Figure 7, the cell-associated fluorescence intensities of C&C-Ce6 increased with the incubation time, which was consistent with the results obtained from flow cytometry. Because of the nanometer size of C&C-Ce6, the green fluorescence of Catalase and red fluorescence of Ce6 were localized mainly in the cytoplasm of the cells and did not colocalize with intracellular nucleus stained by blue fluorescence of Hoechst. These results indicated that the positively charged surface of C&C-Ce6 nanoparticles facilitated their uptake into the CAL-27 cells.
Figure 7
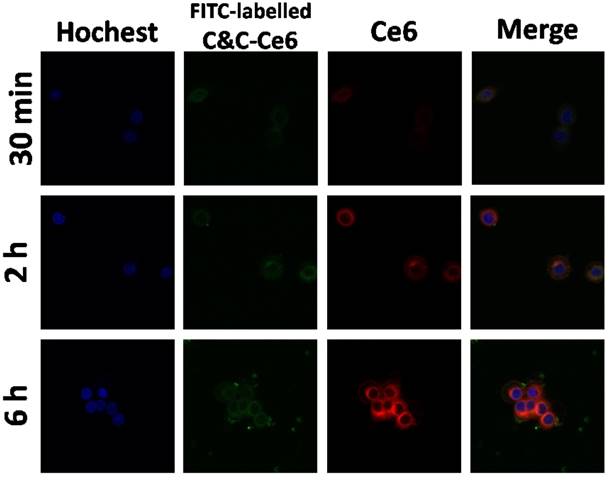
CAL-27 cells uptake of C&C-Ce6 nanoparticles by CLSM following incubation for 30 min, 2 h and 6 h.
The in vitro dark-cytotoxicity of free Ce6 and C&C-Ce6 nanoparticles was evaluated by MTT assay using L929 normal cells and CAL-27 cells. Figure S5 displays the viabilities of L929 and CAL-27 cells following incubation with free Ce6 and C&C-Ce6 nanoparticles, respectively, with the Ce6 concentration up to 360 μg mL-1. The results showed that cell viabilities both for L929 cells and CAL-27 cells without irradiation were above 85% when pretreated with free Ce6 and C&C-Ce6 nanoparticles for 24 h. After 48 h of incubation, the cell viabilities still remain 81.5% both for L929 cells and CAL-27 cells, compared to that of untreated cells. It suggests that both Ce6 and C&C-Ce6 nanoparticles show the low dark-cytotoxicity against L929 normal cells and CAL-27 cancer cells without irradiation of laser light.
In vitro phototoxicity of free Ce6, Chitosan, Catalase, Catalase+Ce6 mixture, and C&C-Ce6 nanoparticles was evaluated by photo irradiation at 650 nm with power density of 100 mW cm-2 for 10 min. As illustrated in Figure 8, cell viabilities of CAL-27 cells treated with Chitosan and Catalase were higher than 90% under light irradiation, arising from 1O2 generation. When pretreated with free Ce6, the cell viabilities decreased gradually under laser irradiation at 650 nm with more than 70% of cells dead at the Ce6 dose of 50 μg mL-1. The dosage required for 50% cellular growth inhibition (IC50 value) was 15.33 μg mL-1 for free Ce6. This result indicated that the inhibition of tumor proliferation was caused by the generation of 1O2 from Ce6 under irradiation at 650 nm. Since the phototoxicity of Ce6 to the tumor cells was highly associated with the generation of 1O2, the efficiency of PDT was restricted by the low concentration of O2 in the cytoplasm of the cells. When using the Catalase+Ce6 mixture, the IC50 value dropped to 12.02 μg mL-1, suggesting that the uptake of Catalase increased the concentration of O2 in CAL-27 cells by reducing H2O2. This formulation showed the limited improvement of PDT efficiency, attributing to the low cell internalization and easy degradation of Catalase by the tumor due to its negative charge. After the formation of C&C-Ce6 nanoparticles, the cellular uptake of Catalase was improved via charge neutralization with Chitosan. More importantly, the rapid release of Catalase from the pH-responsive nanoparticles could increase the concentration of O2 in tumor cells, leading to enhanced generation of 1O2 under light irradiation. Thus, the inhibition of CAL-27 cells using PDT was enhanced greatly by treatment of C&C-Ce6 nanoparticles and their IC50 value reached 4.03 μg mL-1, which was much lower than that of free Ce6. Similar phenomenon could be found in other tumor cells, for example in Hela cells (Figure S6).
To further confirm the effect of in vitro PDT, the concentration of intracellular reactive oxygen species (ROS) was tested by fluorescence spectrophotometry using 2,7-dichlorofluorescein diacetate (DCFH-DA), which could be converted into 2,7-dichlorofluorescein (DCF) with high fluorescent signal at 630 nm in the presence of ROS. The result in Figure S7 shows that the concentration of ROS in the intracellular microenvironment increased dramatically after incubating C&C-Ce6 nanoparticles with tumor cells under irradiation. This effect was due to the enhanced generation of O2 by catalysis of H2O2 consistent with that of the in vitro PDT effect.
Figure 8
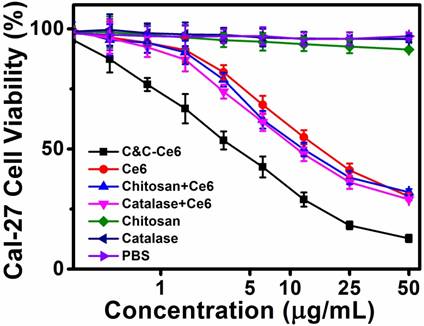
Viability of CAL-27 cells pretreated with C&C-Ce6 nanoparticles, free Ce6, Catalase+Ce6 mixture, Chitosan+Ce6 nanoparticles, free Chitosan, free Catalase, and PBS-mediated PDT cultured for 24 h after photo-irradiation.
The PDT effect of C&C-Ce6 nanoparticles on CAL-27 cells and the ensuing cell death could be evaluated by staining dual fluorescence of Annexin V-FITC/propidium iodide (PI) by flow cytometry following irradiation with a 650 nm laser at a dose of 12 J cm-2. Apoptosis of CAL-27 cells induced by PBS (as a control), free Ce6, Chitosan+Ce6 nanoparticles, and Catalase+Ce6 mixture was also determined. The results in Figure 9a show that the percentages of apoptotic cells induced by PBS, free Ce6, Chitosan+Ce6 nanoparticles, Catalase+Ce6 mixture and C&C-Ce6 nanoparticles were 9.38, 78.57, 76.7, 86.09, and 94.31%, respectively. In comparison with other formulations, at the same dose, the C&C-Ce6 nanoparticles induced the highest apoptotic rate in CAL-27 cells due to its enhanced 1O2 generation ability in tumors.
Caspase-3, a key effector of cell apoptosis, has been widely used to identify increased apoptosis in response to PDT [31-33]. To verify activation of caspase-3 by C&C-Ce6 nanoparticles Ac-DEVD-pNA was utilized as a substrate to detect the protein expression of caspase-3 (Figure 9b). The CAL-27 cells were treated with free Ce6, Chitosan+Ce6 nanoparticles, Ce6+Catalase mixture, and C&C-Ce6 nanoparticles at the Ce6 concentration of 15 μg mL-1 for 6 h. Compared with untreated CAL-27 cells as a control, the caspase-3 protein expression pretreated with Chitosan and Catalase increased slightly. However, protein expression of caspase-3 increased dramatically after incubation with Ce6. In particular, C&C-Ce6-activated expression of caspase-3 protein was the highest of all formulations and was over 1.5 times higher than that of the control. These results demonstrated that C&C-Ce6-mediated PDT was an effective strategy to activate apoptosis of CAL-27 cells.
The increase in the apoptosis-related protein caspase-3 was further confirmed by Western blot analysis. CAL-27 cells were incubated with PBS, free Ce6, Chitosan+Ce6 nanoparticles, Catalase+Ce6 mixture, and C&C-Ce6 nanoparticles at the concentration of 15 μg mL-1 Ce6 for 6 h. The caspase-3 protein was collected by lysis and centrifugation of cells after laser irradiation at 650 nm with the dose of 12 J cm-2. As shown in Figure 9c-d, caspase-3 protein expression was up-regulated slightly by free Ce6, Chitosan+Ce6 nanoparticles, and Ce6+Catalase mixture compared with untreated control, but the protein expression of caspase-3 was enhanced markedly by C&C-Ce6 nanoparticles. The results of apoptosis-inducing effect clearly indicated that C&C-Ce6 nanoparticles were most effective in promoting the activation of caspase-3 for tumor apoptosis, an observation in agreement with the in vitro PDT results.
Prior to investigating the in vivo PDT effect of C&C-Ce6 nanoparticles, the blood retention time in CAL-27 tumor-bearing nude mice was determined following intravenous injection of free Ce6 and C&C-Ce6 nanoparticles. Subsequently, the real-time imaging was monitored over the course of 12 h (Figure S8). For free Ce6, the signal in the whole body increased dramatically and reached the maximum after 2 h followed by decline over a prolonged time. After 12 h, the fluorescent intensity in the whole body was quite weak, suggesting that the free Ce6 was easy to be cleared quickly from the bloodstream. For C&C-Ce6 nanoparticles, fluorescent signal in the tumor region also increased up to 2 h. More importantly, the signal could be detected even at 12 h after the injection. This higher accumulation of C&C-Ce6 nanoparticles in the tumor could be attributed to the nanoscale size of the nanoparticles, leading to enhanced accumulation in the tumor tissues via EPR effect.
The improved 1O2 generation and efficient accumulation of C&C-Ce6 nanoparticles for in vivo PDT efficacy was also evaluated. The tumor regions of CAL-27 tumor-bearing mice were irradiated with 650 nm laser for 10 min (12 J cm-2) following intratumor injections with PBS, free Ce6, Catalase+Ce6 mixture, Chitosan+Ce6 nanoparticles, or C&C-Ce6 nanoparticles via the skin. Body weight and tumor volume were monitored every 2 days for 20 days. As shown in Figure S9, a slight change in body weight was observed for all pretreated groups, suggesting that PDT is one of the safest therapies against cancer. However, the tumor volumes in mice after 14 days treatment were 1.87 ± 0.14 cm3, 1.04 ± 0.09 cm3, 0.99 ± 0.15 cm3, 0.96 ±0.12 cm3, and 0.52 ±0.11 cm3 for PBS, Catalase+Ce6 mixture, Chitosan+Ce6 nanoparticles, free Ce6, and C&C-Ce6 nanoparticles, respectively (Figure 10a). Correspondingly, compared with the PBS group, the TIR of Catalase+Ce6 mixture, Chitosan+Ce6 nanoparticles, free Ce6, and C&C-Ce6 nanoparticles could be calculated to be 44.39%, 47.06%, 48.66 and 72.19%, respectively. Thus, a strong destruction of tumor tissue was obtained by PDT with C&C-Ce6 nanoparticles (Figure 10b). These results indicated that C&C-Ce6 nanoparticles achieved predominant tumor growth inhibitory efficacy compared with other formulations. More importantly, tumor necrosis occurred after treatment with C&C-Ce6 nanoparticles after 14 days. These results further demonstrated that the PDT efficacy of C&C-Ce6 nanoparticles was the highest among all therapeutic groups, due to enhanced generation of 1O2 under laser irradiation of nanoparticles and high accumulation into tumor tissues via EPR effect. These observations were consistent with the in vitro results.
Figure 9
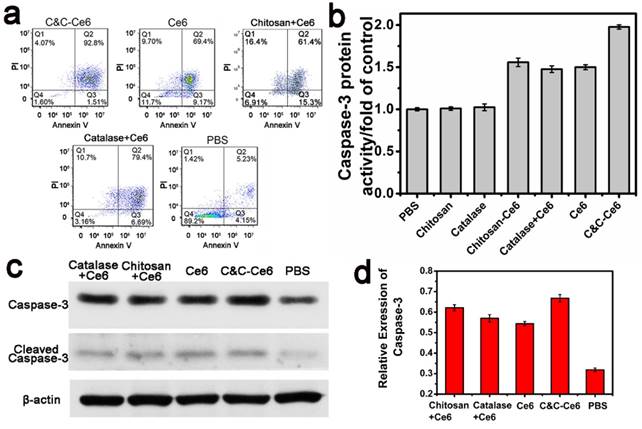
(a) Representative results of flow cytometric analysis of cell apoptosis of CAL-27 cells treated with C&C-Ce6 nanoparticles, free Ce6, Catalase+Ce6, Chitosan+Ce6 nanoparticles, and PBS, followed by staining with Annexin V-FITC/PI. (Q4: living cells; Q3: early apoptotic cells; Q2: late apoptotic cells; Q1: necrotic cells. Numbers in the profiles indicate the percentage of the cells present in the area); (b) Caspase-3 protein activity, (c) Western blot photograph of caspase-3 and cleaved caspase-3; (d) Western blot analysis of caspase-3 in CAL-27 cells pretreated with C&C-Ce6 nanoparticles, free Ce6, Catalase+Ce6, Chitosan+Ce6 and PBS.
The immunohistochemical analysis was performed to evaluate the PDT efficacy in CAL-27 tumor-bearing mice after treatment with various formulations. Histological examination of hematoxylin and eosin (H&E)-stained tumor tissue and normal organs after treatment with PBS and various formulations are shown in Figure 11. In the tumors treated with PBS, large and spindle shape nuclei were visible showing rapid growth of tumor cells. In contrast, decreased tumor cellularity with nuclear shrinkage and fragmentation were observed in tumor tissues pretreated with free Ce6 and Catalase+Ce6 mixture. In the C&C-Ce6 pretreated tumors, a large necrotic area with shrinkage and fragmentation of nuclei and neutrophil infiltration was observed suggesting effective inhibition of tumors by PDT. In normal tissue slices, large and spindle shape nuclei were observed after pretreatment with all of the formulations, indicating that the Ce6 and C&C-Ce6 nanoparticles had no obvious toxicity to major organs. The immunohistochemical analysis of caspase-3 and cleaved-caspase-3 proteins after treatment with various formulations was further performed (Figure 12a). The results clearly indicated that C&C-Ce6-induced positive expression of caspase-3 and cleaved caspase-3 proteins was much higher than those with other formulations. These results revealed that the C&C-Ce6 nanoparticles exhibited the highest PDT efficacy of all of the therapeutic groups which was also confirmed by immunofluorescence staining of tumor slides with Tunnel (Figure 12b).
Figure 10
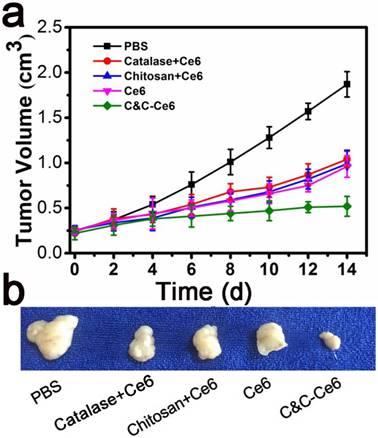
(a) Tumor volumes in tumor-bearing mice pretreated with PBS, Chitosan+Ce6 nanoparticles, Catalase+Ce6 mixture, free Ce6, and C&C-Ce6 nanoparticles for 14 days after PDT; (b) Representative tumor photographs acquired 14 days after various treatments are shown for quantitative analysis of tumor growth.
Figure 11
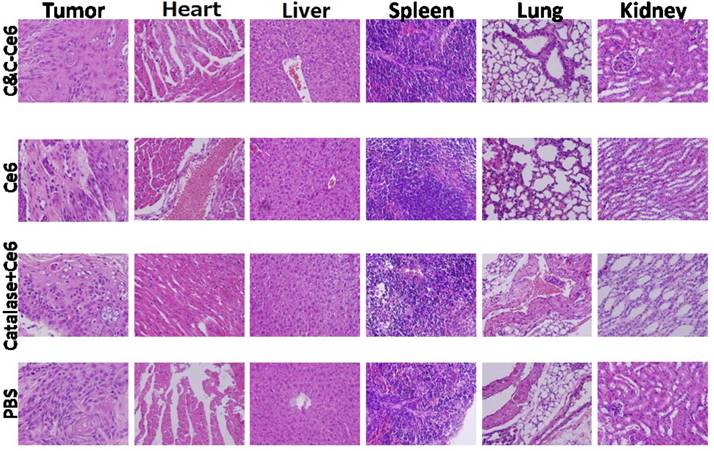
Histopathologic analyses of tumor tissues and normal organs after treatment with PBS, free Ce6, Catalase+Ce6 mixture, and C&C-Ce6 nanoparticles for 14 days after PDT.
Figure 12
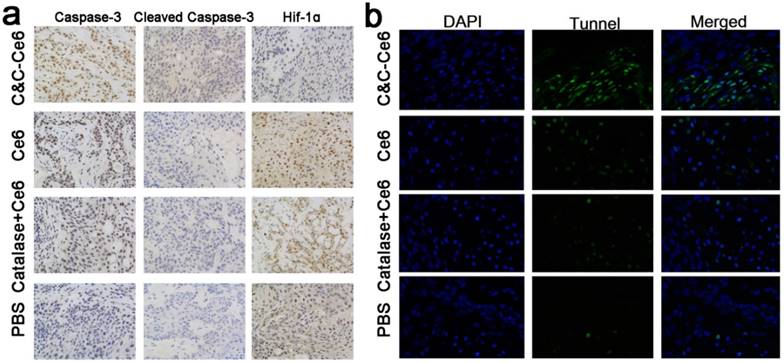
(a) Immunohistochemical analysis of caspase-3, cleaved caspase-3, and HIF-1α after pretreatment with PBS, free Ce6, Ce6+Catalase mixture, and C&C-Ce6 nanoparticles (×400); (b) immunofluorescence staining with Tunnel of tumor slides from CAL-27 tumor-bearing mice pretreated with C&C-Ce6, free Ce6, catalase/Ce6 mixture, and PBS and irradiated with 650 nm laser. Tunnel-positive cells (green); DAPI (blue).
We also performed immunohistochemical analysis of HIF-1α [30, 34], a hypoxia-inducible factor, to analyze the hypoxia microenvironment in tumor tissues after treatment with various formulations (Figure 12a). As expected, the tumor cells pretreated with PBS showed positive expression of HIF-1α. When irradiated at 650 nm following treatment with the free Ce6 or Catalase+Ce6 mixture, a higher positive expression of HIF-1α than that of control was observed. This was caused by the consumption of O2 during the PDT process leading to severe hypoxia in localized tumor tissues. As a negative-charged protein, Catalase had low accumulation in tumor cells; thus, the protein expression of HIF-1α could not be inhibited effectively. The protein expression of HIF-1α in tumor cells pretreated with C&C-Ce6 was lowest among all therapeutic groups because of the generation of O2 from H2O2 by Catalase to improve the hypoxia microenvironment in tumor cells via enhanced accumulation and quick release of nanoparticles in the tumor tissues. Hence, C&C-Ce6 nanoparticles with the ability to generate O2 exhibited a superior in vitro and in vivo antitumor efficacy by PDT method.
Conclusion
We report the synthesis of a novel pH-responsive polymeric system, exploiting the electrostatic interaction between the O2-evolving protein Catalase and Chitosan, as the aerobic carrier for effective photodynamic therapy against tumor cells. The hydrophobic photosensitizer Ce6 was encapsulated into the nanoparticles (C&C-Ce6). The structures and properties of these nanoparticles were characterized by FTIR and UV-Vis spectra. DLS and TEM results indicated that these nanoparticles with positively charged surface exhibited high stability in aqueous solution and uniform spherical micelles with average diameter of 68.5 nm. Because of the weak electrostatic interaction, the release of Catalase and Ce6 was accelerated from the disassembly of nanoparticles in the acidic environment resulting in the recovery of the enzymatic activity of Catalase to generate O2 from H2O2. This unique property of O2 self-sufficiency conferred on the C&C-Ce6 nanoparticles higher anticancer activity upon irradiation than that of free Ce6 both in vitro and in vivo. In summary, the construction of the aerobic polymeric system through electrostatic interaction provides a new avenue to design smart PDT systems for the treatment of hypoxia in tumors.
Acknowledgements
The authors thank the National Basic Research Program (2015CB931801), the National Natural Science Foundation of China (51690151, 51473093), and Interdisciplinary Program of Shanghai Jiao Tong university (YG2015QN01).
Supplementary Material
Supplementary figures.
Abbreviations
PDT: photodynamic therapy; EPR: enhanced permeability and retention; 1O2: singlet oxygen; PS: photosensitizer; Ce6: Chlorin e6; MTT: methylthiazolyldiphenyl-tetrazolium bromide; DPA: 9,10-diphenylanthracene; H2DCFDA: 2',7'-dichlorodihydrofluorescein diacetate; PBS: phosphate-buffered saline; TEM: transmission electron microscopy; DLS: dynamic light scattering; FTIR: Fourier transform infrared spectra; UV-Vis: ultraviolet-visible absorption; CD: circular dichroism spectra; C&C-Ce6: catalase&chitosan-Ce6; CLSM: confocal laser scanning microscopy; FITC: fluorescein isothiocyanate; OD: optical density; RIPA: radio-immunoprecipitation assay; SPF: specific pathogen-free; SPSS: statistical package for the social sciences; ANOVA: analysis of variance; GMFI: geometrical mean fluorescence intensities; TIR: tumor inhibitory rate; ROS: reactive oxygen species.
Competing Interests
The authors have declared that no competing interest exists.
References
1. McDonnell SO, Hall MJ, Allen LT, Byrne A, Gallagher WM, O'Shea DF. Supramolecular photonic therapeutic agents. J Am Chem Soc. 2005;127:16360-1
2. Sprague LD, Tomaso H, Mengele K, Schilling D, Bayer C, Stadler P. et al. Effects of hypoxia and reoxygenation on the expression levels of the urokinase-type plasminogen activator, its inhibitor plasminogen activator inhibitor type-1 and the urokinase-type plasminogen activator receptor in human head and neck tumour cells. Oncol Rep. 2007;17:1259-68
3. Zhang X. Gold nanoparticles: Recent advances in the biomedical applications. Cell Biochem Biophys. 2015;72:771-5
4. Kim H, Chung K, Lee S, Kim DH, Lee H. Near-infrared light-responsive nanomaterials for cancer theranostics. WIRES Nanomed Nanobi. 2016;8:23-45
5. Svenskaya Y, Parakhonskiy B, Haase A, Atkin V, Lukyanets E, Gorin D. et al. Anticancer drug delivery system based on calcium carbonate particles loaded with a photosensitizer. Biophys Chem. 2013;182:11-5
6. Mallidi S, Anbil S, Bulin AL, Obaid G, Ichikawa M, Hasan T. Beyond the barriers of light penetration: Strategies, perspectives and possibilities for photodynamic therapy. Theranostics. 2016;6:2458-87
7. Dougherty TJ, Gomer CJ, Henderson BW, Jori G, Kessel D, Korbelik M. et al. Photodynamic therapy. J Natl Cancer I. 1998;90:889-905
8. Dougherty TJ, Grindey GB, Fiel R, Weishaupt KR, Boyle DG. Photoradiation therapy. II. Cure of animal tumors with hematoporphyrin and light. J Natl Cancer I. 1975;55:115-21
9. Schmitt F, Juillerat-Jeanneret L. Drug targeting strategies for photodynamic therapy. Anti-cancer Agent ME. 2012;12:500-25
10. Master A, Livingston M, Sen Gupta A. Photodynamic nanomedicine in the treatment of solid tumors: perspectives and challenges. J Control Release. 2013;168:88-102
11. Chatterjee DK, Fong LS, Zhang Y. Nanoparticles in photodynamic therapy: an emerging paradigm. Adv Drug Deliver Rev. 2008;60:1627-37
12. Shiao YS, Chiu HH, Wu PH, Huang YF. Aptamer-functionalized gold nanoparticles as photoresponsive nanoplatform for co-drug delivery. ACS Appl Mater Inter. 2014;6:21832-41
13. Li P, Zhou G, Zhu X, Li G, Yan P, Shen L. et al. Photodynamic therapy with hyperbranched poly(ether-ester) chlorin(e6) nanoparticles on human tongue carcinoma CAL-27 cells. Photodiagn Photodyn. 2012;9:76-82
14. Huang Y, Qiu F, Shen L, Chen D, Su Y, Yang C. et al. Combining two-photon-activated fluorescence resonance energy transfer and near-infrared photothermal effect of unimolecular micelles for enhanced photodynamic therapy. ACS Nano. 2016;10:10489-99
15. Gupta A, Wang S, Marko A, Joshi P, Ethirajan M, Chen Y. et al. Polyacrylamide-based biocompatible nanoplatform enhances the tumor uptake, PET/fluorescence imaging and anticancer activity of a chlorophyll analog. Theranostics. 2014;4:614-28
16. Ma Y, Mou Q, Wang D, Zhu X, Yan D. Dendritic polymers for theranostics. Theranostics. 2016;6:930-47
17. Solban N, Selbo PK, Sinha AK, Chang SK, Hasan T. Mechanistic investigation and implications of photodynamic therapy induction of vascular endothelial growth factor in prostate cancer. Cancer Res. 2006;66:5633-40
18. Menon JU, Jadeja P, Tambe P, Vu K, Yuan B, Nguyen KT. Nanomaterials for photo-based diagnostic and therapeutic applications. Theranostics. 2013;3:152-66
19. Hervouet E, Cizkova A, Demont J, Vojtiskova A, Pecina P, Franssen-van Hal NL. et al. HIF and reactive oxygen species regulate oxidative phosphorylation in cancer. Carcinogenesis. 2008;29:1528-37
20. Chen H, Tian J, He W, Guo Z. H2O2-activatable and O2-evolving nanoparticles for highly efficient and selective photodynamic therapy against hypoxic tumor cells. J Am Chem Soc. 2015;137:1539-47
21. Wang LY, Shi XY, Yang CS, Huang DM. Versatile RBC-derived vesicles as nanoparticle vector of photosensitizers for photodynamic therapy. Nanoscale. 2013;5:416-21
22. Weiss A, Bonvin D, Berndsen RH, Scherrer E, Wong TJ, Dyson PJ. et al. Angiostatic treatment prior to chemo- or photodynamic therapy improves anti-tumor efficacy. Sci Rep. 2015;5:8990
23. Wang S, Yuan F, Chen K, Chen G, Tu K, Wang H. et al. Synthesis of hemoglobin conjugated polymeric micelle: a ZnPc carrier with oxygen self-compensating ability for photodynamic therapy. Biomacromolecules. 2015;16:2693-2700
24. Al-Waili NS, Butler GJ. Phototherapy and malignancy: possible enhancement by iron administration and hyperbaric oxygen. Med Hypotheses. 2006;67:1148-58
25. Finkel T, Serrano M, Blasco MA. The common biology of cancer and ageing. Nature. 2007;448:767-74
26. Ma Y, Mou Q, Sun M, Yu C, Li J, Huang X. et al. Cancer theranostic nanoparticles self-assembled from amphiphilic small molecules with equilibrium shift-induced renal clearance. Theranostics. 2016;6:1703-16
27. Engin K, Leeper DB, Cater JR, Thistlethwaite AJ, Tupchong L, McFarlane JD. Extracellular pH distribution in human tumours. Int J Hhyperther. 1995;11:211-6
28. Lee ES, Oh KT, Kim D, Youn YS, Bae YH. Tumor pH-responsive flower-like micelles of poly(L-lactic acid)-b-poly(ethylene glycol)-b-poly(L-histidine). J Control Release. 2007;123:19-26
29. Dan Z, Cao H, He X, Zhang Z, Zou L, Zeng L. et al. A pH-responsive host-guest nanosystem loading succinobucol suppresses lung metastasis of breast cancer. Theranostics. 2016;6:435-45
30. Koukourakis MI, Giatromanolaki A, Skarlatos J, Corti L, Blandamura S, Piazza M. et al. Hypoxia inducible factor (HIF-1a and HIF-2a) expression in early esophageal cancer and response to photodynamic therapy and radiotherapy. Cancer Res. 2001;61:1830-2
31. Fabris C, Valduga G, Miotto G, Borsetto L, Jori G, Garbisa S. et al. Photosensitization with zinc(II) phthalocyanine as a switch in the decision between apoptosis and necrosis. Cancer Res. 2001;61:7495-500
32. Furre IE, Moller MT, Shahzidi S, Nesland JM, Peng Q. Involvement of both caspase-dependent and -independent pathways in apoptotic induction by hexaminolevulinate-mediated photodynamic therapy in human lymphoma cells. Apoptosis. 2006;11:2031-42
33. Bhuvaneswari R, Gan YY, Lucky SS, Chin WW, Ali SM, Soo KC. et al. Molecular profiling of angiogenesis in hypericin mediated photodynamic therapy. Mol Cancer. 2008;7:56
34. Bhuvaneswari R, Gan YY, Soo KC, Olivo M. The effect of photodynamic therapy on tumor angiogenesis. Cell Mol Life Sci. 2009;66:2275-83
Author contact
![]() Corresponding authors: Xinyuan Zhu, Ph.D., School of Chemistry and Chemical Engineering, Shanghai Key Lab of Electrical Insulation and Thermal Aging, Shanghai Jiao Tong University, 800 Dongchuan Road, Shanghai, 200240, P. R. China. Guoyu Zhou, Ph.D., and Zhiyuan Zhang, Ph.D., Department of Oral &Maxillofacial-Head Neck Oncology, Shanghai Jiao Tong University School of Medicine, Ninth People's Hospital, Shanghai Jiao Tong University, Shanghai 200011, P. R. China. E-mail: xyzhuedu.cn, guoyuzhoucom, zhzhy0502com
Corresponding authors: Xinyuan Zhu, Ph.D., School of Chemistry and Chemical Engineering, Shanghai Key Lab of Electrical Insulation and Thermal Aging, Shanghai Jiao Tong University, 800 Dongchuan Road, Shanghai, 200240, P. R. China. Guoyu Zhou, Ph.D., and Zhiyuan Zhang, Ph.D., Department of Oral &Maxillofacial-Head Neck Oncology, Shanghai Jiao Tong University School of Medicine, Ninth People's Hospital, Shanghai Jiao Tong University, Shanghai 200011, P. R. China. E-mail: xyzhuedu.cn, guoyuzhoucom, zhzhy0502com
Citation styles
APA
Shen, L., Huang, Y., Chen, D., Qiu, F., Ma, C., Jin, X., Zhu, X., Zhou, G., Zhang, Z. (2017). pH-Responsive Aerobic Nanoparticles for Effective Photodynamic Therapy. Theranostics, 7(18), 4537-4550. https://doi.org/10.7150/thno.19546.
ACS
Shen, L.; Huang, Y.; Chen, D.; Qiu, F.; Ma, C.; Jin, X.; Zhu, X.; Zhou, G.; Zhang, Z. pH-Responsive Aerobic Nanoparticles for Effective Photodynamic Therapy. Theranostics 2017, 7 (18), 4537-4550. DOI: 10.7150/thno.19546.
NLM
Shen L, Huang Y, Chen D, Qiu F, Ma C, Jin X, Zhu X, Zhou G, Zhang Z. pH-Responsive Aerobic Nanoparticles for Effective Photodynamic Therapy. Theranostics 2017; 7(18):4537-4550. doi:10.7150/thno.19546. https://www.thno.org/v07p4537.htm
CSE
Shen L, Huang Y, Chen D, Qiu F, Ma C, Jin X, Zhu X, Zhou G, Zhang Z. 2017. pH-Responsive Aerobic Nanoparticles for Effective Photodynamic Therapy. Theranostics. 7(18):4537-4550.
This is an open access article distributed under the terms of the Creative Commons Attribution (CC BY-NC) license (https://creativecommons.org/licenses/by-nc/4.0/). See http://ivyspring.com/terms for full terms and conditions.