Theranostics
13.3
Impact Factor
- Current Issue
- Advance Articles
- Volume 16; 2026
- Volume 15; 2025
- Volume 14; 2024
- Volume 13; 2023
- Volume 12; 2022
- Archive
- Cover Images
- Cover Suggestion
- Special Issues
Top
Introduction
Methods
Results
Discussion
Abbreviations
Supplementary Material
Acknowledgements
References
Introduction
Methods
Results
Discussion
Abbreviations
Supplementary Material
Acknowledgements
References
International Journal of Biological Sciences
International Journal of Medical Sciences
 Global reach, higher impact

Theranostics 2018; 8(3):723-734. doi:10.7150/thno.20386 This issue Cite
Research Paper
WST11 Vascular Targeted Photodynamic Therapy Effect Monitoring by Multispectral Optoacoustic Tomography (MSOT) in Mice
Volker Neuschmelting1,2, Kwanghee Kim3, Jaber Malekzadeh-Najafabadi4, Sylvia Jebiwott3, Jaya Prakash4, Avigdor Scherz5, Jonathan A. Coleman3, Moritz F. Kircher1,6,7,8 ![]() , Vasilis Ntziachristos4,9
, Vasilis Ntziachristos4,9 ![]()
1. Department of Radiology, Memorial Sloan Kettering Cancer Center, New York, USA;
2. Department of Neurosurgery, University Hospital Cologne, Cologne, Germany;
3. Department of Surgery, Memorial Sloan Kettering Cancer Center, New York, USA;
4. Institute for Biological and Medical Imaging, Helmholtz Zentrum, Munich, Germany;
5. Department of Plant and Environmental Sciences, Weizmann Institute of Science, Rehovot, Israel;
6. Center for Molecular Imaging and Nanotechnology (CMINT), Memorial Sloan Kettering Cancer Center, New York, USA;
7. Department of Radiology, Weill Cornell Medical College;
8. Molecular Pharmacology Program, Memorial Sloan Kettering Cancer Center, New York, USA;
9. Chair for Biological Imaging, Technische Universität München, Munich, Germany.
Received 2017-4-2; Accepted 2017-8-11; Published 2018-1-1
Citation:
Neuschmelting V, Kim K, Malekzadeh-Najafabadi J, Jebiwott S, Prakash J, Scherz A, Coleman JA, Kircher MF, Ntziachristos V. WST11 Vascular Targeted Photodynamic Therapy Effect Monitoring by Multispectral Optoacoustic Tomography (MSOT) in Mice. Theranostics 2018; 8(3):723-734. doi:10.7150/thno.20386. https://www.thno.org/v08p0723.htm
Other stylesAbstract

Objective: Monitoring emerging vascular-targeted photodynamic therapy (VTP) and understanding the time-dynamics of treatment effects remains challenging. We interrogated whether handheld multispectral optoacoustic tomography (MSOT) could noninvasively monitor the effect of VTP using WST11, a vascular-acting photosensitizer, on tumor tissues over time using a renal cell cancer mouse model. We also investigated whether MSOT illumination can induce VTP, to implement a single-modality theranostic approach.
Materials and Methods: Eight BalB/c mice were subcutaneously implanted with murine renal adenocarcinoma cells (RENCA) on the flank. Three weeks later VTP was performed (10 min continuous illumination at 753 nm following intravenous infusion using WST11 or saline as control. Handheld MSOT images were collected prior to VTP administration and subsequently thereafter over the course of the first hour, at 24 and 48 h. Data collected were unmixed for blood oxygen saturation in tissue (SO2) based on the spectral signatures of deoxy- and oxygenated hemoglobin. Changes in oxygen saturation over time, relative to baseline, were examined by paired t-test for statistical significance (p < 0.05). In-vivo findings were corroborated by histological analyses of the tumor tissue.
Results: MSOT is shown to prominently resolve changes in oxygen saturation in tumors within the first 20 min post WST11-VTP treatment. Within the first hour post-treatment, SO2 decreased by more than 60% over baseline (p < 0.05), whereas it remained unchanged (p > 0.1) in the sham-treated group. Moreover, unlike in the control group, SO2 in treated tumors further decreased over the course of 24 to 48 h post-treatment, concomitant with the propagation of profound central tumor necrosis present in histological analysis. We further show that pulsed MSOT illumination can activate WST11 as efficiently as the continuous wave irradiation employed for treatment.
Conclusion: Handheld MSOT non-invasively monitored WST11-VTP effects based on the SO2 signal and detected blood saturation changes within the first 20 min post-treatment. MSOT may potentially serve as a means for both VTP induction and real-time VTP monitoring in a theranostic approach.
Keywords: optoacoustic imaging, photoacoustic imaging, MSOT, photodynamic therapy, renal cell carcinoma, vascular targeted photodynamic therapy.
Introduction
Photodynamic therapy (PDT) is considered a therapeutic approach in different neoplastic and non-neoplastic indications e.g., skin, oral and ocular lesions [1-3]. Illumination of systemic or topically administered PDT agents in the presence of oxygen leads to a reaction cascade that generates cytotoxic reactive species and, thus, induces cell death and tissue destruction. Tumor cell targeting with PDT agents that attain long blood circulation times and extravasate to surrounding tissues (e.g., skin) comes with a high degree of toxic side-effects. For this reason, photosensitizing drugs with short biological half-lives are preferred. A new class of PDT agents with fast clearance characteristics (hour-scale) operates by inducing tissue phototoxic effects while the photosensitizer is retained in the tumor vasculature until clearance, leading to tumor vessel destruction and death of the surrounding tumor cells, enabling the field of vascular targeted PDT (VTP) [4].
WST11 (TOOKAD® Soluble) is a water-soluble derivative of palladium-bacteriopheophorbide [5, 6] that circulates as a non-covalent complex with serum albumin [7] until hepatic clearance, with a half-life of 5-10 and 30-60 min in rodents and humans, respectively. Illumination of WST11 at 753 nm, the optical absorption maximum in the near infrared (NIR), leads to the intravascular generation of super oxide and hydroxyl radicals [7]. As a result, it induces a profound ischemic injury and subsequent apoptosis following complete vascular arrest of tumor-feeding arteries and draining veins [8-11]. Promising results in phase II and III clinical trials in prostate cancer have recently been reported [12-15].
The effectiveness of VTP treatment relies on the oxygen supply within the target vasculature during irradiation, the availability and potency of the applied photosensitizer as well as the light distribution. Monitoring the oxygen supply status of tumor tissue before, during and post PDT has been shown to correlate well with outcome in cell-targeted PDT, which relies on the continuous generation of singlet oxygen [16-18]. Various imaging modalities have been evaluated to monitor oxygenation non-invasively and invasively: Oxygen partial pressure (pO2) histography samples tissue volume adjacent to a microelectrode inserted in the tumor, but is invasive and only offers single point measurements [19, 20]. Moreover, tissue damage due to electrode insertion may alter the local tissue physiology. Reflectance optical spectroscopy or diffuse optical tomography methods have also been considered, but typically lack quantification accuracy due to photon scattering, leading to complications in accurately resolving oxy- and deoxygenated hemoglobin. Other technologies such as optical doppler tomography (ODT) typically resolve only superficial tissue activity. Blood-oxygen-level dependent magnetic resonance imaging (BOLD-MRI), was found to be useful to monitor tumor vascular occlusion by both WST09 and WST11 at high temporal resolution but not at vascular resolution [21, 22]. Moreover, disseminated use is impractical except in the case of brain tumors due to cost and required infrastructure [4, 23, 24]. Thus, noninvasive oxygenation monitoring remains challenging in the setting of most PDT indications, limiting the potential for in vivo real-time monitoring and improvement of VTP treatments.
Multispectral optoacoustic tomography (MSOT) is an emerging optical imaging method that may fill in the diagnostic gap in blood and tissue oxygenation imaging. Implemented in real-time mode, MSOT provides non-invasive, high resolution tomographic imaging of absorbers like oxygenated and deoxygenated hemoglobin, lipids and melanin in the NIR within 2-3 cm of tissue depth [25-27]. Compared to simpler optoacoustic imaging approaches implemented using two or three wavelengths for monitoring SO2-related PDT effects [23, 28], MSOT utilizes a significantly larger number of wavelengths, based on fast tunable lasers [25, 29], which leads to improved accuracy and spectral detection sensitivity [30]. This ability is particularly relevant for characterizing vascular targeted PDT agents, which have a direct effect on oxygen-feeding tumor-related blood vessels. Therefore, we investigated whether MSOT, implemented in handheld mode for clinical relevance, could be employed for monitoring the treatment effect of VTP and characterizing the so-far unknown dynamics of tumor deoxygenation effects over time, using WST11-VTP in a renal cell cancer mouse model. Moreover, we interrogated whether in addition to imaging, MSOT illumination could be employed to activate the drug, thus implementing a theranostic approach.
Methods
Phantom experiments
To test the efficiency of pulsed laser for activating the photosensitizer WST11 (see Supplemental figure S1 for absorbance spectrum) in comparison to commonly used continuous wave (CW) illumination, lyophilized 2.5 µM WST11 (Steba Biotech, Luxembourg) in D-phosphate buffered saline solution (PBSx10, pH 7.4) was continuously irradiated at equal light doses up to 24 J/cm2 by either CW (100 mW, BWF1-750-300E, B&W Tek Inc., Newark, DE, USA) or pulsed laser (100 mW, 10 ns pulse duration, 10 Hz repetition rate, Phocus TM, Opotek Inc, Carlsbad, CA, USA) at single wavelength (750 nm) over the course of 4 min. The efficiency in activating WST11 by multispectral pulsed laser illumination instead, as used for MSOT, was analogously tested at three different laser powers adjusted by a Pockels cell delay (wavelength-tuned from 700 to 800 nm in steps of 10 nm, mean ~117, ~146 or ~199 mW/cm2 across wavelengths, Supplemental figure S2). The energy output of the lasers was measured using a power meter (Fieldmax II-TOP, Coherent, CA, USA). The addition of 0.2 µM aminophenyl fluorescence (APF, Sigma Aldrich, Saint Louis, MO, USA) served as indicator for the photochemical reaction and production of hydroxyl radicals, which are the highly reactive oxygen species (hROS) that mainly mediate the VTP effect by WST11 [31]. The fluorescence of APF (excitation at 470 nm, emission read out at 525 nm) relative to baseline as well as the absorbance of WST11 at 750 nm, indicative of hROS production and photodegradation, respectively, were measured using a multimode microplate reader (Infinite 200m, Tecan Group Ltd., Männedorf, Switzerland).
All phantom experiments were carried out in triplicates in the dark in a black 96-well plate in solutions of 200 µL volume per well. Buffers were equilibrated to room air with dissolved oxygen levels of 250±5 µM (oxygen microsenser, Unisense A/S, Aarhus, Denmark). Neighboring wells were covered by black tape to inhibit unwanted light exposure.
In vivo
Animal model
All animal procedures reported in this study were approved by the local Institutional Animal Care and use Committee (IACUC). Murine renal adenocarcinoma RENCA cells (ATCC, Mannassas, VA, USA) were cultured in RPMI 1640 supplemented with 10% Fetal Bovine Serum (FBS), 0.01 mM non-essential amino acids (NEAA), 1 mM sodium pyruvate, 2 mM l-glutamine and 10% penicillin/streptomycin. 100 μL of the cells suspended in PBS (5x10⁶ cells/mL) were subcutaneously (ectopically) implanted into the left hind flank of 7-8 week old male BalB/c mice (Charles River Laboratory, Kingston, NY, USA). Tumor growth was assessed by weekly caliper measurements and VTP performed 21 days after tumor inoculation when the tumors reached a size of approximately 125-750 mm3. Mice with tumors exceeding 15 mm in maximum caliper diameter were excluded from the study.
WST11-VTP
The mice were anesthetized by an intraperitoneal injection of a ketamine/xylazine cocktail (150 mg/kg ketamine, 10 mg/kg xylazine) prior to VTP and by inhalation of 1.5-2% isoflurane for maintenance thereafter. The mice were placed in the prone position on a heating pad to maintain body temperature at appropriate constant level. Lyophilized WST11 (Steba Biotech, France) was reconstituted with sterile 5% dextrose water under light-protected conditions and filtered through a 0.22 μm disc filter (Sartorius Stedim Biotech, Germany). The flanks of the mice were shaved and remnant hair was removed using depilatory cream. The anesthetized mice were intravenously infused with 9 mg/kg body weight WST11 (2 mg/mL) for 5 min followed by continuous wave irradiation of the tumor at 753 nm at a fluence rate of 150 mW/cm2 for 10 min using a diode laser (Modulight, Finland) with a frontal light distributor (MedLight S.A., Switzerland). The sham control group of mice received saline prior to laser irradiation. Carprofen was administered for post procedural pain control.
MSOT image acquisition
For the acquisition of the MSOT images the mice were anesthetized with 2% isoflurane and kept on a heating pad to prevent reduction in body temperature. The flanks of the mice were shaved and remnant hair was removed using depilatory cream. Handheld MSOT (iThera Medical, Munich, Germany) recently developed for clinical translation was employed in this study. The MSOT handheld system has been previously described and characterized in detail [18]. Briefly, the 2D handheld MSOT probe consists of 256 ultrasonic detector elements that are arranged along an arc on a spherical surface covering a tomographic angle of 135° with a center frequency of 4 MHz, providing a resolution of 200 μm around the center of rotation in the center of the field of view (FOV) (20 mm x 20 mm). The illumination beam generated by a wavelength-tunable optical parametric oscillator with pulse duration of <10 ns (10 Hz frame rate, 700-900 nm in 10 nm intervals, total of 21 wavelengths, 5 frames per wavelength to be averaged, 10.5 s per 2D image data set) was guided through laser fiber bundles and a diffusor (Luminit Co., Torrance, CA, USA) fixed next to the detector array to direct the evenly scattered beam into the center of the FOV. To achieve a large surface illumination covering an area of at least 20 mm x 3 mm a multi-mode fiber bundle with a rectangular head was used, providing a uniform illumination along a line on the surface of the scanned sample. Each photon pulse energy was ~50 mJ, leading to a fluence rate of ~200 mW/cm2 at 10 Hz frame rate, well in accordance with the maximum permissible skin exposure set by the American National Standard for Safe Use of Lasers [32]. The shell of the probe was filled with deionized and degassed water for optimal acoustic coupling and waterproofed by a thin transparent polyethylene membrane. Clear ultrasound gel was used to bridge the acoustic coupling onto the mouse skin.
Postprocessing and image analysis
Linear unmixing was used to extract the chromophore distribution in the tissue [33]. Briefly, the total absorption of each pixel in the optoacoustic distribution is a summation of the absorption of different chromophores:
Hr ≈ μa = εoxyHb * CoxyHb + εdeoxyHb * CdeoxyHb (1)
Here, εchromophore is the molar absorption coefficient, Cchromophore refers to the concentration of each chromophore, and μa is the total reconstructed absorption spectrum of the pixel that is assumed to be approximately equal to the reconstructed initial acoustic pressure rise (Hr). The initial acoustic pressure rise (Hr ≈ μa) was used along with the molar absorption coefficient to estimate the concentration of each chromophore by the linear unmixing method. Note that we assumed the initial pressure rise to be approximately equal to the absorption coefficient in Equation 1 by assuming the changes in the Grueneisen parameter and light fluency to be negligible and constant in the entire region of interest.
By defining the tumor area in the cross-sectional image as the region of interest (ROI), the mean value of the oxy- and deoxyhemoglobin concentration was calculated after unmixing. The blood oxygen saturation SO2 was used to monitor the tumor physiological response to the VTP. Hence, the oxygen saturation was computed using:
SO2 = CoxyHb / (CdeoxyHb + CoxyHb) (2)
Here, CoxyHb and CdeoxyHb are the concentrations of oxy- and deoxyhemoglobin at each pixel computed by solving Equation 1. Finally, the variation of the oxygen saturation SO2 over time was calculated by Equation 2 and analyzed over time. The image resolution was set to a pixel resolution of 100 μm. The ROI covering ±1 mm perivascular space was defined by 10 consecutive pixels perpendicular to each pixel of the line of interest following the course of the most prominent tumor vessel in the reconstructed images. The postprocessing and ROI analyses were determined by an independent observer, blinded to the data acquisition.
Histology
After MSOT acquisition of the last assigned time point (1, 24 or 48 h post WST11-VTP treatment) the mice were sacrificed by carbon dioxide asphyxiation. The subcutaneous tumors were subsequently necropsied, including the skin layer on the surface marked along the imaging plane to ensure comparable orientation, and fixed in 10% neutral buffered formalin. They were cut and paraffin embedded keeping the original orientation and previous imaging plane. The sections were stained with hematoxylin-eosin (H&E), and for immunohistochemistry analysis the tumor samples were stained with anti-mouse CD31 antibody (Dianova, Hamburg, Germany) to assess tumor vessel density and terminal deoxynucleotidyl transferease dUTP nick-end labeling (TUNEL) for cell death.
Statistical analyses
Differences in SO2 values, relative fluorescence and absorbance were calculated separately by independent t tests and expressed as mean ± standard deviation (SD). Statistical significance was considered passing a threshold of p < 0.05 (Bonferroni-corrected for multiple comparisons if appropriate).
Results
Monitoring VTP effects by MSOT
Baseline MSOT measurements of mouse flank tumors prior to WST11-VTP or sham treatment clearly identified the tumors and also visualized individual large vessels through the tumors, as seen in cross-sectional images (Figure 1A; tumor outlined by a blue solid line). SO2 mapping revealed an inhomogeneous distribution of oxygen saturation throughout the tumor tissue attaining the highest values in the perivascular space around the basal prominent tumor vessels (dotted circled ROIs, Figure 1A). The images resolved how areas of high SO2 (red pseudo-coloring) around prominent vessels gradually became hypoxic away from the blood vessel supply, as indicated by green pseudo-coloring (Figure 1A; SO2 maps). Those high SO2 valued areas (red pseudo-colored) at baseline served as ROIs to monitor the following changes in the early phase after treatment initiation:
WST11-VTP was found to cause a gradual inhomogeneous deoxygenation within a few minutes post treatment. Prominent changes were in particular monitored for areas associated with a prominent oxygen supply from vessels at the tumor's base or vessels crossing through the tumor. At 40 min post-treatment, virtually all areas in the tumor center became hypoxic. At 60 min post-treatment, virtually the entire tumor mass, including the tumor base, became hypoxic. SO2 maps at 60 min post WST11-VTP treatment revealed a 60% drop in the oxygen saturation in the tumor ROIs. i.e., 38±19% normalized to baseline (Figure 1A). When interrogating the SO2 values within the first 1 mm-diameter space around the tumor vessels, reductions in oxygen saturation could be observed as early as 20 min post WST11-VTP (Figure 2A).
On the contrary, the control group of mice that received saline prior to laser irradiation did not show any decrease of the oxygen saturation within the perivascular tumor ROIs throughout the first 60 min. Mean SO2 values in the tumor perivascular ROIs showed a moderate increase over baseline to 129±30%, possibly explained by a temperature increase and corresponding vasodilation effects. Their oxygen saturation was, thus, significantly higher than in the WST11-VTP treated mice (p < 0.05) (Figures 1A and 2B).
In the subsequent histological examination, there were no signs of relevant necrosis, apoptosis or otherwise caused cell death present in the tumor samples stained by H&E and TUNEL in either one of the groups 60 min post VTP or sham treatment, respectively (Figures 1B and S3). The anatomical MSOT images before unmixing (at 800 nm shown here) also did not show any remarkable changes in MSOT signal to monitor the possible treatment effect in the early phase either (Figure 1A). However, a prominent vessel seen crossing the tumor pre-treatment, appeared morphologically damaged in its intratumoral course when observing the 40 and 60 min images (arrows left panel). This impairment corroborated the histological sign of endothelial destruction induced by VTP observed as patches of reduced or lost CD31 expression in the group of WST11-VTP treated mice compared to the sham group at 60 min post treatment.
Figure 1
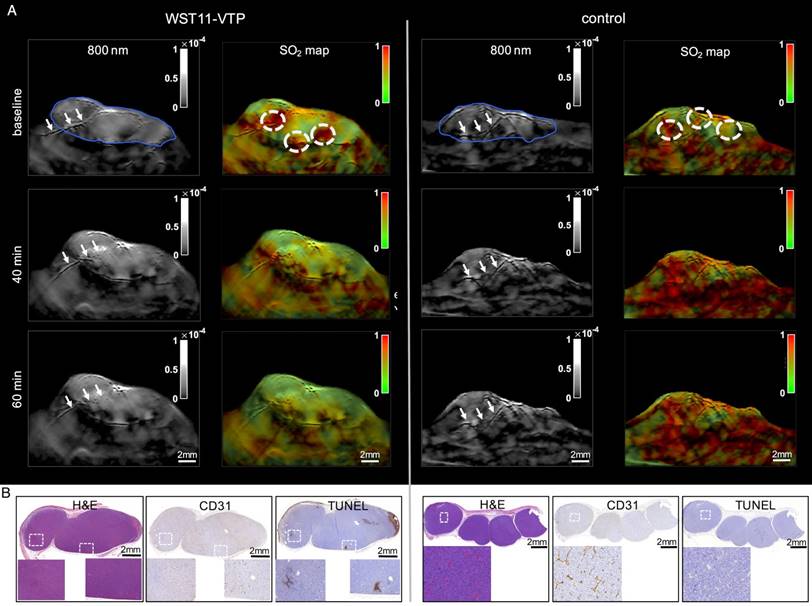
First 60 min VTP effect monitoring by MSOT. A. The tumors could be depicted clearly by MSOT (800 nm single wavelength images shown here; blue outline) and did not markedly change over the course of the first hour after WST11-VTP or sham treatment. However, a prominent vessel that is seen to cross the tumor before treatment onset, appeared morphologically destructed in its intratumoral course over the course of 60 min (arrows left panel) while the crossing tumor vessel in the control mouse appeared morphologically unchanged (arrows right panel). On SO2 mapping, reduced oxygen saturation in the perivascular tumor ROI (dotted circles) was monitored by MSOT relative to baseline, while in comparison no reduction was observed after saline-VTP sham treatment as control. B. On histological examination 1 h after VTP there was no sign of tumor necrosis in either group, but reduction of CD31-positive endothelial cells was observed as the corresponding sign of vessel destruction (see Supplemental Figure S3 for enlarged images).
Figure 2

First 60 min SO2 data analyses. A. In particular, the oxygen saturation values furthest away from the tumor vessels (blue solid lines) in the surrounding perivascular space (± 1 mm, 1 value per pixel, border depicted by blue dotted lines) were shown to decrease already after 20 min when compared to baseline. After 60 min, a profound reduction in oxygen saturation throughout the perivascular space of WST11-VTP treated mice was observed independent of the distance to the vessel, while the perivascular space in the saline control remained unchanged. B. On average in group analysis, the SO2 values were found to be significantly lower in the WST11-VTP treated group than in the controls at 40 min and beyond (p < 0.05).
In the group of WST11-VTP treated mice, the oxygenation saturation in the tumor ROIs was found to further deteriorate in the course of the following 24 to 48 h down to a mean SO2 value of 27±3% at 48 h post treatment normalized to baseline (Figure 3A and 4B). On histological examination, a profound degree of central tumor necrosis was present at least 24 h post treatment (Figure 3B). On cross-sectional analysis of SO2 values lined across the center of the tumor the loss of oxygen saturation corresponded well over time to the central necrotic mass that was evident on histological examination (grey shaded area, Figure 4A). Those reduced SO2 values found in the WST11-VTP treated mice were significantly lower than the oxygen saturation in the tumor ROIs of the control mice (86±22%, n = 3, p < 0.05) at the corresponding time point (Figure 3A and 4B). In the control group of mice, evidence of necrosis on H&E and cell death on TUNEL stained slices was limited merely to a small basal area of the tumor (Figures 3B and S4). On cross-sectional analysis of SO2 values lined across the center of the tumor of the control mice the SO2 values were not found to be reduced over the course of 48 h (Figure 4A).
Inducing VTP treatment effects by MSOT
Efficiency of CW vs. pulsed laser illumination
At light doses above 5 J/cm2 pulsed laser was found to efficiently activate WST11 and induce the production of hROS indicated by APF fluorescence similar to the commonly used CW laser illumination paradigm (each p > 0.05, Figure 5A). Correspondingly, after 4 min of continuous irradiation (equal to light doses of 24 J/cm2) there was no significant difference found in the degree of photodegradation of WST11 by either CW or pulsed laser as indicated by its loss of absorbance at 750 nm (p > 0.05). However, at light doses ≤12 J/cm2 CW illumination induced significantly more photodegradation than pulsed illumination (p < 0.001, Bonferroni corrected). Merely at very small light doses ≤3 J/cm2 corresponding to short (≤30 s) illumination time the applied CW was found to induce significantly more APF fluorescence than the pulsed laser at the same single wavelength (each p < 0.05).
Efficiency of multispectral pulsed laser illumination
Multispectral pulsed laser illuminations powered at ~146 mW/cm2 and above across wavelengths were confirmed to more efficiently induce the activation of WST11 and production of hROS than the lower laser power (~117 mW/cm2), as indicated by APF fluorescence (p < 0.01, Figure 5B): In kinetics analysis, the plateau of maximum APF fluorescence was reached in half the time by the high laser power (~199 mW/cm2) than the medium laser power of ~146 mW/cm2.
Theranostic approach in vivo
A notable reduction in SO2 values of the tumor ROIs was found in the WST11 mouse that received 5 min of MSOT illumination, instead of external CW illumination followed in all other mice (Figure 6A). The SO2 values observed were similar to the ones obtained when the standard VTP protocol using CW-illumination treatment was applied (Figure 6B). The MSOT illumination used identical parameters to the ones employed in the imaging sessions. However, each MSOT imaging session (slice) lasts ~10 s and did not exhibit treatment effects. The histological examination of the tumor sample confirmed the presence of a large uninterrupted central tumor necrosis by H&E and corresponding cell death by TUNEL. The observed effect was comparable to the mice treated with continuous laser irradiation.
Discussion
Monitoring the dynamics and spatial extent of treatment effects has been a long-sought goal for effective PDT administration. The study herein demonstrates the feasibility of MSOT to monitor the effects of emerging VTP treatment by resolving the reduction of oxygen saturation in time and space. We assumed the reduction in oxygenation saturation assessed by MSOT in the tumor ROI as the imaging correlate of tumor hypoxia. The resulting hypoxia related well to the histologically evident tumor cell death over the course of 48 h caused by WST11-VTP induced tumor vessel destruction, in alignement with previous reports [8, 10, 11, 21, 22]. The results are corroborated by previous findings, using both non-invasive BOLD-MRI [21] and invasive intratumoral microelectrodes to determine the pO2 [19, 20], further evincing that reduction in tumor oxygen saturation relative to baseline correlates well with treatment response to PDT [16-18] and VTP outcome.
The study revealed several aspects of WST11-VTP performance in a murine renal adenocarcinoma model that nicely corroborate previous observations in other animal tumor models achieved by alternative approaches. Changes were found to occur within the first 20 min after treatment, although some of the mice or individual areas within tumors appeared to respond in less than 10 min post treatment (results not shown). Interestingly, using BOLD-MRI presented maximal tumor deoxygenation at only 3 min post illumination, similar to the red blood flow arrest observed by intravital fluorescence microscopy of melanoma tumors [21]. Overall, the MSOT technique presented SO2 changes occurring as spatial gradients with peripheral tumor areas deoxygenating later then areas around prominent blood vessels. This observation shown here for the first time is counterintuitive but goes well with the vascular mechanism of action. Namely, radical formation starting from the vessels and propagating into the tumor core being the cause of the observed hypoxia. Nevertheless, within the first hour, virtually the entire tumor appears entirely hypoxic (in agreement with the BOLD-MRI data [22]), an appearance that continued at the 24 h and 48 h time points.
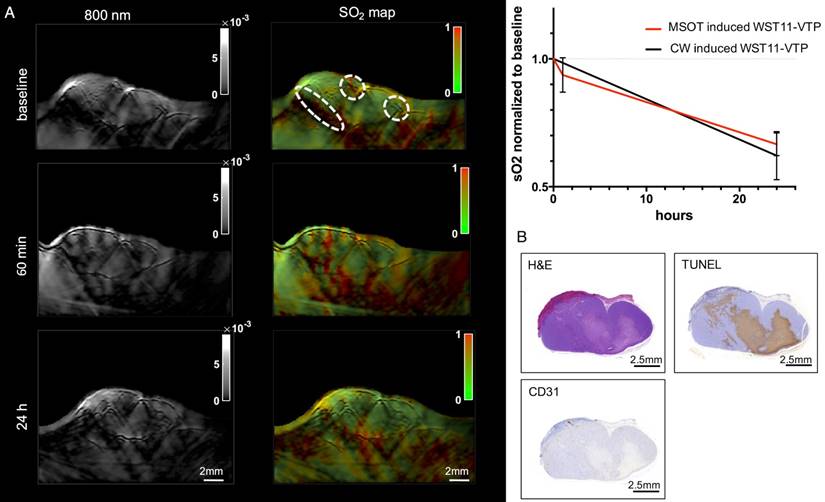
Figure 3
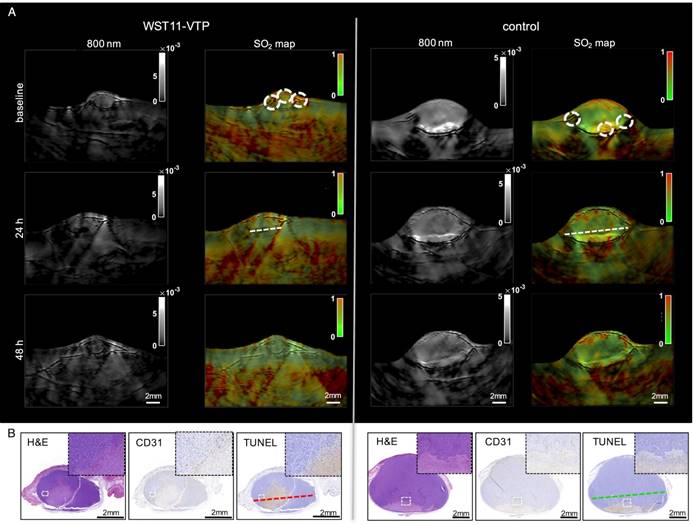
Treatment effect monitoring over 48 h by MSOT. A. MSOT was found to be able to monitor the oxygen saturation within tumor tissue as a critical parameter leading to tumor tissue destruction induced by WST11-VTP over the course of 48 h. In comparison, the control mice of saline-VTP sham treatment showed only very limited signs of reduced oxygen saturation within the tumor ROI. B. Histological examination confirmed the uninterrupted presence of large central tumor necrosis in the WST11-VTP compared to saline-VTP control 48 h post treatment (see Supplemental Figure S4 for enlarged images).
Figure 4
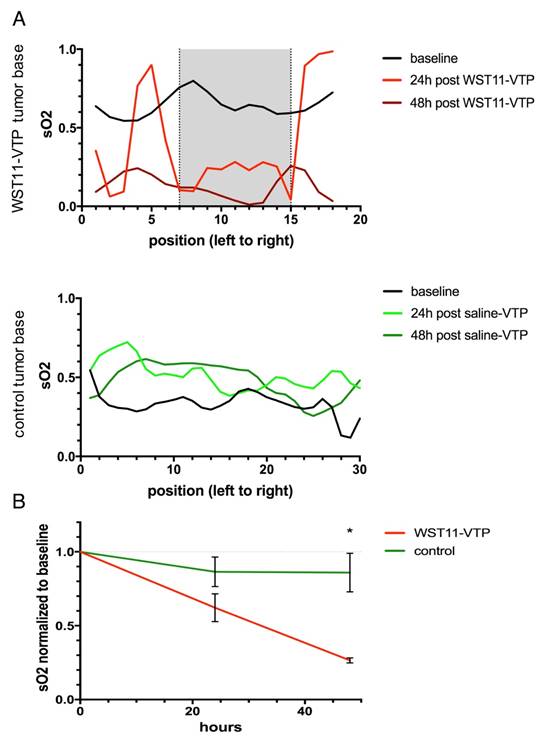
Cross-sectional analysis through the tumor bases. A. The dynamic process of tumor tissue destruction emerging over the course of 48 h following the vascular collapse injury as previously reported [8] was confirmed by a cross-sectional analysis through the tumor bases (see Figure 3, dotted lines) showing a profound reduction in oxygen saturation values across the necrotic tumor area compared to baseline (grey shaded area). B. In group analysis, the tumor oxygen saturation was found to be significantly reduced in the WST11-VTP treated mice compared to the controls at 48 h post treatment (n = 3, p < 0.05).
The MSOT method considered in the study was implemented in handheld mode, instead of a dedicated mouse scanner geometry [34], as it further investigated the potential for clinical translation [26]. We employed 21 wavelengths, a practice that has been shown to increase the spectral unmixing accuracy over systems using a small number of wavelengths [28, 30]. Even though there are only 2 basic unknowns in the spectral un-mixing problem of oxygenated and deoxygenated hemoglobin, small measurement errors and noise bias the results obtained when using only 2 or 3 measurements. However, the solution is significantly stabilized with a larger number of wavelengths. A potential further step would be to increase the spectral window scanned and also unmix the water and fat contributions of tissue, possibly as additional theranostic parameters.
Furthermore, the study revealed another unknown potential role of the optoacoustic method, i.e., its use in a theranostic approach in which the nano-second pulsed laser illumination serves not only as the inductor of diagnostic images and SO2 monitoring but also as the inductor of the VTP by activating the photosensitizer instead of the commonly used CW irradiation at single wavelength. Our study confirmed the ability of the multispectral pulsed laser to activate the photosensitizer at similar efficiency as the continuous wave applied laser when compensated by power. In such mode, MSOT could provide real-time monitoring of treatment effects and possibly lead to steering treatment parameters. In fact, preclinical studies have reported high peak pulsed laser illumination to even be superior to the continuous wave irradiation with regard to the resulting effect of the PDT [35, 36]. We found the CW illumination merely to be superior to the pulsed laser in the activation and degradation of the photosensitizer at very small light doses, surrogating the cumulative effect of the high peak power pulses on activation with increasing light dose. In vivo, we found the pulsed laser source of MSOT (~200 mW/cm2 at 10 Hz frame rate for 5 min resulting in 60 J/cm2 light dose in total) to induce a comparable treatment effect in half the time as continuous wave irradiation at single wavelength (150 mW/cm2 for 10 min resulting in 90 J/cm2 light dose in total). Thus, as part of our preliminary results, the MSOT source multispectral pulsed laser illumination was found to be at least as efficient as CW in activating the photosensitizer and inducing VTP. With intrinsic abilities to also monitor temperature effects, the optoacoustic method could be important for further advancement of VTP.
Figure 5
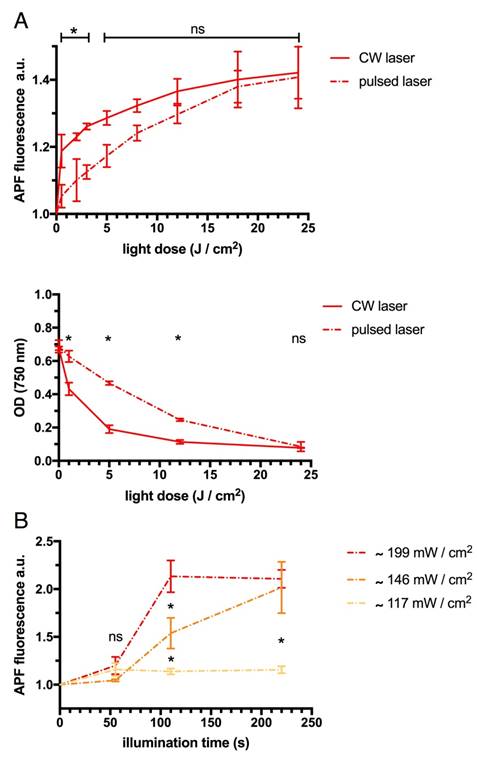
Efficiency of CW, pulsed at single wavelength and multispectral pulsed laser illumination. A. Light doses greater than 3 J/cm2 by single wavelength (750 nm) CW and pulsed laser illumination were similarly efficient in activating WST11 as indicated by APF fluorescence relative to baseline. Light dose greater than 12 J/cm2 led to a corresponding similar degree of photodegradation of WST11 as indicated by its loss in optical density (OD) at 750 nm. Merely at small doses of light the effect on the WST11 activation as well as its photodegradation were significantly more profound by the use of the CW illumination. B. Illumination by multispectral pulsed laser (tuned from 700 nm to 800 nm in 10 nm steps) powered ≥146 mW/cm2 across wavelengths could also efficiently activate WST11. Using even higher power allowed the time to reach the maximum APF fluorescence indicative of hROS production to be cut in half (ns = non significant; * = p < 0.01).
Figure 6
Theranostic approach by MSOT. A. MSOT illumination with the use of the diagnostic illumination parameters induced VTP after the injection of WST11 and led to a reduction in oxygen saturation comparable to the WST11-VTP group of mice treated with an external continuous wave laser illumination device at 753 nm. B. After the observation course of 24 h, histological examination confirmed destruction of a large uninterrupted region in the tumor center, also comparable in extent to the effect that was observed by continuous wave CW laser illumination.
Our study had a number of limitations. As the study is based on the optoacoustic contrast of oxygenated and deoxygenated hemoglobin and calculation of the oxygenation saturation thereof, it is limited in providing reliable oxygenation saturation values in ROIs that do not contain hemoglobin, such as necrotic tissues. However, these areas can be identified by the lack of signal on the images, a practice that could become useful in clinical MSOT application. Moreover, due to fast-imaging, induction of necrosis can also be seen as a relative signal over baseline. Progress in the development of a spectroscopic pump-probe method to enable the optoacoustic determination of the oxygen content in avascular tumor tissue may also be useful in potentially overcoming this issue [37]. In addition, SO2 values were calculated herein as percent changes over baseline. It was recently shown that non-linear unmixing [27] may further improve the quantification accuracy and lead to absolute SO2 characterization. Another aspect that requires attention is the need to further investigate the theranostic potential of MSOT for PDT, exploiting different MSOT illumination paradigms than merely the one presented here in vivo, to determine the optimal and most efficient setting for activating the photosensitizer. In PDT approaches that are based on long half-life photosensitizing agents that slowly accumulate in the target tumor tissue, premature activation of the photosensitizer may cause side effects. However, in VTP with the intravascular content of the drug in tumor vessels being the target tissue as is the case in this study, those effects can be considered negligible. Lastly, while the findings were demonstrated as an investigative pilot study herein, clinical applications and a larger number of subjects can now be planned, following the demonstration of feasibility and proof of concept herein. Multispectral optoacoustic endoscopes are underway [38, 39] as a prerequisite to enable the clinical translation of theranostic approaches targeting organs exceeding the maximum penetration depth of transcutaneously applied MSOT. This may include the potential ablation of kidney, liver or pancreatic cancer and cancers in endoluminal cavities.
Overall, handheld MSOT was shown to be appropriate for non-invasively monitoring the treatment effects of VTP without the need of additional contrast agents. By providing information of time-dynamics and spatial extent, the method can be employed in understanding treatment effects, optimizing PDT-agent performance and illumination parameters and possibly serve as a means of achieving real-time monitoring and theranostic applications in the future.
Abbreviations
VTP: vascular targeted photodynamic therapy; MSOT: multispectral optoacoustic tomography; PDT: photodynamic therapy; NIR: near infrared; SO2: oxygen saturation; BOLD-MRI: blood-oxygen-level dependent magnetic resonance imaging; ODT: optical doppler tomography; pO2: oxygen partial pressure; ROI: region of interest; FOV: field of view; CW: continuous wave; hROS: highly reactive oxygen species; H&E: hematoxylin-eosin; TUNEL: terminal deoxynucleotidyl transferase dUTP nick-end labeling; OD: optical density
Supplementary Material
Supplemental Figure S1: Absorbance spectrum of WST11. Supplemental Figure S2: Pulsed laser power across wavelengths. Supplemental Figure S3: Enlarged histological images of Figure 1B. Supplemental Figure S4: Enlarged histological images of Figure 3B.
Acknowledgements
We thank the MSKCC Animal Imaging Core Facility as well as the MSKCC Molecular Cytology Core Facility for their technical support.
Grant Support
MSKCC Molecularly Targeted Intra-Operative Imaging Grant (M.F.K.); NIH R01 EB017748 (M.F.K.); NIH K08 CA16396 (M.F.K.); M.F.K. is a Damon Runyon-Rachleff Innovator supported (in part) by the Damon Runyon Cancer Research Foundation (DRR-29-14); Pershing Square Sohn Prize (M.F.K.). RSNA Research Scholar Grant (M.F.K.); MSKCC Center for Molecular Imaging and Nanotechnology Grant (M.F.K.); MSKCC Experimental Therapeutics Grant (M.F.K.). MSKCC Technology Development Grant (M.F.K.); Thompson Family Foundation Grant (K.K., S.J., J.A.C. A.S.); Deutsche Forschungsgemeinschaft (DFG) Research Fellowship Grant NE 1922/2-1 (V. Neuschmelting) and DFG Gottfried Wilhelm Leibniz Prize 2013 NT 3/10-1 and SFB824 (V. Ntziachristos); European Commission under MSCA Grant Agreement No. 605162 (J.M.); Alexander von Humboldt Postdoctoral Fellowship program (J.P.). Acknowledgments are also extended to the grant-funding support provided by the MSKCC NIH Core Grant (P30-CA008748).
Competing Interests
V. Neuschmelting, K.K., J.M., S.J., J.P., J.A.C. A.S. and M.F.K. have declared no competing interests. V. Ntziachristos has financial interest as a shareholder to iThera Medical, Munich, Germany.
References
1. Morton CA, Szeimies RM, Sidoroff A, Braathen LR. European guidelines for topical photodynamic therapy part 1: Treatment delivery and current indications - Actinic keratoses, Bowen's disease, basal cell carcinoma. J Eur Acad Dermatol Venereol. 2013;27:536-544
2. Morton CA, Szeimies RM, Sidoroff A, Braathen LR. European guidelines for topical photodynamic therapy part 2: Emerging indications - Field cancerization, photorejuvenation and inflammatory/infective dermatoses. J Eur Acad Dermatol Venereol. 2013;27:672-679
3. Mennel S, Barbazetto I, Meyer CH, Peter S, Stur M. Ocular photodynamic therapy-standard applications and new indications. Part 2. Review of the literature and personal experience. Ophthalmologica. 2007;221:282-291
4. Bozzini G, Colin P, Betrouni N. et al. Photodynamic therapy in urology: What can we do now and where are we heading? Photodiagnosis Photodyn Ther. 2012;9:261-273
5. Mazor O, Brandis A, Plaks V. et al. WST11, a novel water-soluble bacteriochlorophyll derivative; cellular uptake, pharmacokinetics, biodistribution and vascular-targeted photodynamic activity using melanoma tumors as a model. Photochem Photobiol. 2005;81:342-351
6. Brandis A, Mazor O, Neumark E, Rosenbach-Belkin V, Salomon Y, Scherz A. Novel water-soluble bacteriochlorophyll derivatives for vascular-targeted photodynamic therapy: synthesis, solubility, phototoxicity and the effect of serum proteins. Photochem Photobiol. 2005;81:983-993
7. Ashur I, Goldschmidt R, Pinkas I. et al. Photocatalytic generation of oxygen radicals by the water-soluble bacteriochlorophyll derivative WST1l, noncovalently bound to serum albumin. J Phys Chem. 2009;113:8027-8037
8. Kimm SY, Tarin T V, Monette S. et al. Nonthermal Ablation by Using Intravascular Oxygen Radical Generation with WST11: Dynamic Tissue Effects and Implications for Focal Therapy. Radiology. 2016;281:109-118
9. Murray KS, Winter AG, Corradi RB. et al. Treatment Effects of WST11 Vascular Targeted Photodynamic Therapy for Urothelial Cell Carcinoma in Swine. J Urol. 2016;196:236-243
10. Preise D, Scherz A, Salomon Y. Antitumor immunity promoted by vascular occluding therapy: lessons from vascular-targeted photodynamic therapy (VTP). Photochem Photobiol Sci. 2011;10:681-688
11. Madar-Balakirski N, Tempel-Brami C, Kalchenko V. et al. Permanent occlusion of feeding arteries and draining veins in solid mouse tumors by vascular Targeted Photodynamic Therapy (VTP) with tookad. PLoS ONE. 2010;5:e10282
12. Kawczyk-Krupka A, Wawrzyniec K, Musiol SK, Potempa M, Bugaj AM, Siero A. Treatment of localized prostate cancer using WST-09 and WST-11 mediated vascular targeted photodynamic therapy-A review. Photodiagnosis Photodyn Ther. 2015;12:567-574
13. Taneja SS, Bennett J, Coleman J. et al. Final Results of a Phase I/II Multicenter Trial of WST11 Vascular Targeted Photodynamic Therapy for Hemi-Ablation of the Prostate in Men with Unilateral Low Risk Prostate Cancer Performed in the United States. J Urol. 2016;196:1096-1104
14. Azzouzi A-R, Vincendeau S, Barret E. et al. Padeliporfin vascular-targeted photodynamic therapy versus active surveillance in men with low-risk prostate cancer (CLIN1001 PCM301): an open-label, phase 3, randomised controlled trial. Lancet Oncol. 2017;18:181-191
15. Eymerit-Morin C, Zidane M, Lebdai S, Triau S, Azzouzi AR, Rousselet M-C. Histopathology of prostate tissue after vascular-targeted photodynamic therapy for localized prostate cancer. Virchows Arch. 2013;463:547-552
16. Henderson BW, Busch TM, Vaughan LA. et al. Photofrin photodynamic therapy can significantly deplete or preserve oxygenation in human basal cell carcinomas during treatment, depending on fluence rate. Cancer Res. 2000;60:525-529
17. Pham TH, Hornung R, Berns MW, Tadir Y, Tromberg BJ. Monitoring tumor response during photodynamic therapy using near-infrared photon-migration spectroscopy. Photochem Photobiol. 2001;73:669-77
18. Wang HW, Putt ME, Emanuele MJ. et al. Treatment-induced changes in tumor oxygenation predict photodynamic therapy outcome. Cancer Res. 2004;64:7553-7561
19. Pogue BW, Braun RD, Lanzen JL, Erickson C, Dewhirst MW. Analysis of the Heterogeneity of pO2 Dynamics During Photodynamic Therapy with Verteporfin. Photochem Photobiol. 2001;74:700-706
20. Henderson BW, Busch TM, Snyder JW. Fluence rate as a modulator of PDT mechanisms. Lasers Surg Med. 2006;38:489-493
21. Gross S, Gilead A, Scherz A, Neeman M, Salomon Y. Monitoring photodynamic therapy of solid tumors online by BOLD-contrast MRI. Nat Med. 2003;9:1327-1331
22. Tempel-Brami C, Pinkas I, Scherz A, Salomon Y. Detection of light images by simple tissues as visualized by photosensitized magnetic resonance imaging. PLoS ONE. 2007;2:e1191
23. Mallidi S, Watanabe K, Timerman D, Schoenfeld D, Hasan T. Prediction of tumor recurrence and therapy monitoring using ultrasound-guided photoacoustic imaging. Theranostics. 2015;5:289-301
24. Xiang L, Xing D, Gu H. et al. Real-time optoacoustic monitoring of vascular damage during photodynamic therapy treatment of tumor. J Biomed Opt. 2013;12:14001
25. Taruttis A, Ntziachristos V. Advances in real-time multispectral optoacoustic imaging and its applications. Nat Photon. 2015;9:219-227
26. Neuschmelting V, Burton NC, Lockau H. et al. Performance of a Multispectral Optoacoustic Tomography (MSOT) System equipped with 2D vs. 3D Handheld Probes for Potential Clinical Translation. Photoacoustics. 2016;4:1-10
27. Tzoumas S, Nunes A, Olefir I. et al. Eigenspectra optoacoustic tomography achieves quantitative blood oxygenation imaging deep in tissues. Nat Commun. 2016;7:12121
28. Bohndiek SE, Sasportas LS, Machtaler S, Jokerst J V, Hori S, Gambhir SS. Photoacoustic Tomography Detects Early Vessel Regression and Normalization During Ovarian Tumor Response to the Antiangiogenic Therapy Trebananib. J Nucl Med. 2015;56:1942-1947
29. Bühler A, Kacprowicz M, Taruttis A, Ntziachristos V. Real-time handheld multispectral optoacoustic imaging. Opt Lett. 2013;38:1404-1406
30. Tzoumas S, Nunes A, Deliolanis NC, Ntziachristos V. Effects of multispectral excitation on the sensitivity of molecular optoacoustic imaging. J Biophotonics. 2015;8:629-637
31. Price M, Heilbrun L, Kessel D. Effects of the oxygenation level on formation of different reactive oxygen species during photodynamic therapy. Photochem Photobiol. 2013;89:683-686
32. ANSI. American National Standard for Safe Use of Lasers. ANSI Z136.1-2007. 2007:53-77
33. Deán-Ben XL, Ntziachristos V, Razansky D. Acceleration of optoacoustic model-based reconstruction using angular image discretization. IEEE Trans Med Imaging. 2012;31:1154-1162
34. Taruttis A, Wildgruber M, Kosanke K. et al. Multispectral optoacoustic tomography of myocardial infarction. Photoacoustics. 2013;1:3-8
35. Pogue BW, Momma T, Wu HC, Hasan T. Transient absorption changes in vivo during photodynamic therapy with pulsed-laser light. Br J Cancer. 1999;80:344-351
36. Shea CR, Hefetz Y, Gillies R, Wimberly J, Dalickas G, Hasan T. Mechanistic investigation of doxycycline photosensitization by picosecond-pulsed and continuous wave laser irradiation of cells in culture. J Biol Chem. 1990;265:5977-5982
37. Ashkenazi S. Photoacoustic lifetime imaging of dissolved oxygen using methylene blue. J Biomed Opt. 2010;15:40501
38. Knieling F, Neufert C, Hartmann A. et al. Multispectral Optoacoustic Tomography for Assessment of Crohn's Disease Activity. N Engl J Med. 2017;376:1292-1294
39. Yoon T-J, Cho Y-S. Recent advances in photoacoustic endoscopy. World J Gastrointest Endosc. 2013;5:534-539
Author contact
![]() Corresponding authors: Moritz F. Kircher (kirchermorg) or Vasilis Ntziachristos (v.ntziachristosde)
Corresponding authors: Moritz F. Kircher (kirchermorg) or Vasilis Ntziachristos (v.ntziachristosde)
Citation styles
APA
Neuschmelting, V., Kim, K., Malekzadeh-Najafabadi, J., Jebiwott, S., Prakash, J., Scherz, A., Coleman, J.A., Kircher, M.F., Ntziachristos, V. (2018). WST11 Vascular Targeted Photodynamic Therapy Effect Monitoring by Multispectral Optoacoustic Tomography (MSOT) in Mice. Theranostics, 8(3), 723-734. https://doi.org/10.7150/thno.20386.
ACS
Neuschmelting, V.; Kim, K.; Malekzadeh-Najafabadi, J.; Jebiwott, S.; Prakash, J.; Scherz, A.; Coleman, J.A.; Kircher, M.F.; Ntziachristos, V. WST11 Vascular Targeted Photodynamic Therapy Effect Monitoring by Multispectral Optoacoustic Tomography (MSOT) in Mice. Theranostics 2018, 8 (3), 723-734. DOI: 10.7150/thno.20386.
NLM
Neuschmelting V, Kim K, Malekzadeh-Najafabadi J, Jebiwott S, Prakash J, Scherz A, Coleman JA, Kircher MF, Ntziachristos V. WST11 Vascular Targeted Photodynamic Therapy Effect Monitoring by Multispectral Optoacoustic Tomography (MSOT) in Mice. Theranostics 2018; 8(3):723-734. doi:10.7150/thno.20386. https://www.thno.org/v08p0723.htm
CSE
Neuschmelting V, Kim K, Malekzadeh-Najafabadi J, Jebiwott S, Prakash J, Scherz A, Coleman JA, Kircher MF, Ntziachristos V. 2018. WST11 Vascular Targeted Photodynamic Therapy Effect Monitoring by Multispectral Optoacoustic Tomography (MSOT) in Mice. Theranostics. 8(3):723-734.
This is an open access article distributed under the terms of the Creative Commons Attribution (CC BY-NC) license (https://creativecommons.org/licenses/by-nc/4.0/). See http://ivyspring.com/terms for full terms and conditions.