Impact Factor
- Issue 11; 2026
- Issue 10; 2026
- Issue 9; 2026
- Issue 8; 2026
- Issue 7; 2026
- Volume 16; 2026
- Advance Articles
- Past Issues
- Cover Images
- Cover Suggestion
- Index & Coverage
- Special Issues
Introduction
Results
Discussion
Materials and Methods
Abbreviations
Supplementary Material
Acknowledgements
References
International Journal of Biological Sciences
International Journal of Medical Sciences
 Global reach, higher impact

Theranostics 2018; 8(6):1740-1751. doi:10.7150/thno.22010 This issue Cite
Research Paper
Genomic analysis of liver cancer unveils novel driver genes and distinct prognostic features
Xiangchun Li1,6#, Weiqi Xu1#, Wei Kang3, Sunny H. Wong1, Mengyao Wang4, Yong Zhou4, Xiaodong Fang4, Xiuqing Zhang4, Huanming Yang4,5, Chi H. Wong7, Ka F. To3, Stephen L. Chan7, Matthew T.V. Chan2, Joseph J.Y. Sung1, William K.K. Wu1,2, ![]() , Jun Yu1,
, Jun Yu1, ![]()
1. Institute of Digestive Diseases and Department of Medicine & Therapeutics, State Key Laboratory of Digestive Diseases, LKS Institute of Health Sciences, CUHK Shenzhen Research Institute, The Chinese University of Hong Kong, Hong Kong.
2. Department of Anaesthesia and Intensive Care, The Chinese University of Hong Kong, Hong Kong.
3. Department of Anatomical and Cellular Pathology, The Chinese University of Hong Kong, Hong Kong.
4. Beijing Genomics Institute-Shenzhen, Shenzhen 518083, Guangdong, People's Republic of China.
5. James D. Watson Institute of Genome Sciences, 310058, Hangzhou, People's Republic of China.
6. Public Laboratory, National Clinical Research Center for Cancer, Key Laboratory of Cancer Prevention and Therapy of Tianjin, Tianjin Medical University Cancer Institute and Hospital, Tianjin 300060, People's Republic of China.
7. Department of Clinical Oncology, State Key Laboratory in Oncology in South China, Prince of Wales Hospital, The Chinese University of Hong Kong, Hong Kong
#XL and WX contributed equally to this work.
✉ Corresponding authors: Prof. Jun Yu, Institute of Digestive Diseases, Department of Medicine and Therapeutics, The Chinese University of Hong Kong, Shatin, NT, Hong Kong. Tel: (852) 3763 6099; Fax: (852) 2144 5330; Email: junyu@cuhk.edu.hk; or Dr William KK Wu, Department of Anaesthesia and Intensive Care, The Chinese University of Hong Kong, Shatin, NT, Hong Kong. Tel: (852) 3505 3147; Fax: (852) 2637 2422; Email: wukakei@cuhk.edu.hk
Received 2017-7-20; Accepted 2017-12-12; Published 2018-2-12
Abstract

Objective: Hepatocellular carcinoma (HCC) is a highly heterogeneous disease with a dismal prognosis. However, driver genes and prognostic markers in HCC remain to be identified. It is hoped that in-depth analysis of HCC genomes in relation to available clinicopathological information will give rise to novel molecular prognostic markers.
Methods: We collected genomic data of 1,061 HCC patients from previous studies, and performed integrative analysis to identify significantly mutated genes and molecular prognosticators. We employed three MutSig algorithms (MutSigCV, MutSigCL and MutSigFN) to identify significantly mutated genes. The GISTIC2 algorithm was used to delineate focally amplified and deleted genomic regions. Nonnegative matrix factorization (NMF) was utilized to decipher mutational signatures. Kaplan-Meier survival and Cox regression analyses were used to associate gene mutation and copy number alteration with survival outcome. Logistic regression model was applied to test association between gene mutation and mutational signatures.
Results: We discovered 11 novel driver genes, including RNF213, VAV3 and TNRC6B, with mutational prevalence ranging from 1% to 3%. Seven mutational signatures were also identified in HCC, some of which were associated with mutations of classical driver genes (e.g., TP53, TERT) as well as alcohol consumption. Focal amplifications of TERT and other druggable targets, including AURKA, were also revealed. Targeting AURKA by a small-molecule inhibitor potently induced apoptosis in HCC cells. We further demonstrated that HCC patients with TERT amplification displayed shortened overall survival independent of other clinicopathological parameters. In conclusion, our study identified novel cancer driver genes and prognostic markers in HCC, reiterating the translational importance of omics data in the precision medicine era.
Keywords: HCC, mutation, TERT, prognostic marker, druggable target
Introduction
Hepatocellular carcinoma (HCC) ranks the sixth most common cancer and the second leading cause of cancer mortality worldwide with a 5-year survival rate of about 17% [1]. No effective systemic treatment is as yet available for advanced HCC except sorafenib, which modestly extends the median overall survival from 7.9 months to 10.7 months [2]. In recent years, whole-genome and exome sequencing studies have revealed the mutational landscape of HCC. These studies expanded the list of HCC-related drivers, including the well-known TP53, CTNNB1 and ARID1A, and constitutive activation of TERT via hotspot promoter mutations and/or amplifications [3, 4]. Such efforts also led to the identification of potential druggable targets, such as actionable activated mutations in JAK1 [5]. However, the number of tumor samples analyzed in these studies is still far from optimal, leaving novel HCC driver genes to be discovered. In particular, driver genes of low-to-intermediate mutation frequency are expected to show up if more samples are added [6]. Moreover, the mutation spectrum bears information on mutagenic factors (e.g., ultraviolet in skin cancer and smoking in lung cancer) that have acted over the course of tumorigenesis [7, 8]. Our recent study also discovered the association between TpCpW mutations and APOBEC expression in gastric cancer [9]. It is expected that, by deciphering the mutation spectrum, the mutational processes operative in HCC and their relationship with environmental and host factors will be delineated.
Stratification of cancer patients with distinct clinical outcomes based on molecular features is an important goal of precision medicine. The prognosis of HCC is heterogeneous with the median survival following diagnosis ranging from approximately 6 to 20 months. Currently, HCC prognostication mainly relies on clinicopathological staging although molecular features, such as TP53 mutations and expression of cellular proliferation markers, have been reported to predict survival [10-12]. With the advent of next-generation sequencing, utilization of “big data” for molecular typing now becomes feasible. Our group previously reported on two molecular subtypes of gastric cancer with distinct prognostic outcomes based on mutation profiles of driver genes [9] and devised a five-gene mutational signature in colorectal cancer that could predict overall survival independent of tumor-node-metastasis (TNM) staging [13]. It is hoped that more in-depth analysis of HCC genomes in relation to available clinicopathological information will give rise to novel molecular prognostic markers.
The purposes of this study are to identify novel driver genes and genetic prognosticators in HCC through integrative analysis of mutational profiles in association with clinicopathologic data from all previous related genomic studies [3-5, 14, 15] and the Cancer Genome Atlas Network. We also examined mutational signatures of HCC in relation to known endogenous and exogenous factors.
Results
A compendium of significantly mutated genes in HCC
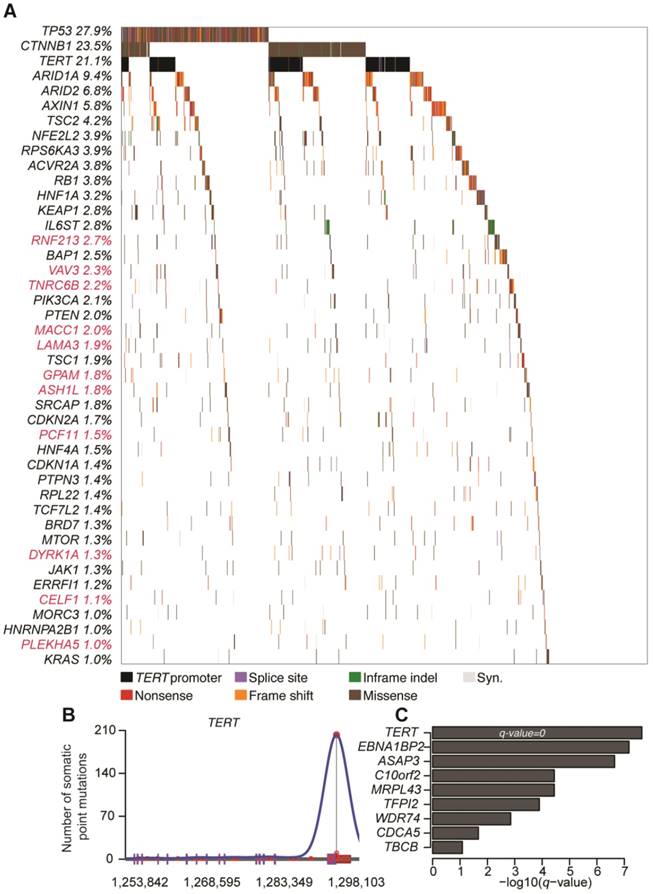
A total number of 190,099 somatic mutations from 1,061 HCC tissues were obtained, including 3,750 nonsense, 59,990 missense, and 2,465 splice-site mutations together with 5,533 short insertions/deletions. On average, there are 2.11 mutations per mega-base (Mb). To identify significantly mutated genes (SMGs) that are linked to HCC development, MutSigCV, MutSigCL and MutSigFN were employed to identify genes whose mutations are positively accumulated, clustered at hotspot, and of functional importance [16]. In total, 43 SMGs that were mutated in ≥1% of HCCs were identified, including 32 reported HCC-related genes (e.g., TP53, CTNNB1, ARID1A, ARID2, AXIN1, TSC2) and 11 novel SMGs (e.g., RNF213, VAV3, TNRC6B, MACC1, LAMA3, GPAM) (Figure 1A and Table S1). In particular, five genes, namely TP53, CTNNB1, NFE2L2, HNF1A and CDKN2A, were identified as significantly mutated by all three algorithms. To uncover potential genetic interactions among SMGs in HCC development, co-occurrence and mutual exclusivity of mutations among 43 SMGs were analyzed with MuSIC [17] and MEMo [18]. While none of the pairs displayed co-occurrence, sixteen pairs of SMGs were found by MuSIC to be mutually exclusively mutated (Table S2), including CTNNB1 and TP53 (p < 0.0001), CTNNB1 and AXIN1 (p = 0.0003), CTNNB1 and RB1 (p = 0.0005) and RPL22 and TP53 (p = 0.0023). With MEMo, we also identified four significant modules preferably targeting Wnt/β-catenin, p53 signaling and cell cycle circuits (Table S3), which was further confirmed by significantly mutated pathway analysis (Table S4). In addition, we used an integrative model proposed by Zhao et al. to incorporate mutation, focal copy number change and expression data from a TCGA liver cancer study to identify mutated driver pathways [19]. The result showed that modules involving TP53, CTNNB1 and AXIN1 are significantly altered (Table S5).
Promoter mutations in HCC
Promoter mutations can alter transcription factor binding behaviors, such as creating new binding sites or abrogating existing binding sites. Consistent with a recent report [20], we found that TERT, which encodes the telomerase reverse transcriptase, was most significantly enriched with promoter mutations in HCC (Figure 1B). Apart from TERT, we identified 8 other genes with significant enrichment for promoter mutations (Figure 1C and Figure S1), including EBNA1BP2 (encoding a binding partner of c-Myc) [21], ASAP3 (encoding a GTPase-activating protein that functions in cell migration and invasion) [22] and TFPI2 (encoding a proteinase inhibitor epigenetically silenced in multiple human cancers) [23].
Pathways altered by somatic mutations in HCC
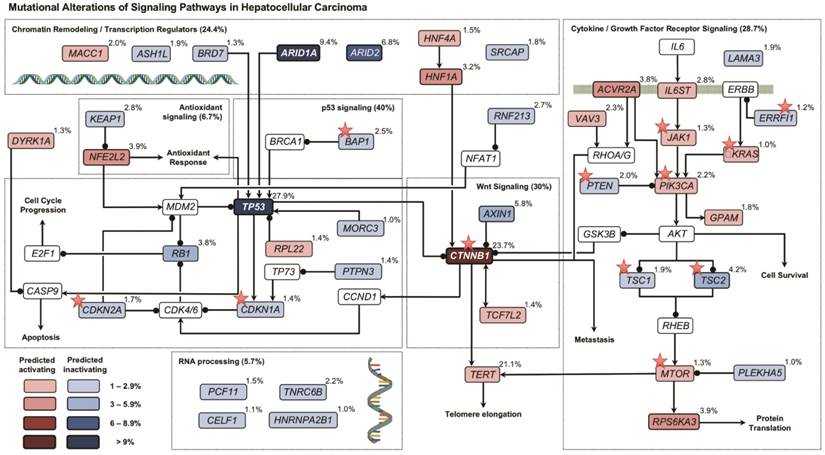
By mapping SMGs and other well-known genes to cell signaling pathways, we observed that several pathways were frequently genetically altered in HCC (Figure 2), including p53 signaling (40.0%), Wnt/β-catenin signaling (30.0%), cytokine/growth factor receptor signaling (28.7%), and chromatin remodeling/transcriptional regulation (24.4%). Interestingly, genes involved in oxidative stress response (6.7%) and RNA processing (5.7%) were also frequently altered by somatic mutations.
Significantly mutated genes (SMGs) and promoter-mutated genes identified in HCC. (A) SMGs that are mutated in ≥1% of HCC (n = 1,061) are listed. Mutation types are distinguished by different colors with 11 novel SMGs highlighted in red. (B) Mutation density plot of TERT. (C) Bar-plot representation of enrichment scores for genes enriched for promoter mutations with q values < 0.1.
Signaling pathways altered by somatic mutations in HCC. Red and blue colors denote SMGs with predicted activating and inactivating mutation, respectively. Genes in white color are not SMGs but have key roles in tumorigenesis. Druggable targets are marked with red stars. Note: For TERT, promoter instead of exomic region mutation frequency is shown.
Copy number alterations in HCC
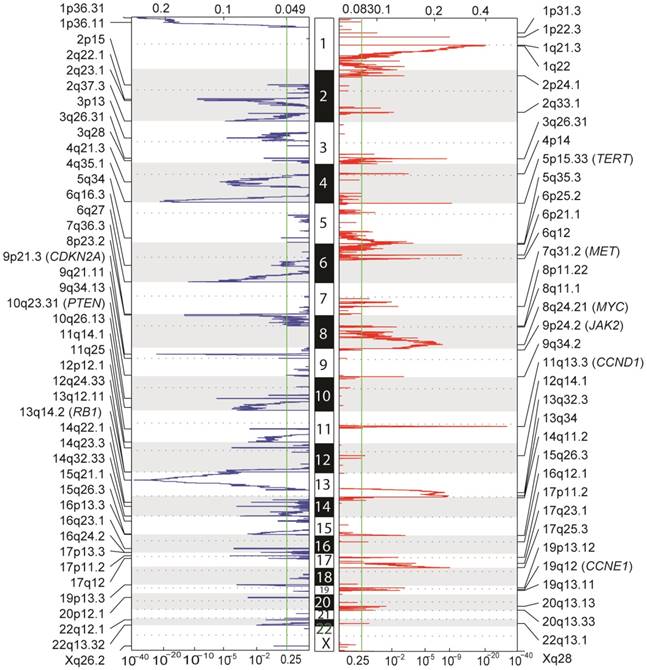
Aside from point mutations and short insertions/deletions, we used GISTIC2 to analyze DNA copy number alterations (CNAs) based on segmentation data obtained from TCGA to delineate genome-wide focal DNA gain and loss [24]. Significant arm-level alterations include gain of 5q, 6p, 7p, 7q, 8q, 17q, 20p and 20q, and loss of 4p, 4q, 6q, 9p, 9q, 10q, 14q, 16p and 21q. Focal amplifications in regions containing canonical cancer genes include 8q24.21 (MYC), 11q13.3 (CCND1), 19q12 (CCNE1), 7q31.2 (MET), 9p24.2 (JAK2), as well as 5p15.33 (TERT), whereas focal deletions involved 13q14.2 (RB1), 9p21.3 (CDKN2A) and 10q23.31 (PTEN) (Figure 3). Tumor ploidy estimated by ABSOLUTE [25] revealed that a large proportion of HCCs exhibited genome doubling (Table S6).
Mutated genes and CNAs with prognostic significance in HCC
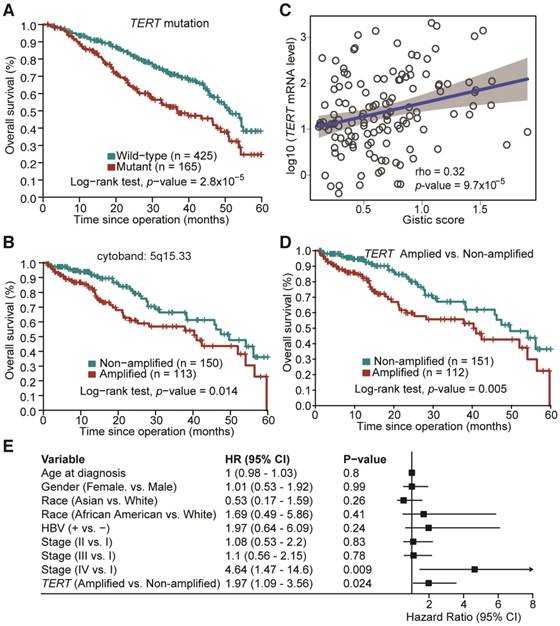
The potential association between mutation status of the identified SMGs and clinicopathological information of HCC patients was examined. TP53 is the most prevalently mutated gene in HCC among all SMGs. We found that its mutations were significantly associated with poorer overall survival of HCC patients (Figure S2; Log-rank test, p = 6.6×10⁻⁶), which is consistent with previous studies [11, 12]. TP53 mutations were also associated with more advanced tumor grade (Odds Ratio (OR) = 2.17, Fisher's exact test, p = 0.0003). Apart from TP53 mutation, we found that TERT promoter mutations were significantly correlated with poorer overall survival in HCC (Figure 4A; p = 2.81×10⁻⁵), more advanced tumor grade (OR = 2.5; p = 1.02×10⁻⁵) and disease relapse (OR = 4.76; p = 2.33×10⁻¹²). Mutations of other genes were not significantly associated with survival in our analysis. For CNAs at both large segment- and focal-levels, we observed that three amplification regions (5q15.33, 19q13.11 and 20q13.13) and three deletion regions (15q21.1, 17q11.2 and 17q12) were significantly associated with shortened overall survival of HCC patients, respectively (Figure 4B and Figure S3). In particular, amplifications of 5q15.33 were significantly associated with increased mRNA levels of TERT (Figure 4C), which was located in the amplified region. Importantly, amplification of TERT was associated with shortened overall survival of HCC patients (Figure 4D) independent of other clinicopathological parameters, including age, gender and TNM staging (Figure 4E). Amplifications or deletions of individual genes at other regions were not associated with altered survival of HCC patients.
Genome-wide focal amplification (red) and deletion (blue) peaks identified in HCC.
Mutational signatures operative in HCC
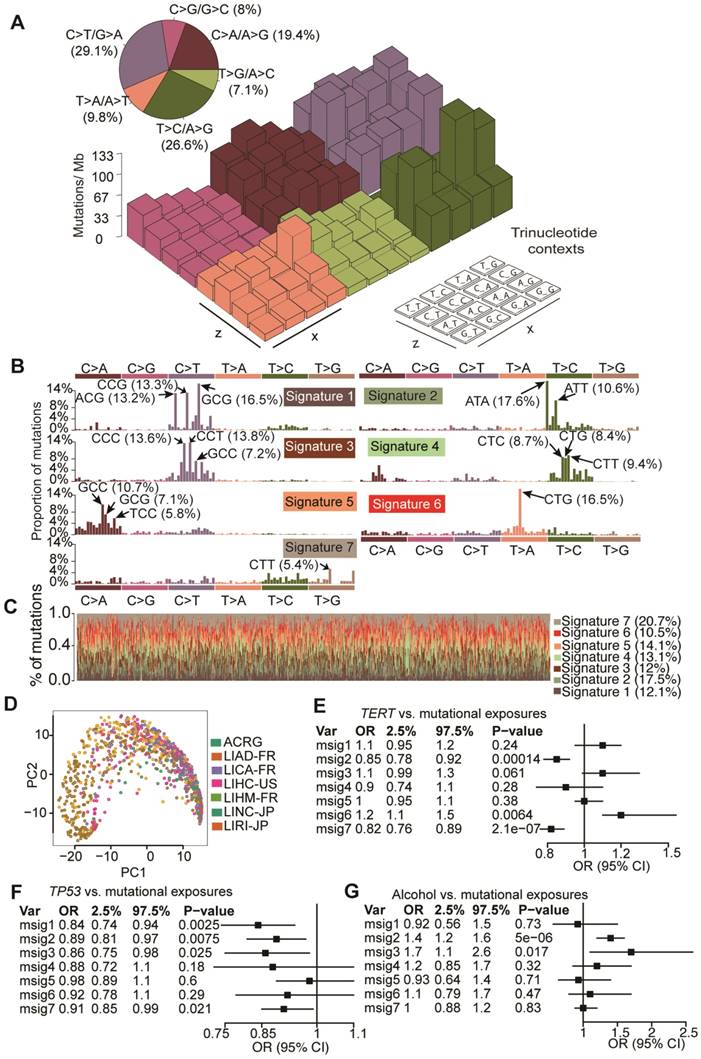
To elucidate mutagenic processes associated with hepatocarcinogenesis, computational framework as proposed by Alexandrov et al. with modifications was used to define mutational signatures of HCC [8]. We found that nucleotide changes of C>T/G>A, T>C/A>G and C>A/G>T dominated the mutation spectrum (Figure 5A). Seven mutational signatures (Figure 5B) were extracted from 1,061 HCCs, each of which contributed to different proportion of mutations (Figure 5C). Kernel principal component analysis revealed that mutational signatures corresponding to different studies were admixed (Figure 5D), suggesting minimal impact of batch effect on mutational signatures. Next we applied Bayesian-based general linear model to regress mutation exposures with etiological factors, tumor grade and mutation status of six major SMGs. We found that Signature 6 was positively correlated with TERT mutations whereas Signatures 2 and 3 were associated with alcohol consumption. Several signatures were also negatively correlated with TP53 mutations (Figure 5E and Figure S4). However, none of the seven signatures was associated with hepatitis B virus (HBV) infection, hepatitis C virus (HCV) infection or non-alcoholic fatty liver disease. In comparison with recently updated COSMIC mutational signatures [8], we found that Signatures 2, 3, 5 and 6 exhibited high similarity with COSMIC Signatures 16, 19/23, 24 and 22, respectively, and are potentially associated with HCC. For example, Signature 5 is known to be associated with aflatoxin exposures. Cosine similarities among mutational signatures obtained from our study and COSMIC are provided in Figure S5. In addition, we noted that Signature 6 (dominated by T>A at CpTpG) is prevalent in our study but absent in a study reported by Fujimoto et al.24, whereas the other signatures exhibited similar base substitution patterns. We were not able to calculate signature-wise cosine similarity due to the unavailability of mutation signature data from Fujimoto et al.'s study.
Druggable target amplifications in HCC
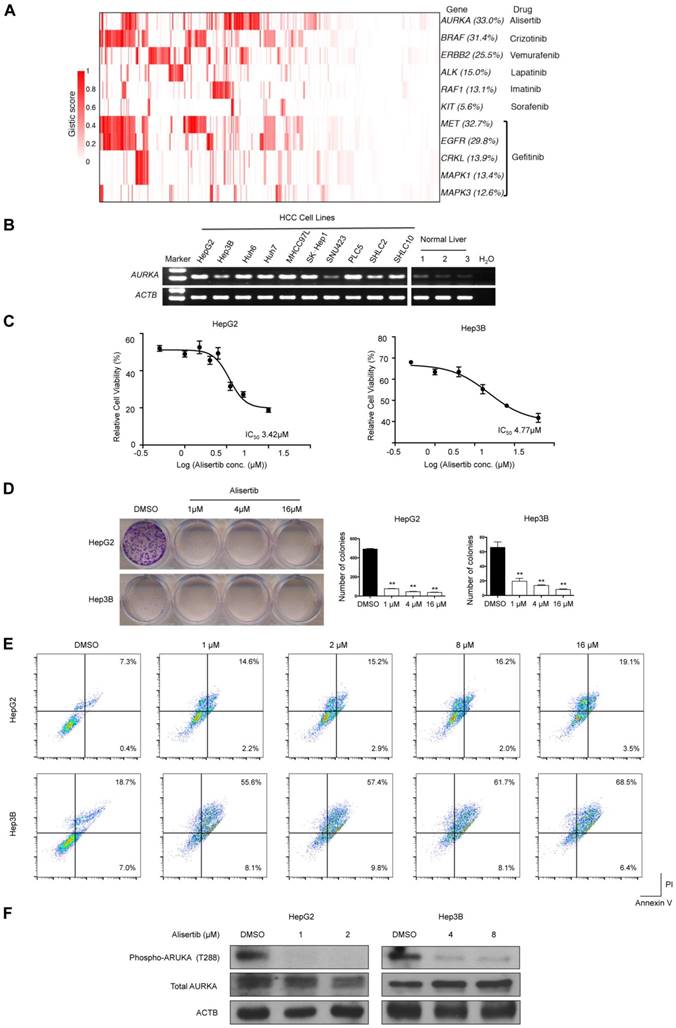
We used the TARGET database to identify potential druggable SMGs (Figure 2) and amplified genes (Figure 6A). Results showed that epidermal growth factor receptor inhibitors (e.g., Gefitinib) might be beneficial for 48.4% of HCC patients by targeting amplified EGFR, MET, MAPK1, MAPK3 and CRKL. Crizontinib and vemurafenib may also benefit 31.4% and 22.5% of HCC patients with BRAF and ERBB2 amplification, respectively. Of particular interest, AURKA was amplified in about one-third of HCC, which might be susceptible to the small-molecule inhibitor alisertib.
Validating AURKA as a druggable target in HCC
To confirm AURKA as druggable target in HCC, we first determined its mRNA expression in 10 HCC cell lines and 3 normal liver tissues. Semi-quantitative reverse-transcription PCR revealed that AURKA was strongly expressed in HCC cell lines but not normal liver tissues (Figure 6B). Importantly, the AURKA inhibitor alisertib strongly inhibited the cell viability (Figure 6C) and colony-forming ability (Figure 6D) of two HCC cell lines, namely HepG2 and Hep3B, at low micromolar concentrations. Flow cytometry assays also showed that alisertib induced apoptosis in both HepG2 and Hep3B cells (Figure 6E). In this regard, alisertib potently inhibited the auto-phosphorylation of AURKA on Thr288 within the activation loop (Figure 6F), which is an indicator of AURKA activity. We also tested the effects of alisertib on 2 additional HCC cell lines (SNU449 and SNU182) with more mesenchymal phenotypes. Similar to HepG2 and Hep3B, alisertib strongly reduced cell viability and colony-forming ability and markedly induced apoptosis. Alisertib also strongly inhibited the migration of SNU449 and SNU182 cells (Figure S6).
Prognostic significance of TERT promoter mutations and amplification in HCC. (A) Kaplan-Meier survival analysis with respect to TERT promoter mutation status. (B) Amplification of 5q15.33 was associated with shortened overall survival in HCC patients. (C) Significant positive correlation between TERT Gistic score and mRNA expression levels in TERT-amplified samples. (D) HCC patients with TERT amplifications exhibited poorer overall survival. (E) Multivariate Cox regression analysis of HCCs with or without TERT amplification in relation to age, gender, race, HBV status and TNM staging.
Mutation signatures operative in HCC and their correlation with gene mutations and alcohol consumption. (A) Lego plot of mutation patterns in 1,061 HCC samples. Single-nucleotide substitutions are divided into six categories with 16 surrounding flanking bases. Inset pie chart shows the proportion of 6 categories of mutation patterns. (B) Seven mutational signatures were extracted from HCC. (C) Proportion of 7 mutation signatures in individual HCC samples. (D) Kernel principal component analysis was conducted for mutational signatures with HCC samples from different studies labeled with different colors. (E-G) Significant association of mutation signatures with (E) TERT mutation status, (F) TP53 mutation status and (G) alcohol consumption were identified.
Discussion
In this study, we performed a systematic analysis of 1,061 HCC genomes, which is the largest number of HCC samples for integrative analysis thus far, and correlated our analysis with clinical features. The main findings that emerged from our study include: (1) Identification of new SMGs and genes enriched with promoter mutations; (2) Association between TERT amplification/promoter mutations and poorer overall survival in HCC; (3) Correlation of HCC mutation signatures with alcohol consumption and mutations of canonical cancer genes; (4) Identification of druggable targets in HCC, including AURKA, whose inhibition was experimentally confirmed to induce apoptosis in HCC cells.
Through three different MutSig algorithms, we rediscovered 32 reported SMGs and identified 11 novel SMGs that are mutated in ≥1% of HCC. Importantly, several newly identified SMGs, including VAV3 [26], MACC1 [27], GPAM [28] and DYRK1A [29], have been reported to take part in the pathogenesis of other cancer types. RNF213, which was mutated at the highest frequency (2.7%) among the 11 novel SMGs, encodes an E3 ubiquitin-protein ligase that is known to degrade NFAT1 [30], a transcription factor that can in turn activate MDM2 for promoting p53 degradation [31]. VAV3, another novel SMG that was mutated in 2.3% of HCC, has also been shown to promote prostate cancer metastasis through activating Rac1 [32]. It is estimated that the current sample size has a high power (98%) to identify new SMGs mutated in 3% of HCC samples. It is therefore unlikely that further increasing sample size will lead to identification of novel high-frequency (>3%) drivers. However, the statistical power reduces to 66% and 6% for SMGs mutated in 2% and 1% of samples, respectively. Based on a background mutation rate of 2.11 mutations per Mb in HCC from this study, 4,200 cases are required to identify SMGs in 1% of patients with 80% power. These estimations underscore the importance of a larger sample size to discover more drivers with low-to-intermediate mutation frequencies (1-3%) in HCC.
A potential limitation of this study is that results might be confounded by batch effect, which is common for meta-analysis of genomic data. To address batch effect in SMG identification, we used stringent criteria (e.g., filtering out cohort-biased genes) to get rid of artifacts. However, carcinogenesis is closely related to environmental factors, which may confer unique selective pressure over specific driver genes. Thus de facto cohort-specific drivers might have been removed from the final SMG list.
Pertinent to clinical practice, our analysis showed that genetic alterations of TERT and TP53 were correlated with poorer overall survival in HCC patients. Concordantly, previous studies have shown that TP53 mutations were associated with shortened survival and disease recurrence in HCC [11, 12]. Our analysis further identified TERT amplification/promoter mutations as a novel unfavorable prognosticator in HCC. TERT promoter mutations have been reported to create binding sites for E-twenty-six (ETS) transcription factors [33], leading to TERT upregulation in different cancer types [20, 34, 35]. However, it is noteworthy that TERT promoter mutation frequency might be underestimated in this study due to unavailability of mutation status outside exomic regions obtained from TCGA level 3 dataset and incomplete capture/sequencing.
Except Signature 6, the mutational signatures extracted from our study and those reported by Fujimoto et al. [29] showed similar base substitution patterns. However, there are still subtle variations between these two studies probably because we used only exomic mutations while Fujimoto et al. used all mutations identified from whole-genome sequencing data [15]. In addition, our study incorporated genomic data from different geographic areas, and each may have its own distinct mutation signatures, therefore leading to identification of Signature 6 in our study.
Our discovery of novel actionable targets, including AURKA, has strong therapeutic implications for HCC. Amplification of AURKA is oncogenic and has been observed in colorectal, gastric, prostate, and breast cancers [36]. Importantly, the AURKA inhibitor alisertib is currently being assessed in multiple Phase II and III clinical trials for hematological malignancies and solid tumors (HCC not included). Based on our findings, HCC patients, especially those with AURKA amplification, might also benefit from alisertib.
In conclusion, through integrative analysis of 1,061 HCC genomes to increase statistical power, 11 novel driver genes with mutational prevalence ranging from 1% to 3% were identified. Novel association between TERT amplification and shortened overall survival in HCC patients was also identified. Our findings not only shed new light on the genetic basis of HCC, but may also be leveraged to accelerate the interpretation of cancer genome data for prognostication and personalized intervention.
Amplified druggable targets and experimental validation of AURKA. (A) Heatmap representation of amplified druggable targets and corresponding inhibitors are shown. (B) Semi-quantitative PCR was performed to detect AURKA mRNA levels in HCC cell lines and normal liver tissues. ACTB was used as internal control. (C) HepG2 and Hep3B cells were exposed to varying concentrations of alisertib for 48 h. Cell viability was assessed by MTT analysis. Inset: IC50 values of alisertib in HepG2 and Hep3B cells. (D) Colony formation assay of HepG2 and Hep3B cells treated with varying concentrations of alisertib for 48 h. (E) Apoptosis was detected by flow cytometric analysis of HCC cells double-stained with 7-AAD and annexin V. Percentages of apoptotic cells (the lower and upper right quadrants) are indicated. (F) Western blot analysis of phosphorylation of AURKA at T288, total AURKA and ACTB. Data are presented as mean ± SEM of at least three independent experiments. *p < 0.05; **p < 0.01, significantly different from control.
Materials and Methods
Genomic data
All point mutations and short insertions/deletions were collected from ICGC Data Release 18 and supplementary information of previous studies representing 1,069 HCC patients of 4 geographically different origins [3-5, 14, 15]. Eight hyper-mutated samples (0.75%) with ≥ 500 somatic mutations in exomic regions were discarded to avoid their undue effects on genomic analysis. Duplicated mutations were merged to keep only one record. All somatic mutations were examined in a panel of 442 sequenced normal samples in which variations present in this panel were removed. Copy number change and gene expression data were obtained from TCGA Data Portal.
Identification of significantly mutated genes
We identified significantly mutated genes (SMGs) with three algorithms using MutSigCV, MutSigCL and MutSigFN. MutSigCV quantifies significance of non-silent mutations in a gene based on background mutation rate estimated by silent mutations with other confounding covariates taken into account. MutSigCL and MutSigFN measure the significance of hotspot mutations and functional impacts of mutations, respectively. In MutSigFN analysis, CADD and Polyphen2 scores available from dbNSFP database were separately used [37]. For efficient computation, a two-step permutation was carried out, in which 999 times were performed in the first step to define candidate SMGs (i.e., those with p < 0.05) followed by extensive permutation with 1,000,000 times. We then combined p values obtained from the 1st and 2nd steps. p values were then false discovery rate (FDR)-corrected (q values) using the method of Benjamini and Hochberg. For the final analysis of SMGs, we applied additional filtering criteria to eliminate possible false positives that may result from the batch effect via combining somatic mutations from different studies. A gene was considered to be a SMG if the following conditions were satisfied: (1) statistically significant (q value < 0.1) by at least one of the MutSig algorithms; (2) expressed in the TCGA pan-cancer dataset, human cancer cell lines and/or reported in previous studies [6, 38-41]; (3) mutated in at least 3 out of 7 cohorts; (4) mutational prevalence comparable among different cohorts. This produced a final list of 43 SMGs with mutational prevalence ≥1%.
Identification of genes enriched with promoter mutations
The promoter of a gene is defined as the region 0-3 kb upstream of its transcription start site. To control for heterogeneity of background mutation rates, mutation context and DNA replication time were taken into account. Mutation contexts are classified into 6 categories, including C>T mutation in CpG dinucleotide (CpG>T), mutation of C in TpC (C>mut), A>T mutation in TpA (TpA>T), C>T and C>A mutations outside CpG, TpC and TpA, as well as other mutations. The overall background and observed number of mutations in category i were calculated and denoted as Ni and ki, respectively. The latter can be modelled by a binomial distribution with background mutation rate in category i as:
pi = Ni / ki
ki ~ dbin(pi, Ni)
The Bayesian inference can be used to estimate pi with a beta prior distribution for pi:
pi ~ dbeta(a, b), where a and b are hyper parameters
Given that DNA replication timing is associated with substantially varying background mutation rates, we clustered genomic regions into 4 distinct clusters, denoted as C1-4, based on the distribution of DNA replication timing data (Figure S7) obtained from a previous study [42]. Estimation of pi was performed separately for C1-4. Bayesian inference of pi was performed with JAGS and R package R2jags.
After pi is available, the expected number of promoter mutations in a gene from genomic region Cj (where j = 1, 2, 3 and 4) is modelled as a Poisson distribution with expected number of mutations:
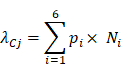
A p value was calculated for each gene and subjected to multiple hypothesis test correction. A promoter mutation-enriched gene was selected if its q value was less than 0.1 and considered to be expressed in previous studies [38][39].
Deciphering mutation signatures
A computational framework as previously described was used to extract mutation signatures that are operative in HCC [43]. Since the divergence-based update negative matrix factorization (NMF) algorithm used by default did not give compelling results, the multiplicative update algorithm was used, which produced higher stability along with lower reconstruction error at the same number of mutation signatures (Figure S8).
Survival analysis
Association of mutation status with patients' overall survival was assessed by Kaplan-Meier survival curve and the log-rank test. Univariate and multivariate Cox model were constructed to estimate hazard ratios for prognosticators with a p value less than 0.05 in the log-rank test. All these analyses were performed with R survival package.
Cell culture and AURKA inhibitor
All human HCC cell lines were purchased from American Type Culture Collection (ATCC, Washington, DC, USA) and cultured in Dulbecco's Modified Eagle's Medium (DMEM, GIBCO-BRL) medium supplemented with 10% fetal bovine serum (FBS), 100 U/mL penicillin, and 100 μg/mL streptomycin in humidified air at 37°C with 5% CO2. Alisertib (MLN8237) was purchased from MedChemExpress (New Jersey, USA).
RNA extraction and semi-quantitative reverse-transcription-PCR
Total RNA was extracted from HCC cell lines and tissue samples using Trizol reagent (Invitrogen, Carlsbad, CA). Complementary DNA was synthesized from total RNA using ABITM reverse transcription kit and (Applied Biosystems, Foster City, CA). For semi-quantitative reverse-transcription-PCR, AURKA and ACTB were amplified with AmpliTaq Gold DNA polymerase (Applied Biosystems) using the following primers: AURKA forward, 5′-GGAATATGCACCACTTGGAACA-3′; AURKA reverse, 5′-TAAGACAGGGCATTTGCCAAT-3′; ACTB forward, 5′-CATCCACGAAACTACCTTCAACTCC-3′; ACTB reverse, 5′-GAGCCGCCGATCCACACG-3′.
Functional assays
Cell viability was assayed using 3-(4,5-dimethylthiazolyl)- 2,5-diphenyltetrazoliumbromide (MTT) assays (Sigma-Aldrich, Carlsbad, CA, USA). Briefly, cells were plated in 96-well plates (1,500 cells per well). After 24 h, cells were treated with various concentrations of alisertib. After 48 h, 0.5 mg/mL MTT was added to each well. Four hours later, cells were lysed with dimethyl sulfoxide (DMSO), and absorbance rates were measured at 570 nm using a microplate reader (Bio-Rad, Hercules, CA, USA). For colony formation assay, cells were trypsinized to single cell suspensions and were seeded in 12-well plates at 1000/well. After 14 days culture in DMEM medium, the colonies were stained with Crystal Violent solution and the number of colonies was counted. Cell migration was measured with Transwell insert chambers (ThermoFisher, Hong Kong, China). Phycoerythrin (PE) Annexin V/7-Amino-Actinomycin (7-AAD) double staining (Apoptosis Detection Kit, BD Biosciences, San Jose, CA, USA) was performed to detect apoptosis. In brief, cells were washed and resuspended in binding buffer prior to the addition of PE-labeled Annexin V and 7-AAD for 10 min. Suspensions were immediately analyzed by flow cytometry using BD Accuri™ C6 Cytometer (BD Biosciences). Each experiment was performed in triplicate.
Statistical analysis
All statistical analyses were performed using the SPSS 17.0 software package (SPSS, Chicago, IL, USA). Experimental data were expressed as the mean ± SEM. For comparison of means between two groups, a two- tailed t-test was used, and for comparison of means among three groups, one-way ANOVA was used. Significance was accepted at p < 0.05.
Abbreviations
CNA: copy number alteration; HCC: hepatocellular carcinoma; SMG: significantly mutated gene; TNM: tumor-node-metastasis.
Supplementary Material
Supplementary figures and tables.
Acknowledgements
This project was supported by research funds from RGC-GRF Hong Kong (766613; 14114615), RGC-ECS (24115815); National Basic Research Program of China (973 Program, 2013CB531401), Theme-based Research Scheme of the Hong Kong Research Grants Council (T12-403-11); Collaborative Research Fund (HKU3/CRF11R, CUHK3/CRF/12R) of the Research Grant Council Hong Kong, Shenzhen Municipal Science and Technology R & D fund (JCYJ20130401151108652), Shenzhen Science and Technology Programme (JCYJ20150630165236956, JCYC20140905151710921), Shenzhen Virtual University Park Support Scheme to CUHK Shenzhen Research Institute, and Natural Science Foundation of Guangdong Province (2015A030313886) of Department of Science and Technology of Guangdong Province. The study sponsor in the study design has no role in data collection, analysis or interpretation.
Author Contributions
J Yu and WKK Wu designed and managed the project. X Li, M Wang, Y Zhou, X Fang, X Zhang, performed bioinformatic analysis. W Kang and W Xu performed the experiments. J Yu, WKK Wu, SH Wong, MTV Chan, JJY Sung, and X Li analyzed the data. X Li, WKK Wu and J Yu wrote the paper. MTV Chan, H Yang, SH Wong, and JJY Sung revised the paper.
Competing Interests
The authors declare no competing financial interests.
References
1. Torre LA, Bray F, Siegel RL. et al. Global Cancer Statistics, 2012. J Clin. 2015;65:87-108
2. Llovet JM, Ricci S, Mazzaferro V. et al. Sorafenib in advanced hepatocellular carcinoma. N Engl J Med. 2008;359:378-390
3. Schulze K, Imbeaud S, Letouzé E. et al. Exome sequencing of hepatocellular carcinomas identifies new mutational signatures and potential therapeutic targets. Nat Genet. 2015;47:505-511
4. Totoki Y, Tatsuno K, Covington KR. et al. Trans-ancestry mutational landscape of hepatocellular carcinoma genomes. Nat Genet. 2014;46:1267-1273
5. Kan Z, Zheng H, Liu X. et al. Whole-genome sequencing identifies recurrent mutations in hepatocellular carcinoma. Genome Res. 2013;23:1422-33
6. Lawrence MS, Stojanov P, Mermel CH. et al. Discovery and saturation analysis of cancer genes across 21 tumour types. Nature. 2014;505:495-501
7. Helleday T, Eshtad S, Nik-Zainal S. Mechanisms underlying mutational signatures in human cancers. Nat Rev Genet. 2014;15:585-98
8. Alexandrov LB, Nik-Zainal S, Wedge DC. et al. Signatures of mutational processes in human cancer. Nature. 2013;500:415-21
9. Li X, Wu WKK, Xing R. et al. Distinct subtypes of gastric cancer defined by molecular characterization include novel mutational signatures with prognostic capability. Cancer Res. 2016;76:1724-1733
10. Tang S, Wu WKK, Li X. et al. Stratification of Digestive Cancers with Different Pathological Features and Survival Outcomes by MicroRNA Expression. Sci Rep. 2016;6:24466
11. Honda K, Sbisà E, Tullo a. et al. P53 Mutation Is a Poor Prognostic Indicator for Survival in Patients With Hepatocellular Carcinoma Undergoing Surgical Tumour Ablation. Br J Cancer. 1998;77:776-782
12. Hayashi H, Sugio K, Matsumata T. et al. The clinical significance of p53 gene mutation in hepatocellular carcinomas from Japan. Hepatology. 1995;22:1702-7
13. Yu J, Wu WKK, Li X-XX. et al. Novel recurrently mutated genes and a prognostic mutation signature in colorectal cancer. Gut. 2014;64:1-10
14. Fujimoto A, Furuta M, Totoki Y. et al. Whole-genome mutational landscape and characterization of noncoding and structural mutations in liver cancer. Nat Genet. 2016;4:1-13
15. Fujimoto A, Totoki Y, Abe T. et al. Whole-genome sequencing of liver cancers identifies etiological influences on mutation patterns and recurrent mutations in chromatin regulators. Nat Genet. 2012;44:760-4
16. Lawrence MS, Stojanov P, Polak P. et al. Mutational heterogeneity in cancer and the search for new cancer-associated genes. Nature. 2013;499:214-218
17. Dees ND, Zhang Q, Kandoth C. et al. MuSiC: identifying mutational significance in cancer genomes. Genome Res. 2012;22:1589-1598
18. Ciriello G, Cerami E, Sander C, Schultz N. Mutual exclusivity analysis identifies oncogenic network modules. Genome Res. 2012;22:398-406
19. Zhao J, Zhang S, Wu L-Y, Zhang X-S. Efficient methods for identifying mutated driver pathways in cancer. Bioinformatics. 2012;28:2940-2947
20. Charles Nault J, Mallet M, Pilati C. et al. High frequency of telomerase reverse-transcriptase promoter somatic mutations in hepatocellular carcinoma and preneoplastic lesions. Nat Commun. 2013;4:2218-2238
21. Liao P, Wang W, Shen M. et al. A positive feedback loop between EBP2 and c-Myc regulates rDNA transcription, cell proliferation, and tumorigenesis. Cell Death Dis. 2014;5:1032-1040
22. Fan C, Tian Y, Miao Y. et al. ASAP3 expression in non-small cell lung cancer: association with cancer development and patients' clinical outcome. Tumor Biol. 2013;35:1489-1494
23. Sierko E, Wojtukiewicz MZ, Kisiel W. The role of tissue factor pathway inhibitor-2 in cancer biology. Semin Thromb Hemost. 2007;33:653-659
24. Mermel CH, Schumacher SE, Hill B. et al. GISTIC2.0 facilitates sensitive and confident localization of the targets of focal somatic copy-number alteration in human cancers. Genome Biol. 2011;12:41-49
25. Carter SL, Cibulskis K, Helman E. et al. Absolute quantification of somatic DNA alterations in human cancer. Nat Biotechnol. 2012;30:413-421
26. Uen Y-H, Fang C-L, Hseu Y-C. et al. VAV3 oncogene expression in colorectal cancer: clinical aspects and functional characterization. Sci Rep. 2015;5:9360-9368
27. Stein U, Walther W, Arlt F. et al. MACC1, a newly identified key regulator of HGF-MET signaling, predicts colon cancer metastasis. Nat Med. 2009;15:59-67
28. Brockm??ller SF, Bucher E, M??ller BM. et al. Integration of metabolomics and expression of glycerol-3-phosphate acyltransferase (GPAM) in breast cancer-link to patient survival, hormone receptor status, and metabolic profiling. J Proteome Res. 2012;11:850-860
29. Abbassi R, Johns TG, Kassiou M, Munoz L. DYRK1A in neurodegeneration and cancer: Molecular basis and clinical implications. Pharmacol Ther. 2015;151:87-98
30. Scholz B, Korn C, Wojtarowicz J. et al. Endothelial RSPO3 Controls Vascular Stability and Pruning through Non-canonical WNT/Ca(2+)/NFAT Signaling. Dev Cell. 2016;36:79-93
31. Zhang X, Zhang Z, Cheng J. et al. Transcription factor NFAT1 activates the mdm2 oncogene independent of p53. J Biol Chem. 2012;287:30468-30476
32. Lin KT, Gong J, Li CF. et al. Vav3-Rac1 signaling regulates prostate cancer metastasis with elevated Vav3 expression correlating with prostate cancer progression and posttreatment recurrence. Cancer Res. 2012;72:3000-3009
33. Horn S. TERT Promoter Mutations in Familial and Sporadic Melanoma. Science. 2007;12:1895-1900
34. Vinagre J, Almeida A, Pópulo H. et al. Frequency of TERT promoter mutations in human cancers. Nat Commun. 2013;4:2185-2196
35. Huang FW, Hodis E, Xu MJ. et al. Highly recurrent TERT promoter mutations in human melanoma. Science. 2013;339:957-9
36. Hilton JF, Shapiro GI. Aurora kinase inhibition as an anticancer strategy. J Clin Oncol. 2014;32:57-59
37. Liu X, Jian X, Boerwinkle E. dbNSFP v2.0: A database of human non-synonymous SNVs and their functional predictions and annotations. Hum Mutat. 2013;34:2393-2402
38. Klijn C, Durinck S, Stawiski EW. et al. A comprehensive transcriptional portrait of human cancer cell lines. Nat Biotechnol. 2014;33:306-312
39. Kandoth C, McLellan MD, Vandin F. et al. Mutational landscape and significance across 12 major cancer types. Nature. 2013;502:333-339
40. Tamborero D, Gonzalez-Perez A, Perez-Llamas C. et al. Comprehensive identification of mutational cancer driver genes across 12 tumor types. Sci Rep. 2013;3:2650-2658
41. Futreal PA, Coin L, Marshall M. et al. A census of human cancer genes. Nat Rev Cancer. 2004;4:177-183
42. Duquenne L, Huvet M, Chen C. et al. Impact of replication timing on non-CpG and CpG substitution rates in mammalian genomes. Genome Res. 2010;20:447-457
43. Alexandrov LBB, Nik-Zainal S, Wedge DCC. et al. Deciphering signatures of mutational processes operative in human cancer. Cell Rep. 2013;3:246-59