Theranostics
13.3
Impact Factor
- Current Issue
- Advance Articles
- Volume 16; 2026
- Volume 15; 2025
- Volume 14; 2024
- Volume 13; 2023
- Volume 12; 2022
- Archive
- Cover Images
- Cover Suggestion
- Special Issues
Top
Introduction
Methods
Results
Discussion
Abbreviations
Acknowledgements
Supplementary Material
References
Introduction
Methods
Results
Discussion
Abbreviations
Acknowledgements
Supplementary Material
References
International Journal of Biological Sciences
International Journal of Medical Sciences
 Global reach, higher impact

Theranostics 2018; 8(15):4129-4140. doi:10.7150/thno.26946 This issue Cite
Research Paper
Label-free imaging of hemoglobin degradation and hemosiderin formation in brain tissues with femtosecond pump-probe microscopy
Lili Zhang1‡, Xiang Zou2‡, Bohan Zhang1, Liyuan Cui3, Jiayi Zhang3, Ying Mao2, Liang Chen2 ![]() , Minbiao Ji1
, Minbiao Ji1 ![]()
1. State Key Laboratory of Surface Physics and Department of Physics, Collaborative Innovation Center of Genetics and Development, Key Laboratory of Micro and Nano Photonic Structures (Ministry of Education), Fudan University, Shanghai 200433, China
2. Department of Neurosurgery, Huashan Hospital, Fudan University, Shanghai 200040, China
3. State Key Laboratory of Medical Neurobiology, Institute of Bain Science, Department of Ophthalmology, Zhongshan Hospital, Fudan University, Shanghai 200032, China
‡These authors contributed equally to this work
Received 2018-4-27; Accepted 2018-6-15; Published 2018-7-16
Citation:
Zhang L, Zou X, Zhang B, Cui L, Zhang J, Mao Y, Chen L, Ji M. Label-free imaging of hemoglobin degradation and hemosiderin formation in brain tissues with femtosecond pump-probe microscopy. Theranostics 2018; 8(15):4129-4140. doi:10.7150/thno.26946. https://www.thno.org/v08p4129.htm
Other stylesAbstract

The degradation of hemoglobin in brain tissues results in the deposition of hemosiderin, which is a major form of iron-storage protein and closely related to neurological disorders such as epilepsy. Optical detection of hemosiderin is vitally important yet challenging for the understanding of disease mechanisms, as well as improving surgical resection of brain lesions. Here, we provide the first label-free microscopy study of sensitive hemosiderin detection in both an animal model and human brain tissues.
Methods: We applied spectrally and temporally resolved femtosecond pump-probe microscopy, including transient absorption (TA) and stimulated Raman scattering (SRS) techniques, to differentiate hemoglobin and hemosiderin in brain tissues. The label-free imaging results were compared with Perls' staining to evaluate our method for hemosiderin detection.
Results: Significant differences between hemoglobin and hemosiderin transient spectra were discovered. While a strong ground-state bleaching feature of hemoglobin appears in the near-infrared region, hemosiderin demonstrates pure excited-state absorption dynamics, which could be explained by our proposed kinetic model. Furthermore, simultaneous imaging of hemoglobin and hemosiderin can be rapidly achieved in both an intracerebral hemorrhage (ICH) rat model and human brain surgical specimens, with perfect correlation with Perls' staining.
Conclusion: Our results suggest that rapid, label-free detection of hemosiderin in brain tissues could be realized by femtosecond pump-probe microscopy. Our method holds great potential in providing a new tool for intraoperative detection of hemosiderin during brain surgeries.
Keywords: hemoglobin, hemosiderin, pump-probe microscopy, transient absorption, stimulated Raman scattering
Introduction
Iron is crucial for maintaining healthy functions of cells and organisms [1-3]. Most iron in the human body exists in various forms of hemoproteins, playing key roles in many critical biological processes. For instance, hemoglobin and myoglobin are responsible for oxygen transport and storage, whereas cytochromes serve as electron transfer molecules and enzymes [4]. When these hemoproteins are digested and degraded by phagocytes, their iron compositions are stored in two major forms of non-heme iron-protein complexes: soluble ferritin nanoparticles and insoluble hemosiderin deposits, playing further roles in iron recycling. Dysregulated iron homeostasis, either iron deficiency or overload, will lead to hematological, metabolic and neurodegenerative diseases. Iron overload results in the formation of toxic hemosiderin that leads to tissue damages in organs including liver and brain [5].
Particularly, brain hemosiderin deposition is an intractable clinical problem for neurosurgeons. Brain hemosiderin is mainly caused by intracerebral hemorrhage (ICH), which includes a series of diseases with high morbidity and mortality [6,7]. After the degradation of red blood cells in hematoma, hemosiderin formation often leads to progressive neurological deficits [8,9]. For instance, hemosiderin deposition in the white matter may cause white matter injury (WMI), which is a significant neuropathy of cerebrovascular diseases [10]. As myelin is vulnerable to oxidative stress induced by ischemic or hemorrhagic events, hemosiderin plays a critical role in WMI [7], acting as a catalytic agent to produce the superoxide radical by adding one electron to oxygen. Eventually, another electron is added to the superoxide, creating hydrogen peroxide, inducing a local oxidizing reaction in brain tissue [11]. When hemosiderin accumulates in the cerebral grey matter, it may become the cause for focal seizures. Post ICH epilepsy was estimated to occur in 4% to 16% of patients after hemorrhagic stroke [12-14]. Iron liberated from deposited hemosiderin mainly exists as ferric ion, which mediates the generation of hydroxyl radicals [15] and affects the oxidative stress level of cortical neurons [16,17], which is believed to contribute to epileptogenesis.
Brain cerebral cavernous malformations (CCM) is one of the intracranial hemorrhagic diseases that may cause acute and chronic ICH. Around 25% of symptomatic CCM patients present with the initial symptoms of epilepsy, which is associated with repeated bleeding [18,19]. Surgical resection of the lesions could prevent re-bleeding. However, 15.1-17.9% of patients still exhibit seizure persistence after operation [20-22]. Extensive resection of the hemosiderin fringe was found to effectively improve seizure control [23,24], indicating the importance of 'iron free' in eliminating seizures [25]. Although hemosiderin depositions can be detected by magnetic resonance imaging (MRI) prior to operations, and large amounts of aggregates could be visualized by the naked eye, it is difficult to see residual hemosiderin traces at the lesion margins during operations. Therefore, high-resolution imaging methods capable of real-time detection of hemosiderin are highly demanded for maximum lesion resection while preserving normal brain functions.
Despite previous studies of hemosiderin using electron microscopy, Mossbauer spectroscopy, extended X-ray absorption fine structure (EXAFS), and X-ray diffraction [26-28], optical researches of hemosiderin are extremely limited. All we have learned is that hemosiderin appears as brown granules in tissues under light microscopy, and could be stained with Perls' blue because of its ferric (Fe3+) composition [29]. In great contrast to the well-studied hemoproteins, most of the biophysical and biological properties of hemosiderin remain unknown, which may largely be due to the lack of technologies for in vivo detection of the iron-protein complex.
The photophysical properties of hemoproteins have been extensively studied using femtosecond pump-probe spectroscopy in the visible spectral range, revealing the ultrafast transient dynamics of photolysis (350 fs to several ps) and recombination (hundreds of ps) of heme-bound molecules, such as O2 and CO [30-32]. More recent developments of optical pump-probe-based microscopies harnessed the transient responses of different chemical components to differentiate them, extracting the information inaccessible by linear optical microscopies. Transient absorption (TA) microscopy has shown successes in imaging non-fluorescent chromophores, such as melanin [33,34], nanoparticles and nanocrystals [35-38], hemoglobin in red blood cells (RBCs) [39], and pigments in artistic work [40]. In addition, stimulated Raman scattering (SRS) microscopy is also technically a pump-probe method with unique capability to image biomolecules, such as lipids, proteins and DNAs, based on their distinct Raman signatures [41-43], and has demonstrated great potentials in intraoperative histology for neurosurgical procedures [44-46]. Thus, dual-modal TA/SRS microscopy may be applied to simultaneously image the non-fluorescent iron-complexes and brain tissues [47].
In this work, we comprehensively studied the ultrafast transient optical responses of hemoglobin and hemosiderin in the near infrared (NIR) window using temporally and spectrally resolved pump-probe microscopy. The NIR window is known to be most compatible with biological tissues for deeper penetration and less photodamage. We have found that hemoglobin demonstrates both ground state bleaching and excited state absorption, whereas the transient behavior of hemosiderin is dominated by excited state absorption. The underlying photophysical processes could be explained with our proposed kinetic model. We further took advantage of the TA differences of hemoglobin and hemosiderin to image them in a rat model and human brain tissues, demonstrating the potential application of pump-probe microscopy for intraoperative detection and precise removal of hemosiderin.
Methods
Sample preparation
Fresh human blood from volunteers' fingers was diluted with phosphate buffered saline (PBS, Hyclone), dropped on a glass slide and sealed with a cover glass for TA measurements. Human CCM tissues were used for TA measurements, either with thin sections of 10 µm thickness, or fresh tissues of 1 mm thickness sealed between two coverslips.
Linear absorption spectra
Fresh human blood samples were collected by removing the plasma supernatant after standing for four hours. The hemosiderin sample was homogenized from CCM tissues. Both samples were sealed in a cuvette with 1 mm thickness. Vis-NIR absorption spectra of as-made RBCs and hemosiderin samples were acquired using a UV-Vis-NIR spectrometer (Cary 6000i, Agilent, USA).
ICH rat model
Five male Sprague-Dawley (SD) rats weighing 200-250 g were used in the experiments. Rats were raised in a specific pathogen-free (SPF) room. Before operations, the rats were allowed to acclimate to the laboratory conditions. All animal experiments were approved by the Animal Care and Use Committee of Huashan Hospital, Fudan University. All the 5 rats received ICH modeling described below, and samples were collected 7 days after surgery.
Before surgical procedures, rats were intra-peritoneally injected with 1.5% pentobarbital sodium at a dose of 0.2 mL per 100 g. All surgical procedures were performed in accordance to standard sterile techniques. First, the right femoral artery was catheterized for blood sampling. The rats were then positioned in an automatic stereotactic frame, a 2 mm burr hole was drilled on the bregma 4.0 mm lateral to the midline. Next, autologous arterial blood was drawn from the femoral artery through a catheter. Then, rats received a 100 μL autologous arterial blood injection into the right basal ganglia through a microinjection syringe at a depth of 5 mm in 10 min. The needle was held for an additional 30 s to prevent reflux.
Cavernous malformations samples
All tissue collection from patients was approved by the Ethics Committee of Huashan Hospital, Fudan University, and informed consent was obtained from patients (KY2014-240). Paraffin-embedded and fresh CCM samples were retrospectively collected from 6 patients admitted to the hospital from January 2016 to May 2017. The CCM nidus was single and located in frontal or temporal lobe for each patient. Paraffin-embedded samples were cut into 10 μm slices for SRS scanning followed by Perls' Prussian blue staining.
Ultrafast pump-probe microscopy
In our pump-probe microscope setup, pulsed femtosecond laser beams from a commercial OPO (Optical Parametric Oscillator) laser (Insight DS+, Newport, CA) were used as the laser source. A fundamental 1040 nm laser was used as the pump beam, while the tunable OPO output (690-1300 nm) served as the probe beam. The intensity of the 1040 nm beam was modulated at 1/4 of the laser pulse repetition rate (f0 = 80 MHz) using a frequency divider and an electro-optical modulator (EOM). The two laser beams were combined through a dichroic mirror (DM), spatially and temporally overlapped, delivered into the laser-scanning microscope (FV 1200, Olympus) and focused onto the samples. The TA signals generated were optically filtered, detected by a back-biased photodiode (PD) and demodulated with a lock-in amplifier (LIA) (HF2LI, Zurich Instruments) to feed the analog input of the microscope to form images. TA dynamics could be acquired by scanning the optical delay line. The imaging speed used throughout the experiments was 2 µs per pixel, and each field-of-view contained 512 × 512 pixels. We used a 60× objective (Olympus, UPLSAPO 60XWIR, NA 1.2 water) for all cell imaging, with a lateral resolution of ~400 nm, and an axial resolution of ~2 µm. Pump and stokes laser powers of 20 mW for pump and 10 mW for probe pulses were used to image thick, fresh tissue sections. Pump and probe laser powers of 10 mW and 5 mW were used for RBCs imaging, and 5 mW for pump and 2.5 mW for probe were used for paraffin-embedded tissue sections. All images were taken in transmission mode.
Results
Optical transitions and pump-probe microscopy
The pump-probe microscopy used in this work involves several nonlinear optical processes, including TA and SRS, as illustrated in Figure 1A. TA measures the differential absorption of the probe beam induced by the pump excitation, and usually consists of three major optical transitions: ground state bleaching (GSB), excited-state absorption (ESA) and stimulated emission (SE) [48,49]. In our work, SE could be neglected since the pump photon energy was lower than that of the probe. In GSB process, the probe intensity is increased as a result of the pump excitation that depletes the ground state populations. Conversely, in ESA, the probe intensity is reduced because the pump excitation has generated more populations in the first excited state. The detection of these TA signals requires intensity modulation of the pump beam, and demodulation of the probe beam with a phase-sensitive lock-in amplifier. GSB and ESA could be identified by their sign differences as introduced above and illustrated in Figure S1. Scanning the time delays between the pump and probe pulses could generate the ultrafast relaxation dynamics of the photo-excited chromophores.
Figure 1
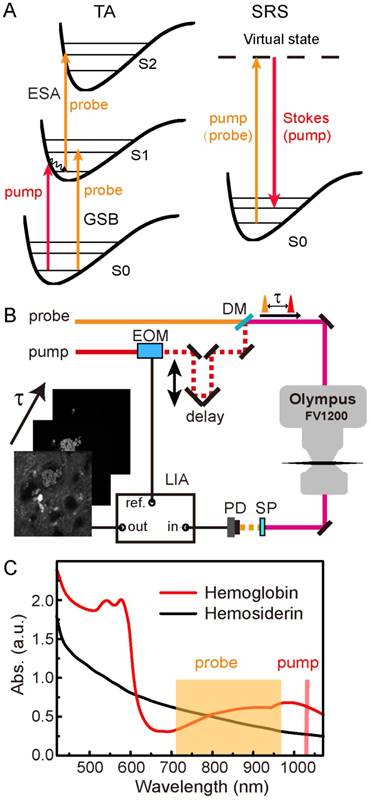
Schematics of the experimental design. (A) Optical transitions of TA and SRS processes. (B) Optical layout of the pump-probe microscope. (C) Linear absorption spectra of hemoglobin and hemosiderin. EOM: electro-optical modulator; DM: dichroic mirror; SP: short pass filter; PD: photodiode; LIA: lock-in amplifier.
SRS process may also occur if the energy difference between the pump and probe photons match the vibrational energy of the molecules (Figure 1A), and could be utilized for rapid label-free imaging of biomolecules [41,44]. Femtosecond SRS shares the same optical setup as TA microscopy, and both could be viewed as pump-probe microscopy since both of them use a modulation transfer technique to detect signals. In this work, the pump beam in the TA process serves as the Stokes beam for SRS, and the probe beam in the TA process serves as the pump beam for SRS (Figure 1A). Stimulated Raman loss (SRL) measures the reduction of the pump intensity induced by the Stokes excitation (Figure S1), and is used for SRS imaging. Although femtosecond SRS does not have sufficient spectral resolution to differentiate different biomolecules, we use the combination of TA/SRS to image both the iron-complexes and organic tissue architectures.
The optical setup of our femtosecond pump-probe microscope is illustrated in Figure 1B and described with details in Methods. We used the fundamental 1040 nm beam as the pump, and the tunable output beam (710-970 nm) as the probe. Differential absorbance of the probe beam with and without pump was measured as the TA signal (ΔA = -ΔI/I), and taken to form an image pixel-by-pixel as the focused laser beam is scanned across the sample. Image stacks were synchronized to the optical delay times (τ) between the pump and probe pulses, so that each image corresponds to a particular τ in the delay sequence. Linear absorption spectra of hemoglobin from human RBCs and hemosiderin from human CCM tissues are shown in Figure 1C. While the hemoglobin spectrum with typical absorption features around 540 nm and 900 nm indicate its partial oxygenation [50,51], the hemosiderin spectrum shows only monotonically decreased absorbance towards longer wavelengths. The spectral features of hemoglobin mainly originate from its porphyrin absorption and charge transfer in the heme group [52,53]. The absence of the Q bands in the hemosiderin spectrum indicates its non-heme nature. We found that although the linear absorption spectra of oxygenated and deoxygenated hemoglobin differ remarkably, their early-time transient behaviors in the NIR region are very similar (Figure S2) [39], hence we did not differentiate them in our current work.
Transient optical responses of hemoglobin and hemosiderin
We first studied the dependence of TA dynamics on the probe wavelengths. For hemoglobin in RBCs, we could see a transition from pure positive ESA signals at shorter probe wavelengths to negative GSB-dominated responses at longer probe wavelengths, as shown in the TA traces probed at 770, 880 and 950 nm. And, the sign flip of TA signals at 880 nm could be clearly seen in the TA images of RBCs at τ = 0 and 0.5 ps (Figure 2A). It is also noticed that the ESA component is short lived (~0.8 ps), which was also seen in previous works with shorter pump and probe wavelengths [39]. Conversely, the GSB component has a longer lifetime (~4.7 ps), a new feature that has never been reported before. In great contrast to hemoglobin, hemosiderin shows much weaker probe wavelength dependence, with ESA-dominated contributions as shown in Figure 2B. TA images of hemosiderin in CCM brain tissue sections at different time delays only show overall intensity changes without sign reversal. Most of the TA dynamics of hemosiderin contain a short lifetime of ~1.2 ps and a longer lifetime of ~6.4 ps. More detailed analysis of the transient dynamics will be shown later in this paper.
The sign differences between hemoglobin and hemosiderin TA signals could be utilized to distinguish them with proper settings of probe wavelength and time delay. As shown in Figure 2C, TA images at τ = 0.5 ps and probed with different wavelengths demonstrated distinct contrasts: at 770 nm, both hemoglobin and hemosiderin show ESA signal; at 880 nm, hemoglobin flips sign and becomes GSB (raw time-resolved images shown in Movie S1). Thus, the two components could be differentiated by their signs and false colored as red (GSB) and cyan (ESA). Additionally, at 950 nm, better contrast between hemoglobin and hemosiderin could be achieved. Usually, multi-component imaging would require multiple images taken with different parameters, such as wavelength or time delay, followed by decomposition algorithms. In our particular situation, we could use a single image to distinguish two spatially isolated chemical components by the opposite signs of their TA signals. Note that the overall TA intensity of hemosiderin is much stronger than that of hemoglobin in RBCs, which is due to the more condensed iron complex in hemosiderin deposits.
Figure 2
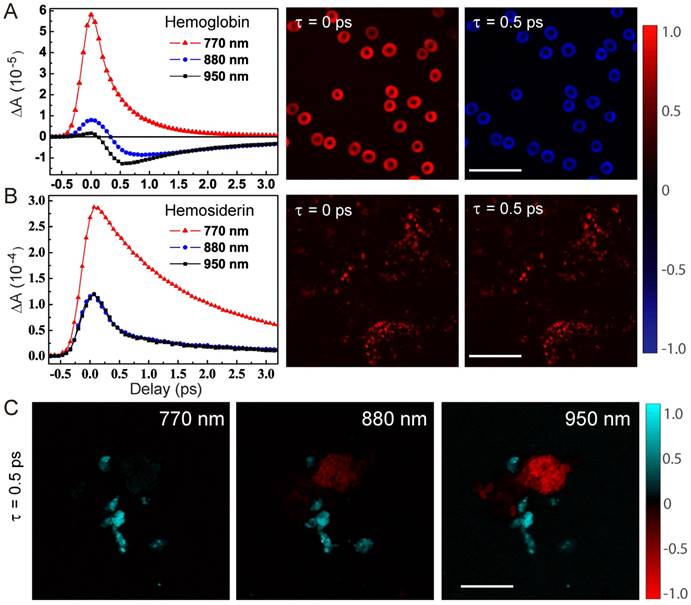
Characteristic transient optical responses of hemoglobin and hemosiderin. TA dynamics and images of hemoglobin (A) and hemosiderin (B), respectively. (C) TA images of a mixture of the two compounds at different probe wavelengths. Scale bar: 20 µm.
Figure 3
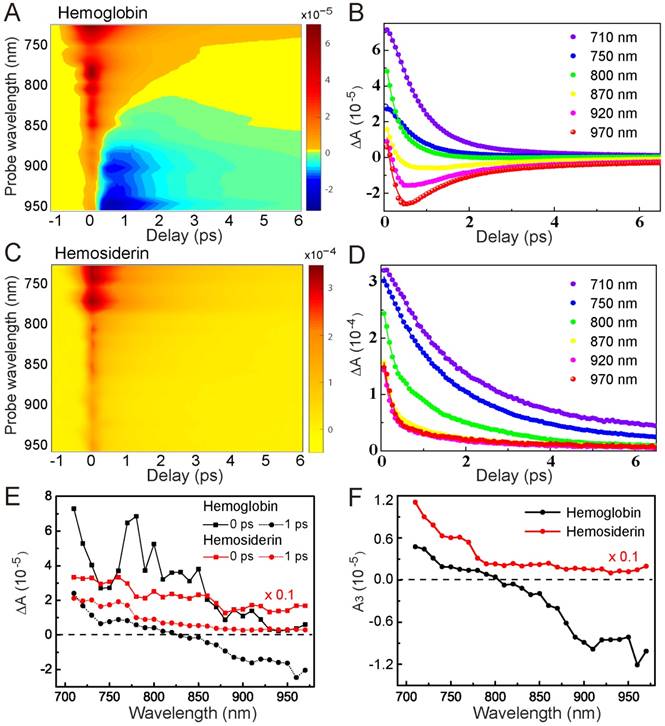
Spectrally and temporally resolved TA spectra of hemoglobin (A-B) and hemosiderin (C-D). Fitted curves are drawn as solid lines. (E) TA spectra taken at different time delays. (F) Extracted A3 component from equation (1) at various probe wavelengths.
Photophysics and kinetic modeling
To better characterize the TA behaviors of hemoglobin and hemosiderin, we took spectrally and temporally resolved TA spectra by tuning the probe wavelength from 710 nm to 970 nm with an interval of 10 nm. Such 2D spectra of hemoglobin and hemosiderin are shown in Figure 3, demonstrating the rich transient spectral information of the two iron complexes. For hemoglobin, we could clearly see the existence of a GSB component in the wavelength range longer than 800 nm, and a transition from ESA to GSB with increasing probe wavelength (Figure 3A-B). Conversely, for hemosiderin, only ESA-dominated features exist within our detection range (Figure 3C-D). These differences in wavelength dependence allow us to construct kinetic models to explain the transient dynamics of the two compounds.
Our proposed relaxation pathways are shown in Figure S3, based on which we could deduce the multi-exponential decay functions for the time-resolved signals (see Supplementary Material). The TA dynamics of both hemoglobin and hemosiderin could be fitted with tri-exponential functions:
(1)
Where τi represents the lifetime of each transient species, and Ai represents the corresponding amplitude of TA signal. We could see both compounds contain a very fast component (τ1 = 0.36 ps), which represents the ultrafast processes faster than our instrument response, including cross-phase modulation and rapid electron scattering. The second and third term with time constants of τ2 and τ3 may represent the lifetimes of the two intermediate excited states (Figure S3). Upon photoexcitation, the molecules quickly settled into the first excited state (1), followed by fast relaxation to a lower-level excited state (2) within a timescale of ~1ps. State (2) has a relatively longer lifetime of several picoseconds. Our measured TA signal was a mixture of GSB from the ground state, and ESA contributed from the two excited-state populations (Figure S3).
The major feature of hemoglobin is the competing process between GSB and ESA. As the probe photon energy decreases, the GSB contribution overwhelms ESA, which explains the TA spectral features of hemoglobin. In contrast, photoexcitation of hemosiderin does not result in GSB within our detection window, indicating a much narrower spectral hole burning compared with hemoglobin. TA spectra of the two compounds at different time delays are shown in Figure 3E, demonstrating their distinct transient spectral dynamics. It is worth mentioning that at τ = 0 ps, the TA spectrum of hemoglobin shows several peaks that may originate from SRS signal of proteins and water. We applied global fitting using our kinetic model for the 2D TA spectra, which agree well with experimental data (Figure S4). The fitted parameters are shown in Table 1, and individual TA curves with fitting results are shown in Figure 3B, D. Interestingly, our kinetic model clearly implies that the slow relaxation component (A3) is indeed a result of the two competing optical transitions (Figure S3). As supported by our experimental data (Figure 3F), A3 of hemoglobin has a clear transition from positive to negative at ~800 nm, whereas A3 of hemosiderin remained positive throughout the whole detection window.
Table 1
Fitting results of transient absorption dynamics with a tri-exponential decay function (Equation 1).
| λ (nm) | A1 (10-5) | A2 (10-5) | A3 (10-5) | τ1 (ps) | τ2 (ps) | τ3 (ps) | |
|---|---|---|---|---|---|---|---|
| Hemoglobin | 770 | 5.93 | 0.97 | 0.17 | 0.36 | 0.76 | 4.66 |
| 880 | 5.02 | -2.47 | -0.67 | ||||
| 950 | 7.49 | -5.43 | -0.83 | ||||
| Hemosiderin | 770 | 0.10 | 25.72 | 5.41 | 0.36 | 1.23 | 6.36 |
| 880 | 9.82 | 3.71 | 1.49 | ||||
| 950 | 9.71 | 3.48 | 1.22 |
Imaging hemoglobin degradation with a rat ICH model
Harnessing the drastic differences between hemoglobin and hemosiderin TA responses, we are able to distinguish them in biological tissues. The spectral and temporal information allow us to select the best-suited wavelength to perform multicolor TA/SRS imaging of hemoglobin, hemosiderin and brain tissues. We chose to probe at around 802 nm, where the SRS intensity of brain tissues reaches the maximum, and negligible slow decay component (A3) of hemoglobin could be seen (Figure 3F). Raw images of fresh ICH rat brain tissue taken at different time delays are shown in Figure 4A-C, and the composite three-color image in Figure 4D, showing the distributions of RBCs (red), hemosiderin (cyan) and brain tissues (green). The complete set of time-resolved images are shown in Movie S2, and the depth-resolved three-color images are shown in Movie S3. Decomposition of the three chemical components is based on their distinct transient optical responses (Figure 4E), followed by the linear algorithms used in multi-color SRS [54]. The TA curve of lipid merely reflects the cross-correlation of the pump and probe pulses (~0.35 ps). While hemoglobin decays within 2 ps, hemosiderin signal persists longer than 4 ps, as quantified in Table 1. Therefore, images taken at 0, 0.7 and 3 ps are appropriate for differentiating the three biochemical components. As mentioned above, our femtosecond SRS does not differentiate various biomolecules (such as lipids and proteins), hence the SRS channel only provides the overall tissue architecture, which is also important for visualizing normal brain structures during surgery.
We proceeded to image the coronal brain sections of an ICH rat model. The rats were sacrificed after one week of blood injection, and the brains were harvested for frozen sectioning (Figure 5A). The same brain sections of 20 μm thickness were first imaged with TA/SRS microscopy and then stained with Perls' blue. A three-color whole brain section image is shown in Figure 5B. Other than the normal brain architectures, aggregates of residual hemoglobin are clearly seen with surrounding deposits of hemosiderin scattered around the hematoma. This agrees with the hypothesis that phagocytosis by the peripheral microglial cells is involved in the degradation of hemoglobin and the formation of hemosiderin [55,56]. Only those RBCs diffused into the brain tissues could be captured by phagocytes and result in hemosiderin deposition, while the central parts of the blood clots kept the form of hemoglobin.
We further validated our method by comparing TA images of hemosiderin with Perls' blue staining. A TA image of the dashed region in Figure 5B and the corresponding white light image of the same section are shown in Figure 5C-D. Because normal brain sections appear transparent in Perls' stain, we only take the TA images of hemoglobin and hemosiderin for direct comparison. As we can see, both TA microscopy and Perls' blue staining are capable of mapping the distribution of hemoglobin and hemosiderin. The two methods generate well-correlated images, indicating their equivalence in hemosiderin detection. The minor discrepancies primarily originate from the slight morphological shifts induced by tissue processing, as well as the intrinsic thin optical sectioning of TA microscopy that generates different image planes from Perls' staining.
Figure 4
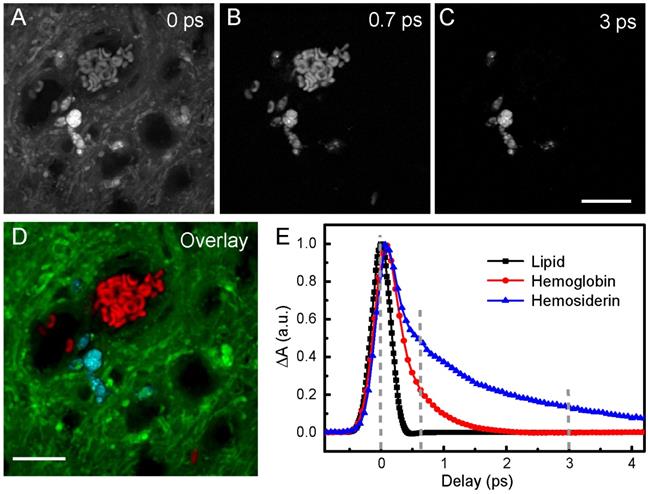
Imaging RBCs and hemosiderin in rat brain tissue at 802 nm probe wavelength. (A-C) Pump-probe images taken at different time delays. (D) Composite image showing the distribution of hemoglobin (red), hemosiderin (cyan) and brain tissues (green), using linear recombination of the data in (A-C). (E) TA curves of hemoglobin, hemosiderin and lipid. Lipid response reflects the cross-correlation between femtosecond pump and probe pulse. Scale bar: 20 µm.
Hemosiderin detection in human brain tissues
To evaluate our method for human brain tissue imaging, we performed TA microscopy of brain tissues from CCM patients. We first imaged paraffin-embedded sections removed from CCM patients with label-free TA microscopy, followed by Perls' staining on the same tissue section to generate one-to-one correlated images, as shown in Figure 6A-B. The results demonstrate almost identical distributions of hemosiderin detected by the two methods, indicating TA microscopy is a sensitive tool to detect hemosiderin in human brain tissues. As can be seen, hemosiderin is mainly located in the interstitial space between enlarged capillary vessels, which is a typical feature of CCM. Paraffin-embedded tissue sections are usually not suited for SRS imaging, since paraffin itself could generate strong SRS signal. Here we only use SRS to image the tissue morphology for the purpose of co-registration.
We finally conducted TA imaging of fresh human CCM brain tissues to evaluate the possibility of rapid, label-free detection of hemosiderin in surgical specimens. MRI of a left frontal CCM showed hemosiderin deposition around the lesion, featured with a hypo-intense ring on T2 sequence (Figure 6C). The fresh tissues were taken from the edges of the lesion, which was the gross margin between CCM and normal brain, as illustrated in Figure 6D. Freshly resected tissues were sealed in glass slides and imaged without any further processing. At the resection margin, various sporadic hemosiderin could be readily seen in the brain tissues, mainly deposited outside the vessel lumen, as shown in Figure 6E. Note that all the human tissues we have imaged showed little sign of residual hemoglobin, which reflects the efficient formation of hemosiderin in human brains. In the tissues further away from the resection margin, much fewer but detectable hemosiderin deposits could be visualized (Figure 6F). These indicate the potential of our method for the sensitive detection of hemosiderin at lesion boundaries, even where the tissues appear grossly normal by the naked eye (Figure 6D). With the developments of handheld and miniaturized imaging devices, it is promising that pump-probe microscopy will achieve in vivo hemosiderin detection during operations.
Figure 5
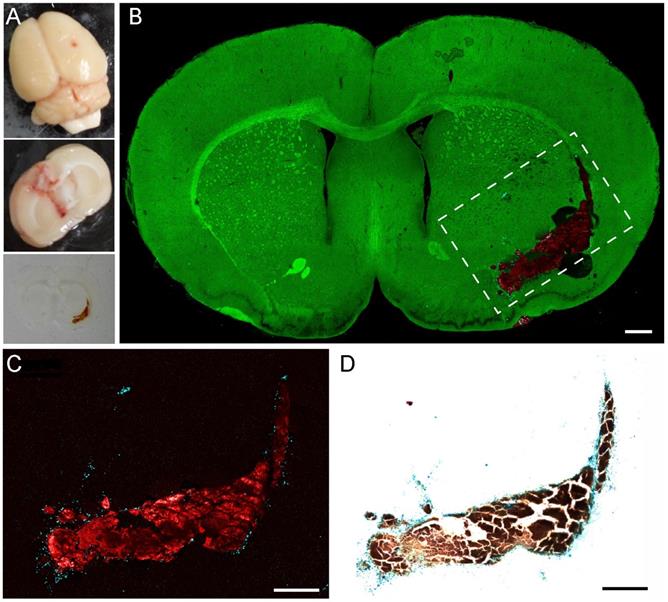
Validation of pump-probe microscopy in brain tissues of a rat ICH model. (A) Bright-field images of the whole fresh section and thin frozen section of an ICH rat brain. (B) TA/SRS image of a typical coronal brain section, mapping hemoglobin (red), hemosiderin (cyan) and brain tissues (green). (C) Zoomed-in region of (B) with the contrast of hemoglobin and hemosiderin only. (D) Perls' staining of the same tissue section in (C). Scale bar: 500 µm.
Discussion
Pump-probe microscopy could provide multi-dimensional information of light-absorbing molecules, including characterizations in the temporal, spectral and spatial domains. Blood supply is very abundant in the brain, which tends to cause massive bleeding during neurosurgeries. Hence, it is necessary to distinguish hemosiderin and hemoglobin, especially for their similar visual appearances by the naked eye. Our results show that the transient optical response of the two iron-protein complexes differs significantly, which could be used to effectively distinguish them in brain tissues. Hemosiderin deposits were observed mainly located around the hematoma in an ICH rat model. Conversely, in the human CCM tissue, hemosiderin deposited mostly outside the vessel lumen, which is consistent with the clinical feature of repeated ICH.
The intrinsic optical sectioning capability of pump-probe microscopy allows three-dimensional imaging of tissue architectures, although the imaging depth is usually limited to 200 µm. Coupled with surgical procedures, intraoperative imaging of resection cavities might be possible, as has been demonstrated for coherent Raman imaging in live animals, using either a normal microscope [44], an exoscope [57,58], or handheld devices [59]. Rigorous evaluation of pump-probe microscopy for clinical translation will require more experimental data to analysis the efficacy in imaging human brain tissues. Nonetheless, here we demonstrated the first ex vivo human data and the feasibility of detecting hemosiderin deposition in human brain tissues.
Although our results reveal the transient spectral features of hemoglobin in the NIR region, much work has to be continued to fully capture the fundamental photophysical processes of this long-studied hemoprotein. For instance, whether the excitation involves metal-to-ligand charge transfer, or the photo-dissociation of oxygen, and whether the excited state dynamics involve transitions between different spin states [31,60]. Both TA microscopy and Perls' staining could provide the distribution of hemosiderin, yet the staining method is limited by complex tissue processing procedures, which is incompatible with in vivo applications. Conversely, the label-free nature of pump-probe microscopy provides the possibility for real-time intraoperative detection of hemosiderin. With rich spectral domain information, our method holds promise for learning the metabolic process of hemoglobin degradation following phagocytosis. Moreover, pump-probe microscopy may also be applied to detect other iron-containing metabolic products such as ferritin, and provide unique opportunities in studying iron metabolism.
Figure 6
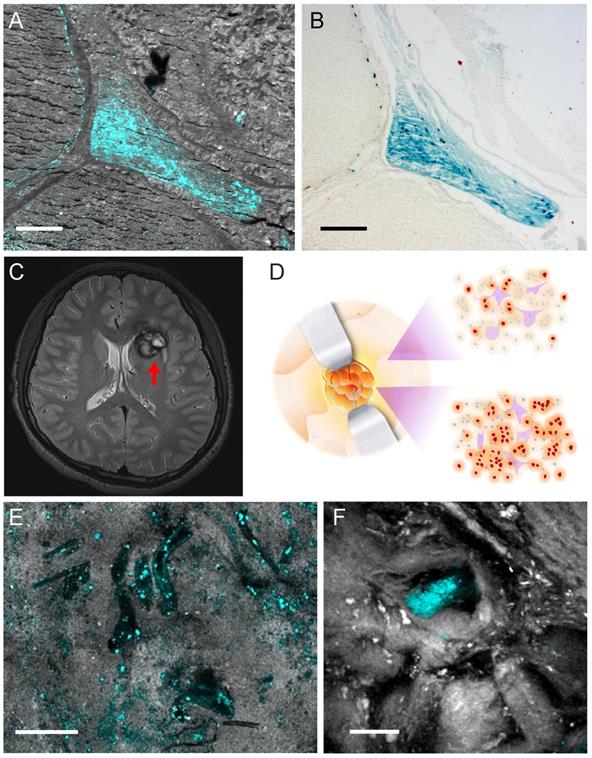
Hemosiderin detection in human CCM tissues. (A) TA/SRS image and (B) Perls' staining of the same CCM paraffin section. (C) MRI scan of a left frontal CCM with a hypo-intense ring (red arrow) on T2 sequence, resulted from hemosiderin deposition. (D) Illustration of differences in hemosiderin deposition of CCM lesion. Gross margins may still contain hemosiderin (brown dots). (E) TA/SRS image of the resected fresh CCM lesion margin, showing the vessel lumen-like space in the brain tissue. (F) Resected tissue farther away from the lesion with much fewer hemosiderin deposits. Cyan: hemosiderin; gray: brain tissues. Scale bar: 30 µm.
In summary, we have systematically studied the transient optical responses of hemoglobin and hemosiderin with decent spectral and temporal resolutions. Our results revealed the existence of a ground-state bleaching signature in hemoglobin, which is absent in hemosiderin. The dynamic and spectral differences of the two iron-complexes not only reflect their distinct electronic structures, but also provide label-free means to differentiate them, in both an ICH rat model and human CCM brain tissues. The capability of pump-probe microscopy for the sensitive detection of hemosiderin may provide unique opportunities in both fundamental research of iron metabolism, and biomedical applications in rapid intraoperative imaging during brain surgery.
Abbreviations
Abs: absorbance; AU: arbitrary unit; CCM: cerebral cavernous malformations; DM: dichroic mirror; EOM: electro-optical modulator; ESA: excited state absorption; EXAFS: extended X-ray absorption fine structure; GSB: ground state bleaching; ICH: intracerebral hemorrhage; LIA: lock-in amplifier; NIR: near infrared; OPO: optical parametric oscillator; PBS: phosphate buffered saline; PD: photodiode; RBC: red blood cell; SP: short pass filter; SRS: stimulated Raman scattering; TA: transient absorption; WMI: white matter injury.
Acknowledgements
We thank the financial support from the National Key R&D Program of China (2016YFC0102100, 2016YFA0301000, 2011BAI08B06); National Natural Science Foundation of China (81671725, 81571102 and 81601706); Shanghai Action Plan for Scientific and Technological Innovation program (16441909200, 15441904500); Shanghai Municipal Science and Technology Major Project (2017SHZDZX01); Key Medical Program of Shanghai Science and Technology Committee (15441904500); National Basic Research Program of China 973 Program (2015CB755500); Shanghai Sailing Program (16YF1415500); Development Fund for Shanghai Talents (201564) and Medico-engineering Cooperation Fund of Fudan University.
Supplementary Material
Supplementary figures and movie legends.
Supplementary movie 1.
Supplementary movie 2.
Supplementary movie 3.
Competing Interests
The authors have declared that no competing interest exists.
References
1. Hentze MW, Muckenthaler MU, Andrews NC. Balancing acts: molecular control of mammalian iron metabolism. Cell. 2004;117:285-297
2. Crichton RR, Charloteaux-Wauters M. Iron transport and storage. Eur J Biochem. 1987;164:485-506
3. Aisen P, Listowsky I. Iron transport and storage proteins. Annu Rev Biochem. 1980;49:357-393
4. Lawen A, Lane DJ. Mammalian iron homeostasis in health and disease: uptake, storage, transport, and molecular mechanisms of action. Antioxid Redox Sig. 2013;18:2473-2507
5. Weir MP, Gibson JF, Peters TJ. Haemosiderin and tissue damage. Cell Biochem Funct. 1984;2:186-194
6. Qureshi AI, Mendelow AD, Hanley DF. Intracerebral haemorrhage. Lancet. 2009;373:1632-1644
7. Keep RF, Hua Y, Xi G. Intracerebral haemorrhage: mechanisms of injury and therapeutic targets. Lancet Neurol. 2012;11:720-731
8. Xi G, Keep RF, Hoff JT. Mechanisms of brain injury after intracerebral haemorrhage. Lancet Neurol. 2006;5:53-63
9. Xi G, Strahle J, Hua Y, Keep RF. Progress in translational research on intracerebral hemorrhage: is there an end in sight? Prog Neurobiol. 2014;115:45-63
10. Lo EH, Dalkara T, Moskowitz MA. Mechanisms, challenges and opportunities in stroke. Nat Rev Neurosci. 2003;4:399-415
11. Liochev SI, Fridovich I. The role of O2.- in the production of HO.: in vitro and in vivo. Free Radical Bio Med. 1994;16:29-33
12. Conrad J, Pawlowski M, Dogan M, Kovac S, Ritter MA, Evers S. Seizures after cerebrovascular events: risk factors and clinical features. Seizure. 2013;22:275-282
13. Giroud M, Gras P, Fayolle H, Andre N, Soichot P, Dumas R. Early seizures after acute stroke: a study of 1,640 cases. Epilepsia. 1994;35:959-964
14. Passero S, Rocchi R, Rossi S, Ulivelli M, Vatti G. Seizures after spontaneous supratentorial intracerebral hemorrhage. Epilepsia. 2002;43:1175-1180
15. Yokoi I, Toma J, Liu J, Kabuto H, Mori A. Adenosines scavenged hydroxyl radicals and prevented posttraumatic epilepsy. Free Radical Bio Med. 1995;19:473-479
16. Willmore LJ, Rubin JJ. Antiperoxidant pretreatment and iron-induced epileptiform discharges in the rat: EEG and histopathologic studies. Neurology. 1981;31:63-69
17. Willmore LJ, Triggs WJ, Gray JD. The role of iron-induced hippocampal peroxidation in acute epileptogenesis. Brain Res. 1986;382:422-426
18. Gross BA, Du R. Cerebral cavernous malformations: natural history and clinical management. Expert Rev Neurother. 2015;15:771-777
19. Josephson CB, Leach JP, Duncan R, Roberts RC, Counsell CE, Al-Shahi Salman R. et al. Seizure risk from cavernous or arteriovenous malformations: prospective population-based study. Neurology. 2011;76:1548-1554
20. Stavrou I, Baumgartner C, Frischer JM, Trattnig S, Knosp E. Long-term seizure control after resection of supratentorial cavernomas: a retrospective single-center study in 53 patients. Neurosurgery. 2008;63:888-896 discussion 897
21. Yeon JY, Kim JS, Choi SJ, Seo DW, Hong SB, Hong SC. Supratentorial cavernous angiomas presenting with seizures: surgical outcomes in 60 consecutive patients. Seizure. 2009;18:14-20
22. Kwon CS, Sheth SA, Walcott BP, Neal J, Eskandar EN, Ogilvy CS. Long-term seizure outcomes following resection of supratentorial cavernous malformations. Clin Neurol Neurosur. 2013;115:2377-2381
23. Baumann CR, Schuknecht B, Lo Russo G, Cossu M, Citterio A, Andermann F. et al. Seizure outcome after resection of cavernous malformations is better when surrounding hemosiderin-stained brain also is removed. Epilepsia. 2006;47:563-566
24. Wang X, Tao Z, You C, Li Q, Liu Y. Extended resection of hemosiderin fringe is better for seizure outcome: a study in patients with cavernous malformation associated with refractory epilepsy. Neurol India. 2013;61:288-292
25. Kim W, Stramotas S, Choy W, Dye J, Nagasawa D, Yang I. Prognostic factors for post-operative seizure outcomes after cavernous malformation treatment. J Clin Neurosci. 2011;18:877-880
26. Weir MP, Sharp GA, Peters TJ. Electron microscopic studies of human haemosiderin and ferritin. J Clin Pathol. 1985;38:915-918
27. Ward RJ, Legssyer R, Henry C, Crichton RR. Does the haemosiderin iron core determine its potential for chelation and the development of iron-induced tissue damage? J Inorg Biochem. 2000;79:311-317
28. Mann S, Wade VJ, Dickson DP, Reid NM, Ward RJ, O'Connell M. et al. Structural specificity of haemosiderin iron cores in iron-overload diseases. FEBS lett. 1988;234:69-72
29. Perls M. Nachweis von eisonoxyde in pigmenten. Virchows Arch Pathol Anat Physiol Klin Med. 1867;39:42-48
30. Martin JL, Migus A, Poyart C, Lecarpentier Y, Astier R, Antonetti A. Femtosecond photolysis of CO-ligated protoheme and hemoproteins: appearance of deoxy species with a 350-fsec time constant. P Natl Acad Sci USA. 1983;80:173-177
31. Chernoff DA, Hochstrasser RM, Steele AW. Geminate recombination of O-2 and hemoglobin. P Natl Acad Sci USA. 1980;77:5606-5610
32. Reynolds AH, Rand SD, Rentzepis PM. Mechanisms for excited-state relaxation and dissociation of oxymyoglobin and carboxymyoglobin. P Natl Acad Sci-Biol. 1981;78:2292-2296
33. Matthews TE, Piletic IR, Selim MA, Simpson MJ, Warren WS. Pump-probe imaging differentiates melanoma from melanocytic nevi. Sci Transl Med. 2011;3:71ra15
34. Wang H, Osseiran S, Igras V, Nichols AJ, Roider EM, Pruessner J. et al. In vivo coherent Raman imaging of the melanomagenesis-associated pigment pheomelanin. Sci Rep. 2016;6:37986
35. Miao X, Xuan N, Liu Q, Wu W, Liu H, Sun Z. et al. Optimizing nonlinear optical visibility of two-dimensional materials. ACS Appl Mater Inter. 2017;9:34448-34455
36. Tong L, Liu Y, Dolash BD, Jung Y, Slipchenko MN, Bergstrom DE. et al. Label-free imaging of semiconducting and metallic carbon nanotubes in cells and mice using transient absorption microscopy. Nat Nanotechnol. 2012;7:56-61
37. Xu Y, Liu Q, He R, Miao X, Ji M. Imaging laser-triggered drug release from gold nanocages with transient absorption lifetime microscopy. ACS Appl Mater Inter. 2017;9:19653-19661
38. Miao X, Zhang G, Wang F, Yan H, Ji M. Layer-dependent ultrafast carrier and coherent phonon dynamics in black phosphorus. Nano Lett. 2018;18:3053-3059
39. Fu D, Ye T, Matthews TE, Chen BJ, Yurtserver G, Warren WS. High-resolution in vivo imaging of blood vessels without labeling. Opt Lett. 2007;32:2641-2643
40. Villafana TE, Brown WP, Delaney JK, Palmer M, Warren WS, Fischer MC. Femtosecond pump-probe microscopy generates virtual cross-sections in historic artwork. P Natl Acad Sci USA. 2014;111:1708-1713
41. Freudiger CW, Min W, Saar BG, Lu S, Holtom GR, He C. et al. Label-free biomedical imaging with high sensitivity by stimulated Raman scattering microscopy. Science. 2008;322:1857-1861
42. He R, Xu Y, Zhang L, Ma S, Wang X, Ye D. et al. Dual-phase stimulated Raman scattering microscopy for real-time two-color imaging. Optica. 2017;4:44-47
43. He R, Liu Z, Xu Y, Huang W, Ma H, Ji M. Stimulated Raman scattering microscopy and spectroscopy with a rapid scanning optical delay line. Opt Lett. 2017;42:659-662
44. Ji M, Orringer DA, Freudiger CW, Ramkissoon S, Liu XH, Lau D. et al. Rapid, Label-free detection of brain tumors with stimulated Raman scattering microscopy. Sci Transl Med. 2013;5:201ra119
45. Ji M, Lewis S, Camelo-Piragua S, Ramkissoon SH, Snuderl M, Venneti S. et al. Detection of human brain tumor infiltration with quantitative stimulated Raman scattering microscopy. Sci Transl Med. 2015;7:309ra163
46. Orringer DA, Pandian B, Niknafs YS, Hollon TC, Boyle J, Lewis S. et al. Rapid intraoperative histology of unprocessed surgical specimens via fibre-laser-based stimulated Raman scattering microscopy. Nat Biomed Eng. 2017;1:0027
47. Zhang L, Shen S, Liu Z, Ji M. Label-Free, Quantitative imaging of MoS2-nanosheets in live cells with simultaneous stimulated Raman scattering and transient absorption microscopy. Adv Biosys. 2017;1:1700013-1700020
48. Min W, Freudiger CW, Lu S, Xie XS. Coherent nonlinear optical imaging: beyond fluorescence microscopy. Annu Rev Phys Chem. 2011;62:507-530
49. Chong S, Min W, Xie XS. Ground-State Depletion Microscopy: Detection sensitivity of single-molecule optical absorption at room temperature. J Phys Chem Lett. 2010;1:3316-3322
50. Roggan A, Friebel M, Do Rschel K, Hahn A, Mu Ller G. Optical properties of circulating human blood in the wavelength range 400-2500 nm. J Biomed Opt. 1999;4:36-46
51. Kuenstner JT, Norris KH. Spectrophotometry of human hemoglobin in the near infrared region from 1000 to 2500 nm. J Near Infrared Spec. 1994;2:59-65
52. Eaton WA, Hanson LK, Stephens PJ, Sutherland JC, Dunn JBR. Optical-spectra of oxy-hemoglobin and deoxyhemoglobin. J Am Chem Soc. 1978;100:4991-5003
53. Franzen S, Wallace-Williams SE, Shreve AP. Heme charge-transfer band III is vibronically coupled to the soret band. J Am Chem Soc. 2002;124:7146-7155
54. Lu FK, Basu S, Igras V, Hoang MP, Ji M, Fu D. et al. Label-free DNA imaging in vivo with stimulated Raman scattering microscopy. P Natl Acad Sci USA. 2015;112:11624-11629
55. Zhao XR, Sun GH, Zhang J, Strong R, Song WT, Gonzales N. et al. Hematoma resolution as a target for intracerebral hemorrhage treatment: Role for peroxisome proliferator-activated receptor gamma in microglia/macrophages. Ann Neurol. 2007;61:352-362
56. Wang J, Dore S. Heme oxygenase-1 exacerbates early brain injury after intracerebral haemorrhage. Brain. 2007;130:1643-1652
57. Shi Y, Zhang D, Huff TB, Wang X, Shi R, Xu XM. et al. Longitudinal in vivo coherent anti-Stokes Raman scattering imaging of demyelination and remyelination in injured spinal cord. J Biomed Opt. 2011;16:106012
58. Smith B, Naji M, Murugkar S, Alarcon E, Brideau C, Stys P. et al. Portable, miniaturized, fibre delivered, multimodal CARS exoscope. Opt Express. 2013;21:17161-17175
59. Liao C-S, Wang P, Huang CY, Lin P, Eakins G, Bentley RT. et al. In vivo and in situ spectroscopic imaging by a handheld stimulated Raman scattering microscope. ACS Photonics. 2018;5:947-954
60. Zhang W, Ji M, Sun Z, Gaffney KJ. Dynamics of solvent-mediated electron localization in electronically excited hexacyanoferrate(III). J Am Chem Soc. 2012;134:2581-2588
Author contact
![]() Corresponding authors: chenlianghscom, minbiaojedu.cn
Corresponding authors: chenlianghscom, minbiaojedu.cn
Citation styles
APA
Zhang, L., Zou, X., Zhang, B., Cui, L., Zhang, J., Mao, Y., Chen, L., Ji, M. (2018). Label-free imaging of hemoglobin degradation and hemosiderin formation in brain tissues with femtosecond pump-probe microscopy. Theranostics, 8(15), 4129-4140. https://doi.org/10.7150/thno.26946.
ACS
Zhang, L.; Zou, X.; Zhang, B.; Cui, L.; Zhang, J.; Mao, Y.; Chen, L.; Ji, M. Label-free imaging of hemoglobin degradation and hemosiderin formation in brain tissues with femtosecond pump-probe microscopy. Theranostics 2018, 8 (15), 4129-4140. DOI: 10.7150/thno.26946.
NLM
Zhang L, Zou X, Zhang B, Cui L, Zhang J, Mao Y, Chen L, Ji M. Label-free imaging of hemoglobin degradation and hemosiderin formation in brain tissues with femtosecond pump-probe microscopy. Theranostics 2018; 8(15):4129-4140. doi:10.7150/thno.26946. https://www.thno.org/v08p4129.htm
CSE
Zhang L, Zou X, Zhang B, Cui L, Zhang J, Mao Y, Chen L, Ji M. 2018. Label-free imaging of hemoglobin degradation and hemosiderin formation in brain tissues with femtosecond pump-probe microscopy. Theranostics. 8(15):4129-4140.
This is an open access article distributed under the terms of the Creative Commons Attribution (CC BY-NC) license (https://creativecommons.org/licenses/by-nc/4.0/). See http://ivyspring.com/terms for full terms and conditions.