Theranostics
13.3
Impact Factor
- Current Issue
- Advance Articles
- Volume 16; 2026
- Volume 15; 2025
- Volume 14; 2024
- Volume 13; 2023
- Volume 12; 2022
- Archive
- Cover Images
- Cover Suggestion
- Special Issues
Top
Introduction
Methods
Results
Discussion
Future perspectives
Abbreviations
Supplementary Material
Acknowledgements
References
Introduction
Methods
Results
Discussion
Future perspectives
Abbreviations
Supplementary Material
Acknowledgements
References
International Journal of Biological Sciences
International Journal of Medical Sciences
 Global reach, higher impact

Theranostics 2018; 8(16):4477-4490. doi:10.7150/thno.26249 This issue Cite
Research Paper
Integration of magnetic resonance imaging and protein and metabolite CSF measurements to enable early diagnosis of secondary progressive multiple sclerosis
Stephanie Herman1,2, Payam Emami Khoonsari1, Andreas Tolf3, Julia Steinmetz4, Henrik Zetterberg5,6,7,8, Torbjörn Åkerfeldt1, Per-Johan Jakobsson4, Anders Larsson1, Ola Spjuth2, Joachim Burman3, Kim Kultima1 ![]()
1. Department of Medical Sciences, Clinical Chemistry, Uppsala University, Sweden
2. Department of Pharmaceutical Biosciences, Uppsala University, Sweden
3. Department of Neuroscience, Uppsala University, Sweden
4. Unit of Rheumatology, Department of Medicine, Karolinska Institutet, Stockholm, Sweden
5. Department of Psychiatry and Neurochemistry, the Sahlgrenska Academy at the University of Gothenburg, Mölndal, Sweden
6. Clinical Neurochemistry Laboratory, Sahlgrenska University Hospital, Mölndal, Sweden
7. UCL Institute of Neurology, Queen Square, London, United Kingdom
8. UK Dementia Research Institute at UCL, London, United Kingdom
Received 2018-3-23; Accepted 2018-6-25; Published 2018-8-7
Citation:
Herman S, Khoonsari PE, Tolf A, Steinmetz J, Zetterberg H, Åkerfeldt T, Jakobsson PJ, Larsson A, Spjuth O, Burman J, Kultima K. Integration of magnetic resonance imaging and protein and metabolite CSF measurements to enable early diagnosis of secondary progressive multiple sclerosis. Theranostics 2018; 8(16):4477-4490. doi:10.7150/thno.26249. https://www.thno.org/v08p4477.htm
Other stylesAbstract

Molecular networks in neurological diseases are complex. Despite this fact, contemporary biomarkers are in most cases interpreted in isolation, leading to a significant loss of information and power. We present an analytical approach to scrutinize and combine information from biomarkers originating from multiple sources with the aim of discovering a condensed set of biomarkers that in combination could distinguish the progressive degenerative phenotype of multiple sclerosis (SPMS) from the relapsing-remitting phenotype (RRMS).
Methods: Clinical and magnetic resonance imaging (MRI) data were integrated with data from protein and metabolite measurements of cerebrospinal fluid, and a method was developed to sift through all the variables to establish a small set of highly informative measurements. This prospective study included 16 SPMS patients, 30 RRMS patients and 10 controls. Protein concentrations were quantitated with multiplexed fluorescent bead-based immunoassays and ELISA. The metabolome was recorded using liquid chromatography-mass spectrometry. Clinical follow-up data of the SPMS patients were used to assess disease progression and development of disability.
Results: Eleven variables were in combination able to distinguish SPMS from RRMS patients with high confidence superior to any single measurement. The identified variables consisted of three MRI variables: the size of the spinal cord and the third ventricle and the total number of T1 hypointense lesions; six proteins: galectin-9, monocyte chemoattractant protein-1 (MCP-1), transforming growth factor alpha (TGF-α), tumor necrosis factor alpha (TNF-α), soluble CD40L (sCD40L) and platelet-derived growth factor AA (PDGF-AA); and two metabolites: 20β-dihydrocortisol (20β-DHF) and indolepyruvate.
The proteins myelin basic protein (MBP) and macrophage-derived chemokine (MDC), as well as the metabolites 20β-DHF and 5,6-dihydroxyprostaglandin F1a (5,6-DH-PGF1), were identified as potential biomarkers of disability progression.
Conclusion: Our study demonstrates, in a limited but well-defined and data-rich cohort, the importance and value of combining multiple biomarkers to aid diagnostics and track disease progression.
Keywords: data integration, multiple sclerosis, disease progression, metabolomics, biomarker
Introduction
Traditionally, a biomarker is viewed as a characteristic that is objectively measured (e.g., a biological substance) and may affect interpretation or prediction of the incidence or outcome of disease [1,2]. In contrast, the molecular events in e.g., neurological diseases, are often complex, emphasizing that no single marker or source of information alone can reflect the full pathology. Recent advances in modern technologies have enabled comprehensive measurements at molecular and cellular levels, utilizing different biological specimens, tissues and radiological assessments. Considering the complexity of pathological events, integrating information from multiple sources can therefore result in a more refined tool for diagnostic and prognostic purposes. This concept is known as multianalyte assays with algorithmic analyses (MAAAs). Yet, the use of algorithm-based analyses in the clinic is very limited. A recent successful example of an MAAA is the improved test for prostate cancer [3].
Multiple sclerosis (MS) is an immune-mediated neurological disease that exists in two distinct phenotypes. At onset, the most common is relapsing-remitting MS (RRMS) in which focal inflammation in the central nervous system (CNS) appears over time, giving rise to clinical relapses, followed by a complete or partial recovery. Eventually, most RRMS patients will develop a progressively degenerative phenotype (secondary progressive MS, SPMS) with neurodegeneration, brain atrophy and accumulation of disability. The onset of SPMS is detected by continuous disability accumulation, monitored through the expanded disability status scale (EDSS) score and the presence of steady neurodegeneration in the CNS, monitored with magnetic resonance imaging (MRI). Consequently, the diagnosis of SPMS will be made retrospectively, potentially years after the shift has occurred. Once a patient has transitioned, there are currently no sufficient methods to treat or predict the disease progression [4].
In MS, the measurements of a broad range of proteins (proteomics) and low-weight intermediates (metabolomics) have, in combination with advanced multivariate methods, shown great promise in distinguishing MS and controls and to some extent the different subtypes of MS [5-10]. However, the high-dimensional nature of omics measurements makes them often impractical to implement in clinical practice.
To overcome this limitation, we developed an integrative analysis approach to acquire a small set of highly informative variables that can be used in combination to identify patients developing SPMS. Utilizing clinical, radiological and protein and metabolite measurements in cerebrospinal fluid (CSF), we also aimed at identifying a number of variables that associate with a worse prognosis for SPMS patients. These variables may prove to be of value for monitoring future therapeutic interventions in treatment of SPMS patients.
Methods
Ethics approval
All participants provided written informed consent, and the study was approved by the Regional Ethical Board of Uppsala (DNr 2008/182).
Subjects
The study cohort consisted of 56 subjects: 30 were diagnosed with RRMS, 16 with SPMS, and 10 were controls with other, non-inflammatory, neurological diseases (e.g., idiopathic intracranial hypertension or thunderclap headache). All MS patients met the revised McDonald's criteria for MS diagnosis [11]. Seventeen of the RRMS and two of the SPMS patients were inflammatory active with presence of gadolinium (Gd)-enhancing lesions on MRI. One of the SPMS patients was on a disease-modifying drug (DMD) treatment, while 15 RRMS patients were on a DMD. The demographics of the cohort are summarized in Table 1 and DMD details in Table S3.
Table 1
Clinical and demographic data including follow-up data of the patients. Four of the RRMS patients had transitioned to SPMS, one of whom was deceased.
| Cohort | Controls | RRMS | SPMS |
|---|---|---|---|
| n | 10 | 30 | 16 |
| On treatment, n | 0 | 15 | 1 |
| Age, mean(±SD) | 39(±13.1) | 39(±10.6) | 58(±9.3) |
| Female/Male | 6/4 | 21/9 | 10/6 |
| EDSS, median(range) | n/a | 2.0(0-7.5) | 5.5(3.0-7.5) |
| Disease duration in months, mean(±SD) | n/a | 115(±103.8) | 281(±128.3) |
| Follow-up | RRMS | SPMS | |
| n | 27 | 13 | |
| ΔEDSS, median(range) | 0.0(-3.5-3.0) | 1.5(0-4.0) | |
| Time interval in months, mean(±SD) | 68(±15.4) | 55(±18.6) | |
| Transitioned, n | 4 | n/a | |
| Deceased, n | 1 | 0 |
EDSS: expanded disability status scale; n/a: not applicable; RRMS: relapsing-remitting multiple sclerosis; SD: standard deviation; SPMS: secondary progressive multiple sclerosis.
All participants underwent a clinical examination with EDSS grading and lumbar puncture at inclusion. MRI was performed within a week of the lumbar puncture at 1.5 T using the same imager and imaging protocol in all examinations. Gadopentetate dimeglumine (Magnevist®, 0.4 mL/kg body weight, i.e., double dose) was used as a contrast agent, and MR images were analyzed visually. More details on how the T2 score, number of T1 and large T1 lesions were extracted can be found in the supplementary information, whereas other MRI-extracted measures have been previously published by us [12].
Follow-up
Baseline data were acquired for the 46 patients and 10 controls. Follow-up data were available for 40 patients. The mean follow-up time was 5±1.4 years. At the end of the follow-up, four patients had transitioned from RRMS to SPMS. One of these was deceased. These four patients were excluded from subsequent analyses and were used instead to evaluate the ability to predict SPMS at an early stage. The patients lacking follow-up data were assumed to have the diagnosis they were given at inclusion.
Sample collection
The lumbar puncture was performed through the L3/L4 or L4/L5 interspace, and CSF was collected in a polypropylene tube that was centrifuged for 5 min at 250 ×g at room temperature. The supernatant was transferred, gently mixed and aliquoted in polypropylene tubes stored at -80 °C until analysis.
Protein quantification
CD27 was measured by sandwich ELISA kit, (DY382, R&D Systems, Minneapolis, MN, USA). The assay was calibrated against recombinant human CD27 and had a total coefficient of variation of approximately 5%.
CSF concentrations of amyloid β peptides ending at amino acids 38, 40 and 42 (Aβ38, Aβ40 and Aβ42, respectively) were measured using the Meso Scale Discovery Abeta Triplex assay (MSD, Rockville, MD). CSF T-tau and P-tau concentrations were measured using INNOTEST ELISAs (Fujirebio, Ghent, Belgium). CSF monocyte chemoattractant protein 1 (MCP-1) concentration was measured using the V-PLEX Human MCP-1 Kit (MSD, Rockville, MD). Intra-assay coefficients of variation were below 10% for all analyses.
Albumin concentrations in plasma and CSF were measured immunochemically in a Cobas 501 analyzer (Roche Diagnostics, Rotkreuz, Switzerland) with reagents from the same manufacturer. Experienced and board-certified laboratory technicians, blinded to clinical data, performed all analyses in one round of experiments using one batch of reagents per assay.
The remaining 39 out of the 52 clinical, radiological and protein (CRP) measurements had been previously characterized and published by us, including age and gender [12-15]. The mean and standard deviation of all CRP measurements in each diagnostic group are summarized in Table S4.
Metabolite extraction
CSF samples were thawed on ice, and 100 µL was transferred and mixed with 410 µL ice-cold methanol (MeOH) supplemented with an internal standard cocktail (D4-6keto-prostaglandin-F1-alpha, D4-thromboxane-B2, D4-prostaglandin-F2-alpha, D4-prostaglandin-E2, D4-prostaglandin-D2, D4-15-deoxy-delta12, 14-prostaglandin-J2, D4-cortisol and levonorgestrel) at a final concentration of 0.25 µM. The samples were further vortexed for 15 s and incubated at -20 °C for 30 min, followed by centrifugation at 20400 ×g for 12 min at 4 °C. The supernatants were transferred to fresh Eppendorf tubes and dried using a centrifugal vacuum concentrator (overnight).
Upon analysis, the dried samples were reconstituted in 100 µL of 5% MeOH, 0.1% formic acid (FA) and 94.9% deionized MilliQ water. 10 µL of each sample was pooled to create a quality control (QC) sample to be injected repeatedly to monitor the performance throughout the analysis.
Mass spectrometry analysis
The samples were injected in a constrained randomized order, where they were divided into groups of eight that were injected twice for technical duplicates (the second injections were done in reversed order to prohibit patterns in potential carryover effects). A QC injection was done every 16th sample and a blank injection every 8th. Finally, a 2-fold serial dilution series ranging from 0.5 to 32 µL QC was injected.
The mass spectrometry analyses were performed using a Thermo Ultimate 3000 HPLC and Thermo Q-Exactive Orbitrap mass spectrometer. 10 µL sample was injected to a Thermo Accucore aQ RP C18 column (100 × 2.1 mm, 2.6 µm particle size). The analytical gradient was initiated with an isocratic flow for 3 min (0% B), followed by a 2.6 min gradient (0-10% B), 8.3 min (10-100% B) and 3 min (100% B), followed, finally, by re-equilibration and washing of the column for 3 min (0% B), where A is 0.1% FA in MilliQ water and B is 89.9% acetonitrile, 10% isopropanol and 0.1% FA. Mass spectrometry data were acquired in profile mode (in positive and negative ionization mode), using a mass range of 70-900 m/z during the first 5 min and 148-900 m/z in the following 15 min (to avoid low mass contaminants) in the positive ionization mode and 70-900 m/z throughout in negative ionization mode. To improve the identification of metabolites, eight tandem mass spectrometry analyses in positive and negative ionization mode were performed separately on pooled samples (RRMS, SPMS, control and global pools).
Quantification
The acquired raw data was converted to an open source format (.mzML). Peaks were picked using msconvert from ProteoWizard [16] and preprocessed using the following pipeline within the OpenMS platform [17]. The peak-picked data were quantified by FeatureFinderMetabo [18], and the resulting features were linked across the samples using FeatureLinkerUnlabelledQT [19], allowing 10 s retention-time tolerance and 5 ppm mass deviation (this was performed irrespective of charge state across the samples). The non-default parameters can be found in Table S5.
Metabolite identification
Two strategies were used for metabolite identification: 1) the experimentally measured peaks were compared to in silico fragmented spectra of the metabolites in the Human Metabolome Database (HMDB) [20], employing the Phenomenal infrastructure [21] and 2) the experimental MS2 spectra were manually curated and matched in mzcloud [22]. While mzcloud, in contrast to the de novo approach, has the advantage of matching against actual measured data on libraries of metabolites, it obviously lacks many metabolites that have not yet been measured and characterized, a weakness that is met by the de novo approach, where theoretical MS2 spectra for all metabolites in HMDB are present.
In cases when different identities were suggested by the two different approaches, the identity suggested by the de novo approach was chosen (implying that the identity was not present in mzcloud or that there was no clear match in mzcloud).
Statistical analysis
The quantified data was loaded into the statistical software environment R v3.4.0 [23] and features without established charge were removed. Blank filtering was performed according to our previously introduced pipeline [24]. A quality-filtering procedure was done using the dilution series requiring the spectral features in the series to have at least an absolute Pearson correlation of 0.5 with the injection volume. To stabilize variances, the intensity values were replaced by their log2 value, before potential sample outliers were investigated visually based on the total ion count of each sample. No sample outliers were found.
To reduce the intensity decrease over run time, the spectral features were normalized by the internal standards. The in-between-replicate Pearson correlation was calculated (minimum replicate correlation achieved was 0.95) and the replicates were averaged. Spearman's rank correlation coefficients were calculated between the albumin ratio and the spectral features to eliminate features that may originate from blood (leaking through the blood-brain barrier). Features that acquired a statistically significant (p-value<0.05) absolute correlation higher than 0.5 were removed.
Finally, only metabolites with an established de novo identity were used in analysis with a coverage within metabolic features of at least 75%. Remaining missing values were replaced by the average feature value.
The age dependence was evaluated per metabolite and protein, assuming a linear relation using Pearson's correlation analysis, where a p<0.05 was seen as a significant dependence. Age-dependent metabolites or proteins were age corrected by fitting a linear model (R function lm) to their levels in the controls and RRMS patients, with age as the explanatory variable. The age coefficient was extracted from the model and used to correct the metabolite or protein values in all individuals [25,26].
Multivariate modelling and variable selection
The CRP data and metabolomics data were separately subjected to partial least square discriminant analysis (PLS-DA) to target the differences between classes using the R package ropls [27], with the number of components predefined as two. This was performed using the class labels RRMS, SPMS and controls, comparing all groups against each other (referred to as the Global model) and RRMS vs. SPMS. The most significant variables were obtained using a combined “Variable Importance in the Projection” (VIP) which is commonly used to assess the importance of the X-variables in multivariate models.
To attain measures separating SPMS from RRMS that also differ from control levels, ten variables achieving the highest VIP values were extracted from each model, and the intersections between the Global and RRMS vs. SPMS variables were obtained. These variables (CRP and metabolic) were evaluated by PLS-DA separately, as reduced sets, and combined into a new dataset (CRPM), employing the same class labels as used previously (Global and RRMS vs. SPMS).
To reduce the risk of overfitting, i.e., to extract variation unique to the dataset alone, the full procedure, including the variable selection, was performed and evaluated using a 5-fold cross-validation (CV) repeated ten times. Briefly, the 5-fold CV divides the data into five balanced groups using stratified sampling. Four of these groups are used for training the model, while the fifth is held out and used for validation and performance estimation. The procedure is repeated five times, so that each group may act as the validation cohort. Balanced error rates (BER), accounting for class sizes, were calculated for each model to estimate an overall predictive performance, and SPMS-specific error rates (ER) were obtained to establish the performance of SPMS detection. This analytical strategy is illustrated in Figure 1, and the complete code has been made publicly available on Github (https://github.com/stephanieherman/variable-selection). Additionally, to evaluate any potential overfitting, PLS-DA was performed on the CRP and metabolomics dataset including all individuals, and R2 and Q2 values were extracted.
Figure 1
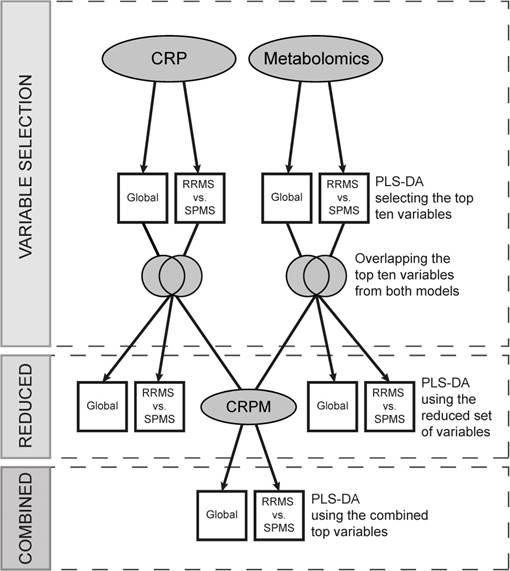
Variable selection and evaluation procedure. The metabolomics and the CRP datasets were separately evaluated, and two models for each dataset, Global and RRMS vs. SPMS, were built using partial least squares discriminant analysis (PLS-DA). The top ten variables, contributing the most to each model, were compared, and the overlapping variables modelled using PLS-DA (the reduced models). Additionally, the reduced variable sets from the metabolomics and the CRP dataset were combined, creating the CRPM dataset, and two CRPM models were built, Global and RRMS vs. SPMS. The full procedure was evaluated using a 5-fold cross-validation (CV) repeated ten times, where four fifths of the data were used for modelling and variable selection and a fifth for validation. CRP: clinical, radiological and protein; CRPM: clinical, radiological, protein and metabolite; RRMS: relapsing-remitting multiple sclerosis; SPMS: secondary progressive multiple sclerosis.
The consensus variables (the ones with the highest average VIPs) were filtered for redundancies using Spearman's ranked correlation analyses, excluding variables that were statistically significantly (p<0.05) correlated (r>0.80) as well as metabolites missing highly confident identities. Finally, to combine variable information, principal component analysis (PCA) was used (R function prcomp with centered and scaled variables) to compress the variables into two principal components. A Welch's t-test was done between the RRMS and SPMS scores in the first principal component and for each separate variable alone. Similarly, the receiver operating characteristic (ROC) curves for each separate variable as well as the first principal component were computed with corresponding areas under the ROC curve (AUROC) using the R package pROC [28].
Disease progression
To identify variables that associate with the disease progression of SPMS patients, the increases in EDSS scores at the end of the follow-up period were assessed by an experienced neurologist and categorized into three groups by clinical degree of change. Group 1 consisted of patients whose EDSS scores were stable with no change during the follow-up period. An intermediate group 2 increased in EDSS by 0.5-1.5 if the initial EDSS was <5.5 or by 0.5-1 if the initial EDSS was ≥5.5. Finally, group 3 consisted of patients who had deteriorated significantly in the follow-up period, whose EDSS increased by >1.5 if the initial EDSS was <5.5 or by >1 if the initial EDSS was ≥5.5. This stratification aimed to take the clinical severity into account, which is not reflected by the EDSS scoring. The EDSS increase and corresponding group for each SPMS patient can be found in Table S6. To find variables that statistically significantly (p<0.05) varied between the groups, Kruskal-Wallis tests were done on the metabolites in the reduced metabolomics dataset as well as the CRP variables.
Results
The CRP data distinguished RRMS and SPMS with a 22% error rate
To investigate the ability to distinguish all groups (Global), the CRP data were modelled using PLS-DA after age correcting three age-dependent proteins. A BER value for classifying all classes and an SPMS-specific ER were estimated (BER: 0.44±0.122, SPMS ER: 0.18±0.207), i.e., the SPMS was the only group that the model was able to moderately separate. To explore the variable contribution, VIP values were extracted, which indicated that EDSS contributed the most, followed by disease duration, age and the size of the spinal cord and third ventricle. EDSS, age and disease duration are essentially demonstrating that SPMS patients in general are older, have had the disease for a longer time and are more disabled than the other groups. These variables cannot be used for diagnostic purposes and were therefore excluded from further analyses. In addition, redundant variables giving the same type of information were also excluded from the CRP data (specifically large T1, T1 and T2 scores).
When these variables were removed, the performance was decreased (BER: 0.48±0.111, SPMS ER: 0.28±0.271). Excluding the control group, comparing RRMS and SPMS patients (RRMS vs. SPMS) resulted in a BER of 0.22±0.103 (Table 2). A visualization of the CRP RRMS vs. SPMS model built on all patients is shown in Figure 2A, where patients transitioning from RRMS to SPMS (n=4) were projected into the model space, with one of them located in the SPMS space and one in-between. Reducing the CRP variables down to the overlapping top ten variables from the Global and the RRMS vs. SPMS models resulted in improved performances for the Global model (BER: 0.38±0.135, SPMS ER: 0.23±0.249) and the RRMS vs. SPMS model (BER: 0.20±0.138).
Table 2
The overall and SPMS-specific cross-validated (CV) error rates (ER) achieved by the respective models. The overall CV error is a balanced error rate (BER), which is adjusted for class sizes so that 0.50 corresponds to random chance. Both the metabolomics and CRP models did not perform well for distinguishing between all groups (BER values close to 0.5). However, both models were moderately able to distinguish the SPMS patients from remaining groups. As for RRMS vs. SPMS, the CRP model obtained a BER value of 0.22 and the metabolomics model a BER value of 0.20. When reducing the variables to the overlapping top ten variables, the BER value was improved for the CRP model whereas it increased for the metabolomics model (0.20 and 0.30 respectively). Combining the top CRP and metabolic variables (CRPM) resulted in a BER value of 0.23, comparable to the value achieved by the full models.
| CV error, mean (±SD) | CRP model n=46 | Metabolomics model n=606 | Reduced CRP model n=1-10 | Reduced metabolomics model n=1-10 | CRPM model n=2-20 |
|---|---|---|---|---|---|
| Global | |||||
| Overall (BER) | 0.48(±0.111) | 0.42(±0.119) | 0.38(±0.135) | 0.55(±0.120) | 0.45(±0.145) |
| SPMS (ER) | 0.28(±0.271) | 0.26(±0.248) | 0.23(±0.249) | 0.39(±0.302) | 0.34(±0.230) |
| RRMS vs. SPMS | |||||
| Overall (BER) | 0.22(±0.103) | 0.20(±0.142) | 0.20(±0.138) | 0.30(±0.167) | 0.23(±0.149) |
BER: balancer error rate; CV: cross-validation; CRP: clinical, radiological and protein; CRPM: clinical, radiological, protein and metabolite; ER: error rate; RRMS: relapsing-remitting multiple sclerosis; SD: standard deviation; SPMS: secondary progressive multiple sclerosis.
Figure 2
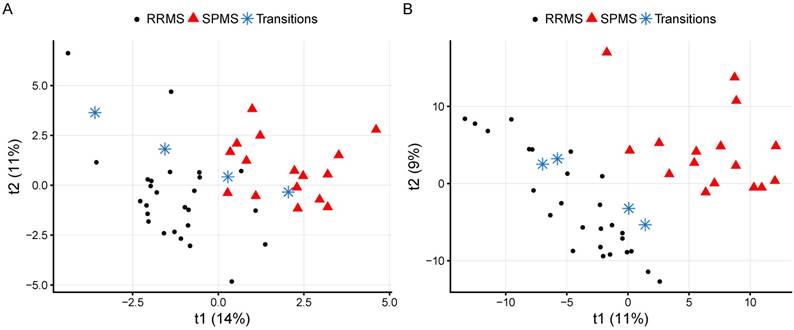
The CRP and metabolomics RRMS vs. SPMS models built using all measurements and patients. The four transitioning patients have been projected into the model space and marked with blue stars. (A) A visualization of the CRP model with quality metrics of R2=0.70: p<0.05 and Q2=0.35: p<0.05. (B) A visualization of the metabolomics model with quality metrics of R2=0.87: p<0.05 and Q2=0.64: p<0.05. RRMS: relapsing-remitting multiple sclerosis; SPMS: secondary progressive multiple sclerosis.
The metabolome distinguished RRMS and SPMS with a 20% error rate
To attain the metabolomics signatures for further assessment, the CSF metabolomes of the study cohort were measured using liquid chromatography-mass spectrometry. After removal of contaminants and spectral features potentially originating from blood, a total of 606 metabolic features with a coverage of 75% (of which 21% correlated and were corrected for age) were used to build the metabolomics models. The Global metabolomics model (BER: 0.42±0.119, SPMS ER: 0.26±0.248) as well as the RRMS vs. SPMS model (BER of 0.20±0.142) attained higher performances than the CRP models, where the ERs again indicate that SPMS was the only group that the models were able to separate (Table 2). A visualization of the metabolomics RRMS vs. SPMS model built on all patients is shown in Figure 2B, where patients transitioning from RRMS to SPMS have been projected into the model space. Reducing the metabolites down to the overlapping top ten variables from the Global and the RRMS vs. SPMS models resulted in decreased performances for both models (Table 2).
Figure 3
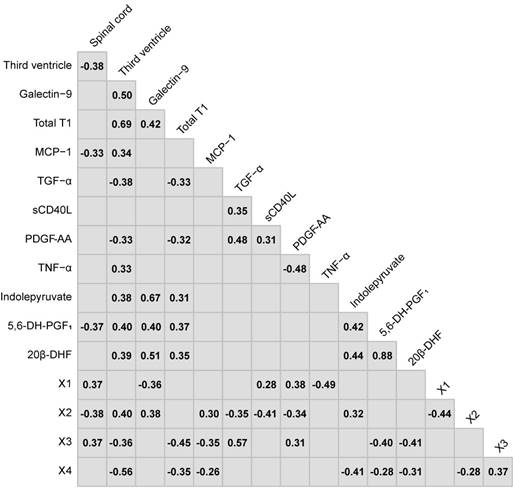
The Spearman's ranked correlations between the consensus variables chosen in the variable selection. Non-significant correlations (p>0.05) have been left blank.
Integration of CRP and metabolite measurements
To evaluate if a combination of CRP and metabolic variables can improve the prediction accuracy using only a limited number of variables, the overlapping top ten variables from the Global and RRMS vs. SPMS models of each dataset were combined into the CRPM dataset. Evaluated through CV over the full procedure (Figure 1), the CRPM Global model attained a comparable estimated performance (BER: 0.45±0.145, SPMS ER: 0.34±0.230), and the RRMS vs. SPMS model achieved a BER value of 0.23±0.149, which is comparable to that of the full models (Table 2).
The consensus of the overlapping top ten CRP variables from the Global and RRMS vs. SPMS models were: the size of the spinal cord and third ventricle, galectin-9, total T1, MCP-1, transforming growth factor alpha (TGF-α), tumor necrosis factor alpha (TNF-α), soluble CD40L (sCD40L) and platelet-derived growth factor AA (PDGF-AA). For the metabolomics data, the consensus overlapping top ten metabolic features were identified as: 5,6-dihydroxyprostaglandin F1a (5,6-DH-PGF1), 20β-dihydrocortisol (20β-DHF), indolepyruvate, and four that remained unidentified after manual curation, referred to as X1, X2, X3 and X4 (Table S7). These were combined into the consensus CRPM dataset that was filtered for potential redundancies in information using Spearman's ranked correlation analyses between all variables. Metabolic features with an uncertain identity and variables that achieved a statistically significant (p<0.05) correlation higher than 0.80 were excluded (Figure 3). For correlating metabolites, the metabolite with the highest identification score from mzcloud was kept.
Figure 4
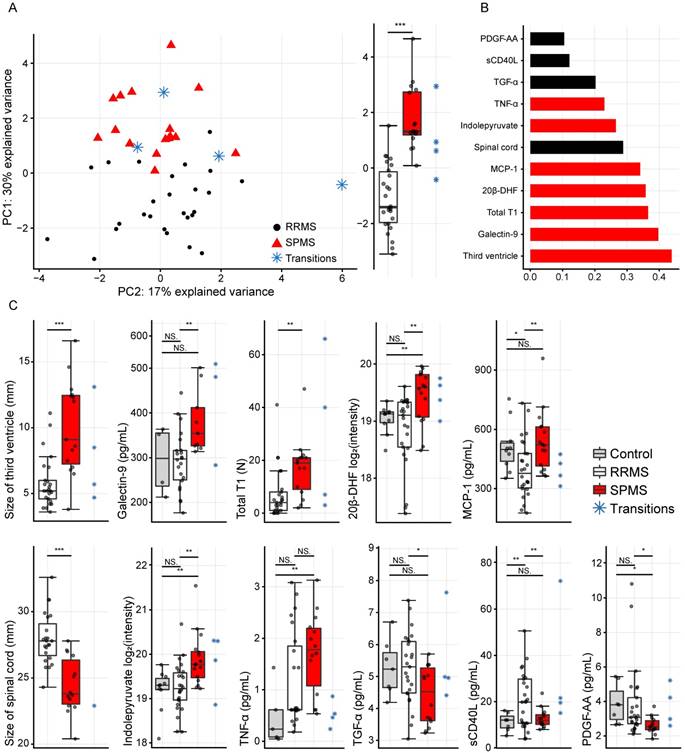
(A) Principal component analysis (PCA) of the eleven variables extracted by the variable selection procedure and the distribution of the first principal component (PC1) to the right displaying a highly significant difference (p=8.5×10⁻⁹). (B) The absolute values of the PCA loadings for PC1, showing the variable contribution in PC1. The variables have been color-coded by the class with the highest levels. (C) The eleven separate variables, where statistically significant differences were found between RRMS vs. SPMS for the size of the third ventricle, galectin-9, total T1, 20β-DHF, MCP-1, the size of the spinal cord, indolepyruvate, TGF-α, sCD40L and PDGF-AA. *, p<0.05; **, p<0.01; and ***, p<0.001. NS: non-significant; PC1: principal component one; PC2: principal component two; RRMS: relapsing-remitting multiple sclerosis; SPMS: secondary progressive multiple sclerosis.
Finally, the CRPM dataset contained three MRI measurements, six proteins and two metabolites. Using these, the consensus CRPM RRMS vs. SPMS was compressed using PCA, now including all patients (except the transitioning patients), resulting in a large and highly significant (p=8.5×10⁻⁹) separation over the first principal component (Figure 4A). Examining the variable loadings for the first principal component revealed that the size of the third ventricle, followed by galectin-9, contributed the most to the separation (Figure 4B). To investigate if the findings were therapy dependent, the PCA analysis was also performed excluding all patients on treatments (Figure S1), demonstrating an equally significant separation (p=8.1×10⁻⁹), indicating that the findings are not explained by treatments.
In order to compare the integrated information to the separate variables alone, the separate variables were evaluated as the compressed information in the first principal component. Statistically significant differences were found between RRMS and SPMS for the size of the third ventricle: p=4.1×10⁻⁴, galectin-9: p=0.007, total T1: p=0.008, 20β-DHF: p=0.002, MCP-1: p=0.006, the size of the spinal cord: p=3.2×10⁻⁵, indolepyruvate: p=0.002, TGF-α: p=0.01, sCD40L: p=0.007 and PDGF-AA: p=0.01, whereas TNF-α displayed a p=0.08 (Figure 4C).
In addition, the ROC with its corresponding AUROC value for the combined information in the first principal component was compared to the ROCs and AUROC values of the separate variables. An increase from 0.85 for the best performing variables (the size of the spinal cord and third ventricle) to 0.97 for the combined and compressed information was achieved (Figure 5), indicating that the combined information provided a higher performance.
MBP, MDC, 20β-DHF and 5,6-DH-PGF1 associate to a worse disease progression in SPMS patients
To identify CRP variables and metabolites that associate with the disease progression of SPMS patients, the levels of all CRP variables, including the metabolites in the reduced metabolomics dataset, were investigated using Kruskal-Wallis tests based on the three groups of varying degree of clinical change. The proteins myelin basic protein (MBP) (p=0.04) and macrophage-derived chemokine (MDC) (p=0.05) as well as the metabolites 20β-DHF (p=0.02) and 5,6-DH-PGF1 (p=0.05) achieved statistically significant differences between the groups (Figure 6). Interestingly, some of the transitioning patients (marked on the y-axis in Figure 6) displayed extreme levels of these proteins. Likewise, the combined information in the first principal component from the SPMS patients was investigated. No statistically significant difference (p=0.1) was found.
Discussion
We have shown that a model-based approach integrating clinical data, radiological, protein and metabolite measurements could be used for early diagnosis of SPMS patients. Using a linear combination of only eleven variables, the identification of SPMS patients could be improved. We also identified four biomarkers that were associated with a worse prognosis in patients with SPMS that could potentially be used to evaluate the disease course of these patients.
Figure 5
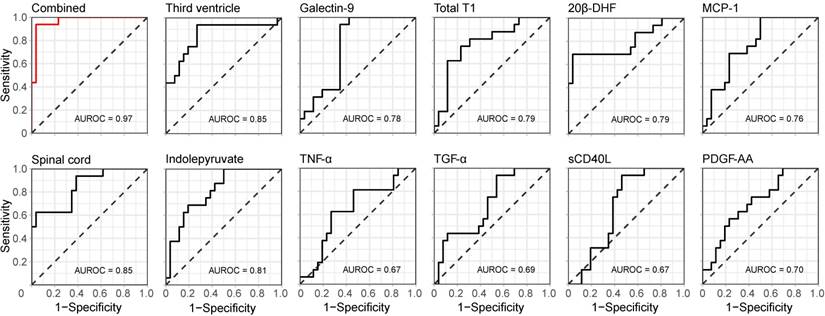
Discriminative performance of the combined and single measurements. The receiver operating characteristic (ROC) curves for the compressed (CRPM) information in the first principal component (top left in red) as well as for the separate variables alone (black), with corresponding areas under the curve (AUROC).
Figure 6
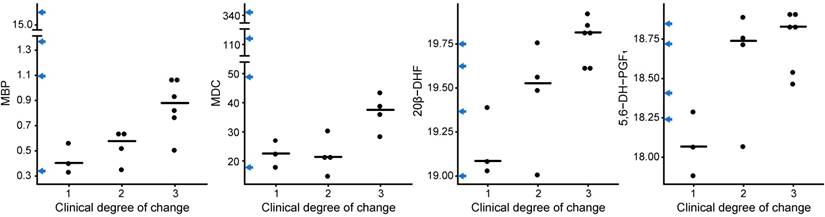
CRP and metabolites vs. the clinical degree of change. The proteins MBP and MDC and the metabolites 20β-DHF and 5,6-DH-PGF1 showed statistically significant differences between the groups, where 1 corresponds to no clinical change, 2 to an intermediate clinical change and 3 to a severe clinical change. The levels for the transitioning patients have been marked on the y-axis in blue arrows.
Multivariate diagnostics
Technological advances have enabled us to measure multiple layers of biological information. However, integrating the information into MAAAs to be used in clinical care is still very rare. In health care, measurements are traditionally evaluated independently, ignoring any combinatorial effect provided by combinations of measurements. By taking advantage of multiple variables, logistic regression-based models have proven to be superior for screening in prostate cancer [3], and the result of regression of clinical data can assist in identifying patients thought to be at high risk of cardiovascular disease [29].
In support of our variable selection, most of the extracted variables have been previously associated with SPMS and/or have been linked to the neurodegenerative stages of MS, e.g., decrease in the size of the spinal cord [30,31], increase in the size of the third ventricle [32], and accumulation of the number of T1 lesions in the later stages of SPMS [33].
Others have demonstrated increased levels of galectin-9 in active MS lesions [34], and we previously demonstrated that galectin-9 was significantly elevated in SPMS patients in comparison to RRMS patients and healthy controls [14]. Here, we demonstrated that galectin-9 is the most valuable protein measurement for distinguishing SPMS patients and the second most important variable in the CRPM dataset. We and others have previously shown that MCP-1 (also termed CCL2) is elevated in SPMS patients compared to RRMS patients and that TNF-α is elevated in RRMS and SPMS patients compared to controls [15,35]. We have previously shown that sCD40L identifies RRMS patients with the presence of Gd lesions, whereas PDGF-AA decrease in SPMS patients compared to RRMS and controls [15]. Finally, the pro-inflammatory cytokine TGF-α has been shown to be associated to CNS lesions in MS [36]. However, none of these performed as well as the combined and compressed information for distinguishing RRMS and SPMS patients.
By defining three groups of varied clinical degree of impairment, we could demonstrate that MBP and MDC were elevated in SPMS patients with greater development of disability. MBP has been suggested as a potential marker for relapses in MS, as it is released during myelin sheath degradation [37,38], whereas MDC (also termed CCL22) is believed to play a role in various pathologies including the MS pathology and has been seen to be elevated in RRMS patients, in particular RRMS patients with Gd lesions, compared to controls [15] and to increase with disease progression in mice models with experimental autoimmune encephalomyelitis (EAE) [39]. CSF MDC has been found to be increased in female MS patients compared to male patients and female controls [40]. To investigate any potential gender effects on the MDC levels, Welch's t-tests were done between all female and male patients, between female patients and controls and between female and male SPMS patients. We found no statistically significant difference between female and male patients (p=0.09), but a statistically significant increase was found in female patients compared to female controls (p=0.02). Amongst the SPMS patients, there was no statistically significant difference between female (n=10) and male (n=6) patients (p=0.8), indicating that the increase seen in the group of SPMS patients with the most severe disease progression is not due to gender. To our knowledge, the expression of MBP and MDC has not previously been demonstrated to associate with disease progression in SPMS patients.
A few metabolomics studies on CSF from MS patients have previously been performed, e.g., suggesting alterations in energy and phospholipid metabolism compared to non-MS [8,9], and MS plasma has shown dysregulation of the methionine metabolism, related to mitochondrial abnormalities [10]. Alterations in phospholipid metabolism have also been found in serum of SPMS patients with respect to RRMS patients [41]. The most discriminant metabolites found herein represent novel findings in MS to a large extent; 5,6-DH-PGF1 is a prostaglandin. Prostaglandin F2α has previously been shown to decrease in plasma and increase in CSF of progressive MS patients compared to other neurological diseases [42,43], suggesting that prostaglandins may be involved in the pathology of MS. Furthermore, indolepyruvate is involved in tryptophan metabolism, where it catalyzes the nonoxidative decarboxylation of 3-indolepyruvate to 3-indoleacetaldehyde. Indolepyruvate has also been found to act as a direct precursor for kynurenic acid in the presence of free radicals [44]. The kynurenine pathway is the major pathway in the tryptophan metabolism and has been recognized as central to the mechanisms of neurodegeneration [45]. The kynurenine pathway serum signature has also been shown to discriminate MS subtypes with an accuracy of 83% [46]. We found increased levels of indolepyruvate in SPMS patients compared to RRMS and controls that exhibited similar levels.
In additional support of our findings, both 20β-DHF and 5,6-DH-PGF1 were significantly increased in SPMS patients with greater development of disability, reinforcing their importance in the disease course of MS. Little is known about the glucocorticoid 20β-DHF, which is an abundant metabolite of cortisol. Previously, 20β-DHF measured in urine has been associated with Cushing's disease [47] and hypertension when measured in plasma [48]. Cortisol, however, has been reported to increase in the plasma and urine of MS patients [49-51]. Herein, we also find a statistically significant increase of CSF cortisol levels in SPMS patients compared to RRMS patients (Figure S2). However, we found the relative importance of SPMS diagnosis to be much higher for 20β-DHF than that of cortisol.
Assessment of early diagnosis of SPMS patients
In the study cohort, the clinical follow-up of patients showed that four patients had transitioned from RRMS to SPMS within two to three years. As SPMS currently is diagnosed retrospectively, when the neurodegeneration potentially has been present for years, there is a possibility that these patients already had a neurodegenerative phenotype at the start of the study. Therefore, these patients were kept out of the variable selection procedure and instead assessed for early detection of SPMS. In the first principal component of the CRPM variables, three transitioning patients and one RRMS patient were closer to the SPMS patients than the RRMS patients (one with a score above the 95% confidence interval of the average SPMS score; (CI: 1.15, 2.39), p=2.1×10⁻⁵), indicating that these patients were at high risk for development of SPMS. As for the remaining transitioning patient who displayed values closer to the RRMS patients, the patient had either not developed a neurodegenerative profile or the neurodegeneration was too mild to be detected by the measurements included in the current study.
Methodological aspects and limitations of the study
Our goal was to combine information of carefully chosen variables for early identification of SPMS patients. The methodological strategy employed herein is novel to our knowledge, but the concept of information integration as MAAAs has been under discussion and employed for some time [3,52,53].
Three MRI, six protein and two metabolite measurements constructed the final CRPM dataset. When these were compressed down to a linear combination using PCA, the first principal component showed an increase in AUROC from 0.85, which was yielded by the best-performing single measurements, to 0.97. To estimate the value of adding the two metabolites 20β-DHF and indolepyruvate, the predictive accuracy of the compressed information of the final CRP variables was calculated (AUROC=0.93), indicating a modest increase in accuracy when adding the two metabolites.
Random forest based on protein ratios has previously proven valuable for MS diagnostics. Using a set of 22/21 protein ratios, Barbour et al. achieved AUROC values of 0.98/0.91 (ERs of 0.09/0.11) when distinguishing MS from non-MS and progressive MS (SPMS and primary progressive MS, PPMS) from RRMS, validated on an independent cohort [7]. Decision trees or random forest comes with the advantage of being easy to interpret, but a major drawback of random forest is the ignorance to combinatorial effects (on top of the risk of overfitting).
Using a multivariate approach like PLS-DA, measurements will be combined in an optimal way to maximize the variance among the groups of interest. If for example variable X and Y perform poorly independently, but very good when combined, they will be discarded by random forest but will be picked up by PLS-DA. However, the prevalent drawback of PLS-DA is the risk of overfitting, which we accounted for by performing repeated CV. The objective of CV is to extract true global variation, while ignoring variation unique to the dataset alone. An independent validation cohort as utilized by Barbour et al. would of course be superior to this approach and of great value to confirm our findings [7]. To check for overfitting in the models used in the variable selection, the models were rebuilt using all patients and the R2 and Q2 were extracted, where R2 describes how well the data explain the groups and Q2 is analogous to R2 except for being based on CV. The CRP (n=46) RRMS vs. SPMS model resulted in R2=0.70, p<0.05 and Q2=0.35, p<0.05 and the metabolomics RRMS vs. SPMS model utilizing all metabolites (n=606) demonstrated values of R2=0.87, p<0.05 and Q2=0.64, p<0.05, indicating that the metabolomics model demonstrates higher retention of predictivity, i.e., less overfitting (R2-Q2), and a higher overall predictivity (Q2 value). Similarly, but with lower values due to the inability to distinguish RRMS from controls, the Global models achieved values of R2=0.40, p<0.05 and Q2=0.16, p<0.05 (CRP) and R2=0.48, p<0.2 and Q2=0.28, p<0.05 (metabolomics). Essentially this indicates that the metabolomics and the CRP models that we use to extract the CRPM variables contain information that should be important in the global MS population.
To illustrate the final variables chosen by the variable selection included in CRPM, an unsupervised multivariate method was used (PCA). PCA works in a similar manner as PLS-DA, by decomposing the data into linear combinations of the variables. However, instead of maximizing the variation between predefined groups of interest, it maximizes present variation in the data not including any prior knowledge of grouping. PCA stores the most dominant variation in the first principal component and decreasing amounts of variation in the subsequent components, meaning the first principal component contains the most information. The first principal component of the combined CRPM variables showed a highly significant separation between the RRMS and SPMS patients (p=8.5×10⁻⁹), superior to the best performing separate variable (p=3.2×10⁻⁵).
The most prominent limitation of the study is the limited number of patients and controls. While this increases the risk that our data do not accurately reflect the population, single-center studies have the advantage of avoiding inter-center variabilities and other confounders that can be difficult to correct for or handle [24]. Additionally, there were only four patients who transitioned from RRMS to SPMS during the follow-up period, limiting our findings for early detection. The fact that Barbour et al. attained a different set of protein markers (then evaluated as protein ratios) than extracted herein indicates that there are more proteins of interest for use in MS diagnostics [7]. Finally, as half of the RRMS patients (n=15) and one of the SPMS patients were on ongoing treatments, these treatments could potentially affect the top candidate variables. To assure that this was not the case, a PCA was performed on the CRPM variables, excluding all patients on ongoing treatments (Figure S1). The results showed that the separation between the RRMS and SPMS patients remained highly statistically significant over the first principal component (p=8.1×10⁻⁹).
Future perspectives
Integrative approaches hold great potential in future diagnostic assessments of many diseases, and as a general concept (MAAA) they could be applied to any medical condition with quantitative measurements. The challenges faced when translating this into routine health care would be the validation of a combinatorial scoring system, as the combined information as well as the single measurements included would need to be characterized.
We also identified proteins and metabolites that were associated with development of disability. This may prove to be important in identifying patients at high risk for development of disability and thus highly suited for clinical trials of treatments for progressive MS. Furthermore, whether the levels of these proteins and metabolites can be influenced by therapeutic intervention will be an important area for future research.
Abbreviations
20β-DHF: 20β-dihydrocortisol; 5,6-DH-PGF1: 5,6-dihydroxyprostaglandin F1a; AUROC: area under the receiver operating characteristics curve; BER: balanced error rate; CNS: central nervous system; CRP: clinical, radiological; CRPM: clinical, radiological, protein, metabolite; CSF: cerebrospinal fluid; CV: cross-validation; EDSS: expanded disability status scale; ER: error rate; FA: formic acid; Gd: gadolinium-enhancing; MAAA: multianalyte assays with algorithmic analyses; MBP: myelin basic protein; MCP-1: monocyte chemoattractant protein-1; MDC: macrophage-derived chemokine; MRI: magnetic resonance imaging; MS: multiple sclerosis; NS: non-significant; PCA: principal component analysis; PDGF-AA: platelet-derived growth factor AA; PLS-DA: partial least squares discriminant analysis; QC: quality control, protein; ROC: receiver operating characteristics; RRMS: relapsing-remitting multiple sclerosis; sCD40L: soluble CD40L; SPMS: secondary progressive multiple sclerosis; TGF-α: transforming growth factor alpha; TNF-α: tumor necrosis factor alpha; VIP: variable importance in the projection.
Supplementary Material
Supplementary methods, tables and figures.
Acknowledgements
We greatly acknowledge financial supported from the Åke Wiberg Foundation, The European Commission's Horizon 2020 program funded under grant agreement number 654241 (PhenoMeNal), a donation from Lars Tenerz, the Selander foundation, Åke Löwnertz foundation for neurological research and the MÅH Ländell foundation. The funders had no role in study design, data collection and analysis, decision to publish or preparation of the manuscript. In addition, we also want to acknowledge Eva Freyhult for valuable input and discussions concerning the design of the analysis approach.
Data availability
All metabolomics data are available through MetaboLights under the identifier MTBLS558. The complete R code generating the results herein is available on GitHub (https://github.com/stephanieherman/variable-selection) and the clinical data, including age and gender are available upon request.
Competing Interests
The authors have declared that no competing interest exists.
References
1. Biomarkers Definitions Working Group. Biomarkers and surrogate endpoints: preferred definitions and conceptual framework. Clin Pharmacol Ther. 2001;69:89-95
2. Gallo V, Egger M, McCormack V, Farmer PB, Ioannidis JPA, Kirsch-Volders M. et al. STrengthening the Reporting of OBservational studies in Epidemiology—Molecular Epidemiology (STROBE-ME): an extension of the STROBE Statement. PLoS Med. 2011;8:e1001117
3. Grönberg H, Adolfsson J, Aly M, Nordström T, Wiklund P, Brandberg Y. et al. Prostate cancer screening in men aged 50-69 years (STHLM3): a prospective population-based diagnostic study. Lancet Oncol. 2015;16:1667-76
4. University of California, San Francisco MS-EPIC Team:, Cree BAC, Gourraud P-A, Oksenberg JR, Bevan C, Crabtree-Hartman E. et al. Long-term evolution of multiple sclerosis disability in the treatment era. Ann Neurol. 2016;80:499-510
5. Villoslada P, Alonso C, Agirrezabal I, Kotelnikova E, Zubizarreta I, Pulido-Valdeolivas I. et al. Metabolomic signatures associated with disease severity in multiple sclerosis. Neurol Neuroimmunol Neuroinflamm. 2017;4:e321
6. Poddighe S, Murgia F, Lorefice L, Liggi S, Cocco E, Marrosu MG. et al. Metabolomic analysis identifies altered metabolic pathways in multiple sclerosis. Int J Biochem Cell Biol. 2017;93:148-55
7. Barbour C, Kosa P, Komori M, Tanigawa M, Masvekar R, Wu T. et al. Molecular-based diagnosis of multiple sclerosis and its progressive stage. Ann Neurol. 2017;82:795-812
8. Reinke SN, Broadhurst DL, Sykes BD, Baker GB, Catz I, Warren KG. et al. Metabolomic profiling in multiple sclerosis: insights into biomarkers and pathogenesis. Mult Scler. 2014;20:1396-400
9. Kim H-H, Jeong IH, Hyun J-S, Kong BS, Kim HJ, Park SJ. Metabolomic profiling of CSF in multiple sclerosis and neuromyelitis optica spectrum disorder by nuclear magnetic resonance. PLoS One. 2017;12:e0181758
10. Singhal NK, Freeman E, Arning E, Wasek B, Clements R, Sheppard C. et al. Dysregulation of methionine metabolism in multiple sclerosis. Neurochem Int. 2018;112:1-4
11. Polman CH, Reingold SC, Banwell B, Clanet M, Cohen JA, Filippi M. et al. Diagnostic criteria for multiple sclerosis: 2010 revisions to the McDonald criteria. Ann Neurol. 2011;69:292-302
12. Burman J, Zetterberg H, Fransson M, Loskog AS, Raininko R, Fagius J. Assessing tissue damage in multiple sclerosis: a biomarker approach. Acta Neurol Scand. 2014;130:81-9
13. Burman J, Raininko R, Blennow K, Zetterberg H, Axelsson M, Malmeström C. YKL-40 is a CSF biomarker of intrathecal inflammation in secondary progressive multiple sclerosis. J Neuroimmunol. 2016;292:52-7
14. Burman J, Svenningsson A. Cerebrospinal fluid concentration of galectin-9 is increased in secondary progressive multiple sclerosis. J Neuroimmunol. 2016;292:40-4
15. Burman J, Svensson E, Fransson M, Loskog ASI, Zetterberg H, Raininko R. et al. The cerebrospinal fluid cytokine signature of multiple sclerosis: a homogenous response that does not conform to the Th1/Th2/Th17 convention. J Neuroimmunol. 2014;277:153-9
16. Chambers MC, Maclean B, Burke R, Amodei D, Ruderman DL, Neumann S. et al. A cross-platform toolkit for mass spectrometry and proteomics. Nat Biotechnol. 2012;30:918-20
17. Sturm M, Bertsch A, Gröpl C, Hildebrandt A, Hussong R, Lange E. et al. OpenMS - An open-source software framework for mass spectrometry. BMC Bioinformatics. 2008;9:163
18. Kenar E, Franken H, Forcisi S, Wörmann K, Häring H-U, Lehmann R. et al. Automated label-free quantification of metabolites from liquid chromatography-mass spectrometry data. Mol Cell Proteomics. 2014;13:348-59
19. Weisser H, Nahnsen S, Grossmann J, Nilse L, Quandt A, Brauer H. et al. An automated pipeline for high-throughput label-free quantitative proteomics. J Proteome Res. 2013;12:1628-44
20. Wishart DS, Tzur D, Knox C, Eisner R, Guo AC, Young N. et al. HMDB: the Human Metabolome Database. Nucleic Acids Res. 2007;35:D521-6
21. Khoonsari PE, Moreno P, Bergmann S, Burman J, Capuccini M, Carone M, et al. Interoperable and scalable metabolomics data analysis with microservices. November 2017. https://www.biorxiv.org/content/early/2017/11/24/213603.abstract
22. mzCloud - Advanced Mass Spectral Database. https://www.mzcloud.org/
23. R Core Team (2013). R: A language and environment for statistical computing. R Foundation for Statistical Computing. http://www.R-project.org
24. Herman S, Emami Khoonsari P, Aftab O, Krishnan S, Strömbom E, Larsson R. et al. Mass spectrometry based metabolomics for in vitro systems pharmacology: pitfalls, challenges, and computational solutions. Metabolomics. 2017;13:79
25. Menni C, Kastenmüller G, Petersen AK, Bell JT, Psatha M, Tsai P-C. et al. Metabolomic markers reveal novel pathways of ageing and early development in human populations. Int J Epidemiol. 2013;42:1111-9
26. Falahati F, Ferreira D, Soininen H, Mecocci P, Vellas B, Tsolaki M. et al. The effect of age correction on multivariate classification in alzheimer's disease, with a focus on the characteristics of incorrectly and correctly classified subjects. Brain Topogr. 2016;29:296-307
27. Thévenot EA, Roux A, Xu Y, Ezan E, Junot C. Analysis of the human adult urinary metabolome variations with age, body mass index, and gender by implementing a comprehensive workflow for univariate and OPLS statistical analyses. J Proteome Res. 2015;14:3322-35
28. Robin X, Turck N, Hainard A, Tiberti N, Lisacek F, Sanchez J-C. et al. pROC: an open-source package for R and S+ to analyze and compare ROC curves. BMC Bioinformatics. 2011;12:77
29. Hippisley-Cox J, Coupland C, Vinogradova Y, Robson J, May M, Brindle P. Derivation and validation of QRISK, a new cardiovascular disease risk score for the United Kingdom: prospective open cohort study. BMJ. 2007;335:136
30. Filippi M, Campi A, Colombo B, Pereira C, Martinelli V, Baratti C. et al. A spinal cord MRI study of benign and secondary progressive multiple sclerosis. J Neurol. 1996;243:502-5
31. Bjartmar C, Kidd G, Mörk S, Rudick R, Trapp BD. Neurological disability correlates with spinal cord axonal loss and reduced N-acetyl aspartate in chronic multiple sclerosis patients. Ann Neurol. 2000;48:893-901
32. Benedict RHB, Bruce JM, Dwyer MG, Abdelrahman N, Hussein S, Weinstock-Guttman B. et al. Neocortical atrophy, third ventricular width, and cognitive dysfunction in multiple sclerosis. Arch Neurol. 2006;63:1301-6
33. Truyen L, van Waesberghe JH, van Walderveen MA, van Oosten BW, Polman CH, Hommes OR. et al. Accumulation of hypointense lesions (“black holes”) on T1 spin-echo MRI correlates with disease progression in multiple sclerosis. Neurology. 1996;47:1469-76
34. Stancic M, van Horssen J, Thijssen VL, Gabius H-J, van der Valk P, Hoekstra D. et al. Increased expression of distinct galectins in multiple sclerosis lesions. Neuropathol Appl Neurobiol. 2011;37:654-71
35. Scarpini E, Galimberti D, Baron P, Clerici R, Ronzoni M, Conti G. et al. IP-10 and MCP-1 levels in CSF and serum from multiple sclerosis patients with different clinical subtypes of the disease. J Neurol Sci. 2002;195:41-6
36. Chandler S, Miller KM, Clements JM, Lury J, Corkill D, Anthony DC. et al. Matrix metalloproteinases, tumor necrosis factor and multiple sclerosis: an overview. J Neuroimmunol. 1997;72:155-61
37. Whitaker JN. Myelin encephalitogenic protein fragments in cerebrospinal fluid of persons with multiple sclerosis. Neurology. 1977;27:911-20
38. Cohen SR, Herndon RM, McKhann GM. Radioimmunoassay of myelin basic protein in spinal fluid. An index of active demyelination. N Engl J Med. 1976;295:1455-7
39. Columba-Cabezas S, Serafini B, Ambrosini E, Sanchez M, Penna G, Adorini L. et al. Induction of macrophage-derived chemokine/CCL22 expression in experimental autoimmune encephalomyelitis and cultured microglia: implications for disease regulation. J Neuroimmunol. 2002;130:10-21
40. Galimberti D, Fenoglio C, Comi C, Scalabrini D, De Riz M, Leone M. et al. MDC/CCL22 intrathecal levels in patients with multiple sclerosis. Mult Scler. 2008;14:547-9
41. Dickens AM, Larkin JR, Griffin JL, Cavey A, Matthews L, Turner MR. et al. A type 2 biomarker separates relapsing-remitting from secondary progressive multiple sclerosis. Neurology. 2014;83:1492-9
42. Lam MA, Maghzal GJ, Khademi M, Piehl F, Ratzer R, Romme Christensen J. et al. Absence of systemic oxidative stress and increased CSF prostaglandin F2α in progressive MS. Neurol Neuroimmunol Neuroinflamm. 2016;3:e256
43. Gonzalo H, Brieva L, Tatzber F, Jové M, Cacabelos D, Cassanyé A. et al. Lipidome analysis in multiple sclerosis reveals protein lipoxidative damage as a potential pathogenic mechanism. J Neurochem. 2012;123:622-34
44. Politi V, Lavaggi MV, Di Stazio G, Margonelli A. Indole-3-pyruvic acid as a direct precursor of kynurenic acid. Adv Exp Med Biol. 1991;294:515-8
45. Maddison DC, Giorgini F. The kynurenine pathway and neurodegenerative disease. Semin Cell Dev Biol. 2015;40:134-41
46. Lim CK, Bilgin A, Lovejoy DB, Tan V, Bustamante S, Taylor BV. et al. Kynurenine pathway metabolomics predicts and provides mechanistic insight into multiple sclerosis progression. Sci Rep. 2017;7:41473
47. Schöneshöfer M, Weber B, Nigam S. Increased urinary excretion of free 20 alpha- and 20 beta-dihydrocortisol in a hypercortisolemic but hypocortisoluric patient with cushing's disease. Clin Chem. 1983;29:385-9
48. Kornel L, Miyabo S, Saito Z, Cha R-W, Wu F-T. Corticosteroids in human blood. VIII. Cortisol metabolites in plasma of normotensive subjects and patients with essential hypertension. J Clin Endocrinol Metab. 1975;40:949-58
49. Ysrraelit MC, Gaitán MI, Lopez AS, Correale J. Impaired hypothalamic-pituitary-adrenal axis activity in patients with multiple sclerosis. Neurology. 2008;71:1948-54
50. Michelson D, Stone L, Galliven E, Magiakou MA, Chrousos GP, Sternberg EM. et al. Multiple sclerosis is associated with alterations in hypothalamic-pituitary-adrenal axis function. J Clin Endocrinol Metab. 1994;79:848-53
51. Then Bergh F, Kümpfel T, Trenkwalder C, Rupprecht R, Holsboer F. Dysregulation of the hypothalamo-pituitary-adrenal axis is related to the clinical course of MS. Neurology. 1999;53:772-7
52. Colón-Franco JM, Bossuyt PMM, Algeciras-Schimnich A, Bird C, Engstrom-Melnyk J, Fleisher M, et al. Current and emerging multianalyte assays with algorithmic analyses-Are laboratories ready for clinical adoption? May 2018. http://dx.doi.org/10.1373/clinchem.2017.275677
53. Kulasingam V, Pavlou MP, Diamandis EP. Integrating high-throughput technologies in the quest for effective biomarkers for ovarian cancer. Nat Rev Cancer. 2010;10:371-8
Author contact
![]() Corresponding author: Kim Kultima, Department of Medical Sciences, Clinical Chemistry, Uppsala University, Akademiska sjukhuset, Ing. 61, 3tr, 751 85 Uppsala. Email: Kim.Kultimauu.se
Corresponding author: Kim Kultima, Department of Medical Sciences, Clinical Chemistry, Uppsala University, Akademiska sjukhuset, Ing. 61, 3tr, 751 85 Uppsala. Email: Kim.Kultimauu.se
Citation styles
APA
Herman, S., Khoonsari, P.E., Tolf, A., Steinmetz, J., Zetterberg, H., Åkerfeldt, T., Jakobsson, P.J., Larsson, A., Spjuth, O., Burman, J., Kultima, K. (2018). Integration of magnetic resonance imaging and protein and metabolite CSF measurements to enable early diagnosis of secondary progressive multiple sclerosis. Theranostics, 8(16), 4477-4490. https://doi.org/10.7150/thno.26249.
ACS
Herman, S.; Khoonsari, P.E.; Tolf, A.; Steinmetz, J.; Zetterberg, H.; Åkerfeldt, T.; Jakobsson, P.J.; Larsson, A.; Spjuth, O.; Burman, J.; Kultima, K. Integration of magnetic resonance imaging and protein and metabolite CSF measurements to enable early diagnosis of secondary progressive multiple sclerosis. Theranostics 2018, 8 (16), 4477-4490. DOI: 10.7150/thno.26249.
NLM
Herman S, Khoonsari PE, Tolf A, Steinmetz J, Zetterberg H, Åkerfeldt T, Jakobsson PJ, Larsson A, Spjuth O, Burman J, Kultima K. Integration of magnetic resonance imaging and protein and metabolite CSF measurements to enable early diagnosis of secondary progressive multiple sclerosis. Theranostics 2018; 8(16):4477-4490. doi:10.7150/thno.26249. https://www.thno.org/v08p4477.htm
CSE
Herman S, Khoonsari PE, Tolf A, Steinmetz J, Zetterberg H, Åkerfeldt T, Jakobsson PJ, Larsson A, Spjuth O, Burman J, Kultima K. 2018. Integration of magnetic resonance imaging and protein and metabolite CSF measurements to enable early diagnosis of secondary progressive multiple sclerosis. Theranostics. 8(16):4477-4490.
This is an open access article distributed under the terms of the Creative Commons Attribution (CC BY-NC) license (https://creativecommons.org/licenses/by-nc/4.0/). See http://ivyspring.com/terms for full terms and conditions.