Impact Factor
- Issue 14; 2026
- Issue 13; 2026
- Issue 12; 2026
- Issue 11; 2026
- Issue 10; 2026
- Volume 16; 2026
- Advance Articles
- Past Issues
- Cover Images
- Cover Suggestion
- Index & Coverage
- Special Issues
Introduction
Methods
Results
Discussion
Abbreviations
Supplementary Material
Acknowledgements
References
Author Biographies
International Journal of Biological Sciences
International Journal of Medical Sciences
 Global reach, higher impact

Theranostics 2018; 8(17):4750-4764. doi:10.7150/thno.26108 This issue Cite
Research Paper
Optogenetic sensors in the zebrafish heart: a novel in vivo electrophysiological tool to study cardiac arrhythmogenesis
Chantal J.M. van Opbergen1*, Charlotte D. Koopman1,2*, Bart J.M. Kok1, Thomas Knöpfel3,4, Sabine L. Renninger5, Michael B. Orger5, Marc A. Vos1, Toon A.B. van Veen1, Jeroen Bakkers1,2*, Teun P. de Boer1* ![]()
1. Department of Medical Physiology, Division of Heart & Lungs, University Medical Center Utrecht, Yalelaan 50, 3584 CM, Utrecht, The Netherlands.
2. Hubrecht Institute, Royal Netherlands Academy of Arts and Sciences (KNAW), University Medical Centre Utrecht, 3584 CT, Utrecht, The Netherlands.
3. Laboratory for Neuronal Circuit Dynamics, Imperial College London, London, UK
4. Centre for Neurotechnology, Institute of Biomedical Engineering, Imperial College London, London, UK.
5. Champalimaud Research, Champalimaud Centre for the Unknown, Lisbon, Portugal
* these authors contributed equally
Received 2018-3-16; Accepted 2018-7-9; Published 2018-9-9
Abstract

Cardiac arrhythmias are among the most challenging human disorders to diagnose and treat due to their complex underlying pathophysiology. Suitable experimental animal models are needed to study the mechanisms causative for cardiac arrhythmogenesis. To enable in vivo analysis of cardiac cellular electrophysiology with a high spatial and temporal resolution, we generated and carefully validated two zebrafish models, one expressing an optogenetic voltage indicator (chimeric VSFP-butterfly CY) and the other a genetically encoded calcium indicator (GCaMP6f) in the heart.
Methods: High-speed epifluorescence microscopy was used to image chimeric VSFP-butterfly CY and GCaMP6f in the embryonic zebrafish heart, providing information about the spatiotemporal patterning of electrical activation, action potential configuration and intracellular Ca2+ dynamics. Plotting VSFP or GCaMP6f signals on a line along the myocardial wall over time facilitated the visualization and analysis of electrical impulse propagation throughout the heart. Administration of drugs targeting the sympathetic nervous system or cardiac ion channels was used to validate sensitivity and kinetics of both zebrafish sensor lines. Using the same microscope setup, we imaged transparent juvenile casper fish expressing GCaMP6f, demonstrating the feasibility of imaging cardiac optogenetic sensors at later stages of development.
Results: Isoproterenol slightly increased heart rate, diastolic Ca2+ levels and Ca2+ transient amplitudes, whereas propranolol caused a profound decrease in heart rate and Ca2+ transient parameters in VSFP-Butterfly and GCaMP6f embryonic fish. Ikr blocker E-4031 decreased heart rate and increased action potential duration in VSFP-Butterfly fish. ICa,L blocker nifedipine caused total blockade of Ca2+ transients in GCaMP6f fish and a reduced heart rate, altered ventricular action potential duration and disrupted atrial-ventricular electrical conduction in VSFP-Butterfly fish. Imaging of juvenile animals demonstrated the possibility of employing an older zebrafish model for in vivo cardiac electrophysiology studies. We observed differences in atrial and ventricular Ca2+ recovery dynamics between 3 dpf and 14 dpf casper fish, but not in Ca2+ upstroke dynamics.
Conclusion: By introducing the optogenetic sensors chimeric VSFP-butterfly CY and GCaMP6f into the zebrafish we successfully generated an in vivo cellular electrophysiological readout tool for the zebrafish heart. Complementary use of both sensor lines demonstrated the ability to study heart rate, cardiac action potential configuration, spatiotemporal patterning of electrical activation and intracellular Ca2+ homeostasis in embryonic zebrafish. In addition, we demonstrated the first successful use of an optogenetic sensor to study cardiac function in older zebrafish. These models present a promising new research tool to study the underlying mechanisms of cardiac arrhythmogenesis.
Keywords: Optogenetics, zebrafish, in vivo cardiac cellular electrophysiology, chimeric VSFP-butterfly CY, GCaMP6f
Introduction
Cardiac arrhythmias are among the most challenging human disorders to diagnose and treat due to their complex underlying pathophysiology. To fully understand arrhythmogenic mechanisms, a detailed examination at the multicellular level within the context of the whole body is necessary. While human cardiac electrophysiology has been studied for decades, experimental (animal) models are pivotal to study cellular processes in depth. Unfortunately, as the heart is poorly accessible within a closed thoracic cavity, our current knowledge of cellular electrophysiology is mainly based on in vitro experiments using isolated hearts or cardiomyocytes. Therefore, the ability to conduct in vivo research would provide us remarkable insight into the complex interplay of the heart and other organs to maintain homeostasis.
Small rodent models, like mice and rats, are often used to analyze electrophysiological mechanisms of cardiac arrhythmias as they are affordable, highly available and can be genetically manipulated [1]. However, due to their high heart rates [2], small heart size, and significantly different action potential (AP) shape [3], use (or the application) of these models is usually limited to proof-of-principle studies that can later be extended into larger animal models [1,4]. Large animal models such as the dog, pig, sheep and goat, have hearts that are both anatomically and physiologically more similar to that of a human's. For this reason, large models are more suitable for pre-clinical studies to test safety and efficacy of novel therapies. However, the costs of using these animals are very high, the experimental procedures are complex, and there are more serious ethical concerns [1]. Furthermore, not all large-animal hearts are equally similar to the human heart, thereby reducing the clinical relevance of some disease models [5]. Ultimately, the choice of an animal model has to be determined for each study separately, as it will depend on the specific research goal which animal is most suitable.
During the past few decades, the zebrafish (Danio rerio) has emerged as a powerful, cost-efficient, and easy-to-use vertebrate model to study cardiovascular disease. Due to its optical accessibility, small size, genetic manipulability, rapid development, high offspring numbers, and the possibility of high-throughput chemical screenings, the zebrafish forms an important addition to the existing group of electrophysiological animal models [6]. This especially holds true for the use in high-throughput genotype-phenotype relation studies and in vivo studies. Even though zebrafish hearts have two chambers, their physiology resembles the human heart in multiple aspects [7]. Like mammals, zebrafish have functional pacemaker cells that initiate and regulate cardiac contraction [8,9] and spontaneous heart rates. Furthermore, the relationship between QT interval and heart rate are reported to be comparable to those found in a human [10,11]. In addition, zebrafish cardiac action potentials exhibit a similar shape to human action potentials, with a long plateau phase and substantial correspondence in ion currents [10,12-14].
Optical mapping with fluorescent dyes has become a fundamental tool to study cardiac cellular electrophysiology and excitation-contraction coupling due to its high spatial and temporal resolution. Unfortunately, dyes are primarily optimized for in vitro experiments—for example, for use in Langendorff perfused hearts—thereby removing the heart from its context within the body. In vivo experiments with dyes have been performed and are achievable [15,16], but the approaches are usually invasive (due to required surgery or high DMSO concentrations) and lack cell type specificity. Optogenetic sensors form an appealing alternative, as they can be genetically targeted to specific subsets of cells, have low phototoxicity and can be used for in vivo (longitudinal) studies [17-19]. Genetically encoded voltage indicators (GEVI's) and Ca2+ indicators (GECI's) are two groups of optogenetic sensors that allow the detection of membrane depolarization and intracellular Ca2+ dynamics respectively. To accurately reflect the short action potentials and Ca2+ fluxes in the heart, it is essential that optogenetic sensors have robust, high-resolution signals and fast kinetics. The novel voltage sensor Chimeric VSFP-butterfly CY (cyan-yellow: mCitrine/mCerulean) has unprecedented kinetics in comparison to earlier differential dual emission (“FRET'') voltage sensors like VSFP2.3 and Mermaid. Off kinetics in particular have improved vastly, allowing for an accurate reflection of action potential shape [20]. Similarly, the Ca2+ sensor GCaMP6f has excellent kinetics and was the first GCaMP sensor to surpass the sensitivity and speed of the classic synthetic Ca2+ dyes [21].
Here we describe a novel cardiac voltage sensor zebrafish line, chimeric VSFP-butterfly CY, and the validation of this voltage sensor line together with a GCaMP6f Ca2+ sensor line to study cellular membrane voltage and intracellular Ca2+ dynamics in the heart in a spatiotemporal manner. We show that both chimeric VSFP-butterfly CY and GCaMP6f accurately reflect cardiac electrophysiology and that parallel use of these zebrafish lines provides a powerful tool to study in vivo excitation-contraction coupling and cardiac arrhythmogenesis in zebrafish. In addition, we demonstrate for the first time the possibility to perform in vivo imaging of cardiac optogenetic sensors in juvenile zebrafish.
Methods
Zebrafish husbandry
Fish used in this study were housed under standard conditions as previously described [22]. All experiments were conducted in accordance to the ethical guidelines and approved by the local ethics committee at the Royal Dutch Academy of Sciences (KNAW).
Development of transgenic zebrafish
To generate the tg(myl7:chimeric VSFP-butterfly CY) line (VSFP: voltage sensitive fluorescent protein), we first cloned the chimeric VSFP-butterfly sequence from its original vector pCAG-Chimeric_Butterfly_CY_1.0 (Addgene plasmid #59800) into pGEM-T easy using PCR-based cloning. After validation through sequencing, chimeric VSFP-butterfly was cloned into pCR8/GW/TOPO using EcoRI restriction. Multisite Gateway cloning was used to combine chimeric VSFP-butterfly CY (pME) with the cardiac-specific myl7 promoter (p5E) and a SV40 late polyA signal (p3E) into the pDestTol2pA (http://tol2kit.genetics.utah.edu) destination vector. To obtain transgenic zebrafish, wild-type Tupfel Long fin (TL) strain zebrafish embryos were injected with 1 nL of 100 ng/µL pDestTol2pA myl7:chimeric VSFP-butterfly CY and 24 ng/µL tol2 transposase mRNA at the 1-cell stage. Tol2 sequences flanking the expression cassette facilitated stable genomic integration (Kawakami 2007). Injected embryos (F0) were screened for mCitrine and mCerulean expression in the heart and grown to adulthood. The adult F0 generation was outcrossed to wild-type TL strain zebrafish and F1 embryos were screened for bright and homogeneous mCitrine and mCerulean expression in the heart to generate a stable tg(myl7:chimeric-VSFP-butterfly-CY) line.
To generate the UAS:GCaMP6f construct, ten repeats of the Upstream Activation Sequence (10x UAS), were placed upstream of GCaMP6f [21], in the Gateway destination vector pDestTol2pA, using Gateway LR recombination. 12 ng/µL plasmid DNA with 40 ng/µL Tol2 transposase mRNA and 0.02% Phenol Red was injected into 1-cell stage embryos. An outcrossed stable UAS:GCaMP6f line was crossed to myl7:Gal4FF fish, and progeny was screened for GCaMP6f expression in the heart to identify tg(myl7:Gal4FF; UAS:GCaMP6f) fish.
Confocal imaging
At 24 h post-fertilization (hpf), embryos were placed in 1-phenyl-2-thiourea (PTU) to keep them transparent. Embryos at 3 days post-fertilization (dpf) were treated with 40 µM of 2,3-Butanedione 2-monoxime (BDM) (Sigma-aldrich, B0753) dissolved in E3 containing 16 mg/mL Tricaine until the heart stopped beating. BDM was used in this experiment, since it is highly effective in blocking cardiac contraction, but was not used in any other experiments in this study due to its interference with cardiac electrophysiology. Subsequently, these embryos were embedded in 0.3% agarose (UltraPure agarose, Invitrogen) prepared in E3 medium containing 16 mg/mL Tricaine and a maintenance dose of 20 µM BDM. To establish expression patterns of chimeric VSFP-butterfly CY and GCaMP6f, recordings were performed at 20 °C using an inverted TCS SP8 confocal laser-scanning microscope (Leica microsystems, Germany) and a 20x objective. Images were processed using ImageJ (U. S. National Institutes of Health, Bethesda, Maryland, USA).
High-speed fluorescence imaging in embryos
A morpholino (MO) oligomer targeted against tnnt2a (5'-CATGTTTGCTCTGATCTGACACGCA-3') was used to uncouple contraction from excitation in embryos, thereby preventing contraction artifacts in our recordings of cardiac electrophysiology and Ca2+ dynamics. This 'silent heart' ATG morpholino was applied as described previously [23]. At 24 hpf, embryos were placed in PTU to keep them transparent. Embryos at 3 dpf were embedded in 0.3% agarose prepared in E3 medium containing 16 mg/mL Tricaine and placed in a heated (28 °C) recording chamber. Recordings were performed using a custom-build upright widefield microscope (Cairn research, Kent, UK) equipped with a 20x 1.0 NA objective (Olympus XLUMPLFLN20X W). White LED excitation light was filtered using a 438/24 nm filter (Semrock FF02-438/24-25) and reflected towards the objective using a 458 nm dichroic mirror (Semrock FF458-Di02-25x36). Emitted fluorescence was directed to an emission splitter unit (OptoSplit II ByPass Image Splitter) fitted with a 509 nm dichroic mirror (Semrock FF509-FDi01-25x36) and 483/32 nm and 514 long-pass emission filters (Semrock FF01-483/32-25 and LP02-514RU-25, respectively). Images were projected on a high-speed camera (Andor Zyla 4.2 plus sCMOS). Recordings were performed at 100 fps, for 1000-2000 frames. Basal parameters were recorded first. Subsequently, drug stocks were diluted in 28 °C E3-Tricaine medium (isoproterenol hydrochloride 1, 10 or 100 µM, Sigma-Aldrich I6504; propranolol hydrochloride 1, 10 or 100 µM, Sigma-Aldrich P0884; E4031 100, 250, or 500 µM, Sigma-Aldrich M5060; nifedipine 1, 10, or 100 µM, Sigma-Aldrich N7634) and the medium was mixed vigorously to assure a homogeneous concentration of the drug. Embryos were incubated for 30 min in normal E3-Tricaine medium (Placebo experiments) or E3-Tricaine-drug mixture and parameters were measured again. Isoproterenol experiments were recorded in both a 25 °C and 28 °C heated solution. For nifedipine washout experiments, embryos were removed from agarose gel and incubated 180 min in E3-Tricaine medium at 28 °C. Subsequently embryos were fixed again in 0.3% agarose and parameters were measured for a third time. Recordings were analyzed using ImageJ and Matlab (Version R2015a, Mathworks, Natick, MA, USA).
High-speed fluorescence imaging in PAB-treated embryos and juveniles
14 dpf juvenile casper tg(myl7:Gal4FF; UAS:GCaMP6f) fish were embedded and imaged using the same approach as was employed in 3 dpf embryos. In contrast to embryos, we used para-amino-blebbistatin (PAB), a highly soluble and non-phototoxic blebbistatin derivative, to inhibit contraction [24]. PAB was used as an alternative, as fish cannot be raised to adulthood once injected with the tnnt2a morpholino due to a lack of blood flow. Fish were incubated in E3 medium containing 16 mg/mL Tricaine and 100 µM PAB for 15 min before embedding them in 0.3% agarose. To enable the comparison between embryonic and juvenile fish, we also treated 3 dpf casper fish with PAB instead of the tnnt2a MO. These fish were incubated in E3 medium containing 16 mg/mL Tricaine and 75 µM PAB for 90 min before embedding them in 0.3% agarose. Recordings were performed at 28 °C. While hearts never fully stopped beating, contraction was inhibited sufficiently to prevent major movement artifacts. To correct for remaining movement, we used the 'Template Matching' plugin from ImageJ.
Statistical analysis
Statistical analysis and drawing of graphs and plots were carried out in GraphPad Prism (version 6 for Mac OS X, GraphPad Software, San Diego California USA). Differences between two groups were analyzed using the paired Student's t-test, and comparisons between experimental groups were analyzed by one-way ANOVA for non-parametric variables with Tukey's post-test for intergroup comparisons. Correlation between changes in diastolic Ca2+ levels and transient amplitude was analyzed using linear regression. All data is presented as mean±SEM, and p<0.05 was considered significant. *p≤0.05, **p≤0.01, ***p≤0.001, ****p≤0.0001, n.s. p>0.05. N denotes the number of fish used per dataset.
Results
Expression of chimeric VSFP-butterfly CY and GCaMP6f in the zebrafish heart
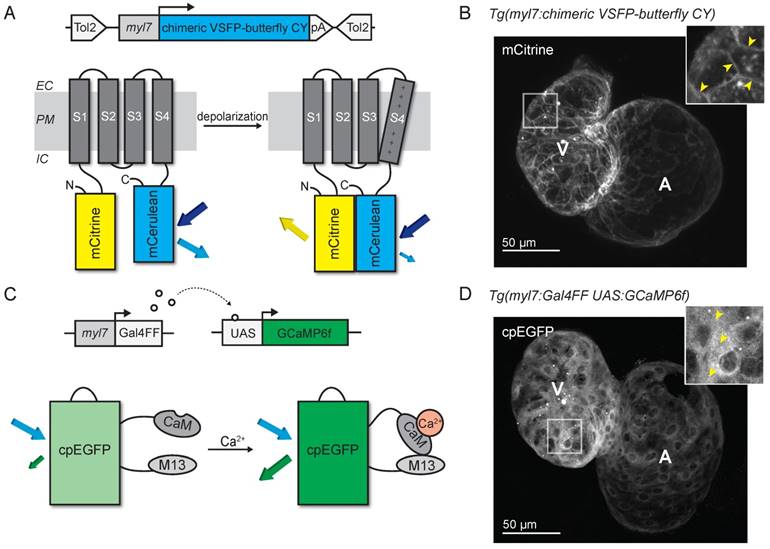
We generated a transgenic zebrafish line expressing the voltage-sensitive fluorescent protein (VSFP) chimeric VSFP-butterfly CY (cyan-yellow: mCitrine/mCerulean), and placed it under the control of the cardiac-specific myl7 promoter to generate the tg(myl7:chimeric VSFP-butterfly CY) line, referred to as VSFP-butterfly fish (Figure 1A). Fish expressing the sensor developed normally and high magnification in vivo confocal images of embryonic zebrafish hearts expressing chimeric VSFP-butterfly at 3 days post-fertilization (dpf) showed correct localization of the sensor to the plasma membrane, with very little cytosolic fluorescence (Figure 1B). In parallel, we generated a transgenic zebrafish line expressing GCaMP6f under the control of the cardiac-specific myl7 promoter and the Gal4-UAS system: tg(myl7:Gal4FF; UAS:GCaMP6f), referred to as GCaMP6f fish (Figure 1C). Fish expressing this sensor also developed normally and in vivo confocal images of 3 dpf embryonic zebrafish hearts expressing GCaMP6f showed correct localization of the sensor to the cytosol, with very little nuclear fluorescence (Figure 1D).
Development of voltage- and Ca2+-reporting zebrafish lines. (A) DNA construct and concept of the sensing mechanism of chimeric VSFP-butterfly CY. Chimeric VSFP-butterfly CY was placed under control of the myl7 promoter to restrict its expression to the heart. The sensor consists of a voltage sensitive domain with transmembrane segments S1-S4, sandwiched between a fluorescence resonance energy transfer (FRET) pair of the fluorescent proteins mCitrine and mCerulean. Movement of S4 upon membrane depolarization translates into a change of FRET efficiency. (B) 3D projection of a confocal image of a 3 dpf zebrafish tg(myl7:chimeric VSFP-butterfly CY) heart. Only the mCitrine channel is displayed. Insert shows a magnification of the selected ventricular area; arrowheads highlight the membrane targeting of chimeric VSFP-butterfly CY. (C) DNA construct and sensor dynamics of GCaMP6f. GCaMP6f was placed under the control of the myl7 promoter to restrict its expression to the heart. The Gal4FF-UAS system amplifies its expression. GCaMP6f consists of a circularly permutated enhanced green fluorescence protein (cpEGFP) fused to calmodulin (CaM) and the M13 peptide. When intracellular Ca2+ rises, CaM binds to M13, causing increased brightness of cpEGFP. (D) 3D projection of a confocal image of a 3dpf zebrafish tg(myl7:Gal4FF;UAS:GCaMP6f) heart. Insert shows a magnification of the selected ventricular area; arrowheads highlight cytosolic expression of GCaMP6f. CaM: calmodulin; EC: extracellular; IC: intracellular; pA: poly(A); PM: plasma membrane; tg: transgenic; UAS: upstream activation sequence.
VSFP-butterfly and GCaMP6f report voltage and Ca2+ dynamics in the embryonic zebrafish heart
To study in vivo spatiotemporal patterning of electrical activity in 3 dpf embryonic VSFP-butterfly zebrafish hearts, we used high-speed widefield epifluorescence microscopy (Figure 2A). Fish were injected with an antisense morpholino oligomer (MO) against tnnt2a at the one-cell stage to stop cardiac contractions and to avoid motion artifacts during imaging. Individual analysis of the mCitrine and mCerulean channels demonstrated a decrease in mCerulean signal and a simultaneous increase in mCitrine signal with every consecutive membrane depolarization, signifying an increase in FRET efficacy during membrane depolarization (Figure 2B and Movie S1). Ratiometric processing of the mCitrine and mCerulean channels provided spatial information about action potential (AP) configuration and propagation across the whole heart. Characteristics that could be extracted from our analysis were: heart rate (interval between action potentials) and repolarization parameters (action potential duration (APD) as measured from the start of the upstroke, in which APD10 indicates 10% of the APD, APD20 20%, APD50 50% and APD90 90%) (Figure 2C). We obtained a clear depiction of electrical impulse propagation throughout the heart by plotting ratiometric signals along a trajectory defined by the myocardial wall as a line versus time (analogous to the line scan approach). APs that originated in the atrium demonstrated a small delay at the AV canal and then rapidly spread throughout the ventricle. These line plots also revealed a difference in AP duration between the atrium and ventricle, and provided information about the regularity of the activation intervals (Figure 2D).
In vivo recording of voltage and Ca2+ dynamics in the embryonic zebrafish heart. (A) Recordings were performed using a custom-built upright widefield microscope equipped with a 20x objective, LED excitation light, an emission splitter unit and a high-speed fluorescence camera. Embryos were embedded in 0.3% agarose and placed in a temperature-controlled water bath. Temperature was regulated using a heated glass plate and a temperature sensor. A schematic depiction of the focal plane through the embryonic heart is visible in the right bottom frame. (B) Using the high-speed epifluorescence microscope, movies of 3 dpf non-contracting chimeric VSFP-butterfly CY embryonic hearts were recorded. Signal analysis demonstrated an increase in mCitrine (top panel) and decrease in mCerulean (bottom panel) every consecutive excitation cycle, starting in the atrium and followed by the ventricle. From these signals, a ratiometric signal could be calculated to study action potential (AP) configuration in both chambers. The selected atrial or ventricular regions are indicated by square boxes superimposed on the fluorescence images. (C) Movies of 3 dpf non-contracting GCaMP6f embryonic hearts were recorded and signal analysis demonstrated a clear oscillatory Ca2+ signal, starting in the atrium and followed by the ventricle. (D-E) Line plots of both chimeric VSFP-butterfly CY and GCaMP6f signals illustrating electrical impulse (D) and Ca2+ propagation (E) throughout the heart. Background-corrected fluorescence intensities were averaged across the width of the myocardial wall and along a trajectory defined by the course of the wall. Signal heat maps of trajectory against time depict depolarizations of the membrane (D) or increases in intracellular Ca2+ (E). The chimeric VSFP-butterfly CY line plot (D) clearly shows that APs originate in the atrium, have a small delay at the atrioventricular canal (AVC) and then rapidly spread throughout the ventricle. White insets represent the spatial AP traces, visible is the longer AP duration in the ventricle as compared to the atrium, as well as the regularity of the activation intervals. Analysis of GCaMP6f signal intensity versus time (E) also shows a clear activation pattern from atrium to ventricle. White insets represent the spatial Ca2+ transients, showing a faster speed of intracellular Ca2+ release in the atrium versus ventricle, similar speed in Ca2+ reuptake/clearance between chambers and nice regularity of activation intervals. A: atrium; cpEGFP: circularly permutated enhanced green fluorescent protein; V: ventricle.
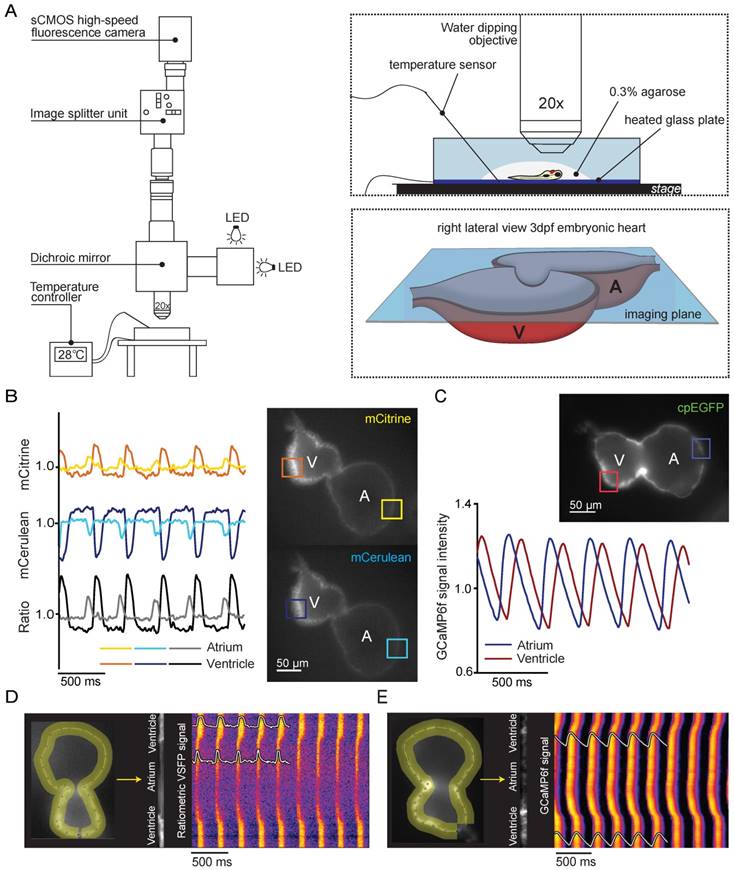
The same high-speed widefield epifluorescence imaging setup and analysis procedure was used to obtain detailed information of in vivo cytosolic Ca2+ dynamics in 3 dpf embryonic GCaMP6f zebrafish hearts (Movie S2). Analysis of GCaMP6f (cpEGFP) signal intensity over time allowed examination of diastolic Ca2+ levels, the speed of intracellular Ca2+ release and reuptake/clearance as well as maximal Ca2+ amplitudes (Figure 2C). Individual analysis of the atrial and ventricular myocardium demonstrated differences in Ca2+ dynamics along the heart tube such as a faster Ca2+ release in the atrium as reflected by the steeper upstroke phase (Figure 2C). We obtained a clear depiction of Ca2+ propagation over the zebrafish heart by plotting fluorescence signals of the myocardial wall as a line versus time. These line plots clearly showed that (like voltage signals) Ca2+ release starts in the atrium, has a slight delay in the AV-canal and then rapidly spreads throughout the ventricle (Figure 2E).
VSFP-butterfly and GCaMP6f accurately report the in vivo effects of cardiac sympathetic intervention
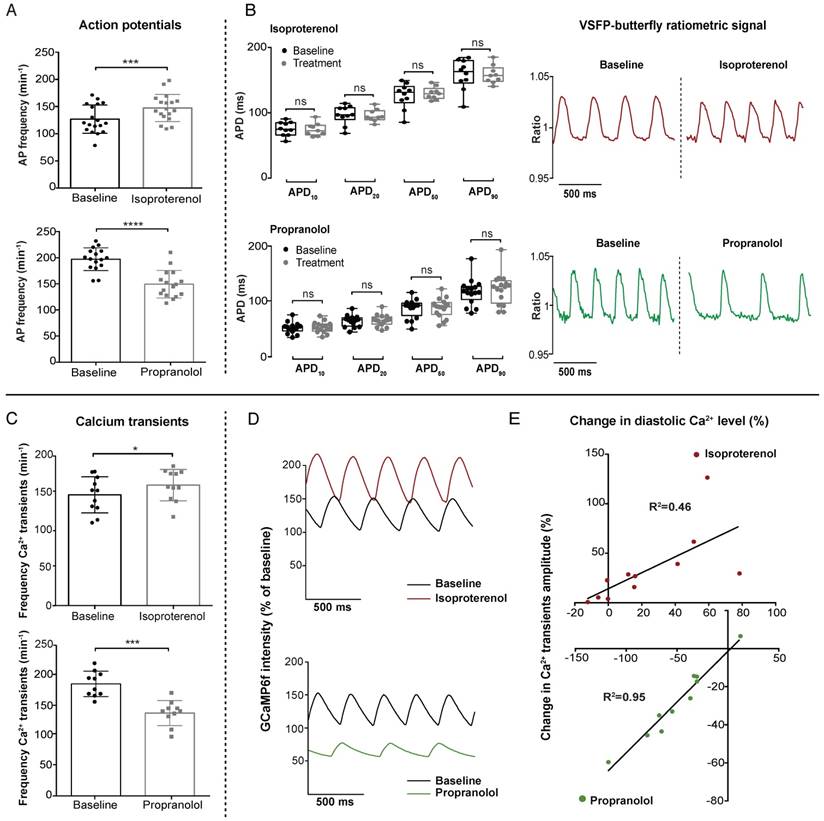
To validate the functionality and sensitivity of our VSFP-butterfly and GCaMP6f lines, we used two pharmacological agents to target the sympathetic sensitivity of the heart: the β-adrenergic agonist isoproterenol and the β-adrenergic antagonist propranolol. Placebo experiments demonstrated that incubation without pharmacological agents did not influence cardiac parameters (Figure S1). Optimal concentrations of isoproterenol and propranolol were determined via dose-response measurements in VSFP-butterfly fish (Figure S2A-B). β-adrenergic stimulation is known to increase heart rate and force of contraction by enhancing intracellular Ca2+ dynamics. Incubation with 100 µM isoproterenol seemed to have a limited effect in both the VSFP-butterfly and GCaMP6f zebrafish lines at 28 °C (average increase in heart rate: VSFP 7.6%, p≤0.001; GCaMP 5.4%, n.s.) (Figure S3). We lowered the environmental temperature from 28 °C to 25 °C, in order to reduce the sympathetic tone of the heart. This resulted in a more pronounced effect of isoproterenol on heart rate (average increase: VSFP 19.9%, p≤0.001; GCaMP 8.8%, p≤0.05) (Figure 3A, C) and Ca2+ transient amplitudes (Figure 3D-E). Isoproterenol significantly increased AP frequency (25 °C: 124.3 ± 24.2 bpm vs. 144.5 ± 22.2 bpm, p≤0.001; 28 °C: 172.9 ± 22.6 bpm vs 182.2 ± 16.4 bpm, p≤0.001) in VSFP-butterfly embryos without affecting APD (Figure 3A-B and Figure S1A), and significantly increased the number of Ca2+ transients per minute (147.8 ± 24.1 vs 160.9 ± 20.9, p≤0.05), diastolic Ca2+ levels and Ca2+ transient amplitudes in GCaMP6f embryos at 25 °C (Figure 3C-E). In contrast, treatment with 100 µM of the β-receptor antagonist propranolol very effectively decreased AP frequency (197.2 ± 21.8 bpm vs 149,2 ± 26.4 bpm, p≤0.001) without affecting APD in chimeric VSFP-butterfly CY fish (Figure 3A-B), and significantly decreased Ca2+ transient frequency (185.9 ± 21 bpm - 137.5 ± 20.7 bpm, p≤0.0001), diastolic Ca2+ levels and the amplitude of Ca2+ transients in GCaMP6f fish (Figure 3C-E). To visualize the effect of adrenergic intervention on intracellular Ca2+ kinetics, we plotted the change in diastolic Ca2+ levels against the change in Ca2+ transient amplitude in each individual fish after treatment with 100 µM isoproterenol or 100 µM propranolol (Figure 3E). Isoproterenol treatment at 28 °C shows a strong correlation (R2=0.80, p=0.0004) between the diastolic Ca2+ levels and Ca2+ transient amplitude, although these parameters did not always increase (Figure S3B). When lowering the environmental temperature, isoproterenol treatment induced a clear positive correlation between diastolic Ca2+ levels and Ca2+ transient amplitude (R2=0.46, p=0.02). In contrast, propranolol shows a strong negative correlation (R2=0.95, p≤0.0001) (Figure 3E and Figure S4).
In vivo effect of sympathetic intervention on ventricular electrophysiology and Ca2+ dynamics in embryonic zebrafish. 3 dpf VSFP-butterfly and GCaMP6f fish were treated for 30 min with β-adrenergic receptor agonist isoproterenol (100 µM) or antagonist propranolol (100 µM). Isoproterenol experiments were recorded at 25 °C to decrease sympathetic tone and propranolol experiments at 28 °C. (A-B) VSFP-butterfly fish treated with isoproterenol (n=18) or propranolol (n=17). (A) Bar graphs demonstrating a significant increase in AP frequency (heart rate) after isoproterenol treatment (p≤0.001) and a decrease after propranolol treatment (p≤0.0001) (mean ± SEM). (B) Boxplots demonstrating action potential duration (APD) parameters. No significant changes were found in APD10,20,50 and APD90 after treatment. Representative examples of normalized VSFP-butterfly ratiometric signals of the same fish before and after treatment showing the clear effect on AP frequency by isoproterenol and propranolol treatment, without affecting the AP configuration. (C-E) GCaMP6f fish treated with isoproterenol (n=11) or propranolol (n=10). (C) Bar graphs (mean ± SEM) demonstrating a significant increase in Ca2+ transient frequency after treatment with isoproterenol (p≤0.05) and a decrease after treatment with propranolol (p≤0.001). (D) Representative examples of the effect of isoproterenol and propranolol on Ca2+ transient amplitude and GCaMP6f signal intensity compared to baseline. Clear changes in Ca2+ transient frequency, Ca2+ transient amplitude and baseline GCaMP6f signal intensity (diastolic Ca2+ level) are visible. GCaMP6f intensity is represented as percentage change compared to baseline, setting the lowest value of the baseline measurement at 100%. (E) Correlation plots of the change in diastolic Ca2+ level versus the change in Ca2+ transient amplitude after sympathetic stimulation (p=0.02, R2=0.46) and sympathetic inhibition (p≤0.0001, R2=0.95), presenting significant positive correlations.
VSFP-butterfly and GCaMP6f fish are sensitive to IKr and to LTCC blockade
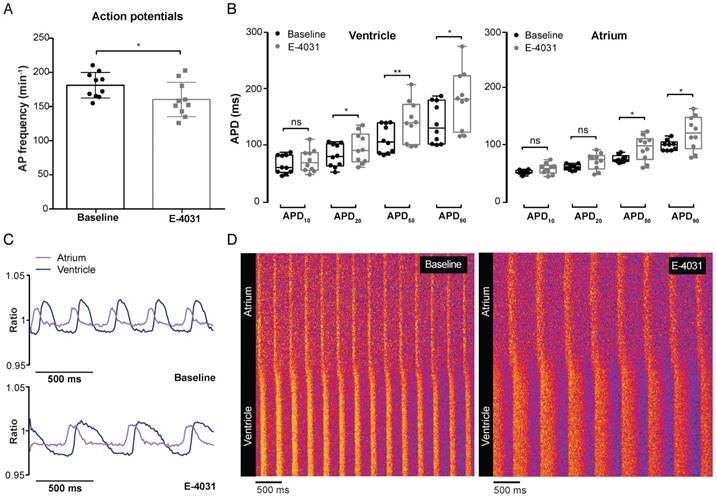
To validate whether VSFP-butterfly is sensitive enough to pick up changes in APD and AP morphology, we used classic pharmacological agents to target cardiac ion channels. The hERG channel blocker E-4031 is known to block the rapid delayed rectifier K+ channel (IKr), thereby decreasing K+ efflux and increasing APD. The optimal dose of E-4031 was determined via dose-response measurements in VSFP-butterfly fish (Figure S2C). Incubation with 500 µM E-4031 induced a significant reduction of AP frequency (181.3 ± 18.6 vs 160.4 ± 25.1 bpm, p≤0.05) in the zebrafish heart (Figure 4A). APD50 and APD90 were significantly increased in both the atrium (APD50: 72.7 ± 7.2 vs 92.7 ± 21.8 ms, p≤0.05; APD90: 95.3 ± 10.5 vs 119 ± 29.4 ms, p≤0.05) and the ventricle (APD50: 110.9 ± 24.8 vs 142.1 ± 36.4 ms, p≤0.01; APD90: 139.2 ± 36.1 vs 181 ± 51.6 ms, p≤0.05), while APD20 only showed an increase in the ventricle (81.8 ± 20.2 vs 95.2 ± 26.8 ms, p≤0.05) (Figure 4B). APD10 was unaffected in both chambers (Figure 4B). This decrease in AP frequency and lengthening of APD was clearly exposed when visualized by line graphs and line plots (Figure 4C-D).
In vivo effect of IKr block on cardiac electrophysiology in embryonic VSFP-butterfly CY fish. 3 dpf VSFP-butterfly CY fish were treated for 30 min with Ikr antagonist E-4031 (500 µM; n=10). (A) Bar graphs demonstrating a significant decrease in AP frequency after E-4031 treatment (p≤0.05) (mean ± SEM). (B) Boxplots demonstrating APD parameters of the ventricle and atrium at baseline and after treatment with E-4031. A significant increase in APD20,50 and APD90 in the ventricle and significant increase in APD50 and APD90 in the atrium was found (* p≤0.05, ** p≤0.01). (C) A representative example of the ratiometric AP signals recorded in the atrium and ventricle before and after treatment with E-4031. Clear broadening of the AP shape after treatment is visible. (D) Line plots of the ratiometric AP signals versus time showing a decreased AP frequency and increase of AP duration in the atrium as well as the ventricle. The pattern of atrial-ventricular electrical conduction seems unaffected after treatment with E-4031.
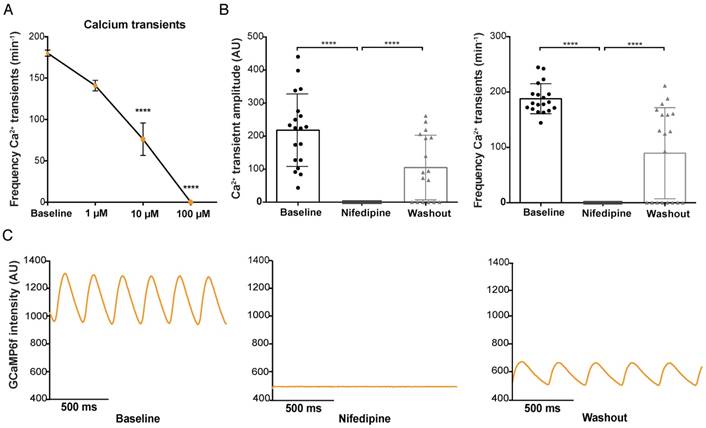
The voltage-sensitive L-type Ca2+ ion channel is essential for the influx of Ca2+ after a membrane depolarization and for the maintenance of the AP plateau phase. The L-type Ca2+ antagonist nifedipine (100 µM) induced a total block of Ca2+ transients in the entire heart, which was visible by the complete disappearance of GCaMP6f fluorescence (Figure 5B-C). The effect of nifedipine on GCaMP6f signal intensity appeared to be dose dependent: 100 µM nifedipine induced a total Ca2+ block in 100% of the fish treated (Figure 5A-B), 10 µM nifedipine only resulted in a total Ca2+ block in 41.7% of embryos treated, while 1 µM was not able to induce a total block in any of the fish (Figure S5A-C). Nifedipine did cause a clear reduction in frequency of Ca2+ transients with all the different concentrations (1, 10, 100 µM: 19% (p≤0.01), 56% (p≤0.001), 100% (p≤0.0001) decrease, respectively) (Figure 5B and Figure S5B-C). Washout experiments were performed in all 3 conditions to exclude that toxicity (death of the embryos) could have been the reason for the disappearance of the GCaMP6f signal. Washout after treatment with 1 µM and 10 µM nifedipine completely restored frequency of Ca2+ transients to baseline levels in all fish (Figure S5B-C). Washout after treatment with 100 µM nifedipine reversed the Ca2+ block in 65% of the fish, restoring frequency of Ca2+ transients, and Ca2+ transient amplitudes to levels near to baseline (Figure 5B-C).
In vivo effect of L-type calcium channel block on ventricular Ca2+ dynamics in embryonic GCaMP6f fish. 3 dpf GCaMP6f fish were treated for 30 min with the L-type calcium channel (LTCC) antagonist nifedipine. (A) Dose-response curve showing that increased concentrations of nifedipine (1-100 µM) result in a decreased frequency of Ca2+ transients in the ventricle (representative of frequencies over the entire heart tube). Baseline measurements of the 3 treatment groups are pooled in one group (mean ± SEM, 10 and 100 µM p≤0.0001, baseline: n=43, 1 µM: n=12, 10 µM: n=12, 100 µM: n=19). (B) Bar graphs showing that treatment with 100 µM nifedipine completely diminished Ca2+ amplitude and frequency (p≤0.0001), which was partly reversed after washout in E3 medium (p≤0.0001) (mean ± SEM, baseline n=19, treatment n=19, washout n=17). (C) A visual representation of the total block in GCaMP6f signal intensity in one representative fish after treatment with 100 µM nifedipine and the rescue of Ca2+ amplitude and frequency after washout in E3 medium. AU: arbitrary units.
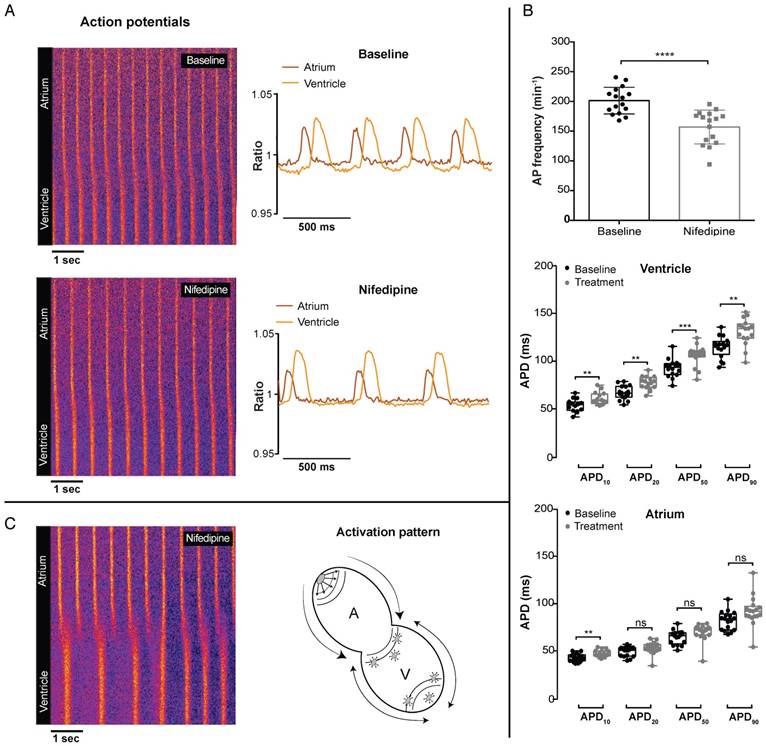
Strikingly, in contrast with GCaMP6f signals, VSFP-butterfly signals could still be recorded after 100 µM nifedipine treatment. Nifedipine treatment in VSFP-Butterfly fish did, however, significantly reduce the AP frequency (198.9 ± 24.7 vs 156.8 ± 25.2 bpm, p≤0.0001) (Figure 6A-B), which is in line with the effect on Ca2+ transient frequency in GCaMP6f fish at 1 µM and 10 µM nifedipine, but not at 100 µM nifedipine, as the GCaMP6f signal completely disappeared at this concentration (Figure 5B-C). In the ventricle, APD was slightly, but significantly increased after treatment with 100 µM nifedipine (APD10: 54.1 ± 6.3 vs 60.8 ± 6.3 ms, p≤0.01; APD20: 67.2 ± 7.1 vs 77.2 ± 6.8 ms, p≤0.01; APD50: 92.5 ± 9.3 vs 105.4 ± 10.7 ms, p≤0.001; APD90: 114.1 ± 11 vs 130 ± 13.8 ms, p≤0.01) (Figure 6B). In the atrium, only APD10 was significant increased (43.1 ± 4 vs 47 ± 3.4 ms, p≤0.05), while APD20, APD50 and APD90 were not affected (Figure 6B). Strikingly, in 20% of the treated fish (100 µM) we observed a desynchronized atrial-ventricular (A-V) electrical impulse propagation (Figure 6C and Movie S3).
In vivo effect of LTCC blockage on cardiac electrophysiology in embryonic VSFP-butterfly CY fish. 3 dpf VSFP-butterfly fish were treated for 30 min with 100 µM nifedipine. (A) Line plots of the ratiometric VSFP-butterfly signal versus time in one representative fish before and after treatment, along with a visual representation of the AP configuration. The line plots show a decrease in AP frequency and slight increase in ventricular APD after treatment with nifedipine. Line plots and adjacent ratiometric graphs are from the same fish. (B) APD parameters before and after treatment with 100 µM nifedipine (n=16). Bar graphs show a significant decrease in the AP frequency (mean ± SEM, p≤0.0001) and boxplots show a significant increase in APD10,20,50 and APD90 in the ventricle (middle panel; **p≤0.01, ***p≤0.001), but only an increase of APD10 in the atrium (bottom panel; p≤0.05). (C) A line plot of one representative fish showing a disturbed atrial-ventricular electrical conductance after treatment with 100 µM nifedipine, which occurred in 20% of the fish. Atrial firing is regular, but there is ectopic activation at the apex as well at the base of the ventricle, which is clarified in the schematic picture. A: atrium; V: ventricle.
GCaMP6f reports Ca2+ dynamics in the juvenile zebrafish heart
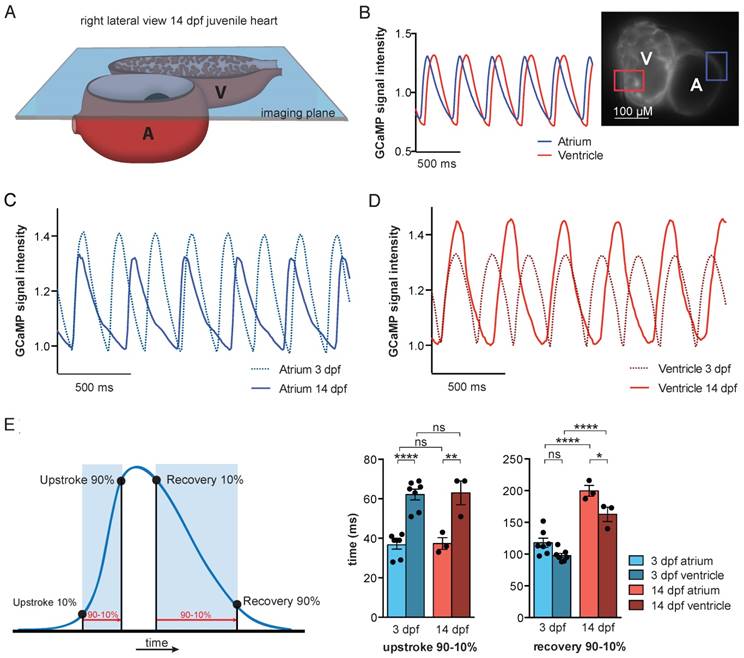
To study in vivo cardiac Ca2+ dynamics in older fish, we developed a transparent casper tg(myl7:Gal4FF;UAS:GCaMP6f) zebrafish line. Due to mutations in the genes mitfa and mpv17 [25], casper zebrafish lack two skin pigments and remain transparent even into adulthood [26]. We used the same high-speed widefield epifluorescence microscopy setup employed in 3 dpf VSFP-butterfly and GCaMP6f embryos (Figure 2A and Figure 7A). 3 dpf and 14 dpf casper tg(myl7:Gal4FF;UAS:GCaMP6f) zebrafish were treated with 75 µM and 100 µM para-amino-blebbistatin (PAB) respectively, to inhibit contraction. While hearts never fully stopped beating with PAB, contraction was inhibited sufficiently to prevent major movement artifacts (Movie S4). Analysis of the oscillatory GCaMP6f (cpEGFP) signal over time allowed examination of Ca2+ transient dynamics in both cardiac chambers (Figure 7B). Similar to 3 dpf embryos, individual analysis of the atrial and ventricular myocardium demonstrated differences in Ca2+ dynamics between chambers, with again a faster rise of cytosolic Ca2+ levels in the atrium (Figure 7B-E). Interestingly, when comparing Ca2+ dynamics between 3 dpf and 14 dpf zebrafish, we found significant differences in the recovery phases of atrial and ventricular Ca2+ transients (Figure 7C-E). Cytosolic Ca2+ clearance was significantly slower in the atrium of 14 dpf fish (90-10%: 117.9 ± 7.3 ms at 3 dpf vs. 199.7 ± 8.6 ms at 14 dpf, p ≤ 0.0001), as well in the ventricle of 14 dpf fish (90-10%: 97.7 ± 3.5 ms at 3 dpf vs. 162.7 ± 11.4 ms at 14 dpf, p ≤ 0.0001) (Figure 7E), which could be an effect of the overall slower heart rate at 14 dpf (Figure S6A). To investigate whether genetic background and type of contraction block affects Ca2+ dynamics, two zebrafish strains (TL and casper) and two types of contraction blockers (tnnt2a MO and PAB) were compared (Figure S6). We did observe an effect of zebrafish strain, as we found higher heart rates in casper fish compared to embryonic TL fish (Ca2+ transient frequency; TL MO 216.6 ± 3.1 bpm vs. casper MO 238.4 ± 4.2 bpm, p ≤ 0.001; TL PAB 223.5 ± 2.9 bpm vs. casper PAB 242.1 ± 3.9 bpm, p ≤ 0.001) (Figure S6A), as well as a shorter Ca2+ transient recovery time in casper fish, both in the atrium (TL MO 137.6 ± 2.5 ms vs. casper MO 123.3 ± 2.6 ms, p ≤ 0.05; TL PAB 138.6 ± 2.1 ms vs casper PAB 117.9 ± 7.2 ms, p ≤ 0.01) and in the ventricle (TL MO 120.8 ± 2.9 ms vs. casper MO 98.20 ± 2.9 ms, p ≤ 0.0001; TL PAB 119.8 ± 1.7 ms vs casper PAB 97.71 ± 3.5 ms, p ≤ 0.001) (Figure S6C). No difference in Ca2+ transient upstroke time between embryonic casper and TL fish was observed (Figure S6B). In addition, the type of contraction block seemed to have no effect on Ca2+ dynamics, as MO- and PAB-treated fish of the same strain demonstrated a similar Ca2+ transient frequency, Ca2+ transient upstroke time and Ca2+ transient recovery time (Figure S6A-C).
In vivo recording of Ca2+ dynamics in embryonic and juvenile casper GCaMP6f fish. (A) Visual representation of the imaging plane in 14 dpf juvenile casper-GCaMP6f hearts. The same widefield high-speed epifluorescence microscopy setup was used as in 3 dpf embryos. (B) Movies of almost silent GCaMP6f juvenile hearts were recorded and signal analysis demonstrated a clear oscillatory cpEGFP (GCaMP6f) Ca2+ signal in the selected atrial or ventricular region. (C-D) Representative examples of normalized oscillatory atrial (C) and ventricular (D) GCaMP6f signals from 3 and 14 dpf PAB-treated casper hearts, showing the Ca2+ transient dynamics over time. (E) Schematic representation of analyzed Ca2+ transient parameters. Bar graphs (mean ± SEM) demonstrating the speed in Ca2+ transient upstroke and recovery phase, compared between chambers and age (3 dpf n=7, 14 dpf n=3), showing a significant faster Ca2+ transient upstroke in the atrium compared to the ventricle, in both 3 dpf (p≤0.0001) and 14 dpf casper fish (p≤0.01). The recovery phase is significantly slower in 14 dpf casper fish compared to 3dpf casper fish, both in the atrium (p≤0.0001) and the ventricle (p≤0.0001). Also, the Ca2+ transient recovery phase is slower in the atrium compared to the ventricle, both in 3 dpf and 14 dpf fish (p≤0.05) (mean ± SEM, one-way ANOVA).
Discussion
Experimental animal models have been instrumental for the development of our understanding of cardiac cellular electrophysiology and the pathophysiology of cardiac arrhythmias. In general, in vivo assays are mainly used to study global multicellular cardiac electrophysiology, while in vitro and ex vivo experiments allow detailed research into cardiac cellular electrophysiology. Unfortunately, it is extremely difficult to study cardiac cellular electrophysiology in the context of the whole body, as the heart is simply not accessible within a closed thoracic cavity. Here, we describe the generation and validation of two transgenic zebrafish lines that can be used to study in vivo cardiac cellular electrophysiology by reporting cardiac membrane voltage (via the chimeric VSFP-butterfly CY sensor) and cytosolic Ca2+ dynamics (via the GCaMP6f sensor).
During the past decades, the zebrafish has emerged as a powerful model to study human disease due to its small size, optical accessibility and ease of genetic engineering. Zebrafish can be used to test mechanisms of disease in vivo, especially through genotype-phenotype screens, and they also are an efficient and suitable model to screen large libraries of chemical compounds [6]. Large-scale chemical screens are very appealing, as they would allow for fast and economical surveys to identify novel compounds that could benefit patients. Mutagenesis in zebrafish has improved markedly in the past few years due to development of the CRISPR/Cas9 technique and it is even possible to generate fish carrying patient-specific mutations [27]. In future studies, combining the VSFP-butterfly and/or the GCaMP6f transgenic line with zebrafish carrying a loss of function or a specific patient mutation could provide unique information about the impact of mutations on cardiac electrophysiology.
In this study, we validated the reliability and robustness of both the VSFP-butterfly and GCaMP6f sensor lines through treatment of 3 dpf embryos with well-studied (golden standard) drugs. The β-adrenergic agonist isoproterenol and the β-adrenergic antagonist propranolol were used to test the sensitivity of the 3 dpf embryonic zebrafish heart to modulation of sympathetic tone. In line with literature, isoproterenol increased heart rate and enhanced intracellular Ca2+ dynamics [28], while propranolol had the opposite effect. In general, β-adrenergic stimulation in human cardiomyocytes also decreases APD [29], which we did not observe in the zebrafish heart. However, this could be due to baseline heterogeneity in AP contour between species [30]. Strikingly, the response to propranolol was much more prominent than the response to isoproterenol in 3 dpf embryos (especially at 28 °C), possibly indicating that at this developmental stage the sympathetic tone is higher than the parasympathetic tone. In line with this, Schwerte et al. demonstrated that the vagal tone is not very pronounced in zebrafish embryos until ±11-12 dpf [31], and heart rates recorded in adult zebrafish (100 days, 28 °C) are reported to be around 130 bpm, which is much lower than the 180-200 bpm average we find in 3 dpf embryos [32] suggesting that the vagal tone is not fully developed at 3 dpf.
In line with literature, the hERG ion channel blocker E-4031 clearly prolonged APD [33]. A similar response has been described in isolated atrial and ventricular cardiomyocytes from adult zebrafish [13]. E-4031 also significantly decreased heart rate, an observation we did not expect as the hERG channel is not typically associated with mammalian SA node electrophysiology. However, literature provides more reports of bradycardia-inducing effects by QT-prolonging drugs in zebrafish embryos, as well as reports of LQT2 patients with bradycardia carrying a hERG mutation [12,34,35].
Nifedipine largely blocked Ca2+ transients, disrupted atrial-ventricular electrical conduction and mainly affected action potential configuration in the ventricle, with relatively little effect in the atrium. It is known that zebrafish express both L-type (LTCC) and T-type Ca2+ channels (TTCC), which distinguishes them from mammals, as mammals only express LTCC in the working myocardium of the heart. Dominance of the LTCC in the zebrafish ventricle, but not in the atrium, could explain why we see a more pronounced effect of nifedipine on the ventricle. Indeed, island beat zebrafish embryos with a loss of function mutation in the gene encoding the zebrafish LTCC, have a chaotically beating atrium but a completely silent ventricle [36]. In addition tomo-seq, a technique that provides spatial information on RNA expression, indeed demonstrated a clear expression dominance of LTCC in the ventricle, but not in the atrium at 2 dpf [37].
In this study, we also demonstrated the first successful use of optogenetic sensors in 14 dpf juvenile zebrafish by crossing our tg(myl7:Gal4FF;UAS:GCaMP6f) line with transparent casper fish. While 3 dpf embryos remain easier to manipulate and provide a fast way to screen for the effects of mutations or drugs, juvenile fish provide an excellent tool to measure electrophysiology in a more mature system. This can be extremely helpful, for instance when a mutation only results in a phenotype after the embryonic stages. Our data demonstrate that the Ca2+ transient upstroke time is similar in both the atrium and ventricle of 3 dpf and 14 dpf fish, but the Ca2+ transient recovery time is significantly longer in 14 dpf fish. One possible explanation is the physiological decrease in heart rate from 200-250 bpm at 3 dpf to approximately 150-180 bpm at 14 dpf, as it may influence the speed of Ca2+ release and recovery. It is also possible that this decrease in Ca2+ transient recovery time is an effect of cardiomyocyte maturation, but this can only be confirmed with recordings that have similar Ca2+ transient frequencies.
Ultimately, it would be favorable to combine these high-sensitivity voltage and Ca2+ sensors into one zebrafish line, as it will allow for a one-on-one comparison and it will diminish the influence of genetic heterogeneity between zebrafish lines on experimental outcomes. In terms of fluorescence spectra, it would be a possibility to combine chimeric VSFP-butterfly with RCaMP2, a red variant of GCaMP. The concept of a dual-sensor fish is not novel, as Hou et al. presented simultaneous mapping of membrane voltage and Ca2+ using a genetically encoded dual-function Ca2+ and voltage reporter (CaViar) [38]. This dual-sensor fish is very promising; however, its dim opsin voltage signal (30-80 times dimmer than EGFP) makes imaging highly challenging and detailed APD analyses complicated.
Another previously reported zebrafish line used the VSFP2 type voltage indicator termed Mermaid. While it was shown that Mermaid can report in vivo cardiac membrane voltage [39], this voltage sensor has slow kinetics, with a τoff of >60 ms [40] as compared to 14.6±0.5 ms in the chimeric VSFP-butterfly [20] used here, resulting in reduced temporal resolution of the voltage report.
In conclusion, by introducing the optogenetic sensors chimeric VSFP-butterfly CY and GCaMP6f into the zebrafish heart we successfully generated two tools capable of reporting in vivo cellular electrophysiological characteristics. Parallel use of both sensors showed the ability to study heart rate, cardiac AP configuration, spatiotemporal patterning of electrical activation and intracellular Ca2+ dynamics. In addition, we demonstrated the first successful use of an optogenetic sensor in juvenile zebrafish, opening new possibilities for electrophysiological research. Due to the fast kinetics and high-resolution signals of both sensors, chimeric VSFP-butterfly CY and GCaMP6f zebrafish provide promising models to study electro(patho)physiology and to search for novel drugs that could aid patients with cardiac arrhythmias.
Limitations
Validation of the sensors via side-by-side comparison to an established method, such as current clamp recording, was not performed in this study. However, these recordings are very challenging when performed in vivo and the temporal resolution of chimeric VSFP-butterfly CY and GCaMP6f have been characterized in several earlier studies. Another limitation of our study is the use of a total contraction block to prevent movement artifacts, despite its necessity for the accurate assessment of fluorescence signals over time. The effects of normal cardiac contractile function and hemodynamic load on electrophysiological and Ca2+ transient properties via e.g., mechano-electrical feedback mechanisms could therefore not be taken into account. Another challenge is the very fast nature of the AP upstoke phase (less than 2 ms). While chimeric VSFP-butterfly CY has excellent kinetics (τon 2.3±0.2 ms), the upstroke phase is simply too fast for accurate tracing with the imaging strategy used in this study (for example the camera exposure time (10 ms) is longer than the AP upstroke time). Consequently, we have not addressed AP upstroke velocity in this study.
Abbreviations
A: atrium; AP: action potential; APD: action potential duration; AU: arbitrary units; BDM: 2,3-Butanedione 2-monoximel; bpm: beats per minute; Ca2+: calcium; CY: cyan-yellow: mCitrine/mCerulean; dpf: days post-fertilization; GECI: genetically encoded calcium indicator; GEVI: genetically encoded voltage indicator; MO: morpholino; PAB: para-amino-blebbistatin; PTU: 1-phenyl-2-thiourea; TL: Tupfel long fin; V: ventricle; VSFP: voltage-sensitive fluorescent protein.
Supplementary Material
Supplementary figures.
Supplementary movie 1.
Supplementary movie 2.
Supplementary movie 3.
Supplementary movie 4.
Acknowledgements
We acknowledge the support from The Netherlands Cardio Vascular Research Initiative (CVON): the Dutch Heart Foundation, Dutch Federation of University Medical Centres, the Netherlands Organization for Health Research and Development and the Royal Netherlands Academy of Sciences (CVON-PREDICT). This work was supported by the Champalimaud Foundation, ZonMW grant 40-00812-98-12086, the ERA-NET Cofund action N° 643578 under the European Union's Horizon 2020 research and innovation programme and national funding organisations Canadian Institutes for Health Research (CIHR), the Netherlands Organization for Health Research and Development (ZonMw), Belgium (Flanders) Research Foundation Flanders (FWO), and French National Research Agency (ANR). We thank Mr. Jiuru Li for carefully proofreading the manuscript.
Competing Interests
The authors have declared that no competing interest exists.
References
1. Kang C, Brennan JA, Kuzmiak-Glancy S, Garrott KE, Kay MW, Efimov IR. Technical advances in studying cardiac electrophysiology - Role of rabbit models. Prog. Biophys. Mol. Biol. 2016;121:97-109
2. Kass DA, Hare JM, Georgakopoulos D. Murine cardiac function: a cautionary tail. Circulation Research. 1998;82:519-22
3. Glukhov AV, Flagg TP, Fedorov VV, Efimov IR, Nichols CG. Differential K(ATP) channel pharmacology in intact mouse heart. Journal of Molecular and Cellular Cardiology. 2010;48:152-60
4. Milani-Nejad N, Janssen PML. Small and large animal models in cardiac contraction research: advantages and disadvantages. Pharmacol. Ther. 2014;141:235-49
5. Lelovas PP, Kostomitsopoulos NG, Xanthos TT. A comparative anatomic and physiologic overview of the porcine heart. J. Am. Assoc. Lab. Anim. Sci. 2014;53:432-8
6. Lieschke GJ, Currie PD. Animal models of human disease: zebrafish swim into view. Nat. Rev. Genet. 2007;8:353-67
7. Hu N, Sedmera D, Yost HJ, Clark EB. Structure and function of the developing zebrafish heart. Anat. Rec. 2000;260:148-57
8. Stoyek MR, Croll RP, Smith FM. Intrinsic and extrinsic innervation of the heart in zebrafish ( Danio rerio). J. Comp. Neurol. 2015;523:1683-700
9. Tessadori F, van Weerd JH, Burkhard SB, Verkerk AO, de Pater E, Boukens BJ. et al. Identification and functional characterization of cardiac pacemaker cells in zebrafish. PLoS ONE. 2012;7:e47644
10. Arnaout R, Ferrer T, Huisken J, Spitzer K, Stainier DYR, Tristani-Firouzi M. et al. Zebrafish model for human long QT syndrome. Proc. Natl. Acad. Sci. U.S.A. 2007;104:11316-21
11. Milan DJ, Jones IL, Ellinor PT, MacRae CA. In vivo recording of adult zebrafish electrocardiogram and assessment of drug-induced QT prolongation. Am. J. Physiol. Heart Circ. Physiol. 2006;291:269-73
12. Milan DJ, Peterson TA, Ruskin JN, Peterson RT, MacRae CA. Drugs that induce repolarization abnormalities cause bradycardia in zebrafish. Circulation. 2003;107:1355-8
13. Nemtsas P, Wettwer E, Christ T, Weidinger G, Ravens U. Adult zebrafish heart as a model for human heart? An electrophysiological study. Journal of Molecular and Cellular Cardiology. 2010;48:161-71
14. Verkerk AO, Remme CA. Zebrafish: a novel research tool for cardiac (patho)electrophysiology and ion channel disorders. Front. Physiol. 2012;3:255
15. Muntean BS, Horvat CM, Behler JH, Aboualaiwi WA, Nauli AM, Williams FE. et al. A Comparative Study of Embedded and Anesthetized Zebrafish in vivo on Myocardiac Calcium Oscillation and Heart Muscle Contraction. Front Pharmacol. 2010;1:139
16. Stosiek C, Garaschuk O, Holthoff K, Konnerth A. In vivo two-photon calcium imaging of neuronal networks. Proc. Natl. Acad. Sci. U.S.A. 2003;100:7319-24
17. Liao M-LC, de Boer TP, Mutoh H, Raad N, Richter C, Wagner E. et al. Sensing Cardiac Electrical Activity With a Cardiac Myocyte-Targeted Optogenetic Voltage Indicator. Circulation Research. 2015;117:401-12
18. Koopman CD, Zimmermann WH, Knöpfel T, de Boer TP. Cardiac optogenetics: using light to monitor cardiac physiology. Basic Res. Cardiol. 2017;112:56
19. Kaestner L, Scholz A, Tian Q, Ruppenthal S, Tabellion W, Wiesen K. et al. Genetically encoded Ca2+ indicators in cardiac myocytes. Circulation Research. 2014;114:1623-39
20. Mishina Y, Mutoh H, Song C, Knöpfel T. Exploration of genetically encoded voltage indicators based on a chimeric voltage sensing domain. Front. Mol. Neurosci. 2014;7:78
21. Chen T-W, Wardill TJ, Sun Y, Pulver SR, Renninger SL, Baohan A. et al. Ultrasensitive fluorescent proteins for imaging neuronal activity. Nature. 2013;499:295-300
22. Westerfield M. The Zebrafish Book. 4 ed. University of Oregon Press, Eugene. 2000
23. Sehnert AJ, Huq A, Weinstein BM, Walker C, Fishman M, Stainier DYR. Cardiac troponin T is essential in sarcomere assembly and cardiac contractility. Nature Genetics. 2002;31:106-10
24. Várkuti BH, Képiró M, Horváth IÁ, Végner L, Ráti S, Zsigmond Á. et al. A highly soluble, non-phototoxic, non-fluorescent blebbistatin derivative. Sci Rep. 2016;6:26141
25. D'Agati G, Beltre R, Sessa A, Burger A, Zhou Y, Mosimann C. et al. A defect in the mitochondrial protein Mpv17 underlies the transparent casper zebrafish. Dev. Biol. 2017;430:11-7
26. White RM, Sessa A, Burke C, Bowman T, LeBlanc J, Ceol C. et al. Transparent adult zebrafish as a tool for in vivo transplantation analysis. Cell Stem Cell. 2008;2:183-9
27. Liu J, Zhou Y, Qi X, Chen J, Chen W, Qiu G. et al. CRISPR/Cas9 in zebrafish: an efficient combination for human genetic diseases modeling. Hum. Genet. 2017;136:1-12
28. Shen J-X. Isoprenaline enhances local Ca2+ release in cardiac myocytes. Acta Pharmacol. Sin. 2006;27:927-32
29. Taggart P, Sutton P, Chalabi Z, Boyett MR, Simon R, Elliott D. et al. Effect of adrenergic stimulation on action potential duration restitution in humans. Circulation. 2003;107:285-9
30. Sala L, Hegyi B, Bartolucci C, Altomare C, Rocchetti M, Váczi K. et al. Action potential contour contributes to species differences in repolarization response to β-adrenergic stimulation. Europace. 2017;67:615
31. Schwerte T, Prem C, Mairösl A, Pelster B. Development of the sympatho-vagal balance in the cardiovascular system in zebrafish (Danio rerio) characterized by power spectrum and classical signal analysis. J. Exp. Biol. 2006;209:1093-100
32. Barrionuevo WR, Burggren WW. O2 consumption and heart rate in developing zebrafish (Danio rerio): influence of temperature and ambient O2. Am. J. Physiol. 1999;276:505-13
33. Sanguinetti MC, Tristani-Firouzi M. hERG potassium channels and cardiac arrhythmia. Nature. 2006;440:463-9
34. Yoshida H, Horie M, Otani H, Kawashima T, Onishi Y, Sasayama S. Bradycardia-induced long QT syndrome caused by a de novo missense mutation in the S2-S3 inner loop of HERG. Am. J. Med. Genet. 2001;98:348-52
35. Melong N, Steele S, MacDonald M, Holly A, Collins CC, Zoubeidi A. et al. Enzalutamide inhibits testosterone-induced growth of human prostate cancer xenografts in zebrafish and can induce bradycardia. Sci Rep. 2017;7:14698
36. Rottbauer W, Baker K, Wo ZG, Mohideen MA, Cantiello HF, Fishman MC. Growth and function of the embryonic heart depend upon the cardiac-specific L-type calcium channel alpha1 subunit. Dev. Cell. 2001;1:265-75
37. Burkhard SB, Bakkers J. Spatially resolved RNA-sequencing of the embryonic heart identifies a role for Wnt/β-catenin signaling in autonomic control of heart rate. Elife. 2018;7:971
38. Hou JH, Kralj JM, Douglass AD, Engert F, Cohen AE. Simultaneous mapping of membrane voltage and calcium in zebrafish heart in vivo reveals chamber-specific developmental transitions in ionic currents. Front. Physiol. 2014;5:344
39. Tsutsui H, Higashijima S-I, Miyawaki A, Okamura Y. Visualizing voltage dynamics in zebrafish heart. J. Physiol. (Lond.). 2010;588:2017-21
40. Mutoh H, Perron A, Dimitrov D, Iwamoto Y, Akemann W, Chudakov DM. et al. Spectrally-resolved response properties of the three most advanced FRET based fluorescent protein voltage probes. PLoS ONE. 2009;4:e4555
Author Biographies
Teun P. de Boer received his PhD on cardiac stem cells in 2007 from Utrecht University, the Netherlands. In his first postdoc, he focused on IK1 pharmacology. He continued his work as a postdoc in the lab of Dr. Peter Kohl at the University of Oxford. In 2009 he returned to the department of Medical Physiology at UMC Utrecht, the Netherlands to study the usefulness of stem cell-derived cardiomyocytes as a model for safety pharmacology and cardiac applications of optogenetics. In 2011, he was appointed Assistant Professor at UMC Utrecht to study nuclear calcium dynamics in cardiomyocytes.
Jeroen Bakkers received his PhD on zebrafish development in 2000 from Leiden University, The Netherlands. He continued his work on zebrafish development as a postdoc in the lab of Matthias Hammerschmidt at the Max-Planck Institute for Immunobiology in Freiburg, Germany. In 2003 he was appointed to the Hubrecht Institute initially as a junior staff member and in 2008 as a senior staff member and initiated there his work on heart development using zebrafish. In 2015, he was appointed Professor of Molecular Cardiogenetics at UMC Utrecht.
Chantal J.M. van Opbergen obtained her master's degree at the University Utrecht in the Netherlands in 2015. She is currently a PhD student under the supervision of Prof. Toon van Veen. Her research is centered on the role of calcium-sensitive pathways in arrhythmogenic cardiomyopathy.
Charlotte D. Koopman obtained her master's degree at the Utrecht University in the Netherlands in 2013. She is currently a PhD student under the supervision of Assistant Professor Teun de Boer and Prof. Jeroen Bakkers. Her research is centered on the genetic background of cardiac arrhythmias using the zebrafish as a model organism.
![]() Corresponding author: Teun P. de Boer, PhD. Department of Medical Physiology, University Medical Center Utrecht, Yalelaan 50, 3584 CM, Utrecht, The Netherlands. Tel: +31 (0)30 2538900, Fax: +31 (0)30 2539036, Email: t.p.deboernl
Corresponding author: Teun P. de Boer, PhD. Department of Medical Physiology, University Medical Center Utrecht, Yalelaan 50, 3584 CM, Utrecht, The Netherlands. Tel: +31 (0)30 2538900, Fax: +31 (0)30 2539036, Email: t.p.deboernl