Theranostics
13.3
Impact Factor
- Current Issue
- Advance Articles
- Volume 16; 2026
- Volume 15; 2025
- Volume 14; 2024
- Volume 13; 2023
- Volume 12; 2022
- Archive
- Cover Images
- Cover Suggestion
- Special Issues
Top
Introduction
Results and Discussion
Conclusion
Methods
Abbreviations
Supplementary Material
Acknowledgements
References
Introduction
Results and Discussion
Conclusion
Methods
Abbreviations
Supplementary Material
Acknowledgements
References
International Journal of Biological Sciences
International Journal of Medical Sciences
 Global reach, higher impact

Theranostics 2018; 8(18):4870-4883. doi:10.7150/thno.27466 This issue Cite
Research Paper
Platelet bio-nanobubbles as microvascular recanalization nanoformulation for acute ischemic stroke lesion theranostics
Mingxi Li1,2, Yang Liu1,2, Jinpeng Chen3, Taotao Liu1, Zhuxiao Gu2, Jianqiong Zhang3, Xiaochun Gu4, Gaojun Teng4, Fang Yang1,2 ![]() , Ning Gu1,2
, Ning Gu1,2 ![]()
1. State key Laboratory of Bioelectronics, Jiangsu Key Laboratory for Biomaterials and Devices, School of Biological Sciences & Medical Engineering, Southeast University, Nanjing, 210096, China
2. Collaborative Innovation Center of Suzhou Nano-Science and Technology, Southeast University, Suzhou 215123, China
3. Jiangsu Key Laboratory of Molecular and Functional Imaging, Department of Microbiology and Immunology, Medical School, Southeast University, Nanjing 210009, China
4. Jiangsu Key Laboratory of Molecule and Functional Imaging, Department of Radiology, Zhongda Hospital, Medical Schoool, Southeast University, Nanjing 210009, PR China
Received 2018-5-25; Accepted 2018-8-2; Published 2018-9-9
Citation:
Li M, Liu Y, Chen J, Liu T, Gu Z, Zhang J, Gu X, Teng G, Yang F, Gu N. Platelet bio-nanobubbles as microvascular recanalization nanoformulation for acute ischemic stroke lesion theranostics. Theranostics 2018; 8(18):4870-4883. doi:10.7150/thno.27466. https://www.thno.org/v08p4870.htm
Other stylesAbstract

Since the expected therapeutic results of ischemic stroke are strictly time dependent, early and accurate diagnosis as well as short intervals between diagnosis and treatment are key factors for the survival of stroke patients. In this study, we fabricated platelet (PLT) membrane-derived biomimetic nanobubbles (PNBs) for timely perfusion intervention and ultrasound imaging of acute ischemic stroke.
Methods: The PNBs are fabricated by sonication-assisted reassembly of repeatedly freeze-thawed live platelet-derived PLT membrane vesicles (PMVs). The TEM, SEM, EDS and DLS were used to analyze the morphology and physicochemical properties of PNBs. The HPLC and LC-MS/MS were applied to confirm the lipid and protein compositions of PNBs. The in vitro macrophage uptake and platelet aggregation of PNBs were designed to examine the immune escape and thrombotic response characteristics. Furthermore, based on a photothrombotic ischemic stroke mouse model, the biodistribution, stroke microvascular network change, as well as cerebral blood flow of PNBs were studied by using near-infrared fluorescence imaging, multimodal optical imaging, and full-field laser perfusion imager. Finally, we assessed the brain ultrasound imaging of PNBs with a high-resolution micro-imaging system using both B-mode and contrast mode.
Results: The natural lipid and protein components isolated from PLT membrane endow the PNBs with accurate lesion-targeting ability. The preferentially accumulated PNBs exhibit microvascular bio-remodeling ability of the stroke lesion, which is critical for recanalization of the obstructed vessels to protect the neural cells around the ischemic region of the stroke. Furthermore, with the increased accumulation of PNBs clusters in the lesion, PNBs in the lesion can be monitored by real-time contrast-enhanced ultrasound imaging to indicate the severity and dynamic development of the stroke.
Conclusions: In summary, platelet membrane-based nanobubbles for targeting acute ischemic lesions were developed as microvascular recanalization nanoformulation for acute ischemic stroke lesion theranostics. This biomimetic PNBs theranostic strategy will be valuable for ischemic stroke patients in the future.
Keywords: Platelet membrane, nanobubbles, stroke targeting, neuroprotection, ultrasound imaging
Introduction
Stroke is a cerebrovascular accident with high morbidity, disability rate, and medical costs [1,2]. During an ischemic stroke, the blood flow to the brain is occluded owing to blockage of an artery by a thrombus [3]. Irreversible neurological damage may be avoided only if the ischemia-causing blocked blood vessels are reperfused as quickly as possible within a narrow therapeutic time window (normally within 4.5 h) [4-6]. Therefore, time is very crucial for treating acute ischemic stroke patients with intravenous thrombolytic therapy. In 2013, the American Heart Association/American Stroke Association guidelines for the early management of patients with acute ischemic stroke recommended that the “door-to-needle” time (time of bolus administration) should be within 1 h from hospital arrival [7,8]. Both early recanalization and neuroprotection have been considered as two major approaches to treat acute ischemic stroke during this process. Given the narrow therapeutic time window for the treatment of acute ischemic stroke, timely diagnosis and rapid cerebral blood flow recovery and/or microcirculation remodeling are crucial for stroke outcome [9]. An accurate theranostic strategy can provide important structural/functional characteristics for effective stroke therapies to rehabilitate the brain's functions.
Nanomaterials used for medical purposes have led to revolutionary advances in the diagnosis and treatment of devastating human diseases because they can be tailored to induce desired physiological responses in in vivo microenvironment while minimizing unwanted side effects [10,11]. Quantum dots, nanowires, carbon nanotubes, liposomes, dendrimers, micelles, and fullerenes have been applied for treatment and neuronal regeneration following ischemic stroke [12-15]. However, nanomaterial-based stroke therapy is still limited because of their neurotoxicity, low permeability of the blood-brain barrier (BBB), specificity, bioavailability, and short half-lives. More importantly, the lack of effective and real-time non-invasive imaging to monitor the lesion may result in inaccurate and unsafe stroke treatment.
On the basis of the inherent properties of platelets (PLTs) in binding to injured vasculature [16,17], we first propose a new kind of PLT membrane-derived biomimetic nanobubble (PNB) for the early recanalization and ultrasound imaging of obstructed vessels. The PNBs are fabricated by sonication-assisted reassembly of repeatedly freeze-thawed live platelet-derived PLT membrane vesicles (PMVs). Taking advantage of the excellent compositional and structural precision of the natural PLT membrane, as exemplified in Figure 1, PNBs could naturally target brain occlusions from the onset of stroke due to the natural vessel adhesive components such as α2β1, α5β1, α6β1, and αⅡbβ3 and the glycoprotein GPIb-IX-V and GPVI on the membrane shell of PNBs. Interestingly, recanalization of damaged vasculature and remodeling of microvessels in the stroke lesion were observed by multimodal optical imaging. The detectable increase in blood flow reperfusion in the stroke lesion further demonstrates their neuroprotection potential to avoid irreversible brain damage. With increased accumulation of PNBs clusters in the lesion, real-time contrast-enhanced ultrasound imaging can be used to monitor the severity and dynamic development of the stroke. Thus, the PNBs quickly target the damaged vessels to recanalize the stroke lesion microvasculature, which could achieve clinical benefits to extend the “door-to-needle” streamline in the future. Simultaneously, accumulation of nanobubbles in the stroke lesion may facilitate identification of the stroke thrombus site or hemorrhagic rupture point. This could, in real-time, reflect the dynamic structural nature of the recanalization process for subsequent therapeutic strategies.
Figure 1
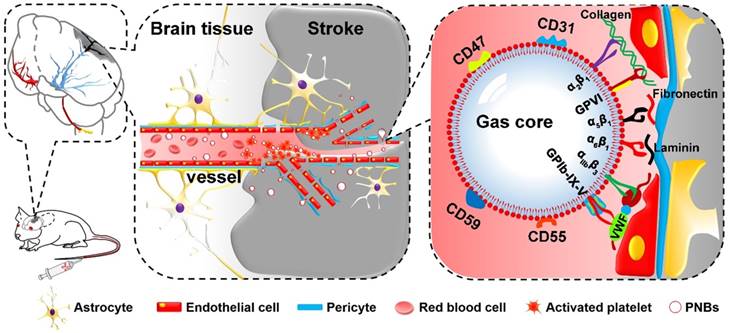
Schematic diagram of PNBs serving as a neuroprotective nanoformulation for acute ischemic stroke lesion theranostics. Both the “marker of self” membrane proteins in the shell of PNBs and their nano size facilitate specific delivery into stroke lesion microvascular vessels. Integrins such as α2β1, α5β1, α6β1, and αⅡbβ3 and the glycoproteins (GP) Ib-IX-V and GPVI impart the PNBs with intrinsic damaged vessel adhesive ability. The CD47 membrane protein could prevent phagocytosis by macrophages, while the CD55 and CD59 complement regulatory proteins may suppress complement system activation when PNBs circulate in the body.
Results and Discussion
Characterization of PNBs assembly
Figure 2A shows the surface structural characterization of PLTs, PMVs, and PNBs by scanning electron microscopy (SEM). As shown in the figure, the PNBs are spherical in shape with nanometer sizes. Figure 2B shows the transmission electron microscopy (TEM) images of natural PLTs (which have a smooth and spherical shape with non-aggregated morphology and various organelles) and PMVs (which have a main membrane and an irregularly shaped vesicular structure without observable organelles). Clearly, the PNBs exhibit a spherical nanosized hollow morphology. Figure 2C demonstrates that all samples derived from PLTs possess similar surface charges. However, the significant decrease in the average diameter of PNBs (131.43 ± 19.84 nm) compared with PLTs (1.66 ± 0.094 μm) or PMVs (742.33 ± 8.81 nm) demonstrates that the nanobubbles were successfully assembled after sonication, which was also consistent with the structural changes shown in the confocal fluorescence images (Figure S1). The energy dispersive spectroscopy (EDS) analysis of PNBs (Figure 2D) exhibited the existence of C, O, F, and S elements, which demonstrates that the inner core of the PLT nanobubble comprises SF6 gas and the shell components of PNBs are derived from the PLT membrane.
Figure 2E shows the stability of PNBs in both phosphate-buffered saline (PBS) and fetal bovine serum (FBS). The diameter of PNBs in PBS and 10% FBS was approximately 130 and 80 nm, respectively, with no significant size change during the observation time of 12 h, which indicates that PNBs have good stability in the solutions. The colloidal stability of PNBs in FBS after 24 h was better than that of PNBs in PBS, which may be attributed to the natural stabilizing effect of the plasma membrane's components.
Figure 2
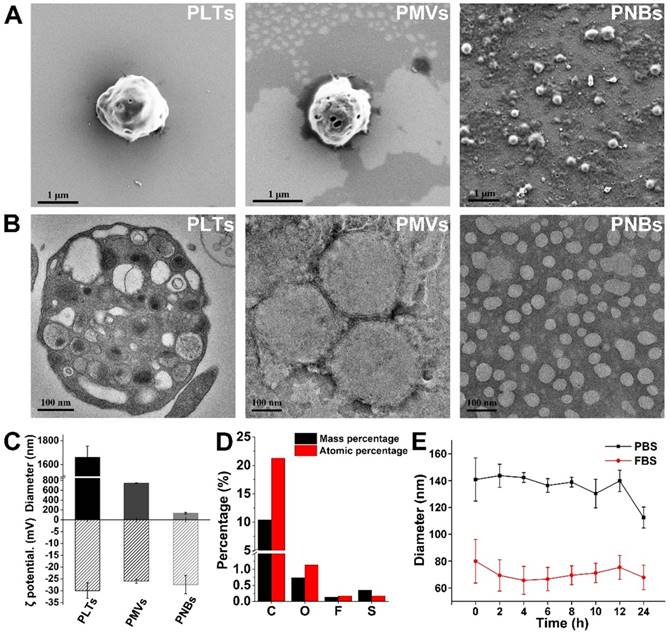
Characterization of the PLT membrane reassembled PNBs. (A) SEM images of PLTs, PMVs, and PNBs. (B) TEM images of PLTs, PMVs, and PNBs. (C) Mean diameter and surface charge (ζ potential) of PLTs, PMVs, and PNBs (n=3). (D) Elemental analysis results of PNBs by energy dispersive spectroscopy (EDS). (E) Size stability of PNBs in PBS and FBS over time.
Figure 3
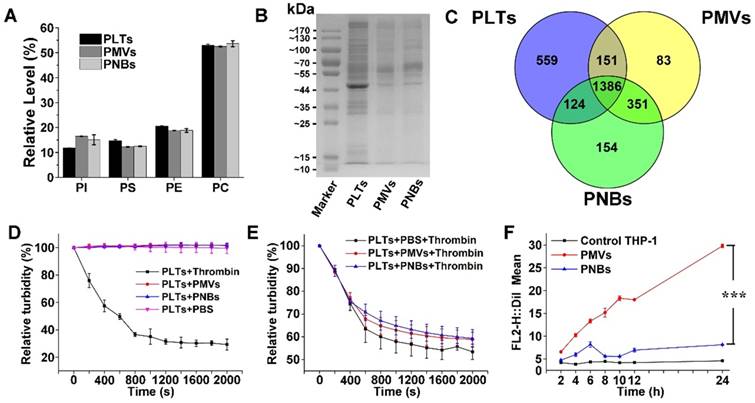
Component analysis and bio-function measurement of PNBs. Lipidomic analysis of major phospholipids (A) and representative protein bands in polyacrylamide gel electrophoresis of PLTs, PMVs and PNBs (B). (C) Venn diagram of identified proteins of PLTs, PMVs, and PNBs analyzed by LC-MS/MS. (D) Platelet aggregation assay in which citrate-stabilized platelet-rich plasma (PRP) was mixed with thrombin, PMVs, PNBs, and PBS. (E) Platelet aggregation assay of natural PLTs pre-mixed with PBS, PMVs, and PNBs activated by thrombin. (F) Flow cytometric analysis of DiI-labeled PLTs, PMVs and PNBs uptaken by human THP-1 macrophage-like cells. Bars represent mean ± s.d. (n=3).
Lipid and proteome analysis and macrophage uptake of PNBs
Lipid analysis of major types of phospholipids in PLTs, PMVs, and PNBs was performed using high-performance liquid chromatography (HPLC). The HPLC chromatograms of four major phospholipids including phosphatidylinositol (PI), phosphatidylserine (PS), phosphatidylethanolamine (PE), and phosphatidylcholine (PC) are shown in Figure S2, with retention times of 4.55, 9.54, 13.68, and 23.05 min, respectively. In Figure 3A, the relative amounts of phospholipids indicated the consistency of the phospholipid composition among PLTs, PMVs, and PNBs. The figure shows that the fabricated PNBs exhibit an accurate platelet cell membrane phospholipid component ratio.
To characterize the cell membrane protein components of the PNBs, polyacrylamide gel electrophoresis was used. The peptides derived from PLTs, PMVs, and PNBs were further analyzed by liquid chromatography-tandem mass spectrometry (LC-MS/MS). Although low-abundance proteins could not be clearly identified (Figure 3B), protein bands of leukocyte surface antigen CD47 (molecular weight 40-50 kDa), platelet adhesion receptors GPVI and GPIb-IX-V (molecular weight about 55 kDa), and complement decay-accelerating factor CD55 and CD59 proteins (molecular weight 60-70 kDa) were clearly observed and identified in the PNBs as shown in Figure 3B, Table S1 and Table S2. The CD47 membrane protein has been reported to prevent phagocytosis by macrophages while the CD55 and CD59 complement regulatory proteins may suppress complement system activation [18-20]. The existence of these membrane proteins may enable the PNBs to evade rapid clearance by the mononuclear phagocyte system (MPS). The glycoprotein GPIb-IX-V complex is a pivotal platelet receptor in initiating and propagating both hemostasis and thrombosis [21,22]; these glycoproteins identified in PNBs (Table S2) impart sub-endothelium binding property to PNBs and promote PNBs adhesion and aggregation at the sites of injured vessel.
In Figure 3C, the complementarity of the identified proteins in PLTs, PMVs, and PNBs is displayed via a Venn diagram. Compared with the original PLTs, the PNBs exhibited a 10% decrease in the number of identified total proteins. A total of 1510 proteins was identified between PLTs and PNBs, which occupied approximately 68% of the total identified proteins in the original PLTs, illustrating that most PLT membrane proteins remained in the PNBs.
Based on the above-mentioned lipid and proteome analysis, the in vitro thrombotic response of PLT solution activated by thrombin, PMVs, and PNBs is shown in Figure 3D. The natural PLTs are prone to be easily activated by thrombin. However, neither PMVs nor PNBs triggered activation of natural PLTs. Notably, decreased platelet activation was confirmed when PLTs were pre-incubated with PNBs before thrombin treatment (Figure 3E). The retention of vascular adhesion membrane proteins on the shell of PNBs shown in Table S2 could endow the PNBs with rapid targeting of injured blood vessel sites of stroke lesion. However, with no further degranulation release, the PNBs could not recruit fresh platelet aggregation and inhibit the further development of thrombus. Therefore, the administration of PNBs is believed to reserve natural thrombus-targeting protein receptors but could avoid thrombotic aggregation due to the inactivation of PNBs.
Currently, cell membrane-coated biomimetic delivery nanocarriers have offered new opportunities for prolonging circulation time, alleviating immunogenicity, and achieving active targeting ability [23,24]. Therefore, to examine the immune escape and long-term circulation of PNBs, the uptake of PMVs and PNBs by THP-1 (human macrophage-like cells) was analyzed. The uptake efficiency was determined by flow cytometry (Figure 3F and Figure S3), which measured the mean DiI fluorescence intensity of DiI-labeled PMVs and PNBs uptaken by THP-1 cells. For PMVs, the THP-1 cell uptake efficiency increased over time. After 12 h of incubation, the uptake was significantly enhanced. However, the fluorescence intensity of THP-1 cells incubated with PNBs showed no significant increase within 24 h, which could realize a prolonged half-life in vivo.
Biodistribution and stroke lesion microvascular recanalization of PNBs in vivo
The success of photothrombotic ischemic stroke in the mouse brain was confirmed by magnetic resonance imaging (MRI) (Figure S4A) and histological analysis of hematoxylin and eosin (HE)-stained brain sections (Figure S4B). The images of brain tissue slices show that normal brain tissue structure is integrated and dense, whereas damaged brain tissue is loose with micro-thrombi marked by red spots because of brain tissue necrosis due to ischemia. To determine the biodistribution of PNBs in vivo, DiR-labeled PMVs and PNBs were intravenously injected into stroke mice. The representative near-infrared (NIR) fluorescence images of the mouse brain at different time points (0, 0.5, 1, 2, 3, 4, 8, 12, and 24 h) are shown in Figure 4A. The results demonstrated that 0.5 h after the injection, the mice in the PNBs injection group displayed enhanced fluorescence signal in the brain area. The existence of PMVs in the brain was barely observed at this time point, demonstrating that PNBs could invade the brain and accumulate in the stroke lesions at the earliest stage of stroke onset. Moreover, the PNBs distribution in major organs, including the brain, liver, kidney, heart, lung, and spleen, was also evaluated by recording DiR fluorescence from the organs excised from mice after 8 h treatment (Figure 4B). DiR fluorescence was evident in the stroke area of excised brains when injected with PMVs and PNBs (2.61×10⁷ vs. 3.74×10⁷ (p/s/cm2/sr)/(μW/cm2), respectively). The ratio of PNBs to PMVs in the stroke lesion was 1.43.
The quantitative area-normalized DiR fluorescence intensities from brain regions of interest (ROIs) are shown in Figure 4C. During blood circulation, the fluorescence intensity in the brain region of the PNBs-injected mice peaked in 3 h and remained stable by imaging for 12 h. The fluorescence intensity of mice treated with PNBs was approximately 2.24 times higher than that of mice treated with PMVs 2 to 12 h post-injection. Compared with PMVs and PBS groups, the PNBs group demonstrated significant fluorescence signal enhancement in the brain with p-values of 0.011 and 0.007, respectively. To prove the stroke lesion targeting ability, the fluorescence intensity ratio of the right (stroke lesion) and left (normal) brain of mice was determined (Figure 4D). The fluorescence intensity ratio of the right/left brain among all PNBs-treated groups achieved 1.44 at 4 h injection compared with control groups. Retention of the PNBs in the right brain tissue suggested that PNBs specifically targeted the stroke lesion. All these results demonstrate that the PNBs exhibit enhanced efficiency to naturally target the lesion due to the presence of abundant “self-recognized” proteins on the PLT membrane (Figure 3B-C). The nanobubbles reassembled from PLT membranes still retained their thrombus-targeting ability and could accumulate in the stroke lesion site by intravenous injection.
Histological analysis of HE-stained brain sections was conducted using a confocal microscope to characterize the distribution of DiI-labeled PNBs in the brain. Compared with normal brain, the DiI-labeled PNBs demonstrated red fluorescent aggregates that were distributed in the section of ischemic brain lesion 8 h post-injection (Figure S5), which corresponds to the location of micro-thrombi. Almost no fluorescent spots were observed in the left normal brain tissue. No fluorescence signal was detected in the PMVs group (Figure S6) and PBS group (Figure S7) at this time point. These results further revealed that PNBs could accumulate within micro-thrombi sites. No obvious histopathological abnormalities or lesions were observed in the other main organs (liver, spleen, lung, and kidney, and brain) after PNBs treatment (Figure S8), implying low acute toxicity or low risk from PNBs.
Figure 4
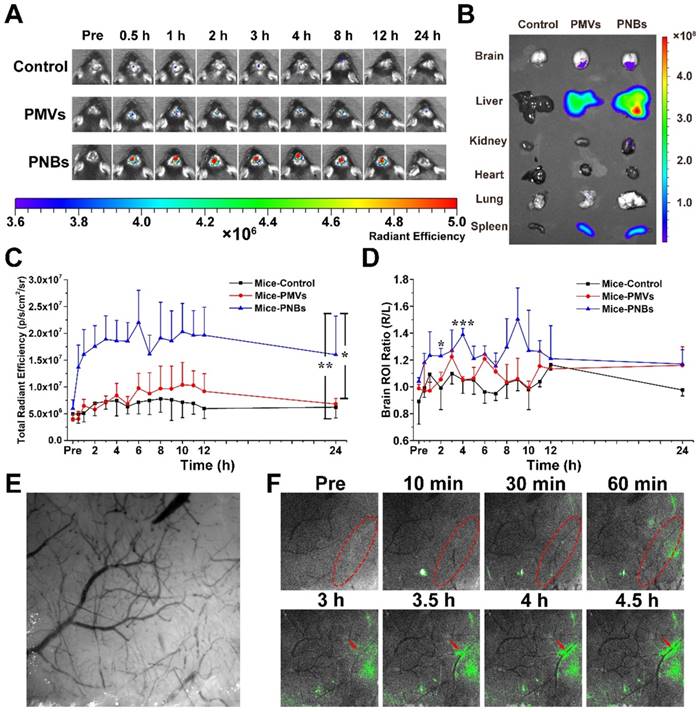
Biodistribution of PNBs in brain stroke. (A) Time course of DiR fluorescence images of stroke-bearing mice injected with PBS, DiR-coupled PMVs and PNBs over time. The color bars have units of radiant efficiency (p/s/cm2/sr)/(μW/cm2). (B) Ex vivo NIR fluorescence imaging of excised organs (liver, spleen, lung, kidney, heart, and brain) after 8 h injection of PBS, DiR-coupled PMVs and PNBs. (C) Quantitative chart showing the total brain DiR fluorescence intensities of mice injected with PBS, DiR-coupled PMVs and PNBs over time. (D) Quantitative chart showing the ratio of right (stroke) to left (normal) brain DiR fluorescence intensities of mice injected with PBS, DiR-coupled PMVs and PNBs over time. (E) Representative bright field image obtained at 560 nm for imaging the stroke vascular vessel network. (F) Fluorescence and bright field merged stroke vascular vessle images obtained following DiO-labled PNBs injection over time, indicating the spatial distribution of PNBs within the damaged vessels of the lesion. *p < 0.05, **p < 0.01, and ***p < 0.005.
Minimizing the time to restore blood flow to ischemic regions of the brain following stroke may be the critical portion of the subsequent therapy. In this study, a mouse stroke model was induced by photothrombotic induction of capillary ischemia in the mouse cortex [25,26]. This model induces platelet aggregation in the blood vessels to lead to blood vessel occlusion and form a cerebral infarct, which is similar to the middle cerebral artery occlusion model. Moreover, the infarct area of photothrombotic ischemia is located in the cortex, which is suitable for observation and determination of the diagnostic function of PNBs in microvascular thrombosis [27]. To visualize the targeting process of PNBs in the damaged microvascular vessels of the stroke lesion and dynamically observe the interaction between PNBs and neurovasculature within cerebral tissue of a living stroke mouse, multimodal optical fluorescence imaging was applied. DiO-labeled PMVs and PNBs were intravenously injected into stroke mice. The mice were repeatedly imaged over 5 h through a thinned cranial window with a typical field of view of ~3×3 mm2 at wavelengths of λ1 = 488 nm and λ2 = 560 nm. As shown in Figure 4E, the endovascular clot blocked the blood flow in the laser-irradiated artery due to the damaged microvascular morphology. Figure 4F shows representative cortical fluorescence images obtained from an animal injected with DiO-labeled PNBs at 0, 10, 30, and 60 min and 3, 3.5, 4, and 4.5 h postinjection. The images revealed that 10 min after PNBs injection, the fluorescence was visible in the stroke lesion area. Over time, the fluorescence in the damaged vessels became increasingly bright. Compared with the stroke mice injected with PBS (Figure S9A) and PMVs (Figure S9B), new vessel networks were clearly observed with the accumulation of PNBs, indicating local revascularization of the damaged vessels in the PNBs group. Therefore, the PNBs could be delivered into brain ischemia via collateral circulation in the vascular channels supplementing cerebral blood flow by actively enhancing thrombus-targeting efficacy. As shown in Table S2, the vascular adhesion, thrombus inhibition, and immunoglobulin-related receptor proteins for PLTs, PMVs and PNBs were identified by proteome measurement and analysis. The results indicate that the major PLT membrane receptors such as integrin beta-1 (α2β1, α5β1, α6β1) and integrin beta-3 (αⅡbβ3) and the glycoprotein (GP) IIb-IX-V and GPVI have been maintained in the shell of PNBs. Thus, the rapid targeting effect derived from these targeting ligands integrins naturally prompted accurate lesion affinity. With the accumulation of nanosized PNBs in the stroke lesion, a number of integrin activation and angiogenesis-related receptors [28,29] such as platelet endothelial cell adhesion molecule (PECAM-1) in PNBs provided additional neuroprotection for stroke injury because of the inhibition of blood platelet aggregation in damaged blood vessels. Thus, the targeted aggregation of PNBs in stroke lesion can provide some protective effect for ischemic damage.
Blood flow reperfusion in stroke lesion
As the relationship between neuronal activities and blood flow have been recognized for many years, visualizing blood perfusion is an indirect but standard method for observing brain function [30,31]. When blood flow in the ischemic core after focal ischemia is reduced, the lack of oxygen and glucose supply may rapidly impair the glial and/or neuronal cells [32]. To quantitatively observe the damaged vessel recanalization efficacy of PNBs in the stroke lesion microvascular vessels, we further used a full-field laser perfusion imager to examine the effect of PBS, PMVs, and PNBs on cerebral blood flow in anesthetized stroke mice. According to the timeline of stroke development in Figure 5A, PNBs may realize timely diagnosis and provide a neuroprotective effect, which can improve the stroke time window. Figure 5B shows representative color-coded photos taken at baseline (pre-injection) and 0, 10, 30, 60, and 120 min after injection of PBS, PMVs, and PNBs. Bright colors are associated with greater blood flow. Dynamic measurement within 10 min for PNBs (Figure 5C) indicates the influence of PNBs in the lesion area. Quantitative blood flow was immediately assessed following PBS, PMVs, and PNBs injection at 30, 60, and 120 min. After PNBs treatment, spontaneous reperfusion increased, and restoration of blood flow was confirmed at 30 min post-injection. However, for the control group injected with PBS and PMVs, the blood flow in the ischemic area showed no detectable increase, and the ischemic area expanded over time. The quantitative ratio of stroke lesion to normal brain area in the PNBs group (Figure 5D) indicates that the overall blood perfusion volume was 1.14-1.32 times higher than those of the PMVs and PBS groups within a 120 min observation time, demonstrating the lasting improvements in blood flow from the onset of stroke. This finding possibly stems from the detectable increase of spontaneous reperfusion on cerebral blood flow at 0 to 5 min following PNBs injection. As shown by the 2,3,5-triphenyltetrazolium chloride (TTC) staining (Figure 5E), the increase in spontaneous reperfusion after PNBs treatment led to a reduction in infarct growth. Compared with the control group (Figure S10), mice injected with PNBs showed less brain infarction volume (8.75 ± 1.09% vs. 16.27 ± 1.47%). Such timely enhancement of blood flow perfusion to the ischemic lesion exerts a beneficial effect on tissue survival by inhibiting further formation of infarcted tissue (Figure 5E), providing neuroprotective benefit during ischemic stroke. Thus, PNBs act as a vascular recanalization reperfusion agent and provide a profound impact on extending the therapeutic time window until appropriate therapy can be applied. Therefore, such PNBs formulation provides a versatile “time is brain” tool in future medical stroke therapy management.
PNBs-enhanced ultrasound imaging for stroke lesion
Finally, we assessed the in vivo brain ultrasound imaging. Based on the biodistribution results presented in Figure 4 and Figure 5, we confirmed that the intravenously injected PNBs could target the lesion blood vessels. We hypothesized that the stroke lesion area can be imaged in real time by contrast-enhanced ultrasound imaging due to the accumulation of PNBs, which form nanobubble clusters in the stroke lesion (Figure 6A). As shown in Figure 6B, contrast-enhanced ultrasound imaging was able to determine the location of the stroke region for the PNBs group compared with the PBS and PMVs groups (Figure S11 and Figure S12, respectively). Based on the intensity in the ROIs of the stroke lesion area, the quantitative contrast mean power value of ultrasound in the PNBs group (Figure 6C) demonstrated that the ultrasound signal began to be significantly enhanced 40 min after injection. The ultrasound signal for the PNBs group was almost 1.63 times higher than those of the PMVs and PBS groups. Although the optical imaging results proved that the PMVs could also accumulate inside the stroke area within 30 min post-injection, no significant ultrasound contrast-enhanced signals were found. The reason may be that at the beginning of PNBs injection, the number of nanosized PNBs was too small to be detected by the transducer. However, an increasing number of PNBs could passively and actively accumulate in the stroke site because of the thrombus-targeting effect of the PLT membrane-derived PNBs and their nanosize. The amalgamated nanobubble clusters in the lesion could actively produce acoustic scattering and be imaged by the ultrasound transducer. Thus, bubble-enhanced ultrasound imaging could be utilized to monitor the dynamic development of stroke.
Figure 5
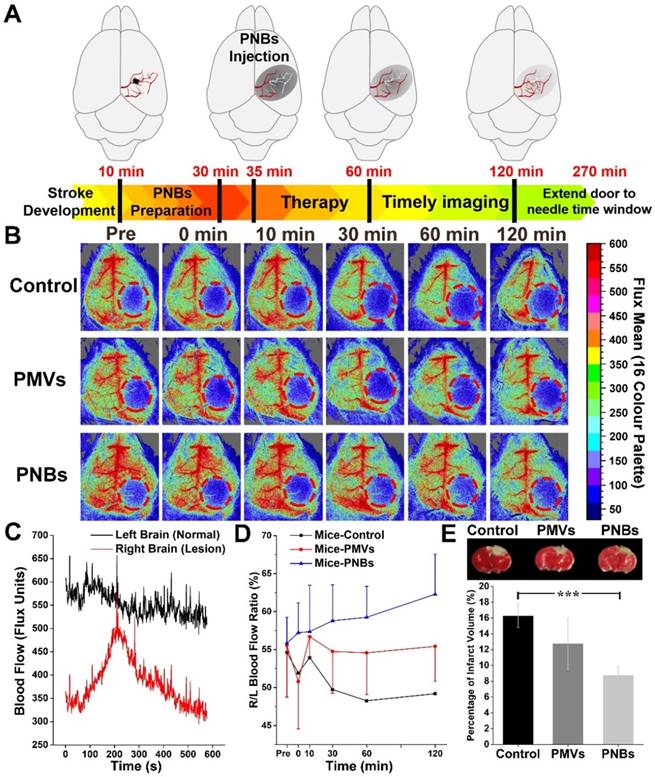
Stoke reperfusion assisted by the PNBs. (A) Schematic diagram of the PNBs fighting with time for rapid imaging and therapy of acute ischemia stroke within the timelines of stroke development. (B) Representative color-coded laser speckle images showing blood flow taken at baseline, 0, 10, 30, 60 and 120 min after injection of PBS, PMVs and PNBs. Brighter colors are associated with greater blood flow (red = high flow, blue = low flow) and the red circle indicates the location of the infarct. (C) The full-field laser perfusion imager dynamically and in real-time records the effects on cerebral blood flow of PNBs administered within 10 min after the onset of occlusion in stroke-bearing mice. (D) Maximum change ( %) in stroke lesion blood flow from baseline to 0, 10, 20, 30, 60 and 120 min following injection of PBS, PMVs and PNBs. (E) TTC staining showing infarct morphology and infarct volume divided by the total brain volume. The white area indicates the brain infarct size. Mice injected with PNBs showed less brain damage after the occlusion.
Figure 6
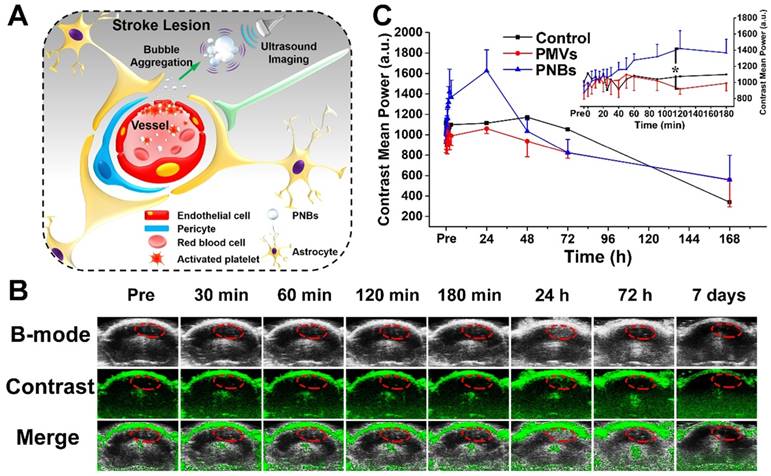
Stroke real-time contrast-enhanced ultrasound imaging. (A) Schematic representation of PNBs delivery across the blood-brain barrier and accumulation as nanobubble clusters in the stroke lesion, which then can be imaged using an 18 MHz ultrasonic transducer. (B) Time-dependent in vivo representative brain ultrasound images after intravenous injection of PNBs. (C) The average mean gray value of contrast-enhanced ultrasound imaging after injection of PBS, PMVs, and PNBs over time. *p < 0.05.
Clinically, the tissue plasminogen activator (tPA), an FDA-approved thrombolytic drug, shows proven efficacy for acute cerebral infarction [33]. Although the maximum fibrinolytic therapy time window has been extended to 4.5 h, guidelines recommend an arrival to treatment initiation (door-to-needle) time within 60 min [8]. Such narrow therapeutic index highlights the need to improve the current theranostic regimens for acute ischemic stroke. Without an effective in vivo imaging modality to provide clinicians with critical information on the size, location, and vascular distribution of the infarction, it is difficult to decide immediate and long-term treatment options. Diagnostic ultrasound can help identify the presence and location of the thrombus in intracranial vessels and can make it possible to monitor the progress of recanalization therapy [34]. However, the sensitivity and specificity of ultrasound for detecting lesions are poorer than those of other modalities [35]. The application of acoustic enhancing agents may effectively extend ultrasound techniques in neuroradiological imaging practice [36,37]. With the development of theranostic nanomedicines, echo-enhancing nanobubbles may permit the demonstration of early abnormalities of diffusion and perfusion during the progress of thrombolytic treatment in real time [38,39]. In the current study, we observed a robust enhancement on ultrasound imaging of nanobubbles derived from the natural PLT membranes. Detectable scattering was observed from the brain in nonlinear ultrasound contrast images. As expected, the prepared PNBs accumulated in the stroke lesion, revealed a steady state after 5 min, and then produced stable contrast for at least 4 h. Our technique could play an important role in supplying the clinician with real-time cerebral occlusion imaging. Thus, PNBs with such well-defined structure can be useful in helping to introduce modern ultrasound techniques as diagnostic procedures during the acute phase of stroke.
Conclusion
In summary, platelet membrane-based nanobubbles for targeting acute ischemic lesions were developed as a biomimetic material that can be used for early intervention in the development of acute ischemic stroke and as novel theranostic nanoformulations. As a biomimetic top-down strategy, the PLT membrane-reassembled nanobubbles maximally retain their thrombus-targeting ability to stroke lesion to effectively and rapidly conserve blood in the local ischemic lesion by mediating microcirculatory flow redistribution. Furthermore, by taking advantage of the specific affinity between PLT membrane and stroke thrombosis, as well as their nanoscale characteristics, the PNBs can accumulate and merge into larger bubbles over time, resulting in detectable ultrasound-enhanced signals in the stroke lesion, which could, in real-time, identify the dynamic structural nature of the stroke thrombus for subsequent therapeutic strategies. Therefore, the natural biointerfacing PLT membrane-assembled nanobubbles can bridge the critical time between early diagnosis and timely therapy following stroke onset in vivo. In the future, such microvascular recanalization effect will be beneficial to ischemic stroke patients who miss the short door-to-needle time window for thrombolytic therapy.
Methods
Materials
Apheresis platelets (type O-) in acid-citrate-dextrose (ACD) were kindly provided by the blood center of Jiangsu Province (China) and kept in a platelet oscillation incubator (ZJSW-A, Gaode, China) (22 °C, 55 rpm) until use. 1,1'-dioctadecyl-3,3,3',3'-tetramethylindocarbocyanine perchlorate (DiI) and 3,3'-dioctadecyloxacarbocyanine perchlorate (DiO) were purchased from Beyotime Biotechnology (Haimen, China) and 1, 1'- dioctadecyl-3,3,3',3'-tetramethylindotricarbocyanine iodide (DiR) was purchased from KeyGEN Biotechnology (Nanjing, China). Other chemicals used were reagent grade and were used without further purification. Sulfur hexafluoride (SF6) with a purity of 99.99% was purchased from Anhui Qiangyuan Gas Co., Ltd. (Wuhu, China).
Fabrication of platelet nanobubbles
Firstly, platelet membrane was obtained by a repeated freeze-thawing process. Briefly, the apheresis platelets with a concentration of 1×10⁹ platelets per milliliter were first separated by centrifugation at 600 rcf and resuspended in phosphate-buffered saline (1× PBS, pH = 7.4±0.1) and then frozen at -80 °C. After thawing at room temperature, the frozen ruptured platelet suspension was further centrifuged (1600 rcf, 5 min) to prepare the platelet vesicles. The obtained frozen platelet membrane vesicles (PMVs) were resuspended in PBS and washed three times to separate the platelet membrane and its organelles.
Secondly, the purified PMVs were transferred into brown glass vials, kept in an ice bath and sonicated for 20 s using a probe ultrasonicator (BDUF-1A, 15-40 KHz, φ6) at a power of 500 W, and then at a decreased power of 100 W for 70 s. During the preparation, SF6 gas was simultaneously introduced into the solution. After the sonication, platelet membrane-derived nanobubbles (PNBs) were purified from unbound proteins or membrane fragments by centrifugation (600 rcf, 5 min).
Characterization of fabricated platelet nanobubbles
The size, size distribution and the surface zeta potential (ξ) of PLTs, PMVs, and PNBs samples (n=3) were obtained by dynamic light scattering (DLS) measurements using a Malvern NanoSizer (Zeta-Sizer, Malvern Instrument, British) and a Multisizer (Multi4e, Beckman, USA) for nanoscale and microscale size, respectively. Further, the stability of PNBs was studied in both PBS (1×) and fetal bovine serum (FBS, 10%) solution. The size change was also monitored at pre-determined time intervals by DLS.
In order to characterize the existence of platelet membrane, the samples, including PLTs, PMVs and PNBs, were labeled by DiI and imaged by confocal fluorescence microscopy (TCS-SP8, Leica, Germany). The morphology of PLTs, PMVs, and PNBs, fixed in 0.02% glutaraldehyde solution at a volume ratio of 1:1 overnight, was characterized by transmission electronic microscopy (TEM, JEM-2100, JEOL, Japan) and scanning electron microscopy (SEM, Ultra Plus, Carl Zeiss, Germany). The samples for TEM were negatively stained with 1 wt% phosphotungstic acid solution. The elements of the samples and the existence of SF6 in the PNBs samples were also analyzed by energy dispersive spectroscopy (EDS) with SEM.
Phospholipids assay of platelet nanobubbles
The phospholipid composition of PLTs, PMVs, and PNBs was determined by high-performance liquid chromatography (HPLC) analysis (Alliance 2695, Waters, USA). Samples used for phospholipid analysis were all prepared using a platelet concentration of 1×10⁹ mL-1. Phospholipids extraction was performed according to a referenced method [40]. Briefly, 4 mL of Bligh and Dyer's cold extraction medium (chloroform:methanol:10 M HCl = 100:200:2 v/v) was added into 1 mL of sample and vigorously mixed for 30 s by ultrasonic cavitation. Cold chloroform and PBS (1:1 v/v) were sequentially added and the mixture was kept still for 5 min after 30 s of continuous shaking. After centrifugation at 1700 ×g for 10 min, the aqueous and organic phases separated. For HPLC analysis, each solution was taken from the organic phase and vacuum dried. The column used for HPLC was Venusil XBP 100A packed with silica, 250 × 4.6 mm, 5 μm particle size (Venusil XBP silica, Agela Technologies, Tianjin, China). The mobile phase was a mixture of acetonitrile-methanol-85% phosphoric acid (94:5:1 v/v) with a flow rate of 1.0 mL/min at room temperature. Monitoring of column effluent was done at 203 nm. Before analysis, lipid extracts of PLTs, PMVs, and PNBs were removed from the refrigerator at -20 °C, redissolved with methylenechloride (200 μL) and 20 μL sample was applied to HPLC.
Proteome sample preparation for SDS-PAGE and LC-MS/MS analysis
To examine the influence of different treatment methods on platelet membrane proteins, PLTs, PMVs, and PNBs were lysed by cell lysis buffer for Western blotting and IP (Beyotime Biotechnology, Haimen, China) and examined by sodium dodecyl sulfate (SDS) polyacrylamide gel electrophoresis (PAGE). A pre-stained protein ladder (PageRulerTM, Lithuana) solution was used as control protein marker.
For LC-MS/MS, the proteins of PLTs, PMVs, and PNBs were extracted using the lysis buffer of an ionic liquid kit [41] and sonicated using Bioruptor Pico Ultrasonicator (Diagenode, Belgium). Then, dithiothreitol (DTT) was added and the proteins were incubated for 5 min at 95 °C, transferred to 10 k filters, and centrifuged to remove reagents. Iodoacetamide (IAA) was added and incubated for 30 min in the dark. After the proteins were washed with 50 mM PBS, proteins were digested in trypsin (1:30 enzyme/ protein) at 37 °C overnight. Then, peptides were separated on a 15 cm reversed phase column (packed in-house with ReproSil-Pur C18-AQ 1.9 μm from Dr. Maisch GmbH) on an ultra-HPLC EASY-nLC 1200 system (Thermo Fisher Scientific, USA). The separation gradient was 4-20% B (0-100 min), 20-50% B (100-120 min), 50-95% B (120-121 min) with buffer A (100% H2O, 0.1% FA) and buffer B (20% H2O, 80% ACN, 0.1% FA).
The data were acquired on an Orbitrap Fusion Lumos Tribrid mass spectrometer (Thermo Fisher Scientific, USA) in a data-dependent mode. Full scans were acquired on the Orbitrap at a resolution of 60,000 from 350 to 1500 m/z and the AGC target was 4×10⁵ within a maximum injection time of 80 ms. Within 3 s cycle time in the top speed mode, ions were sequentially isolated by quadrupole using a 1.6 m/z isolation window to a target value of 5×10⁴ and a maximum injection time of 100 ms. Then, they were fragmented by HCD (normalized collision energy of 30%) and detected by Orbitrap at 15 000 resolution. The exclusion duration was 40 s.
Platelet aggregation assay
Aggregation of platelets in the presence of PNBs was assessed using a spectrophotometric method. Platelet in 500 μL PBS was loaded into a 24-well culture plate followed by addition of PBS (negative control), thrombin (positive control, 25 IU), PMVs, and PNBs (500 μL respectively). Aggregation of PLTs was assessed at 650 nm every 200 s (TeCan Infinite M200 reader, Switzerland). Platelet aggregation was demonstrated by the decrease in absorbance due to reduced turbidity. Each sample was assayed in triplicate (n=3).
To further investigate the effect of PNBs on platelet aggregation, platelets in PBS (1×10⁹ platelets per mL, 250 μL) were loaded into a 24-well culture plate followed by addition of PBS (control, 250 μL), PMVs (250 μL), and PNBs (250 μL). Then, human thrombin (25 IU, 500 μL) was added into the mixture. The 24-well plate was immediately placed in a TeCan Infinite M200 reader to measure the change in absorbance at 650 nm every 200 s, and platelet aggregation was demonstrated by measuring the decrease in absorbance based on the reduction of turbidity. Each sample was assayed in triplicate (n=3).
Macrophage uptake study of PNBs
To prove that PNBs have an immune escape function, it is necessary to verify that PNBs can avoid rapid cleared by mononuclear macrophages in the blood. THP-1 cells (Institute of Biochemistry and Cell Biology, Shanghai Institute of Biological Sciences, Chinese Academy of Sciences, China) were chosen. For the cellular uptake study, cryopreserved THP-1 cells were first thawed at room temperature and cultured in DMEM media supplemented with 10% FBS at 37 °C, 5% CO2 in a humidified atmosphere until the number of cells grew to 108/mL. Then, the THP-1 cells were respectively incubated in 6-wells plates with DiI-labeled PMVs (100 μL) or PNBs (100 μL) in DMEM media (2 mL) supplemented with 10% FBS. The THP-1 cells were harvested after 2, 4, 6, 8, 12, and 24 h incubation and washed three times in PBS by centrifugation at 400 ×g to remove non-internalized samples. The DiI fluorescence intensity of THP-1 cells was measured by flow cytometry (BD Biosciences, USA) and the data were analyzed using Flow-Jo software.
Photothrombotic ischemic stroke mouse model
All animal experiments were performed in accordance with the Guidelines for Animal Care and Use established by Medical School of Southeast University Institutional Animal Care and Use Committee. The protocol was approved by the Committee on the Ethics of Animal Experiments of Medical School of Southeast University. Male C57BL/6 mice weighing between 19 and 22 g were initially anesthetized with 1% pentobarbital sodium solution (10 μL/g body weight) via intraperitoneal injection. 1% Rose Bengal (Sigma-Aldrich, St. Louis, MO, USA), which had been subjected to 0.22 μm filtration, was injected via intraperitoneal injection (10 μL/g body weight). After 5 min of Rose Bengal injection, the scalp was incised and retracted to expose the skull and the mouse head was positioned at the beam focus of a cold light source (Cold light, Carl Zeiss, Germany) with a diameter of 4 mm, which was stereotactically focused onto the skull above the cortex function regions for 15 min. Thereafter, mice were immediately used for the following experiments. In order to confirm the formation of stroke lesion on the right brain, magnetic resonance imaging (MRI) experiments were performed with the use of a 3.8 cm circular surface coil in transmit/receive mode, conducted on a PharmaScan 7.0 T system (BioSpin MRI GmbH Bruker, Germany). The mice were anesthetized with isoflurane (1.5 vol%) via a nose cone. Body temperature was maintained at 37 °C. A two-dimensional RARE (pvm) sequence with respiratory gating control was employed. The parameters for TurboRARE-T2 were set as repetition time (TR) = 3000 ms, echo time (TE) = 36 ms, number of average = 1, echo train length = 8, flip angle = 135. Images were obtained with a matrix size of 256×256, slice thickness of 1 mm and field of view (FOV) of 100 mm×100 mm.
Pharmacokinetics and biodistribution PNBs in mice brain stroke lesion
To substantiate the distribution of PNBs in the brain and stroke lesion, stroke mice were randomly divided into three groups, which were subjected to PBS solution, DiR-labeled PMVs and PNBs injection, respectively. Each mouse was injected with sample (200 μL, n= 5). Mice were then anesthetized with 1% isoflurane (Keyue, Shandong, China) using a gas anesthesia mask and the skull of each mouse was exposed for near-infrared (NIR) fluorescence in vivo imaging (IVIS Spectrum Imaging System, Caliper Life Sciences, USA) over time. The total observation time was 24 h. In order to evaluate the distribution after PNBs injection in the stroke mice, excised organs including brain, liver, kidney, heart, lung and spleen were also imaged by NIR fluorescence imaging. The captured images were analyzed by Living Image 5.0 software.
Multimodal optical imaging platform (MIP) for microvascular observation
To dynamically capture the microvascular network change, a custom-built MIP was used [42]. The stroke mice were randomly divided into three groups, which were injected with PBS, DiO-labeled PMVs and PNBs (200 μL each mouse, n= 5), respectively. Mice were then anesthetized with 1% isoflurane (Keyue, Shandong, China) using a gas anesthesia mask and the skull of each mouse was thinned and kept moist throughout the in vivo optical imaging process. The MIP includes multi-wavelength spectral and fluorescence imaging and two high brightness light-emitting diodes (LEDs) at wavelengths of λ1 = 488 nm for exciting DiO fluorescence and λ2 = 560 nm for optical bright field were used. The total observation time was 5 h.
Histological analysis of PNBs accumulation in brain stroke
For histological examination (HE), mice were sacrificed by cervical vertebra dislocation at 4.5 h (deadline for ischemic stroke therapeutic time window) and 8 h post-injection of PBS, DiI-PMVs, or DiI-PNBs. Subsequently, brain, liver, spleen, lung, kidney in each group were immediately isolated. After fixing and dehydrating in 4% paraformaldehyde (pH 7.4)/30% sucrose solution at 4 °C for 24 h, organs were frozen sectioned for fluorescence observation. For hematoxylin and eosin (HE) staining observation, tissues were then embedded in paraffin. After being embedded, serial longitudinal sections (5 μm thickness) were obtained, which were dewaxed in xylene and rehydrated in an ethanol gradient. Each of the specimen's 5 or 6 sections were sampled in a standardized manner throughout the tissues and stained by HE.
Cerebral blood flow measurement
The stroke-bearing mice were anaesthetized by 1% pentobarbital sodium solution (10 μL/g body weight) with skull exposed. A physiologic solution was applied to keep the surface moist. The cerebral blood flow (CBF) of post-stroke mice with injection of samples including PBS, PMVs and PNBs (200 μL respectively) was assessed in the whole brain area using the Full-Field Laser Perfusion Imager (FLPI, Moor Instruments, UK). The CBF images are shown with arbitrary units in a 16-color palette by the MoorFLPI software. CBF changes in stroke lesion after sample injection were recorded for 120 min. The results are expressed as a measure of maximum % decrease from baseline to 0-10 min immediately following post-stroke treatment and arbitrary flux units/(×103 flux units) measured as area under the recorded flux (response curve) vs. time for the entire recording period.
Brain infarction assessment
Stroke-bearing mice after 24 h injection of PBS, PMVs, and PNBs were deeply anesthetized by nembutal 1% solution and their brains were rapidly removed. After the brains were frozen at -20 °C, five serial sections from each brain were cut at 2 mm each. To measure changes due to ischemia, brain slices were stained with a solution containing 1% 2, 3, 5-triphenyltetrazolium chloride (TTC) dissolved in saline at 37 °C for 20 min. Next, the slices were transferred to 5% neutral buffered formalin and stored at 4 °C before analysis. Infarct volume (%) was measured using Adobe Photoshop CS6. Percentage of infarct volume was calculated as the following equation: percentage of infarct volume (%) = (contralateral hemispheric - ipsilateral noninfarct volume) / total hemispheric volume × 100%.
In vivo ischemia stroke brain ultrasound imaging
Before ultrasound imaging, mice (n= 5) were anesthetized by injection of 1% pentobarbital sodium solution (10 μL/g body weight). 200 μL PBS, PMVs, or PNBs were administered by tail vein injection. The brain region was imaged with a high-resolution micro-imaging system (VisualSonics Vevo 2100, USA) using both B-mode and contrast mode. The B-mode imaging settings were center frequency (f) of 21 MHz, intensity power of 100%, and contrast gain of 18 dB. The contrast mode imaging settings were center frequency (f) of 18 MHz, intensity power of 4%, and contrast gain of 35 dB. A gray-scale mapping function was used to calibrate the ultrasound video intensity to ensure the video-image results were in the linear region. The mean video intensity in the ROIs of the brain stroke was analyzed and normalized to the video intensity at the time of contrast agent injection (time = 0). Time-dependent ultrasound imaging was monitored at pre-determined time intervals (0, 5, 10, 15, 20, 30, 40, 50, 60, 90, 120, 180 min, 24, 48, 72 h, and 7 days) after sample injection.
Proteome data processing and statistical analysis
All raw files from proteome measurements were analyzed together by Andromeda for database search in the MaxQuant environment v.1.6.1.0. MS/MS spectra were searched against the human protein database (UniProt Proteome, release 2017_05). Enzyme specificity was set to trypsin with up to two missed cleavages. Carbamidomethylation (C) (+57.021 Da) was set as fixed modification. Oxidation (M) (+15.995 Da) and acetylation (protein N-termini) (+42.011 Da) were set as variable modifications. The mass tolerances were 10 ppm for the precursor ions and 20 ppm for the fragment ions. We used 'match between runs' in the time window of 2 min. The quantification results were based on the intensities of a label-free quantification method.
The statistical analysis of the samples was undertaken using Student's t-test. All data reported are mean values ± standard deviation (SD). Multiple sets of data were analyzed using an analysis of variance, and all of the data were analyzed using SPSS 19.0 software. Statistical significance is denoted * p<0.05, ** p<0.01, and *** p<0.005.
Abbreviations
ACD: acid-citrate-dextrose; BBB: blood-brain barrier; CBF: cerebral blood flow; CO2: carbon dioxide; DiI: 1,1'-dioctadecyl-3,3,3',3'-tetramethylindocarbocyanine perchlorate; DIO: 3,3'-dioctadecyloxacarbocyanine perchlorate; DiR: 1, 1'- dioctadecyl-3,3,3',3'-tetramethylindotricarbocyanine iodide; DLS: dynamic light scattering; DMEM: Dulbecco's modified Eagle's medium; DTT: dithiothreitol; EDS: energy disperse spectroscopy; FBS: fetal bovine serum; FLPI: full-field laser perfusion imager; GP: glycoprotein; HE: hematoxylin and eosin; HPLC: high-performance liquid chromatography; IAA: iodoacetamide; LC-MS/MS: liquid chromatography-tandem mass spectrometry; LEDs: light-emitting diodes; MIP: multimodal optical imaging platform; MRI: magnetic resonance imaging; NIR: near-infrared; PI: phosphatidylinositol; PS: phosphatidylserine; PE: phosphatidylethanolamine; PC: phosphatidylcholine; PBS: phosphate-buffered saline; PLT: platelet; PMVs: platelet membrane vesicles; PNBs: platelet membrane-derived nanobubbles; PRP: platelet-rich plasma; MPS: mononuclear phagocyte system; ROIs: regions of interest; SDS-PAGE: sodium dodecyl sulfate-polyacrylamide gel electrophoresis; SEM: scanning electron microscopy; SF6: sulfur hexafluoride; TEM: transmission electron microscopy; TTC: 2,3,5-triphenyltetrazolium chloride.
Supplementary Material
Supplementary figures and tables.
Acknowledgements
This investigation was financially funded by the National Key Research and Development Program of China (2017YFA0104302) and National Natural Science Foundation of China (31370019, 61420106012). Funding also partially comes from the Six Talent Peaks Project of Jiangsu Province (2017-SWYY-006), Zhong Ying Young Scholar of Southeast University, and State Key Laboratory of Bioelectronics-Zhongda Hospital Joint Innovation Research Fund. Thankful for Prof. Lihua Zhang and Dr. Jianhui Liu from Dalian Institute of Chemical Physics, Chinese Academy of Science for the LC-MS/MS proteome measurement and analysis.
Competing Interests
The authors have declared that no competing interest exists.
References
1. Jauch EC, Saver JL, Adams HP, Bruno A, Connors JJ, Demaerschalk BM. et al. Guidelines for the early management of patients with acute ischemic stroke A guideline for healthcare professionals from the American Heart Association/American Stroke Association. Stroke. 2013;44:870-947
2. Woods SD, Skinner RD, Ricca AM, Brown AT, Lowery JD, Borrelli MJ. et al. Progress in dodecafluoropentane emulsion as a neuroprotective agent in a rabbit stroke model. Mol Neurobiol. 2013;48:363-7
3. Moskowitz MA, Lo EH, Iadecola C. The science of stroke: mechanisms in search of treatments. Neuron. 2010;67:181-98
4. Iadecola C, Anrather J. Stroke research at a crossroad: asking the brain for directions. Nat Neurosci. 2011;14:1363-8
5. Liebeskind DS. Reperfusion for acute ischemic stroke: arterial revascularization and collateral therapeutics. Curr Opin Neurol. 2010;23:36-45
6. Eltzschig HK, Eckle T. Ischemia and reperfusion-from mechanism to translation. Nat Med. 2011;17:1391-401
7. Powers WJ, Rabinstein AA, Ackerson T, Adeoye OM, Bambakidis NC, Becker K. et al. 2018 guidelines for the early management of patients with acute ischemic stroke: a guideline for healthcare professionals from the American Heart Association/American Stroke Association. Stroke. 2018;49:e46-e99
8. Fonarow GC, Smith EE, Saver JL, Reeves MJ, Bhatt DL, Grau-Sepulveda MV. et al. Timeliness of tissue-type plasminogen activator therapy in acute ischemic stroke patient characteristics, hospital factors, and outcomes associated with door-to-needle times within 60 minutes. Circulation. 2011;123:750-758
9. Merino JG, Warach S. Imaging of acute stroke. Nat Rev Neurol. 2010;6:560-571
10. Lobatto ME, Fuster V, Fayad ZA, Mulder WJM. Perspectives and opportunities for nanomedicine in the management of atherosclerosis. Nat Rev Drug Discov. 2011;10:835-852
11. Ragelle H, Danhier F, Preat V, Langer R, Anderson DG. Nanoparticle-based drug delivery systems: a commercial and regulatory outlook as the field matures. Expert Opin Drug Del. 2017;14:851-64
12. Kumar A, Tan A, Wong J, Spagnoli JC, Lam J, Blevins BD. et al. Nanotechnology for neuroscience: promising approaches for diagnostics, therapeutics and brain activity mapping. Adv Funct Mater. 2017;27:1700489
13. Jin Q, Cai Y, Li S, Liu HR, Zhou XY, Lu CQ. et al. Edaravone-encapsulated agonistic micelles rescue ischemic brain tissue by tuning blood-brain barrier permeability. Theranostics. 2017;7:884-898
14. Nunes A, Al-Jamal KT, Kostarelos K. Therapeutics, imaging and toxicity of nanomaterials in the central nervous system. J Control Release. 2012;161:290-306
15. Blacker DJ. The future of stroke is small. Futur Neurol. 2016;11:189-192
16. Ruggeri ZM. Platelets in atherothrombosis. Nat Med. 2002;8:1227-1234
17. Ruggeri ZM, Jackson SP. Platelet thrombus formation in flowing blood. In: (ed.) Michelson AD. Platelet. 3rd ed. Amsterdam: Elsevier. 2013:399-423
18. Ramakrishnan V, DeGuzman F, Bao M, Hall SW, Leung LL, Phillips DR. A thrombin receptor function for platelet glycoprotein Ib-IX unmasked by cleavage of glycoprotein V. Proc Natl Acad Sci USA. 2001;98:1823-1828
19. Golebiewska EM, Poole AW. Platelet secretion: From haemostasis to wound healing and beyond. Blood Rev. 2015;29:153-162
20. Kramer-Albers EM, Hill AF. Extracellular vesicles: interneural shuttles of complex messages. Curr Opin Neurobiol. 2016;39:101-107
21. Doshi N, Orje JN, Molins B, Smith JW, Mitragotri S, Ruggeri ZM. Platelet mimetic particles for targeting thrombi in flowing blood. Adv Mater. 2012;24:3864-3869
22. Banskota S, Yousefpour P, Chilkoti A. Cell-based biohybrid drug delivery systems: the best of the synthetic and natural worlds. Macromol Biosci. 2017;17:1600361
23. Chen ZW, Hu QY, Gu Z. Leveraging engineering of cells for drug delivery. Accounts Chem Res. 2018;51:668-677
24. Fang RH, Jiang Y, Fang JC, Zhang LF. Cell membrane-derived nanomaterials for biomedical applications. Biomaterials. 2017;128:69-83
25. Lee JK, Park MS, Kim YS, Moon KS, Joo SP, Kim TS. et al. Photochemically induced cerebral ischemia in a mouse model. Surg Neurol. 2007;67:620-625
26. Choi YK, Urnukhsaikhan E, Yoon HH, Seo YK, Park JK. Effect of human mesenchymal stem cell transplantation on cerebral ischemic volume-controlled photothrombotic mouse model. Biotechnol J. 2016;11:1397-1404
27. Schroeter M, Jander S, Stoll G. Non-invasive induction of focal cerebral ischemia in mice by photothrombosis of cortical microvessels: characterization of inflammatory responses. J Neurosci Meth. 2002;117:43-49
28. Wu MD, Atkinson TM, Lindner JR. Platelets and von Willebrand factor in atherogenesis. Blood. 2017;129:1415-1419
29. Su EJ, Fredriksson L, Geyer M, Folestad E, Cale J, Andrae J. et al. Activation of PDGF-CC by tissue plasminogen activator impairs blood-brain barrier integrity during ischemic stroke. Nat Med. 2008;14:731-737
30. Raabe A, De Ville DV, Leutenegger M, Szelenyi A, Hattingen E, Gerlach R. et al. Laser Doppler imaging for intraoperative human brain mapping. Neuroimage. 2009;44:1284-1289
31. Lo EH. A new penumbra: transitioning from injury into repair after stroke. Nat Med. 2008;14:497-500
32. Attwell D, Buchan AM, Charpak S, Lauritzen M, MacVicar BA, Newman EA. Glial and neuronal control of brain blood flow. Nature. 2010;468:232-243
33. Gravanis I, Tsirka SE. Tissue-type plasminogen activator as a therapeutic target in stroke. Expert Opin Ther Targets. 2008;12:159-170
34. Nezu T, Kitano T, Kubo S, Uemura J, Yamashita S, Iwanaga T. et al. Impact of D-dimer levels for short-term or long-term outcomes in cryptogenic stroke patients. J Neurol. 2018;265:628-636
35. Markus HS, King A, Shipley M, Topakian R, Cullinane M, Reihill S. et al. Asymptomatic embolisation for prediction of stroke in the Asymptomatic Carotid Emboli Study (ACES): a prospective observational study. Lancet Neurol. 2010;9:663-671
36. Wang XW, Gkanatsas Y, Palasubramaniam J, Hohmann JD, Chen YC, Lim B. et al. Thrombus-targeted theranostic microbubbles: A new technology towards concurrent rapid ultrasound diagnosis and bleeding-free fibrinolytic treatment of thrombosis. Theranostics. 2016;6:726-738
37. Kiessling F, Fokong S, Koczera P, Lederle W, Lammers T. Ultrasound microbubbles for molecular diagnosis, therapy, and theranostics. J Nucl Med. 2012;53:345-348
38. Son S, Min HS, You DG, Kim BS, Kwon IC. Echogenic nanoparticles for ultrasound technologies: Evolution from diagnostic imaging modality to multimodal theranostic agent. Nano Today. 2014;9:525-540
39. Caskey CF, Hu XW, Ferrara KW. Leveraging the power of ultrasound for therapeutic design and optimization. J Control Release. 2011;156:297-306
40. Kawasaki T, Kambayashi J, Mori T, Kosaki G. Analysis of platelet phospholipids by high-performance liquid-chromatography. Thromb Res. 1984;36:335-344
41. Zhao Q, Fang F, Liang Y, Yuan HM, Yang KG, Wu Q. et al. 1-dodecyl-3-methylimidazolium chloride-assisted sample preparation method for efficient integral membrane proteome analysis. Anal Chem. 2014;86:7544-7550
42. Gu XC, Chen W, You J, Koretsky AP, Volkow ND, Pan YT. et al. Long-term optical imaging of neurovascular coupling in mouse cortex using GCaMP6f and intrinsic hemodynamic signals. Neuroimage. 2018;165:251-264
Author contact
![]() Corresponding authors: F. Y. (Email: yangfang2080edu.cn) and N. G. (Email: guningedu.cn).
Corresponding authors: F. Y. (Email: yangfang2080edu.cn) and N. G. (Email: guningedu.cn).
Citation styles
APA
Li, M., Liu, Y., Chen, J., Liu, T., Gu, Z., Zhang, J., Gu, X., Teng, G., Yang, F., Gu, N. (2018). Platelet bio-nanobubbles as microvascular recanalization nanoformulation for acute ischemic stroke lesion theranostics. Theranostics, 8(18), 4870-4883. https://doi.org/10.7150/thno.27466.
ACS
Li, M.; Liu, Y.; Chen, J.; Liu, T.; Gu, Z.; Zhang, J.; Gu, X.; Teng, G.; Yang, F.; Gu, N. Platelet bio-nanobubbles as microvascular recanalization nanoformulation for acute ischemic stroke lesion theranostics. Theranostics 2018, 8 (18), 4870-4883. DOI: 10.7150/thno.27466.
NLM
Li M, Liu Y, Chen J, Liu T, Gu Z, Zhang J, Gu X, Teng G, Yang F, Gu N. Platelet bio-nanobubbles as microvascular recanalization nanoformulation for acute ischemic stroke lesion theranostics. Theranostics 2018; 8(18):4870-4883. doi:10.7150/thno.27466. https://www.thno.org/v08p4870.htm
CSE
Li M, Liu Y, Chen J, Liu T, Gu Z, Zhang J, Gu X, Teng G, Yang F, Gu N. 2018. Platelet bio-nanobubbles as microvascular recanalization nanoformulation for acute ischemic stroke lesion theranostics. Theranostics. 8(18):4870-4883.
This is an open access article distributed under the terms of the Creative Commons Attribution (CC BY-NC) license (https://creativecommons.org/licenses/by-nc/4.0/). See http://ivyspring.com/terms for full terms and conditions.