Impact Factor
- Issue 13; 2026
- Issue 12; 2026
- Issue 11; 2026
- Issue 10; 2026
- Issue 9; 2026
- Volume 16; 2026
- Advance Articles
- Past Issues
- Cover Images
- Cover Suggestion
- Index & Coverage
- Special Issues
Introduction
Results
Discussion
Materials and Methods
Acknowledgements
Supplementary Material
References
International Journal of Biological Sciences
International Journal of Medical Sciences
 Global reach, higher impact

Theranostics 2018; 8(20):5645-5659. doi:10.7150/thno.29840 This issue Cite
Research Paper
In vivo [64Cu]CuCl2 PET imaging reveals activity of Dextran-Catechin on tumor copper homeostasis
Arvind Parmar*1,2, Giancarlo Pascali*1,2, Florida Voli3, Luigi Lerra3, Eugene Yee3, Aria Ahmed-Cox3, Kathleen Kimpton3, Giuseppe Cirillo4, Andrew Arthur1, David Zahra1, Gita Rahardjo1, Guo Jun Liu1,2, Nigel Lengkeek1, Federica Saletta5, Arnaud Charil1, Maria Kavallaris*3,6,7 ![]() , Orazio Vittorio*3,6,7
, Orazio Vittorio*3,6,7 ![]()
1. The Australian Nuclear Science and Technology Organisation, Lucas Heights, NSW, Australia 2234.
2. The Brain and Mind Centre, University of Sydney, Camperdown, NSW, Australia 2050.
3. Children's Cancer Institute, Lowy Cancer Research Centre, UNSW Sydney, NSW, Australia 2031.
4. Università della Calabria, Rende (CS), Italy 87036.
5. The Children's Hospital at Westmead, Westmead, NSW, Australia 2145.
6. ARC Centre of Excellence for Convergent BioNano Science and Technology, Australian Centre for NanoMedicine, UNSW Sydney, NSW, Australia 2052.
7. School of Women's and Children's Health, Faculty of Medicine, UNSW Sydney, NSW, Australia 2052.
*equal contribution
Received 2018-9-10; Accepted 2018-10-12; Published 2018-11-9
Abstract

Given the strong clinical evidence that copper levels are significantly elevated in a wide spectrum of tumors, copper homeostasis is considered as an emerging target for anticancer drug design. Monitoring copper levels in vivo is therefore of paramount importance when assessing the efficacy of copper-targeting drugs. Herein, we investigated the activity of the copper-targeting compound Dextran-Catechin by developing a [64Cu]CuCl2 PET imaging protocol to monitor its effect on copper homeostasis in tumors.
Methods: Protein expression of copper transporter 1 (CTR1) in tissue microarrays representing 90 neuroblastoma patient tumors was assessed by immunohistochemistry. Western blotting analysis was used to study the effect of Dextran-Catechin on the expression of CTR1 in neuroblastoma cell lines and in tumors. A preclinical human neuroblastoma xenograft model was used to study anticancer activity of Dextran-Catechin in vivo and its effect on tumor copper homeostasis. PET imaging with [64Cu]CuCl2 was performed in such preclinical neuroblastoma model to monitor alteration of copper levels in tumors during treatment.
Results: CTR1 protein was found to be highly expressed in patient neuroblastoma tumors by immunohistochemistry. Treatment of neuroblastoma cell lines with Dextran-Catechin resulted in decreased levels of glutathione and in downregulation of CTR1 expression, which caused a significant decrease of intracellular copper. No changes in CTR1 expression was observed in normal human astrocytes after Dextran-Catechin treatment. In vivo studies and PET imaging analysis using the neuroblastoma preclinical model revealed elevated [64Cu]CuCl2 retention in the tumor mass. Following treatment with Dextran-Catechin, there was a significant reduction in radioactive uptake, as well as reduced tumor growth. Ex vivo analysis of tumors collected from Dextran-Catechin treated mice confirmed the reduced levels of CTR1. Interestingly, copper levels in blood were not affected by treatment, demonstrating potential tumor specificity of Dextran-Catechin activity.
Conclusion: Dextran-Catechin mediates its activity by lowering CTR1 and intracellular copper levels in tumors. This finding further reveals a potential therapeutic strategy for targeting copper-dependent cancers and presents a novel PET imaging method to assess patient response to copper-targeting anticancer treatments.
Keywords: Copper, Anticancer drugs, PET, Neuroblastoma, Molecular imaging
Introduction
Copper (Cu) is an essential trace element playing a central role in the biochemistry of every living organism and there are a number of critical transport systems, enzymes and proteins that contribute to finely regulate the homeostasis of this element [1]. Relatively rare diseases, such as Wilson's and Menke's [2], have been clearly correlated to misfunctions in the balancing of circulating Cu levels, and recent literature is accumulating on the potential role of Cu in promoting tumor growth and progression [3]. In fact, higher Cu levels have been reported in a wide spectrum of cancers including breast, cervical, ovarian, lung, prostate, stomach and leukemia [4]. Consistently, it was reported that copper transporter 1 (CTR1, SLC31A1), responsible for intracellular copper uptake, is highly expressed in cancer cells [3]. This copper dependency of tumors has therefore opened the way to new curative approaches targeting this metal ion transport system. To date, the majority of investigations to systemically reduce circulating Cu levels have been conducted using metal chelation [5-8]. However, due to the ubiquitous role of this metal in several important biochemical pathways, including brain development in children, these approaches are not free of potential side-effects [9], and their use is currently highly debated.
Neuroblastoma is the most common extracranial solid cancer in childhood [10], and is therefore of high interest. This neuroendocrine tumor originates most frequently in one of the adrenal glands, but it can also develop in the neck, chest, abdomen, or pelvis. The majority of children are diagnosed with advanced stage disease and, despite intensive therapy that includes highly toxic chemotherapy, surgery and bone marrow transplantation, children with high-risk neuroblastoma have survival rates of only ~50% [10]. Our group has recently demonstrated that copper is important for neuroblastoma progression and intracellular copper levels are ~50% higher in neuroblastoma cell lines compared to normal human fibroblasts. This is associated with high expression of the high affinity copper transporter 1 (CTR1) [11].
To target copper dependent tumors, our group developed a flavonoid conjugate, Dextran-Catechin, which has a unique mechanism to target copper in cancer cells, as its anticancer activity is not due to copper chelation, but instead to the generation of oxidative stress as a consequence of the intracellular reaction between Dextran-Catechin and copper [11]. This is a new approach that has potential for targeting elevated copper in a range of cancers as it was shown to be less toxic to normal cells. Moreover, we have showed that Dextran-Catechin decreases the level of cellular glutathione (GSH). Since GSH plays a key role in regulating copper uptake and in the expression of CTR1 in cells [12], in this paper we investigate the effect of Dextran-Catechin on the regulation of copper homeostasis in neuroblastoma. Even though there are well established techniques to study the expression of the copper transporters and intracellular copper levels in vitro, there is a dearth of methods to examine copper levels in vivo. In order to gauge the potential utility in the clinical setting, there is a strong requirement for a highly specific methodology that can be used to understand and examine the mode of action of new copper-targeting drugs in tumors, while simultaneously monitoring full-body copper homeostasis in vivo.
Copper radionuclides have been used in high sensitivity Nuclear Medicine diagnostic tests, such as Positron Emission Tomography (PET). Among them, 64Cu is the most used, due to its manageable half-life (12.7h), relatively low positron energy (0.652MeV, similar to the most utilized 18F) and its wide availability at biomedical cyclotrons (through (p,n) production route). An additional point of interest, which is driving the utilization of 64Cu for diagnosis, is the availability of 67Cu, that could offer a direct therapeutic application, following a straightforward theranostic approach [13]. This radiometal is typically employed as a chemically complexed tag linked to a targeting moiety; however, the simple [64Cu]CuCl2 form has also demonstrated its utility in cancer imaging. In particular, this simpler tracer was first used in 2005 to image a mouse model of hepatoma by Peng [14], and since then it has been used for preclinical PET imaging of various cancers, including colorectal cancer, prostate cancer, fibrosarcoma, melanoma, ovarian cancer, glioblastoma, head and neck cancer and breast cancer. Clinical imaging employing [64Cu]CuCl2 is at very early stages and the first example was published in 2015 for staging prostate cancer patients [15].
In this study we investigated the effect of Dextran-Catechin activity on the regulation of copper homeostasis in tumors. We applied, for the first time, [64Cu]CuCl2 PET imaging as an important monitoring tool to understand the activity of copper targeting anti-cancer drugs and its effect on the homeostasis and physiology of copper in vivo. In particular, we tested this approach in a neuroblastoma xenograft model following treatment with the copper targeting agent Dextran-Catechin [11,14]. Our results conclusively show that Dextran-Catechin induced a downregulation of CTR1 specifically in cancer cells, which resulted in a reduction of intra-tumor copper levels. Importantly, no copper deficiency was observed in blood and in non-target organs of the treated animals, highlighting the potential targeted activity of Dextran-Catechin.
Results
Elevated levels of CTR1 are expressed in neuroblastoma tumors
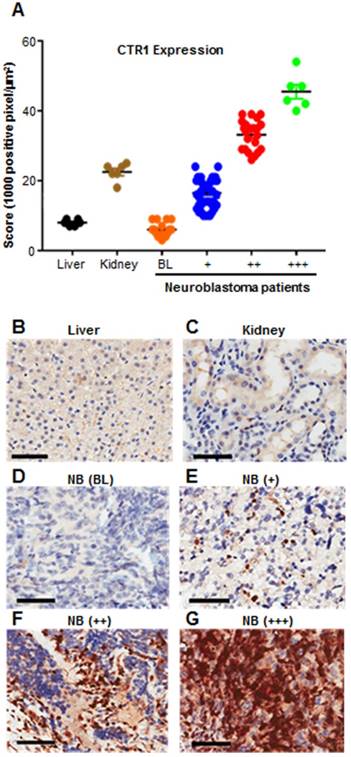
Despite the use of aggressive therapy, survival rates for neuroblastoma are poor and children who survive experience long term side effects from the treatment [16]. More effective and targeted therapies are therefore urgently required. We previously demonstrated that in neuroblastoma cell lines the expression of copper transporter 1 (CTR1) is responsible for copper uptake, and the levels of intracellular Cu are higher than non-malignant cells [11], however, the clinical relevance of CTR1 expression was not described. To address this, we analyzed CTR1 expression in archival neuroblastoma samples. We performed CTR1 immunohistochemistry staining on tissue microarray (TMA) slides containing tumor sections from 90 neuroblastoma patients and compared these samples with sections of normal human liver and kidney from 6 healthy donors (Table 1 and Figure 1). Liver is the major copper storage organ and its CTR1 expression level is considered as a control for normal ranges, whereas kidney presents the highest CTR1 expression level compared to other organs. As such, liver and kidney represent physiological basal and elevated CTR1 expressing tissues, respectively. Positive pixel counting analysis was used to rank controls and neuroblastoma tissues. A threshold at 10,000 positive pixel/µm2 was arbitrarily established to discriminate basal and elevated CTR1 expression levels. Similarly, a threshold at 25,000 positive pixel/µm2 was established to define strongly elevated CTR1 expression levels. Our results showed that 18% of neuroblastoma tumors present similar CTR1 levels compared to liver (positive pixel count <10,000 pixel/µm2), while 82% were higher (positive pixel count >10,000 pixel/µm2). Interestingly, 31% of cases have shown CTR1 expression exceeding the levels observed in kidney (positive pixel count >25,000 pixel/µm2). This important finding demonstrates the elevated expression of CTR1 in neuroblastoma. The copper dependency of neuroblastoma and the high expression of the CTR1 led to the selection of this tumor as a model to study the effect of Dextran-Catechin in targeting copper homeostasis.
Results obtained from CTR1 immunohistochemistry staining of 90 neuroblastoma patient samples. Liver and kidney represent physiological basal and elevated CTR1 expressing tissues.
| CTR1 staining | |||||
|---|---|---|---|---|---|
| Tissue type | # cases | Basal (BL) | + | ++ | +++ |
| Liver | 6 | 6 (100%) | - | - | - |
| Kidney | 6 | - | 6 (100%) | - | - |
| Neuroblastoma | 90 | 16 (18%) | 46 (51%) | 22 (24%) | 6 (7%) |
CTR1 immunohistochemistry staining of 90 neuroblastoma patient samples. Liver and kidney represent physiological basal and elevated CTR1 expressing tissues. Graph shows that 82% of patient tumors have elevated CTR1 expression compared to liver (positive pixel counting >10,000 pixel/μm2) (A); Pictures are representative of different CTR1 expression levels: (B) Liver (Positive Control, basal expression <10,000 pixel/μm2); (C) Kidney (Positive Control, elevated expression >10,000 pixel/μm2); (D) Neuroblastoma tissue showing CTR1 basal expression (BL <10,000 pixel/μm2); (E) Neuroblastoma tissue showing moderately elevated CTR1 expression (+, 10,000-25,000 pixel/μm2); (F) Neuroblastoma tissue showing intermediate elevated CTR1 expression (++, 25,000-40,000 pixel/μm2). (G) Neuroblastoma tissue showing strongly elevated CTR1 expression (+++, >40,000 pixel/μm2). Scale bar 200 μm.
Dextran-Catechin reduces expression of CTR1 and copper levels in tumor cells
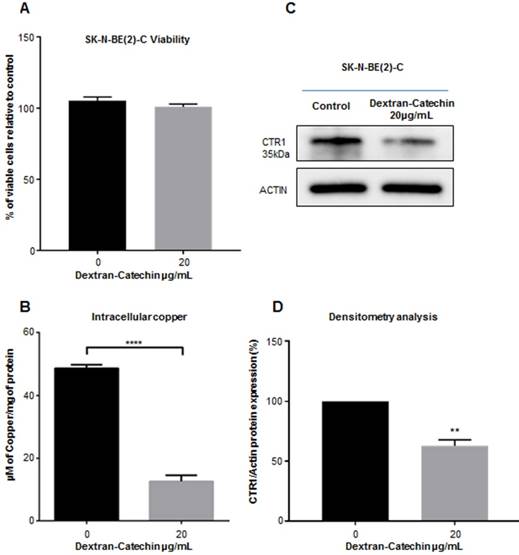
We have previously demonstrated that Dextran-Catechin is preferentially effective against tumor cells by reacting with copper and generating oxidative stress and apoptosis [11]. Since intracellular copper levels are tightly regulated in cancer cells, we hypothesized that Dextran-Catechin could affect the regulation of copper homeostasis in neuroblastoma tumors. To test this hypothesis, we used SK-N-BE(2)-C neuroblastoma cell lines for our in vitro experiments as we found that they have higher intracellular copper and CTR1 expression levels compared to non-malignant fibroblasts (MRC-5) and normal human astrocytes (Supplementary Figure 1). Cells were maintained in cell culture media supplemented with 10% of foetal calf serum containing 18ng/mL of copper. We have well characterized CTR1 expression and intracellular copper at these conditions and, to keep our results consistent, we wanted to avoid any technique exposing cells to copper contamination. We then incubated these cells for 24 h with 20µg/mL of Dextran-Catechin, a dose and time that did not affect cell viability (Figure 2A), and studied its effect on the expression of CTR1 and intracellular copper levels. Our data clearly shows that Dextran-Catechin induces downregulation of the CTR1 expression in cancer cells, which in turn leads to intracellular copper reduction (Figure 2B, 2C and 2D). It is well known that the major limitation in the use of anti-cancer drugs targeting copper is their potential side effects on the nervous system where this metal ion is essential. In order to determine whether Dextran-Catechin was likely to induce downregulation of CTR1 in non-malignant neurons, we studied the effect of our compound on normal human primary astrocytes. Our data clearly demonstrates the lack of significant changes in the expression of the CTR1 in normal human astrocytes (NHA), even when using pharmacologically active doses of Dextran-Catechin (Supplementary Figure 2A and 2B). This translates in reduced risk of toxicity of Dextran-Catechin for non-malignant fibroblast MRC-5 and neuronal NHA even at concentrations 3 times higher than the IC50 for the tumor cells (Supplementary Figure 2A). Collectively, our in vitro results support the hypothesis that Dextran-Catechin induces downregulation of CTR1 and dysregulates copper homeostasis in neuroblastoma cell lines without affecting normal human astrocytes.
Dextran-Catechin reduces expression of CTR1 and copper levels in tumor cells. Viability of tumor cells SK-N-BE(2)-C in the presence of Dextran-Catechin compared to untreated cells (A); decreased intracellular Cu levels in SK-N-BE(2)-C tumor cells treated with Dextran-Catechin (B); representative western blot showing downregulation of CTR1 expression (C-D); Data obtained as mean of at least three experiments, deviation calculated as SEM (**: p<0.01; ****: p<0.0001).
Dextran-Catechin impairs reduced glutathione and induces degradation of CTR1 in neuroblastoma cells
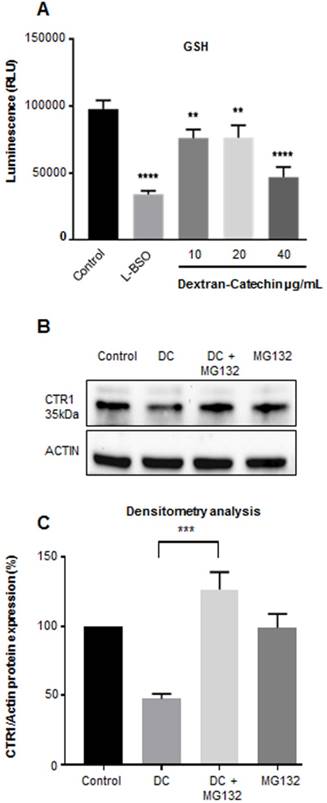
Our recent studies have shown that in the presence of high copper levels catechin becomes pro-oxidant producing reactive oxygen species (ROS) by the Fenton reaction [11]. To survive oxidative stress, cancer cells adopt anti-oxidant strategies, which protect them against oxidative stress and can confer drug resistance [17]. Glutathione (GSH) plays a major role in the maintenance of the intracellular redox balance and is involved in a number of metabolic processes and drug resistance. Importantly, GSH is considered the main intracellular copper complexing agent regulating copper uptake in cells [12]. GSH facilitates the entry of copper into cells through copper transporter CTR1 and it has been considered as the primary component of copper sequestration in the cytosol [18]. Importantly, it has been shown that decreased levels of GSH can cause release of free copper in the cytosol and this stimulates the degradation of CTR1 [19] to reduce copper uptake. Our results showed that Dextran-Catechin reduced the levels of GSH in cancer cells (Figure 3A) and this potentially could lead to release of free copper into the cytosol which in turn, promotes CTR1 degradation. To test this hypothesis, we performed experiments where Dextran-Catechin treatment was given in combination with the proteasome inhibitor MG132 [20]. As we expected, Dextran-Catechin alone induced downregulation of CTR1 (Figure 3B). However, when we combined Dextran-Catechin with MG132 to block the proteasome activity the levels of CTR1 were unchanged compared to the control (Figure 3B and 3C). These data support our hypothesis that Dextran-Catechin may induce the degradation of CTR1 (Figure 2A and B) which results in decreased copper uptake (Figure 2C). As a further demonstration of the post-translational effect of Dextran-Catechin on CTR1 protein, we did not observe any difference at the mRNA level for CTR1 between the control and treated cells (Supplementary Figure 3).
Dextran-Catechin induced downregulation of GSH in SK-N-BE(2)-C tumor cells. L-BSO was used a positive control of GSH reduction (A). Representative western blot (B) and densitometry analysis (C) showing that the expression of Copper transporter 1 (CTR1) is not reduced by Dextran-Catechin (DC 20µg/mL) in the presence of the proteasome inhibitor MG132 (10µM). Data obtained as mean of at least three experiments, deviation calculated as SEM (**: p < 0.01; ***: p < 0.001; ****: p < 0.0001).
Developing a [64Cu]CuCl2 PET imaging protocol for studying the effect of Dextran-Catechin on copper homeostasis in a preclinical neuroblastoma model
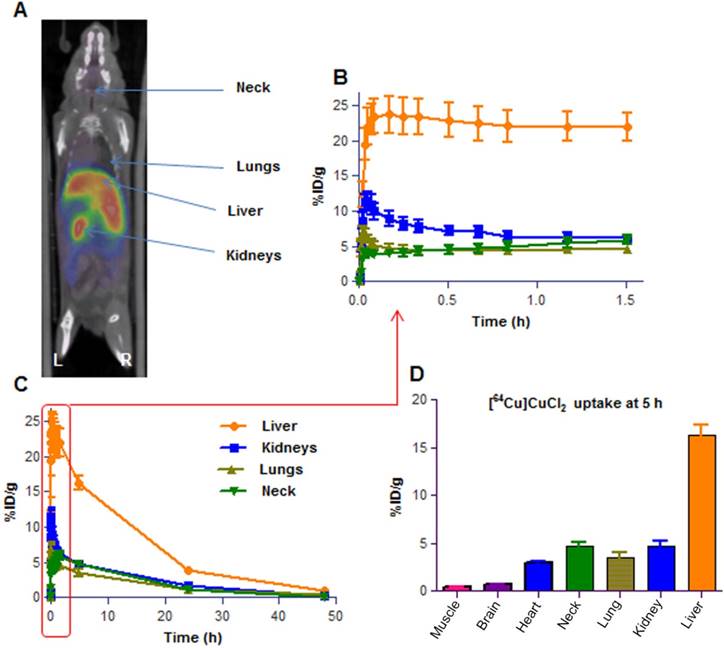
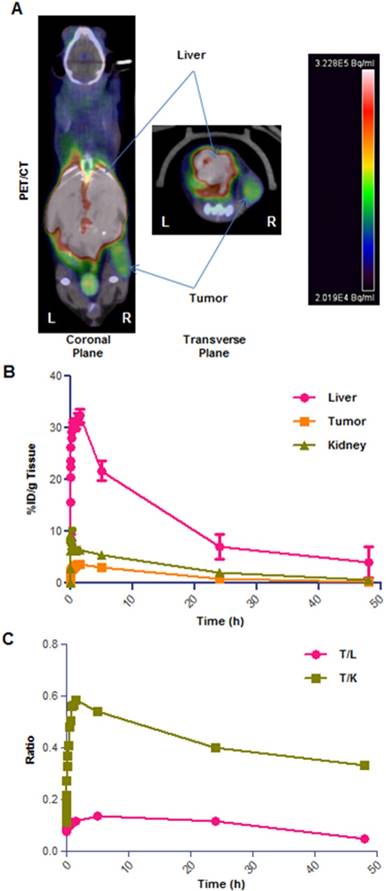
To further determine if our in vitro data would be replicated in an in vivo preclinical neuroblastoma model, we developed a [64Cu]CuCl2 PET imaging protocol to monitor the changes in copper levels in tumors after treatment with Dextran-Catechin. Positron Emission Tomography (PET) using the [18F]2-fluoro-deoxyglucose has revolutionized the clinical and preclinical cancer investigations by providing functional and metabolic information that, when coupled to high resolution anatomical data (e.g. Computed Tomography), leads to a robust picture of the studied disease. This capability has become particularly important in the evaluation of new therapeutic agents and in the understanding of how their action is mediated, e.g. by inhibiting tumor metabolism. In our study, a [64Cu]CuCl2 PET imaging protocol was critical to assess the effect of Dextran-Catechin on copper homeostasis in vivo. However, there was limited data in the literature on [64Cu]CuCl2 PET imaging on animal models and we needed to develop a novel PET imaging protocol specifically for this study, which can also be used for future Cu-inhibition studies. Among the few reports, Peng [21,22] used an established mouse model of human Wilson's disease to administer orally or intravenously, [64Cu]CuCl2 to control C57Bl/6 mice and Atp7b-/- knockout mice, and obtained bio-distribution data over 24h; this allowed authors to extrapolate dosimetry estimates for human imaging. More recently, Manrique-Arias [23] has reported dosimetry data on healthy rats in order to obtain the bio-distribution of [64Cu]CuCl2 and estimate the radiation doses to humans. Since there is not enough data available on the [64Cu]CuCl2 bio-distribution for the mouse strain on which our neuroblastoma model was developed, we first performed PET imaging in non-tumor-bearing mice (balb/c female mice, n=4) to understand the basal uptake and the clearance of the radiotracer. In our study, we injected 100µL of 7-10 MBq of [64Cu]CuCl2 in PBS via tail vein in anaesthetized mice. Dynamic PET scanning was carried out in the 0-2h post radiotracer administration time window (Figure 4); afterwards, mice were imaged for 15 min of static scans at 5h, 24h and 48h post [64Cu]CuCl2 administration. The results showed highest uptake in liver (20-30% ID/g) at the 2h time point; this finding is in line with the literature, recognizing this organ as the major site for copper accumulation, followed by kidneys (5-8% ID/g) and lungs (4-6% ID/g)[23]. We also noticed a high uptake in the neck area (4-7% ID/g), probably due to the presence of glandular tissues in this area. Comparative biodistribution data at the 5h time point has been derived from PET images for the major organs and are shown in Figure 4D. The PET imaging in non-tumor-bearing mice clearly showed the peak uptake of [64Cu]CuCl2 takes place in all major organs in the 2-5 h time window and then stabilizes in the tissues at lower levels. Later on, the tracer is slowly cleared via the hepatobiliary route over the 2 days' time of observation. These dynamic profiles guided the selection of appropriate time points to use in our PET imaging studies and, we determined that the 5h and 24h [64Cu]CuCl2 post-injection time points would represent the most appropriate ones. These time points allow imaging in a moment shortly following maximum uptake and in a moment of reduced signal/noise ratio in the major organs. We believe that the selected time points are the most appropriate to test the effect of Dextran-Catechin in the homeostasis of copper in tumor and healthy tissue in our model.
Representative image of 3D PET/CT image. Balb/c healthy mouse (A); Time activity curve (TAC) of the first 90min dynamic scan (B) and for up to 48 h period (C); Biodistribution of [64Cu]CuCl2 in major organs at 5h time point reported for 7 reference organs (D). Data obtained are presented as mean of n=4 mice, deviation calculated as SEM. %ID/g = percent of Injected Dose per gram of tissue.
[64Cu]CuCl2 accumulates in tumors in a human neuroblastoma xenograft model
Having verified the bio-distribution of [64Cu]CuCl2 in healthy animals, we then focused on understanding how the biodistribution would be impacted in a xenograft tumor model. Therefore, in the next phase of [64Cu]CuCl2 PET imaging experiments, we established a neuroblastoma xenograft mouse model, by subcutaneous injection of SK-N-BE(2)C neuroblastoma cells on the right flank of mice. Tumors were allowed to grow for around 10 days, and the mice were used for PET imaging when the tumor size reached 300 ± 100 mm3. To verify the best imaging timing for this cancer model, we performed PET studies where mice were initially imaged for a 0-2 h dynamic scan followed by 15 min of static scans carried out at 5h, 24h and 48h. In these experiments tumor location (i.e. on the right flank) was in close proximity with the liver, kidneys and gut regions (Figure 5A) and careful evaluation of some images was required to best delineate tumor regions. The data obtained from this study showed up to 4% ID/g tumor uptake in the first 5h, 0.8-1% at 24h and 0.2% at 48h time points (Figure 5B). The liver uptake of [64Cu]CuCl2 was in line with the healthy animals, peaking at 20-30% in initial time points and quickly decreasing thereafter. In addition, our PET imaging showed that the [64Cu]CuCl2 uptake of tumor/liver and tumor/kidney uptake ratio does not have a significant drop over time, thus indicating a substantial rate of retention of [64Cu]CuCl2 in tumor tissues (Figure 5C).
Representative example of [64Cu]CuCl2 PET/CT on neuroblastoma xenograft (right flank) bearing mice. High-contrast signal confined exclusively to the tumor and liver regions (A); TAC graph showing % ID/g for tumor, kidneys and liver tissues (B); plot of tumor/liver (T/L) and tumor/kidney (T/K) uptake ratio over time (C). Data obtained as mean of n=4 animals per group, deviation calculated as SEM.
PET imaging shows decreased copper uptake in tumors of mice treated with Dextran-Catechin
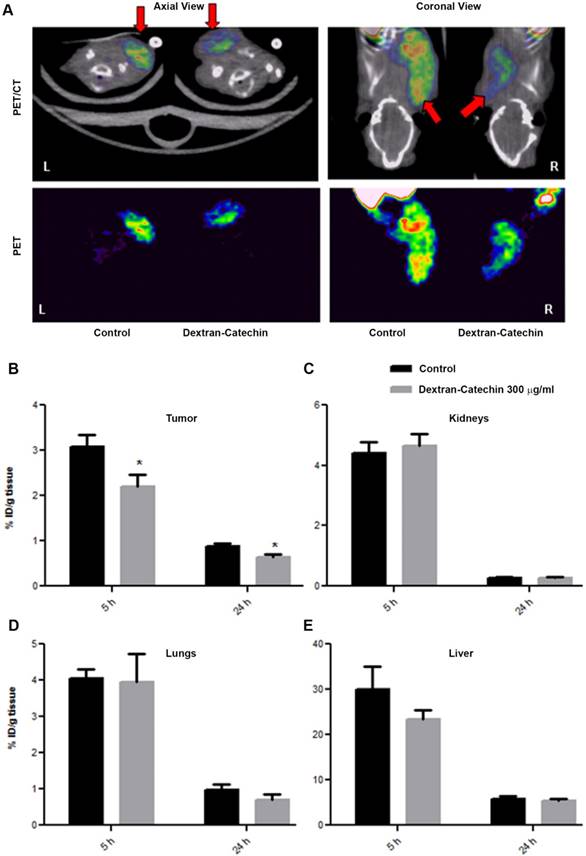
Having demonstrated elevated uptake and retention of [64Cu]CuCl2 in the tumor of our neuroblastoma xenograft model, we tested the effect of Dextran-Catechin treatment on the homoeostasis of this metal in vivo by studying the bio-distribution of [64Cu]CuCl2. In this experiment, the xenografted animals were prepared similarly to what was described in the previous section and used for the PET scan; however, due to the difficulty in delineating the tumor on the mouse flank because of the [64Cu]CuCl2 uptake in the surrounding tissues, we xenografted the tumor cells in the subscapular region. The treatment group received a single pharmacologically active dose of Dextran-Catechin (300 µg/mL i.v.) [11] in 100µL of saline, while the control group received the same volume of vehicle (i.e. saline i.v.). Thirty minutes after the drug administration, 7.42 ± 3.24 MBq of [64Cu]CuCl2 in 100µL of PBS was injected into the tail vein. Static PET/CT imaging (i.e. 15min acquisition) was performed at 5h and 24h post drug injection in order to evaluate the differential accumulation of Cu in tumor due to Dextran-Catechin treatment (Figure 6A). In this sample set, we verified a repeatable tumor uptake in the saline-treated animals of 3.5-4% ID/g at 5 h and 0.7-1% ID/g at 24h time points, that was consistent with both literature reported values and our previous tests (Figure 5B). On the other hand, tumor uptake of [64Cu]CuCl2 in the mice treated with Dextran-Catechin showed 2.0-2.5% ID/g at 5h and 0.5-0.7% ID/g at 24h time points, which represents a significantly lower uptake compared to the saline-treated group (p<0.05, Figure 6B); importantly, the differences in copper uptake in non-tumor tissues (e.g. kidneys, lungs and liver) were not significant between the treatment groups (Figure 6C, 6D and 6E). This data is consistent with our in vitro data that have shown how Dextran-Catechin decreases the expression of CTR1 and copper uptake in neuroblastoma cell lines (Figure 2C). Therefore, this imaging approach has provided the first in vivo evidence that Dextran-Catechin significantly affects copper homeostasis in the tumor by reducing the intra-tumor Cu concentration. In addition, we were able to verify that these effects were more prominent in the tumor as Cu biodistribution was not considerably altered in non-target organs like kidney, lungs and liver (Figure 6C, 6D and 6E) where an imbalance of copper could cause undesired side-effects.
Comparison of PET/CT imaging of Dextran-Catechin and Saline treated mice. Representative PET/CT image of [64Cu]CuCl2 uptake in the tumor tissue (A); [64Cu]CuCl2 uptake difference in tumor (B), kidneys (C), lungs (D) and liver (E) tissues based on Dextran-Catechin treatment, reported at two time-points. Deviation calculated as SEM (*: p<0.05) (n=6 for each group).
Ex vivo analysis of CTR1 expression in tumors of Dextran-Catechin treated mice
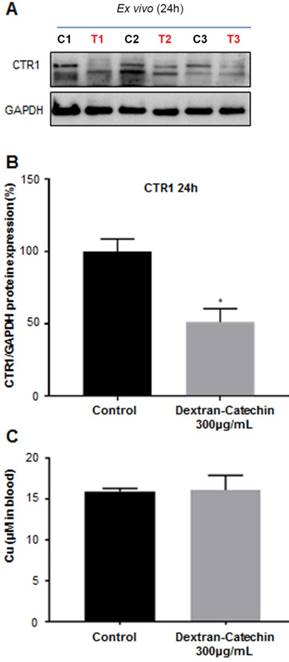
To gain further insights and confirmation on the data obtained from the imaging study, we excised the tumors from three control and three treated animals used in the PET study after 24h treatment, and we analyzed the expression levels of CTR1. We demonstrated that the expression levels of CTR1 in tumor tissues were significantly lower (~50%) in the animals treated with Dextran-Catechin, compared to the animals injected with saline in the control group (Figure 7A and 7B). These results agree with PET imaging data and provide a potential explanation of the lower uptake and retention of 64Cu highlighted by the image analysis (Figure 6). Furthermore, we quantified copper content in the blood collected from the same animals used in the imaging experiments at the end point of 24h; for this analysis, we showed no significant difference in the levels of Cu in the blood of mice treated with Dextran-Catechin compared to the control group (Figure 7C). This data is particularly important, as it indicates that Dextran-Catechin affected Cu trafficking in the tumor tissues without perturbing copper homeostasis in the blood systemically. Although mice in Figure 6 were imaged at 5h and 24h after treatment, the ex vivo analysis could be performed only 24h post treatment, when tumors were excised after the conclusion of the PET imaging. To verify that the decreased copper uptake observed by PET 5h after Dextran-Catechin treatment (Figure 6B) was related to CTR1 downregulation, we repeated the in vivo experiments to humanely kill mice after 5h of treatment and perform ex vivo analysis to study expression of CTR1. Interesting, western blot showed down regulation of CTR1 in the tumors after 5h of treatment with Dextran-Catechin (Supplementary Figure 4).
CTR1 expression in the tumor tissues. Control (C1, C2, C3) and treated (T1, T2,T3) mice used in the PET imaging after 24h treatment (A); densitometry graph of Western blot data showing lower expression of CTR1 in the treated mice (B); blood levels of copper between the mice treated with Dextran-Catechin and the control group (C). Deviation calculated as SEM (*: p < 0.05).
Dextran-Catechin treatment induced downregulation of CTR1, decreased tumor growth and extended survival in a neuroblastoma xenograft model
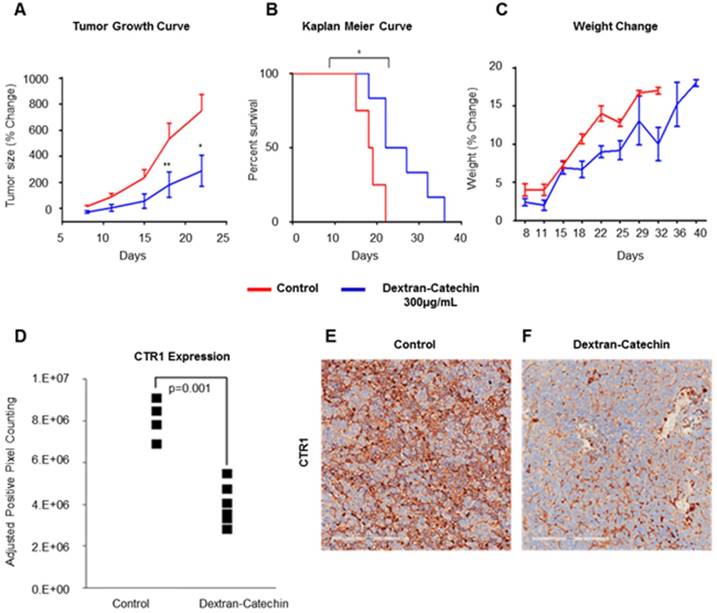
To investigate the whole-body systematic effect of Dextran-Catechin in vivo, and to understand whether the decrease of CTR1 in tumor is maintained during long-term treatments, we intravenously treated neuroblastoma tumor bearing mice every 3 days for a total of 21 days. We used the same neuroblastoma model and the same Dextran-Catechin concentration (300 µg/mL) employed in our PET imaging experiments. Our results clearly confirmed that the selected dose of Dextran-Catechin led to a significant reduction in tumor volume over the 21 day experimental period, compared to saline control (Figure 8A). Importantly, although the treatment was stopped after 21 days, Dextran-Catechin extended the survival of the mice by about 30% (p=0.02) in the treated group (Figure 8B). Moreover, the treatment did not affect the normal growth of the mice, which is evidence of low toxicity and good tolerability of the treatment (Figure 8C). When animals were sacrificed, tumor mass was excised, and immunohistochemistry was performed to assess the effect of the long-term treatment on the expression of CTR1. Our results demonstrated that Dextran-Catechin downregulated CTR1 in all 5 treated mice compared to the ones in the control group (p=0.001; Figure 8D and 8F). Collectively, these results demonstrate that Dextran-Catechin induced a strong downregulation of CTR1 in neuroblastoma in vitro and in vivo, causing a marked reduction in copper levels in tumor tissues, which resulted in decreased tumor growth and improved survival.
Dextran-Catechin effect in neuroblastoma xenograft model. Dextran-Catechin decreases tumor growth (A); it improves animal survival (B) without affecting the overall animal weight gain (C). Immunohistochemistry of tumors confirmed downregulation of CTR1 in all the tumors from mice treated with Dextran-Catechin compared to the control group (D); this is evident in the representative pictures of CTR1 staining in a tumor of a control mouse injected with saline (E); and a mouse injected with Dextran-Catechin (F). Data obtained from n=5 animals per group, deviation calculated as SEM (*: p < 0.05; **: p < 0.01).
Discussion
Copper represents an emerging target for developing effective treatments for cancer; in fact, higher Cu levels and increased CTR1 expression are becoming hallmarks of tumors [4]. Following this lead, our group was the first to describe elevated copper levels in neuroblastoma. Moreover, we developed a copper targeting anti-cancer conjugate, Dextran-Catechin, which reacts with copper inducing oxidative stress [11]. Copper homeostasis is finely regulated in cells and in the human body and its regulation is also dependent on the activity of the cellular antioxidant GSH [12]. Linking together the reactivity of Dextran-Catechin with copper and its ability to induce ROS, we hypothesized that Dextran-Catechin could also affect the regulation of copper levels in tumors. Our in vitro data showed that Dextran-Catechin induced downregulation of the copper transporter CTR1 which in turn caused a decrease of intracellular copper. The decrease in cellular copper is highly likely to have altered the cellular GSH levels. This was indeed the case as Dextran-Catechin led to decreased GSH levels. Conversely, a study from Maryon E.B., et al [12], found that decreased levels of intracellular GSH induced an augmented degradation of CTR1. Therefore, Dextran-Catechin, not only induces oxidetive stress by reacting with copper in neuroblastoma cells, but also deregulates intracellular redox balance by reducing levels of GSH. This could be one of the key events which induce degradation of CTR1 and low copper uptake. Consistent with this, the Dextran-Catechin effects on CTR1 mediated by GSH are as a result of a post-transcriptional decrease in CTR1 protein and not downregulation of its mRNA. We then investigated the effect of Dextran-Catechin on CTR1 protein degradation using the potent and cell-permeable proteasome inhibitor MG132, which blocks the machinery leading to protein degradation. We showed that in cells treated with MG132, Dextran-Catechin did not induce any downregulation of CTR1 (Figure 3B). Collectively, our in vitro results support our hypothesis that Dextran-Catechin induces ROS and decreases intracellular levels of GSH which may lead to the degradation of CTR1 and reduce copper uptake. This offers a unique mechanism to reduce levels of copper in cancer cells, as its activity is not due to copper chelation but instead to the reduction of copper uptake as a consequence of the degradation of CTR1. Another important consideration about these results is that the lowering copper activity of Dextran-Catechin could target cancer cells where levels of copper are higher compared to non-malignant cells. In fact, since the first step in the activity of this compound is represented by the generation of ROS as a result of its reaction with copper, Dextran-Catechin is most likely to be less toxic for non-malignant cells having low intracellular copper. This is confirmed by our results showing that Dextran-Catechin did not affect either the expression of CTR1 in normal human astrocytes, nor their viability, suggesting that neurotoxicity may not be a major issue. This is of importance in considering clinical utility of Dextran-Catechin, as treating a childhood cancer such as neuroblastoma one would want to avoid the risk of long-term side effects.
To understand the potential clinical applicability of copper-targeting agents, specific in vivo data are needed to: (1) assess minimal effects to non-target tissues and whole-body burden, and (2) evaluate response to copper-targeted therapies. We were able to monitor copper trafficking and its modification induced by Dextran-Catechin treatment by performing [64Cu]CuCl2 PET imaging in a human neuroblastoma xenograft model. While [64Cu]CuCl2 has been used pre-clinically to image diverse types of tumors, our work represents the first example of its use to image neuroblastoma models. Importantly, this study represents the first application of [64Cu]CuCl2 PET to assess the molecular mechanism of copper-targeting drugs for cancer treatment. The imaging data from this study revealed that the anticancer action of Dextran-Catechin is correlated to a significant reduction of intracellular copper in the tumor tissues. The lack of marked off-target effects on other organs (e.g. liver, kidney), highlights the tumor targeting effect of Dextran-Catechin. Importantly, ex vivo analysis confirmed also the reduction of CTR1 expression in the same PET-imaged tumor tissues. Added to this, long-term treatments demonstrated a significantly extended survival and decreased tumor growth, backed-up by a reduced expression of CTR1. Moreover, as a proof of the low risk of side effects, no changes in blood Cu levels were observed in the mice treated with Dextran-Catechin after 24h. The evidence supporting Dextran-Catechin's copper targeted activity in vivo, is of paramount importance to assess the applicability of this conjugate in other copper dependent cancer types, as well as in other tumor models and ultimately in clinical studies.
PET with intravenous [64Cu]CuCl2 was previously evaluated in several preclinical cancer models as a potential diagnostic tool [24]. Although some studies found no correlation of intravenous [64Cu]CuCl2 uptake with CTR1 expression in cancer cells [25], there are other works which suggest a key role of CTR1 in copper uptake and its intracellular homeostasis [26]. These observations suggest that CTR1 expression is important in regulating the tumor uptake of copper, but it is not the sole player. In fact, it is well known that copper levels depend also on the subcellular localization of CTR1 which can differ between tumor types, and that copper homeostasis is also regulated by copper efflux transporters ATP7A and ATP7B [24]. All these factors can influence intracellular copper levels, and this may be the reason for conflicting evidence reported on the utility of [64Cu]CuCl2 for tumor diagnosis. However, it seems that in tumors where copper uptake is mainly dependent on CTR1, there is a direct correlation between the expression of this copper transporter and [64Cu]CuCl2 uptake [26]. Therefore, the PET imaging approach that we developed for this work could potentially be used in the diagnosis of tumors with high expression of CTR1 such as neuroblastoma. Importantly, we believe that [64Cu]CuCl2 PET imaging could represent a reliable tool to monitor responses to treatments that induce dysregulation of intra-tumor copper homeostasis. In fact, developing a method to quantitate tumor copper levels could allow us to understand the potential response to Dextran-Catechin and other anticancer treatments dysregulating copper homeostasis, regardless of the different copper transporter systems involved. Going towards personalized therapy, the high levels of copper in patient neuroblastoma samples suggest that copper targeting therapies for this cancer may be of benefit [27]. Moreover, the availability of a minimally invasive diagnostic approach, such as the [64Cu]CuCl2 PET we report here, could identify patients with higher chances of responding to copper targeting drugs. Related to this, due to its reasonable 12.7h half-life, the use of [64Cu]CuCl2 PET could open up the way for performing dose-response studies on patients to study the efficacy levels of novel copper-targeting drugs, providing a personalized medicine approach to treatment.
In conclusion, we have discovered that Dextran-Catechin downregulates CTR1 and decreases copper uptake in neuroblastoma tumors with less effect on copper homeostasis in off-target organs and in the blood. Moreover, we have developed a specific [64Cu]CuCl2 PET imaging method to study the effect of a copper-targeting therapy by monitoring the radioactive uptake in tumor tissues. We believe that these results may advance the potential clinical use of copper targeting drugs and [64Cu]CuCl2 PET imaging to treat and monitor neuroblastoma and other types of tumors.
Materials and Methods
Chemicals
All chemicals and reagents were supplied by Sigma-Aldrich and used without purification, unless stated otherwise in the relative sections. Dextran-Catechin (DC) was synthesized and characterized as previously described [28]. A stock solution of DC 1 mg/mL (whereas the concentration indicated is referred to catechin content) was prepared in cell culture media Dulbecco's Modified Eagle Media (DMEM, Life Technologies, USA) and in Saline respectively for the in-vitro and in-vivo experiments, and stored at -20°C. [64Cu]CuCl2 was produced via 64Ni(p,n)64Cu reaction on a biomedical cyclotron at the Sir Charles Gairdner (SCGH, Perth, WA, Australia) and shipped as 0.1N HCl solution; the shipped material was buffered at pH7 using NaOH and diluted with hypertonic solution to obtain a 0.9% w/v concentration of NaCl. The molar activity obtained was 200.1±80.5 MBq/nmol at formulation.
Cell Culture
Neuroblastoma cell lines SK-N-BE(2)-C (ATCC® CRL-2268™) were used in this study. Cells were cultured in DMEM supplemented with 10% foetal calf serum (FCS, Invitrogen, Australia) and 1% L-glutamine (Life Technologies, USA). Normal lung fibroblasts, MRC-5 (ATCC® CCL-171™), were cultured as described previously [28]. Primary normal human astrocytes (NHA, Lonza, Australia) were cultured as recommended in astrocyte basal medium (ABM) supplemented with astrocyte growth medium (AGM) Single Kit Supplements & Growth Factors (Lonza, Australia). Upon receipt from ATCC, master stocks were prepared and cells for experiments were passaged for less than 6 months. SK-N-BE(2)-C and MRC-5 master stock cells were validated by PCR (STR profiling) and stored in the Children's Cancer Institute Cell Bank. Cell lines were routinely screened and found to be free of mycoplasma contamination. All experiments were performed using the same fetal calf serum to keep constant the amount of copper in the cell culture media at 18ng/mL. Cells incubations were conducted at standard cell culture conditions (37°C, 5% CO2, 95% humidity).
Drug treatments, cell viability and proliferation
Cell were seeded in transparent 96 well plates at 5x10³ cells/well for SK-N-BE(2)-C line and at 2x10⁴ cells/well for MRC-5 and NHA lines, and left growing for 24 h before addition of freshly diluted drug or control; the different concentrations indicated in the text are referred to the catechin content (expressed in μg/mL). Media was replaced after 24 h with Alamar Blue reagent and incubated for a further 3-6 h for reduction by active mitochondria, before spectrophotometry at 470-495nm.
Measurement of Copper levels
SK-N-BE(2)-C, NHA and MRC-5 cells were grown in cell culture dishes to 70% confluence. Following three washes in PBS, they were scraped in Milli-Q water supplied with protease inhibitor. Intracellular copper levels were measured using the QuantiChrom™ Copper Assay Kit (BioAssay Systems, Hayward, CA, USA). Copper levels were determined according to manufacturer's instructions by absorbance spectrophotometry and normalized to cell protein content. This kit has a linear detection range 7 μg/dL (1.0 μM) to 300 μg/dL (47 μM) copper in 96-well plate assay, which is compatible with our experimental set up. We used the QuantiChrom™ Copper Assay Kit to measure copper levels in the blood of the mice according to manufacturer's instructions specific for blood quantification.
Western blot
Protein electrophoresis of whole cell lysates or tumor lysates, and transfer onto PVDF membrane was performed as previously described [28]. Briefly protein concentrations were determined using a Pierce BCA Total Protein Assay Kit (ThermoFisher Scientific, Australia) and 18 μg whole cell protein lysate were loaded into 12% SDS-PAGE gels, or 4-15% Mini-PROTEAN precast gradient gels (Bio-Rad, Australia). Membranes were incubated with 10% skim milk powder in TBST (10 mM Tris, pH 8.0, 150 mM NaCl, 0.5% Tween 20) for 60 min, prior to washing once with TBST and incubating with antibodies against CTR1 (rabbit anti-SLC31A1, ab129067, Abcam, Melbourne, VIC, Australia) or GAPDH (mouse anti-GAPDH, Abcam, Melbourne, VIC, Australia) or actin was (rabbit anti-Actin, ab8224, Abcam, Melbourne, VIC, Australia). GAPDH was used for ex-vivo western blot from our xenograft model, as it reacts specifically with human protein eliminating any interference from mouse tissue. Actin was used as reference protein for the in vitro experiments. Membranes were washed and incubated with anti-rabbit (1:10000) or anti-mouse (1:20000) dilution of horseradish peroxidase-conjugated anti-antibody for 90 min. Blots were developed with Amersham ECL Prime Western Blotting Detection Reagent (GE Healthcare Life Sciences, Rydalmere, Australia) and imaged by Bio-Rad Chemi-Doc Touch Imaging System and analyzed using Quantity One (v 4.6.9, Bio-Rad, Australia) or ImageLab (v 5.2.1, Bio-Rad, Australia) respectively. Expression was normalised to that of the housekeeping protein GAPDH.
Measurement of intracellular Glutathione
The GSH-Glo™ Assay form Promega was used for the detection and quantification of glutathione (GSH) in cells. The assay is based on the conversion of a luciferin derivative into luciferin in the presence of GSH. The kit contains a glutathione S-transferase (GST) which catalyzed the reaction. The luciferin formed is detected in a coupled reaction using Ultra-Glo™ Recombinant Luciferase that generates a glow type luminescence that is proportional to the amount of glutathione present in cells. As positive control of GSH inhibition we used l-Buthionine- sulfoximine (BSO) which blocks GSH synthesis. 5000 cells/well in 96 well format were exposed to BSO or different doses of Dextran-Catechin for 5 hours and detection of GSH was performed using the GSH-Glo™ Assay protocol.
Proteasome Inhibition Assay
2x10⁵ SK-N-BE(2)-C cells were seeded in 6 wells plate and grown in DMEM media (ThermoFisher Scientific, Cat. 11965-092) supplemented with 10% FBS for 24 hours. The day after the cells were treated with MG132® 10µM (Sigma-Aldrich, Cat. M7449) to inhibit the proteasome 1hour prior the treatment with Dextran-Catechin 20 µg/mL for 24 hours. Cells were lysed with ice-cold RIPA buffer containing Proteinase inhibitors cocktail (Sigma-Aldrich, Cat. P8340). Cellular debris was removed by spinning the lysate at 14.000 rpm for 20 minutes at 4˚C. Equal amounts of protein were resolved using 4-20% Mini-PROTEAN® TGX™ Precast Protein Gels (BIO-RAD, Cat. 4561094) and transferred to Nitrocellulose membranes (BIO-RAD, Cat. 1620115). The membranes were blocked with 5% milk for one hour and then incubated with appropriate antibody for 16 hours. Bound antibodies were visualized with horseradish peroxidase-coupled secondary antibodies (Agilent-Dako, Cat. P044801-2) and chemiluminescent reagent (ThermoFisher Scientific, Cat. 32132X3). Primary antibody used for CTR1 was (1:1000 dilution, Abcam, EPR7936) and for actin was (1:2000 dilution, Abcam ab8224).
Archival patient samples
The retrospective neuroblastoma cohort consisted of 90 patients who underwent diagnostic biopsy or surgical resection at the Children's Hospital at Westmead (CHW), Sydney, Australia. Human Research Ethics approval for this study was obtained from the Sydney Children's Hospitals Network Committee. Information concerning patient demographics, tumor histopathology, therapy response and patient survival was collated (Human Ethics approval LNR / 13 / SCHN / 389). Formalin-fixed paraffin-embedded (FFPE) tumor samples were used to construct tissue microarrays (TMAs) by the CHW Tumor Bank. Each sample was present at least in duplicate. A variety of control tissues (appendix, brain, breast, kidney, liver, muscle, placenta, skin, spleen, testes and tonsil) were included in the TMA.
Immunohistochemistry staining and image analysis
The TMAs were sectioned at 4µm and immunohistochemistry (IHC) was performed using a BOND-RX automatic stainer (Leica Biosystem). Slide deparaffinization was performed with BOND Dewax solution followed by alcohol dehydration. Epitope retrieval was performed using HIER2 Buffer (BOND, AR9540) and slides were incubated for 60 min at room temperature using a rabbit monoclonal anti-CTR1 primary antibody (Abcam, ab133385) at 1:100 dilution in Primary Antibody Diluent (BOND, AR9352). Staining was visualized using a Polymer Refine Detection kit (BOND, DS9800) and nuclei were counterstained with haematoxylin. Tumors cells showing CTR1 membrane staining (or a combination of membrane and cytoplasmic staining) of any intensity were considered CTR1-positive. The slide was scanned using an Aperio CS2 virtual microscope (Leica Biosystem) and each core was analyzed using the Positive Pixel Count function of the Aperio Image Scope software (version 9.1, Leica Biosystem). CTR1 staining was scored according to intensity-weighted positive-pixel counting (PPC) methodology as basal CTR1 levels, similar to control liver (<10 PPC*1000/µm2), elevated (+), similar to control kidney (10-25 PPC*1000/µm2), intermediate elevated (++) staining (>25 PPC*1000/µm2) or strongly elevated (+++) staining (>40 PPC*1000/µm2).
Neuroblastoma xenograft mouse models
Animal used in the biological studies (i.e. no imaging) were approved by the Animal Ethics Committee at UNSW Australia (AEC# 14/36B) and animals were obtained from the Australian Bio Resources Facility (Moss Vale, NSW, Australia). Female BALB/c-Fox1nu/Ausb and Balb/c mice, 6-8 weeks old were injected subcutaneously into the right flank with 1x10⁶ human SK-N-BE(2)-C cells suspended in 100μL PBS and growth factor-reduced Matrigel™ (BD Biosciences) at a 1:1 ratio. When tumors reached approximately 200 mm3, mice were randomized into treatment groups (5 mice per group) and treated every 3 days for a total of 3 weeks with 300 µg/mL of DC. Tumor size was measured using Vernier calipers and mice were euthanized once tumors reached 1,000 mm3. Tumor volume was calculated using the formula ½xLxW2, where L and W represent the longer and shorter dimension, respectively. Animal weight was monitored every 3 days and survival was calculated. Tumor tissue was collected post-sacrifice and placed into 4% paraformaldehyde for histologic analysis or snap frozen in liquid N2 for biochemical analysis. All the PET imaging animal experiments were approved by the ANSTO Animal Care and Ethics Committee (Ethics approval ARA-279). For these studies, BALB/c-Fox1nu/Ausb female mice (6 weeks old) were obtained from The Animal Resources Centre, Perth. Upon arrival, animals were allowed to acclimatize for one week at the animal facility and had access to water and chow ad libitum. Xenografts were established by subcutaneous injection of 1.5x10⁶ SK-N-BE(2)-C cells suspended in a 1:1 mixture of 100 μL of cell culture medium and Matrigel™ in the subscapular region of the mice. Tumors were allowed to grow for 10 days, and the mice were included in this study (n = 5 per group) if tumor size reached 300 ± 100 mm3 or over, as measured by Vernier calipers.
Micro PET/CT imaging
On the day of PET scans, mice were anesthetized by inhalation of 1.5-2% Isoflurane (4% for induction) (Abbot Scandinavia AB) mixed with medical air. Mice were then treated with either saline (100µL) or Dextran-Catechin (300µg/mL in 100µL of saline) intravenously via lateral tail vein injection. 30 min after injection, 7.42 ± 3.24 MBq of [64Cu]CuCl2 in 70µL were injected into a tail vein, while maintained in a surgical plane of anaesthesia in the gantry of an Inveon PET/CT Scanner (Siemens, Munich, Germany). Mice were imaged from 0-2 h dynamic scan and received 15 min static scans at 5h, 24h and 48h for the initial optimization studies; the optimized conditions required only 2 static scans, at 5 h and 24 h. After completing of PET scan for each time point, a CT scan was performed to allow the co-registration of radiotracer uptake with tissues. At the end of the scan, animals were recovered from anaesthesia and transferred in their respective cages. The same procedure was repeated for the later time points, except after the last imaging scan the mice were sacrificed and selected organs harvested.
PET image reconstruction
Image reconstruction was performed using IAW 2.02 software (Siemens). The list mode data was histogrammed into 20 dynamic frames for 0-2 h dynamic scan, while the static scans were histogrammed into one single static frame. Emission sinograms were reconstructed using 2D-filter back projection with a zoom of 1.5. The reconstructed images consisted of 1 static frame of a 128 × 128 × 159 matrix with a voxel size of 0.52 × 0.52 × 0.796 mm3. The data was corrected for attenuation (CT-based), scatter, randoms, normalization, isotope decay, branching ratio, dead time and were calibrated to Bq/mL. PET and CT images were fused using the Inveon work place software (Siemens Medical Solutions), 3D ROIs were manually created on tumors and organs of interest, while the accumulation of 64Cu was quantified as % injected dose per gram (%ID/g).
Statistical analysis
In vitro data are presented as mean ± SEM of at least three independent experiments. In vivo experiments were performed with n=4 and n=5 animals per group. Multiple statistical comparisons between different groups were performed by using one-way ANOVA or t-test were applicable (GraphPad Prism 5, GraphPad Software Inc., La Jolla, CA). A p value <0.05 was considered statistically significant, and asterisks were used to indicate significance (*: p < 0.05, **: p < 0.01, ***: p < 0.001, ****: p < 0.0001).
Acknowledgements
This work was supported by the Children's Cancer Institute, which is affiliated with the University of New South Wales (UNSW Sydney) and the Sydney Children's Hospital Network, and by grants from the Australian Research Council (ARC Centre of Excellence in Convergent Bio-Nano Science and Technology CE140100036 to MK), National Health and Medical Research Council (NHMRC) Program Grant (APP1091261 to MK), and Tour de Cure Grant (MK), NHMRC Principal Research Fellowship (APP1119152 to MK), Cancer Institute NSW (CINSW Career Development Fellowship to OV), (AINSE Award 2015 to OV), and (Cure Cancer Australia APP1141582 to OV).
Author contributions
AC, GP, OV conceptualized the work; AP, GP, OV planned the work; FS performed IHC staining; EY, KK, OV, AA-C, FV, LL performed the biological experiments; GC synthesized the drug conjugate; NL formulated the radiotracer; AA, AP, GJL, DZ, GR performed the imaging experiments; AP, GP, MK, OV supervised the work; AP, GP, MK, OV wrote the manuscript; all the authors reviewed the final version.
Supplementary Material
Supplementary figures.
Competing Interests
The authors have declared that no competing interest exists.
References
1. Harris ZL, Gitlin JD. Genetic and molecular basis for copper toxicity. Am J Clin Nutr. 1996;63:836s-41s
2. PASE L, VOSKOBOINIK I, GREENOUGH M, CAMAKARIS J. Copper stimulates trafficking of a distinct pool of the Menkes copper ATPase (ATP7A) to the plasma membrane and diverts it into a rapid recycling pool. Biochem J. 2004;378:1031-7 doi:10.1042/bj20031181
3. Denoyer D, Masaldan S, La Fontaine S, Cater MA. Targeting copper in cancer therapy: “Copper That Cancer”. Metallomics. 2015;7:1459-76 doi:10.1039/c5mt00149h
4. Gupte A, Mumper RJ. Elevated copper and oxidative stress in cancer cells as a target for cancer treatment. Cancer Treat Rev. 2009;35:32-46 doi:10.1016/j.ctrv.2008.07.004
5. Henry NL, Dunn R, Merjaver S, Pan Q, Pienta KJ, Brewer G. et al. Phase II Trial of Copper Depletion with Tetrathiomolybdate as an Antiangiogenesis Strategy in Patients with Hormone-Refractory Prostate Cancer. Oncology. 2006;71:168-75 doi:10.1159/000106066
6. Gupte A, Mumper RJ. Copper chelation by D-penicillamine generates reactive oxygen species that are cytotoxic to human leukemia and breast cancer cells. Free Radic Biol Med. 2007;43:1271-8 doi:10.1016/j.freeradbiomed.2007.07.003
7. Yoshii J, Yoshiji H, Kuriyama S, Ikenaka Y, Noguchi R, Okuda H. et al. The copper-chelating agent, trientine, suppresses tumor development and angiogenesis in the murine hepatocellular carcinoma cells. Int J Cancer. 2001;94:768-73 doi:10.1002/ijc.1537
8. Chan N, Willis A, Kornhauser N, Ward MM, Lee SB, Nackos E. et al. Influencing the Tumor Microenvironment: A Phase II Study of Copper Depletion Using Tetrathiomolybdate in Patients with Breast Cancer at High Risk for Recurrence and in Preclinical Models of Lung Metastases. Clin Cancer Res. 2017;23:666-76 doi:10.1158/1078-0432.CCR-16-1326
9. Laughlin RS, Taylor SW, Kumar N, Klein CJ, Dyck PJB. Copper deficiency: Clinical, physiological and pathological characterization of the associated peripheral neuropathy. J Peripher Nerv Syst. 2013;18:S61-2
10. Pinto NR, Applebaum MA, Volchenboum SL, Matthay KK, London WB, Ambros PF. et al. Advances in Risk Classification and Treatment Strategies for Neuroblastoma. J Clin Oncol. 2015;33:3008-17 doi:10.1200/JCO.2014.59.4648
11. Vittorio O, Brandl M, Cirillo G, Kimpton K, Hinde E, Gaus K. et al. Dextran-Catechin: An anticancer chemically-modified natural compound targeting copper that attenuates neuroblastoma growth. Oncotarget. 2016;7:47479-93 doi:10.18632/oncotarget.10201
12. Maryon EB, Molloy SA, Kaplan JH. Cellular glutathione plays a key role in copper uptake mediated by human copper transporter 1. Am J Physiol Physiol. 2013;304:C768-79 doi:10.1152/ajpcell.00417.2012
13. Biggin C, Harris M, Hedt A, Jeffery C. Radiological properties of Next Generation Theranostics (Cu-64/Cu-67). J Nucl Med. 2017;58:1014
14. Peng F, Liu J, Wu J, Lu X, Muzik O. Mouse Extrahepatic Hepatoma Detected on MicroPET Using Copper (II)-64 Chloride Uptake Mediated by Endogenous Mouse Copper Transporter 1. Mol Imaging Biol. 2005;7:325-9 doi:10.1007/s11307-005-0021-4
15. Capasso E, Durzu S, Piras S, Zandieh S, Knoll P, Haug A. et al. Role of 64CuCl2 PET/CT in staging of prostate cancer. Ann Nucl Med. 2015;29:482-8 doi:10.1007/s12149-015-0968-4
16. Yee EMH, Brandl MB, Pasquier E, Cirillo G, Kimpton K, Kavallaris M. et al. Dextran-Catechin inhibits angiogenesis by disrupting copper homeostasis in endothelial cells. Sci Rep. 2017;7:7638. doi:10.1038/s41598-017-07452-w
17. Traverso N, Ricciarelli R, Nitti M, Marengo B, Furfaro AL, Pronzato MA. et al. Role of Glutathione in Cancer Progression and Chemoresistance. Oxid Med Cell Longev. 2013;2013:1-10 doi:10.1155/2013/972913
18. Steinebach OM, Wolterbeek HT. Role of cytosolic copper, metallothionein and glutathione in copper toxicity in rat hepatoma tissue culture cells. Toxicology. 1994;92:75-90
19. Petris MJ, Smith K, Lee J, Thiele DJ. Copper-stimulated Endocytosis and Degradation of the Human Copper Transporter, hCtr1. J Biol Chem. 2003;278:9639-46 doi:10.1074/jbc.M209455200
20. Wu J, Li M, Cao L, Sun M, Chen D, Ren H. et al. Protease Omi cleaving Hax-1 protein contributes to OGD/R-induced mitochondrial damage in neuroblastoma N2a cells and cerebral injury in MCAO mice. Acta Pharmacol Sin. 2015;36:1043-52 doi:10.1038/aps.2015.50
21. Peng F, Lutsenko S, Sun X, Muzik O. Imaging Copper Metabolism Imbalance in Atp7b -/- Knockout Mouse Model of Wilson's Disease with PET-CT and Orally Administered 64CuCl2. Mol Imaging Biol. 2012;14:600-7 doi:10.1007/s11307-011-0532-0
22. Peng F, Lutsenko S, Sun X, Muzik O. Positron Emission Tomography of Copper Metabolism in the Atp7b -/- Knock-out Mouse Model of Wilson's Disease. Mol Imaging Biol. 2012;14:70-8 doi:10.1007/s11307-011-0476-4
23. Zhang J-P, Zhang Y-J, Xu J-Y, Yang Z-Y. Radiation dosimetry estimates of [18F]-fluoroacetate based on biodistribution data of rats. Appl Radiat Isot. 2012;70:332-5 doi:10.1016/j.apradiso.2011.09.025
24. Bartnicka JJ, Blower PJ. Insights into Trace Metal Metabolism in Health and Disease from PET: “PET Metallomics”. J Nucl Med. 2018;59:1355-9 doi:10.2967/jnumed.118.212803
25. Zhang K, Aruva MR, Shanthly N, Cardi CA, Rattan S, Patel C. et al. PET Imaging of VPAC1 Expression in Experimental and Spontaneous Prostate Cancer. J Nucl Med. 2007;49:112-21 doi:10.2967/jnumed.107.043703
26. Cai H, Wu J, Muzik O, Hsieh J-T, Lee RJ, Peng F. Reduced 64Cu uptake and tumor growth inhibition by knockdown of human copper transporter 1 in xenograft mouse model of prostate cancer. J Nucl Med. 2014;55:622-8 doi:10.2967/jnumed.113.126979
27. Kim ES, Tang X, Peterson DR, Kilari D, Chow C-W, Fujimoto J. et al. Copper transporter CTR1 expression and tissue platinum concentration in non-small cell lung cancer. Lung Cancer. 2014;85:88-93 doi:10.1016/j.lungcan.2014.04.005
28. Vittorio O, Cojoc M, Curcio M, Spizzirri UG, Hampel S, Nicoletta FP. et al. Polyphenol Conjugates by Immobilized Laccase: The Green Synthesis of Dextran-Catechin. Macromol Chem Phys. 2016;217:1488-92 doi:10.1002/macp.201600046
Author contact
![]() Corresponding authors: MKavallarisorg.au; OVittorioorg.au
Corresponding authors: MKavallarisorg.au; OVittorioorg.au