Theranostics
13.3
Impact Factor
- Current Issue
- Advance Articles
- Volume 16; 2026
- Volume 15; 2025
- Volume 14; 2024
- Volume 13; 2023
- Volume 12; 2022
- Archive
- Cover Images
- Cover Suggestion
- Special Issues
Top
Introduction
Results
Discussion
Materials and methods
Abbreviations
Supplementary Material
Acknowledgements
References
Introduction
Results
Discussion
Materials and methods
Abbreviations
Supplementary Material
Acknowledgements
References
International Journal of Biological Sciences
International Journal of Medical Sciences
 Global reach, higher impact

Theranostics 2018; 8(20):5713-5730. doi:10.7150/thno.28778 This issue Cite
Research Paper
Caffeine Protects Skin from Oxidative Stress-Induced Senescence through the Activation of Autophagy
Yi-Fang Li1*, Shu-Hua Ouyang1*, Long-Fang Tu1, Xi Wang1, Wei-Lin Yuan1, Guo-En Wang1, Yan-Ping Wu1, Wen-Jun Duan1, Hong-Min Yu1, Zhong-Ze Fang2, Hiroshi Kurihara1, Youwei Zhang3 ![]() , Rong-Rong He1
, Rong-Rong He1 ![]()
1. Anti-Stress and Health Research Center, College of Pharmacy, Jinan University, Guangzhou, Guangdong 510632, China
2. Department of Toxicology, School of Public Health, Tianjin Medical University, Heping District, Tianjin, China
3. Department of Pharmacology, Case Comprehensive Cancer Center, Case Western Reserve University, Cleveland, OH 44106, USA
*These authors contributed equally to this work
Received 2018-7-26; Accepted 2018-10-4; Published 2018-11-10
Citation:
Li YF, Ouyang SH, Tu LF, Wang X, Yuan WL, Wang GE, Wu YP, Duan WJ, Yu HM, Fang ZZ, Kurihara H, Zhang Y, He RR. Caffeine Protects Skin from Oxidative Stress-Induced Senescence through the Activation of Autophagy. Theranostics 2018; 8(20):5713-5730. doi:10.7150/thno.28778. https://www.thno.org/v08p5713.htm
Other stylesAbstract

Skin cells are vulnerable to oxidative stress-induced senescence, which may lead to abnormal aging or aging-related disorders. Therefore, strategies that can ameliorate oxidative stress-induced senescence are expected to protect skin from damage, holding the promise of treating skin diseases in the clinic. This study aims to investigate whether caffeine, a well-known purine alkaloid, is able to prevent skin from oxidative stress-induced senescence, and to explore the underlying molecular mechanisms.
Methods: A free radical inducer 2,2'-Azobis (2-amidinopropane) dihydrochloride (AAPH) was used to induce oxidative stress and cellular senescence in both transformed skin cells and in normal human epidermal keratinocytes (NHEKs). Ultraviolet (UV) irradiation was established as the in vivo oxidative stress model in mouse skin tissues. Cellular senescence was determined by SA β-galactosidase staining, immunofluorescence and western blotting. Activation of autophagy was confirmed by western blotting, immunofluorescence, and transmission electron microscopy. Reactive oxygen species (ROS) detection by commercial kits, gene knockdown by RNA interference (RNAi) and receptor activation/inactivation by agonist/antagonist treatment were applied in mechanistic experiments.
Results: We report that AAPH induced senescence in both transformed skin cells and in NHEKs. Similarly, UV irradiation induced senescence in mouse skin tissues. Remarkably, low dose of caffeine (<10 μM) suppressed cellular senescence and skin damage induced by AAPH or UV. Mechanistically, caffeine facilitated the elimination of ROS by activating autophagy. Using a combination of RNAi and chemical treatment, we demonstrate that caffeine activates autophagy through a series of sequential events, starting from the inhibition of its primary cellular target adenosine A2a receptor (A2AR) to an increase in the protein level of Sirtuin 3 (SIRT3) and to the activation of 5' adenosine monophosphate-activated protein kinase (AMPK). Oral administration of caffeine increased the protein level of SIRT3, induced autophagy, and reduced senescence and tissue damage in UV-irradiated mouse skin. On the other hand, co-administration with autophagy inhibitors attenuated the protective effect of caffeine on UV-induced skin damage in mice.
Conclusion: The results reveal that caffeine protects skin from oxidative stress-induced senescence through activating the A2AR/SIRT3/AMPK-mediated autophagy. Our study not only demonstrated the beneficial effect of caffeine using both in vitro and in vivo models, but also systematically investigated the underlying molecular mechanisms. These discoveries implicate the potential of caffeine in the protection of skin disease.
Keywords: autophagy, caffeine, cellular senescence, skin aging, UV radiation
Introduction
Senescence is an important mechanism that protects cells from oncogenic stresses [1]. However, senescence also contributes to age-related pathologies in various tissues, especially in the skin [2, 3]. Cellular senescence induces aberrant collagen homeostasis [4] and causes gradual loss of epidermal stem cell function [5], which will eventually disrupt the structural integrity and the function of skin, resulting in skin aging. Accumulation of molecular damage due to reactive oxygen species (ROS) generation has long been thought to drive skin aging [2, 6], indicating oxidative stress as a causative factor of skin senescence. ROS can be engendered by a variety of sources, such as UV light, environment pollution, mitochondria respiration [7]. Among these factors, UV irradiation is considered to be most deleterious in inducing cellular senescence and aging in the skin [8]. Hence, inhibiting oxidative stress-induced senescence has the potential to protect skin from damage, holding the promise of treating human skin disorders in the clinic.
1,3,7-trimethylxanthine (caffeine) is a bioactive natural compound that exists in coffee, tea, and many other food products. Caffeine elicits a variety of biological functions across a wide range of doses, including smooth muscle relaxation, calcium release, anti-oxidative stress, lipid metabolism, etc. [9]. The primary target of caffeine is the G-protein coupled adenosine receptors at the central and peripheral nervous systems, as well as in organs including heart and lung [10]. Caffeine shows the highest affinity (~10 μM) towards the A2AR subtype of adenosine receptors [11]. At high dose (mM range), caffeine also inhibits the ataxia telangiectasia mutated and Rad3-related (ATR) kinase and subsequently the DNA damage response [12]. Recent studies suggest a protective role of caffeine against oxidative stress and senescence. For instance, caffeine inhibited oxidative stress-induced senescence in human vascular endothelial cells [13], and extended the lifespan of yeast [14]. Topical application of high dose of caffeine protected mouse skin from UVB-induced photodamage [15], and this protective effect mainly resulted from the inhibition of ATR followed by induction of apoptotic cell death. However, the precise mechanisms remain elusive and it is unclear whether caffeine at low concentrations (e.g., μM) could protect skin cells or tissues from oxidative stress-induced cellular senescence.
Autophagy is a highly orchestrated process that clears damaged proteins and organelles inside the cell [16]. Decline in or inhibition of autophagy is associated with senescence and premature aging [17, 18]. Conversely, activation of autophagy inhibited stress-induced cellular senescence and delayed aging [19]. We recently reported that trans-resveratrol protected macrophage from oxidative stress through activating the SIRT3/AMPK-induced autophagy [20], suggesting a critical role of the SIRT3/AMPK pathway in autophagy activation in the presence of oxidative stress. SIRT3 belongs to the mammalian sirtuin family (SIRT1-7) member and has gained particular interest to the aging field due to its localization in the mitochondria and the association with exceptionally long lifespan in humans [21]. SIRT3 mediates the protective effect of caloric restriction on age-related hearing loss [22], and plays a protective role against cardiac aging [23]. Up-regulation of SIRT3 improved the regenerative capacity of aged hematopoietic stem cells [24] and antagonized high glucose-induced senescence in human fibroblasts [25]. AMPK, a key energy sensor, is a downstream target of SIRT3 and a known positive regulator of autophagy [26]. It does so through directly phosphorylating Unc-51 like kinase 1 (ULK1) [27] and/or BECN1/Beclin1 [28] in parallel to its inhibition on the mechanistic target of rapamycin (mTOR) [29]. Therefore, SIRT3 and AMPK could serve as critical mediators of autophagy in response to oxidative stress.
To determine the role of caffeine (low dose) in protecting skin tissues or cells from oxidative stress, we utilized 2,2'-Azobis (2-amidinopropane) dihydrochloride (AAPH), a commonly used water-soluble azo free radical initiator, as the oxidative stress model in vitro. AAPH has been extensively used as a source of ROS [30] to explore the physiological and pathological roles of oxidative stress both in vitro [20] and in vivo [31]. Although not fully understood, it is assumed that AAPH will lead to the production of peroxyl [32] and alkoxy radicals [33]. In addition, we also employed UV radiation as the in vivo oxidative stress model. Here we report that low dose of caffeine (1-10 μM) inhibits AAPH- or UV-induced skin cell senescence through activating the A2AR/SIRT3/AMPK-mediated autophagy. These results illustrate the molecular mechanisms underlying the protective effect of caffeine against oxidative stress-induced skin damage.
Results
AAPH induces cellular senescence
To explore strategies that can ameliorate oxidative stress-induced skin aging, we first established senescence models in human A375 melanoma cells and mouse NIH3T3 fibroblasts by AAPH. 3-(4,5-dimethylthiazol-2-yl)-2,5-diphenyl tetrazolium bromide (MTT) survival assay showed that AAPH inhibited the proliferation of both A375 (Figure 1A) and NIH3T3 (Figure 1F) cells in a time- and concentration-dependent manner. To understand how AAPH inhibited cell proliferation, we analyzed cell cycle and cell death by propidium iodide (PI) and PI/Annexin V staining, respectively. AAPH at doses below 4 mM rarely affected the cell cycle (Figure S1) nor induced cell death (Figure S2). However, when the dose was increased to 8 mM and above, AAPH changed the cell cycle profile (mostly G2/M phase arrest, Figure S1) and induced cell death (apoptotic and non-apoptotic, Figure S2). These results suggest a bipartite growth inhibitory effect of AAPH: at high dose, it induces cell cycle arrest and cell death; at low dose, AAPH is generally non-toxic and therefore inhibits cell proliferation through as-yet unidentified mechanisms (e.g., senescence as shown below). Co-treatment with 1 mM n-acetyl-L-cysteine (NAC), a known antioxidant, significantly suppressed the growth inhibition effect of AAPH in A375 cells (Figure 1B, P < 0.05), confirming the role of oxidative stress in AAPH-induced cell growth inhibition.
Subsequently, we asked if AAPH could induce senescence in skin cells. To this end, we analyzed three widely accepted senescence markers. First, we measured senescence-associated β-galactosidase (SA β-Gal) activity. The results show that AAPH dramatically increased the SA β-Gal activity in A375 (Figure 1C, left, 1 mM for 48 h) and NIH3T3 cells (Figure 1G, 24 h), which was significantly suppressed by NAC. These data allowed us to choose a treatment of AAPH at 1 mM for 48 h for A375 cells and 2 mM for 24 h for NIH3T3 cells, respectively, in the following studies. Second, we monitored formation of senescence-associated heterochromatin foci (SAHF), a senescence marker that can be visualized as punctate nuclear focus when staining cells with DAPI or antibodies against K9 trimethylated histone 3 (designated as K9M-H3) [34]. As shown in Figure 1D, AAPH caused robust SAHF formation in A375 cells, which was significantly reduced by NAC (Figure 1D, P < 0.01). Third, we examined activation of p53 and p21, as the p53-p21 pathway not only regulates cell cycle arrest and cell death, but also plays a critical role in senescence induction [35]. AAPH significantly increased the protein level of p21 and elevated p53 phosphorylation in A375 cells (Figure 1E), indicating activation of this pathway. Co-treatment with NAC reversed the AAPH-induced activation of the p53-p21 pathway (Figure 1E, P < 0.01). These results suggest that AAPH induces cellular senescence in transformed skin cells in a manner dependent on oxidative stress.
Figure 1
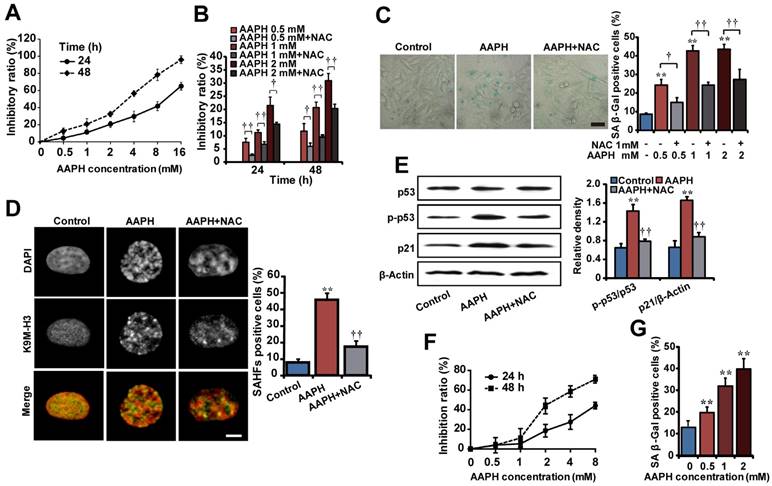
Senescence cell models induced by AAPH. (A) The cell growth inhibitory effect of AAPH on A375 cells determined by the MTT assay. (B) Effects of NAC (1 mM) on AAPH-induced A375 cell growth inhibition. (C) SA β-Gal staining in A375 cells. Representative images of cells treated with 1 mM AAPH and NAC are shown. Scale bar = 40 μm. The ratio of SA β-Gal positive cells was presented in the right panel. (D) A375 cells were treated with 1 mM of AAPH for 48 h, stained with the anti-K9M-H3-Alexa Fluor 488 antibodies and co-stained with DAPI. Black and white images were used for DAPI and K9M-H3 to better visualize the punctate structures of SAHF. Yellow represented co-localization of DAPI and Alexa Flour 488. Scale bar = 5 μm. Quantitation of SAHF-positive cells is shown on the right. (E) Protein expression of total p53, phosphorylated p53 (p-p53) and p21 in A375 cells determined by western blotting (left). On the right, the protein band intensity from each blot was quantitated and normalized based on that of the β-Actin blot. (F) The inhibitory effect of AAPH on NIH3T3 cell growth. (G) AAPH (24 h)-induced SA β-Gal activity in NIH3T3 cells. Data represent mean ± S.E.M. from three independent experiments. **P < 0.01 vs. Control group, †P < 0.05 and ††P < 0.01 vs. AAPH group.
Caffeine inhibits AAPH-induced oxidative stress and senescence
Caffeine had been shown to inhibit oxidative stress-induced vascular endothelial cell senescence [13]. We found that caffeine at 2.5-10 μM significantly attenuated the growth inhibitory effect of AAPH in NIH3T3 cells (Figure S3A). This prompted us to ask whether caffeine could suppress AAPH-induced cellular senescence. We found that caffeine indeed inhibited AAPH-induced increase in the SA β-Gal activity in A375 (Figure 2A) and NIH3T3 cells (Figure S3C). Further, caffeine suppressed AAPH-induced SAHF formation in A375 cells (Figure 2B), increases in p53 phosphorylation and p21 protein levels both in A375 (Figure 2C) and in NIH3T3 cells (Figure S3B). These results show that caffeine inhibits oxidative stress-induced cellular senescence.
Since caffeine was reported to protect cells from oxidative stress [36], we asked if caffeine could inhibit the effect of AAPH through reducing the level of ROS in cells by measuring ROS generation. The results show that AAPH at 1 mM dramatically increased the cellular level of ROS in A375 cells, which was reduced by caffeine in a dose-dependent manner (Figure 2D-E). Caffeine reduced AAPH-induced ROS to a level comparable to that inhibited by NAC (Figure 2D-E). Using two plasmids, pHyPer-cyto and pHyPer-dMito, to monitor ROS generation in situ in the cytosol and in the mitochondria [37], respectively, we show that caffeine dramatically reduced AAPH-induced ROS both in the cytosol and in the mitochondria (Figure 2F).
Glutathione (GSH) plays a key role in quenching ROS inside the cell [38]. Therefore, we asked if AAPH and caffeine could affect cellular GSH levels. Using high-pressure liquid chromatography equipped with electrochemical detector (HPLC-ECD), we show that AAPH reduced the cellular level of GSH in A375 cells (Figure S4A), indicating constant clearance of ROS by GSH followed by depletion of this endogenous antioxidant. Caffeine significantly, although not completely, inhibited AAPH-induced GSH reduction (Figure S4A, P < 0.05). ROS could react with polyunsaturated fatty acids in lipid membranes and induce lipid peroxidation [39]. Therefore, we assessed lipid peroxidation by measuring the production of malondialdehyde (MDA) using the thiobarbituric acid reactive substance (TBARS) assay and protein expression of 4-hydroxynonenal (4-HNE) using western blotting in AAPH-treated A375 cells. Protein carbonyl content was also measured as a biomarker of oxidative protein damage [40]. Results show that AAPH significantly elevated the cellular contents of MDA (Figure S4B, P < 0.01), 4-HNE (Figure S4E), and protein carbonyl (Figure S4F, P < 0.05). Importantly, these changes caused by AAPH were all inhibited by caffeine.
To understand if caffeine could directly chelate ROS, we performed in vitro oxygen radical absorbance capacity (ORAC) assay [41]. Trolox, a free radical scavenger, dramatically reduced AAPH-induced ROS (Figure 2G). Similarly, the antioxidant NAC dose-dependently quenched ROS (Figure 2G). However, caffeine failed to chelate ROS in vitro even at 10 μM (Figure 2G), a concentration that is high enough to significantly reduce ROS levels in cells (Figure 2D-E). These results suggest that caffeine reduces cellular ROS levels through mechanisms distinct from directly chelating ROS.
Autophagy accounts for the anti-senescence effect of caffeine
Rapamycin, an autophagy inducer, inhibited AAPH-induced SA β-Gal activity (Figure 2A), SAHF foci formation (Figure 2B), p53 phosphorylation and p21 level increase (Figure 2C), suggesting that activation of autophagy attenuated the effect of AAPH. To understand if autophagy has accounted for the anti-senescence effect of caffeine, we co-treated cells with caffeine and 3-methyladenine (3-MA), an autophagy inhibitor [42]. We found that 3-MA almost completely blocked the inhibitory effect of caffeine on AAPH-induced SA β-Gal activity (Figure 2A and Figure S3C) and SAHF formation (Figure 2B). Further, caffeine increased both BECN1 levels and LC3 I/II conversion, two autophagy markers [42], in A375 (Figure 3A) and NIH3T3 cells (Figure S3D). Importantly, the effect of caffeine was enhanced by rapamycin but suppressed by 3-MA (Figure 3A). In contrast, NAC did not affect the expression levels of these autophagy proteins (Figure 3A and Figure S3D). Similar to caffeine, rapamycin also inhibited the AAPH-induced decrease in GSH (Figure S4A) and the increase in MDA, protein carbonyl and 4-HNE levels (Figure S4B, S4E and S4F). These data suggest that unlike NAC that directly quenches ROS, caffeine likely suppresses the oxidative stress-induced senescence through the activation of autophagy.
Mitophagy is a special form of autophagy that maintains cell homeostasis through clearing damaged mitochondria with reduced membrane potential [43]. To determine if mitophagy is involved in the protective effect of caffeine, we examined autophagosome formation by transmission electron microscope (TEM). Control A375 (Figure 3B) or NIH3T3 (Figure 3E) cells displayed normal tubular mitochondria, whereas swollen mitochondria were present in AAPH treated cells. Co-treatment with caffeine induced autophagosome formation in AAPH-treated cells (Figure 3B and 3E). The cargo in the autophagosomes appeared to be degrading mitochondria (Figure 3B and 3E, indicated by arrows), suggesting that caffeine triggered mitophagy in AAPH-treated cells. As expected, caffeine reduced the increased level of p21 and suppressed p53 phosphorylation (Figure 3C and Figure S3B), and these effects of caffeine were suppressed by 3-MA. However, co-treatment with rapamycin did not further enhance the effect of caffeine (Figure 3C), indicating that these two agents might converge on the same pathway (e.g., autophagy activation). Although NAC did not affect expression of autophagy markers, it reversed the effect of AAPH on p21 up-regulation and p53 phosphorylation (Figure 3C), reinforcing the idea that NAC inhibits senescence through directly quenching ROS, but not though autophagy activation. Interestingly, we found that caffeine alone did not significantly alter levels of autophagy markers or biological activities (e.g., Figure 3A, 3C and 4C below), indicating that caffeine only elicits protective effects when there is oxidative stress. This fits well with the concept of antagonist, supporting a role of caffeine in protecting oxidative stress-induced skin damage.
To directly confirm the activation of mitophagy, we expressed RFP-LC3 and pAcGFP1-Mito to monitor autophagosome formation and mitochondria morphology, respectively, in live cells. Control NIH3T3 cells displayed normal uniform network of mitochondria (Figure 3D, green fluorescence, inserted images with higher magnification). AAPH treatment induced mitochondria fragmentation (Figure 3D). Co-treatment with caffeine at least partially restored the normal mitochondria network and induced punctate appearance of RFP-LC3, indicating the presence of autophagosome and the activation of autophagy (Figure 3D). Using Image J software to analyze the co-localization between RFP-LC3 and pAcGFP1-Mito signals, we revealed a positive correlation between RFP-LC3 and mitochondria by caffeine (Figure 3D, Pearson's correlation). Similar to 3-MA, Mdivi-1, a mitophagy inhibitor that prevents mitochondria fission [44], dramatically reduced the caffeine-induced autophagosome formation (Figure 3D). As a negative control, RFP-LC3 did not co-localize with cytoskeletal F-Actin (Figure S5). These data suggest that the caffeine-induced autophagy is largely mitophagy.
Caffeine protects normal human epidermal keratinocytes (NHEKs) from oxidative stress
To expand the biological significance of our results, we asked if the protective effect of caffeine could be recapitulated in primary human skin cells. To do so, we treated NHEKs isolated from adult abdominal skin with 1 mM of AAPH for 48 h in the presence or absence of caffeine, rapamycin or 3-MA, and detected cellular senescence and autophagy activation by measuring SA β-Gal activity and autophagy marker protein expression, respectively. AAPH increased the SA β-Gal activity in NHEKs, which was largely blocked by caffeine or rapamycin (Figure 4A). Conversely, co-treatment with the autophagy inhibitor 3-MA attenuated the protective effect of caffeine (Figure 4A). Caffeine decreased p53 phosphorylation and p21 protein levels, increased BECN1 protein levels and LC3 I/II conversion in AAPH-treated NHEKs (Figure 4C). Furthermore, mitophagy was identified in caffeine treated cells as indicated by the punctate staining of endogenous LC3β protein (Figure 4B in green), which co-localized with the mitochondria marker Mito-Red (Figure 4B in red). Importantly, the autophagy inhibitor 3-MA suppressed the effect of caffeine (Figure 4B). These results demonstrate that caffeine also protects normal human skin cells from oxidative stress-induced senescence through activating autophagy/mitophagy.
The A2AR/SIRT3/AMPK pathway is responsible for caffeine-activated autophagy
Subsequently we investigated the signaling pathway that leads to the activation of autophagy by caffeine. Caffeine targets many cellular proteins including ATR, mTOR and A2AR. To understand if inhibition of ATR is involved or not, we assessed phosphorylation of ATR and its downstream target checkpoint kinase 1 (Chk1), both are markers of the DNA damage response [45, 46]. ATR is phosphorylated under normal growth conditions (Figure S6A), consistent with previous publication [46]. Treatment of cells with 1 mM AAPH, 1 μM caffeine alone or in combination did not increase ATR phosphorylation (Figure S6A). On the other hand, camptothecin (CPT), a topoisomerase 1 inhibitor and also a known DNA damage inducer, increased the level of p-ATR. Most importantly, pretreatment with caffeine did not inhibit the increase in p-ATR by CPT in A375 cells (Figure S6A), consistent with the fact that the concentration of caffeine used here (1-10 μM) was much lower than the IC50 (greater than 2 mM) required to inhibit ATR [12]. Similarly, AAPH or caffeine alone did not induce Chk1 phosphorylation. Further, caffeine at this concentration did not prevent Chk1 phosphorylation induced by CPT (note that the slight reduction in p-Chk1 in caffeine-treated A375 cells in Figure S6A resulted from the lower level of total Chk1 protein). These data suggest that AAPH did not activate the DNA damage response and caffeine did not inhibit ATR in these experimental settings. Similarly, caffeine at 1-10 μM did not appear to inhibit mTOR, as evidenced by the lack of significant reduction in the level of phosphorylated mTOR or the mTOR downstream target p70S6K (Figure 3A). In contrast, the mTOR inhibitor rapamycin dramatically reduced levels of p-p70S6K, and to a much lesser degree, p-mTOR (Figure 3A). Combined, these results suggest that inhibition of ATR or mTOR is not involved in the protective effect of caffeine against AAPH-induced oxidative damage.
The concentrations of caffeine that we used here are known to inhibit its primary target, A2AR [11]. To confirm that caffeine indeed inhibited A2AR, we measured the cellular level of cAMP, since A2AR activates adenylyl cyclase and induces the synthesis of intracellular cAMP [10]. CGS21680, a classic A2AR agonist [47], increased the cellular level of cAMP in a dose-dependent manner (Figure 5A, CGS); however, treatment with 5 μM caffeine significantly suppressed cAMP production by CGS21680 (Figure 5A), indicating the inhibition of A2AR. As A2AR is a known receptor for adenosine [10], we measured the cellular level of ATP. We found that AAPH alone or in combination with caffeine did not significantly alter the cellular level of ATP (Figure S7), indicating that AAPH or caffeine does not regulate the cellular level of ATP.
To determine if inhibition of A2AR is required for caffeine-activated autophagy, we depleted ADORA2A, the gene expressing A2AR, and examined AAPH-induced senescence. The results show that a 40-60% reduction in A2AR protein levels by two independent small interfering RNAs (siRNAs) already significantly inhibited AAPH-induced p53 phosphorylation and p21 increase (Figure 5B and Figure S8A). In parallel, ADORA2A depletion increased BECN1 levels and induced LC3 I/II conversion (Figure 5B and Figure S8A), indicating the activation of autophagy. Most importantly, ADORA2A depletion dramatically reduced AAPH-induced SA β-Gal activity in A375 cells (Figure 5C and Figure S8B). These results of ADORA2A depletion are reminiscent of caffeine treatment, suggesting that inhibition of A2AR is able to activate autophagy and inhibit senescence induced by AAPH.
We also noticed that depletion of ADORA2A inhibited the reduction in the protein level of SIRT3 by AAPH (Figure 5B and Figure S8A). Given that SIRT3 has been reported to activate mitophagy [48] through its downstream factor AMPK [29], we explored the involvement of the SIRT3/AMPK pathway in caffeine-activated autophagy. We observed that AAPH reduced the protein level of SIRT3 and phosphorylation of AMPK (Figure 5D). However, caffeine rescued both SIRT3 level and AMPK phosphorylation in the presence of AAPH (Figure 5D). Like caffeine, SCH58261, another selective A2AR antagonist [49], strongly suppressed AAPH-induced inhibition on SIRT3 protein level and AMPK phosphorylation (Figure 5D, SCH). In contrast, the A2AR agonist CGS21680 greatly inhibited the effect of caffeine (Figure 5D, CGS). These results suggest that inhibition of A2AR is an upstream event of SIRT3 and AMPK by caffeine.
To further determine the role of A2AR in the caffeine-induced autophagy, we measured BECN1 protein levels and LC3 I/II conversion. Caffeine and the A2AR antagonist SCH58261 increased BECN1 protein levels and LC3 I/II conversion, whereas the A2AR agonist CGS21680 almost completely blocked these effects of caffeine (Figure 5E). Furthermore, AAPH-induced p53 phosphorylation, p21 up-regulation, and SAHF formation were suppressed by SCH58261 in a manner similar to caffeine (Figure 5F-G). In contrast, the agonist CGS21680 reversed the inhibitory effect of caffeine (Figure 5F-G). These data suggest that caffeine induces autophagy through the inhibition of A2AR followed by the activation of the SIRT3/AMPK pathway. Inhibition of mTOR is known to activate autophagy. However, our results show that caffeine activated autophagy without the inhibition of mTOR (Figure 3A). The elevated AMPK phosphorylation could explain this discrepancy, as activation of AMPK is able to directly activate autophagy through regulating ULK1 [27] and/or BECN1 [28].
To confirm the role of SIRT3/APMK in caffeine-activated autophagy, we knocked down SIRT3 by two siRNAs in A375 cells (Figure 5H and Figure S8C). We found that caffeine showed much less effect on AAPH-reduced AMPK phosphorylation in SIRT3 depleted cells than in control cells (Figure 5J and Figure S8D), confirming that SIRT3 is the major upstream regulator of AMPK. Moreover, the increased BECN1 protein level and LC3 I/II conversion by caffeine were significantly reduced by siRNA targeted SIRT3 (Figure 5I and Figure S8E). Further, SIRT3 depletion abolished the inhibitory effect of caffeine on AAPH-induced p53 phosphorylation and p21 up-regulation (Figure 5K and Figure S8F).
To further determine the importance of autophagy in the effect of caffeine, we utilized a HeLa cell line whose BECN1 has been stably depleted by RNAi [50]. We observed that loss of BECN1 attenuated the inhibitory effect of caffeine on AAPH-induced increase in the SA β-Gal activity (Figure S9), confirming that autophagy is required for the inhibitory effect of caffeine on oxidative stress-induced senescence. Together, these results suggest that caffeine inhibits A2AR, leading to an increase in protein levels of SIRT3 and subsequently AMPK phosphorylation, which ultimately activates autophagy and attenuates cellular senescence induced by ROS.
Caffeine inhibits UV light-induced senescence in mouse dorsal skin by autophagy
UV irradiation can generate free radicals and cause oxidative damage in the epidermis and the dermis of skin [51]. Since our data show that caffeine triggers autophagy to protect normal skin cells from oxidative damage, we asked whether caffeine could protect UV-induced skin tissue damage. Similar to AAPH, UV irradiation increased the SA β-Gal activity in skin tissues (Figure 6A). The SA β-Gal staining pattern in our hands is similar to a previous report, in which UV light induced senescence in the skin of TP53 deficient mice [52]. UV irradiation also greatly increased the epidermis thickness (Figure S10) and reduced the collagen fiber content (Figure 6B) in mouse dorsal skin. Remarkably, oral administration of caffeine (10 to 20 mg/kg) reduced the UV-induced SA β-Gal activity (Figure 6A, indicated by yellow arrows) and the increase in the epidermis thickness (Figure S10) of mouse skin. In contrast, the collagen fiber content was increased by caffeine (Figure 6B). We also detected increases in p21 protein levels and p53 phosphorylation in skin tissues by UV irradiation (Figure 6C), indicating the activation of the p53-p21 pathway. Importantly, caffeine suppressed increases in both p21 protein level and p53 phosphorylation caused by UV in the skin tissue (Figure 6C). These data suggest that caffeine also protected skin from UV damage in mice, as seen in AAPH-treated cell cultures.
Figure 2
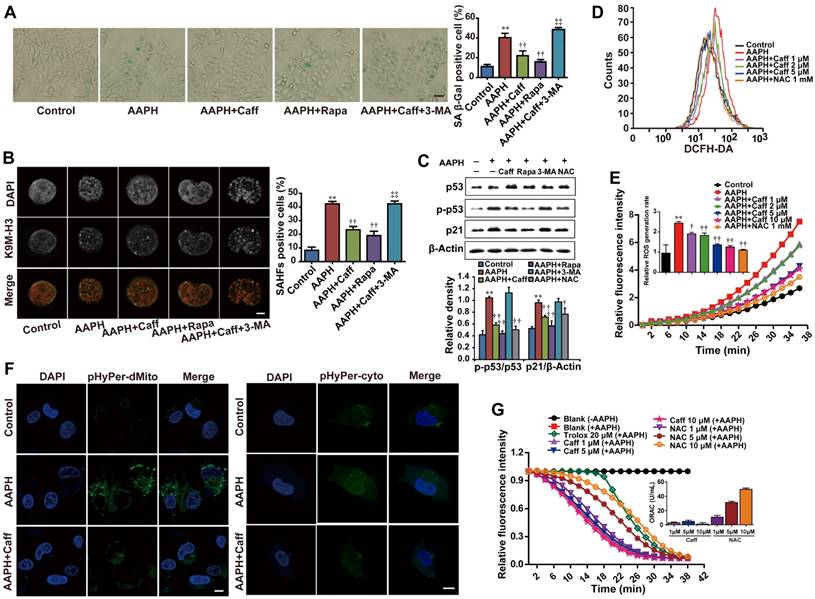
Caffeine attenuated AAPH-induced senescence and ROS generation. A375 cells were pretreated with caffeine, rapamycin or 3-MA for 1 h, followed by co-treatment with AAPH for another 48 h. (A) Representative images of SA β-Gal positive cells. Scale bar = 20 μm. The ratio of SA β-Gal positive cells is shown on the right. (B) Representative images of SAHF formation. Scale bar = 1.5 μm. The percentage of SAHF positive cell is shown on the right. (C) Protein expression of p53, p-p53 and p21 determined by western blotting. Quantitation is shown below. (D) ROS level measured by DCFH-DA staining and detected by flow cytometry. (E) The rate of ROS generation was evaluated by a fluorescence microplate reader, and expressed as the ratio of area under the fluorescence curve over time. (F) H2O2 levels in mitochondria and cytosol determined by plasmids pHyPer-cyto and pHyPer-dMito, respectively. Scale bar = 10 μm. (G) Direct ROS scavenging capacity of caffeine and NAC was evaluated by in vitro ORAC assay. AAPH, 1 mM; Caff (caffeine), 1 μΜ; Rapa (rapamycin) 500 nM; 3-MA, 2 mM; NAC, 1 mM; trolox, 20 μΜ. Data represent mean ± S.E.M. **P < 0.01 vs. Control group, †P < 0.05 and ††P < 0.01 vs. AAPH group, ‡‡P< 0.01 vs. “AAPH+Caff” group.
Figure 3
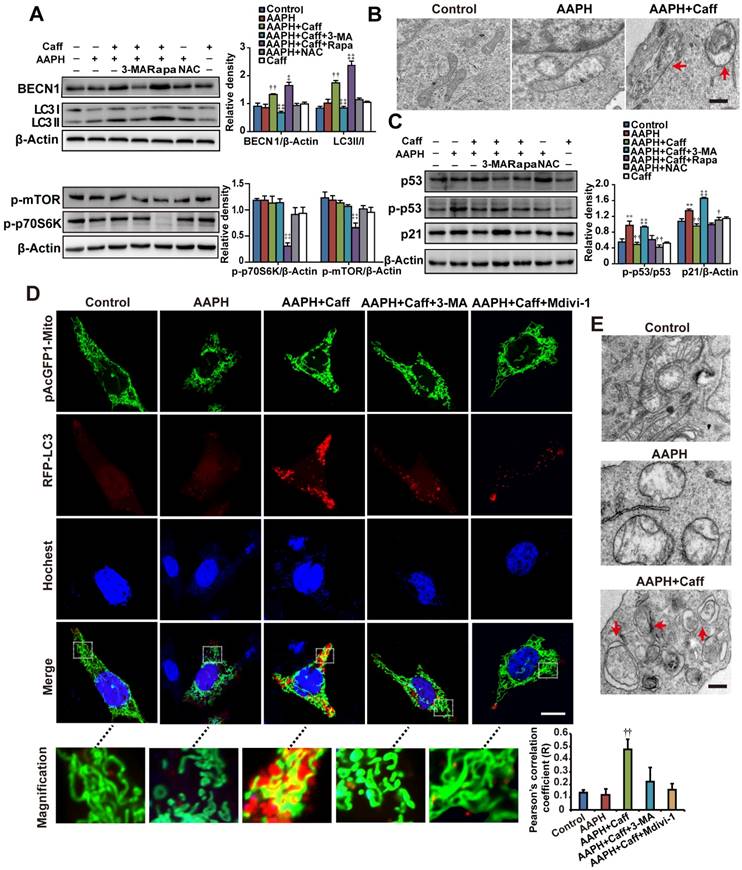
Caffeine activated autophagy in AAPH-treated cells. (A) Protein expression determined by specific antibodies in A375 cells. Quantitation is shown on the right. (B) Autophagosomes assessed by TEM in A375 cells. Red arrows indicate autophagosomes. Scale bar = 250 nm. (C) Protein expression of p53, p-p53 and p21 determined by western blotting in A375 cells. Quantitation is shown on the Right. (D) Autophagy and mitochondria morphology of NIH3T3 cells monitored under confocal microscopy after co-transfection of RFP-LC3 and pAcGFP1-Mito. Red punctuation: RFP-LC3, Green: pAcGFP1-Mito, Blue: Hochest33258, Yellow: co-localization of RFP-LC3 and pAcGFP1-Mito. Scale bar = 10 μm. Enlarged areas are shown below. The co-localization between the pAcGFP1-Mito green and the RFP-LC3 red signal was analyzed by the Image J software, and the Pearson's correlation efficient is shown (below). (E) Autophagosomes detected by TEM in NIH3T3 cells. Red arrows indicate autophagosomes. Scale bar = 250 nm. AAPH, 1 mM in A375 cells and 2 mM in NIH3T3 cells; Caff (caffeine), 1 μΜ in A375 cells and 10 μΜ in NIH3T3 cells; Rapa (rapamycin), 500 nM; 3-MA, 2 mM; NAC, 1 mM; Mdivi-1, 10 μΜ. Results represent mean ± S.E.M. from three independent experiments. **P < 0.01 vs. Control group, †P < 0.05 and ††P< 0.01 vs. AAPH group, ‡P < 0.05 and ‡‡P< 0.01 vs. “AAPH+Caff” group.
We observed that UV elevated the levels of MDA, protein carbonyl and 4-HNE, and caffeine significantly attenuated such increases in a dose-dependent manner (Figure S4C, S4D and S4G), confirming the generation of ROS by UV in vivo. The autophagy inhibitor 3-MA or the mitophagy inhibitor Mdivi-1 blocked the effect of caffeine (Figure S4C and S4G). Again, we did not detect phosphorylation of Chk1 or the histone H2A variant X (H2AX) after 24 h of UV irradiation (Figure S6B, p-Chk1 and γH2AX), both of which are widely used as markers of the DNA damage response [45]. These results suggest that skin cells might have efficiently repaired DNA damage after 24 h of UV exposure, as previously reported [53, 54]. In addition, treatment with caffeine did not inhibit or promote the effect of UV (Figure S6B), suggesting that caffeine at this particular experimental setting did not induce accumulation of DNA damage in mouse skin.
Further, we showed that caffeine increased the protein levels of SIRT3 and BECN1 and promoted LC3 I/II conversion, whereas 3-MA or Mdivi-1 blocked these effects of caffeine (Figure 6C). Lastly, TEM imaging of epidermis tissues revealed that UV caused severe damage of mitochondria, and treatment with caffeine induced formation of autophagosomes targeting damaged mitochondria in mouse skin (Figure 6D, indicated by red arrows). These data provide strong in vivo evidence for the protective effect of caffeine against UV-induced skin damage through activating autophagy (likely mitophagy).
Discussion
Cellular senescence has been implicated in the aging process of numerous mammalian tissues especially the skin [3]. Etiological studies reveal that oxidative stress is a key factor for skin aging [55], as it impairs the mitochondrial function, which in turn promotes excessive generation of ROS to accelerate the senescence process. In addition, oxidative stress is a potential inducer of the tumor-suppressor p53, which also mediates cellular senescence [56]. Chronic exposure of skin to UV radiation can give rise to free radicals, which could eventually cause cellular senescence and result in skin photo-aging or cancer [51]. In this regard, intervening strategies that can protect skin from oxidative stress- or UV-induced damage have great potential in treating skin diseases in the clinic. Consistent with this idea, clinical studies have reported beneficial effects of antioxidants on UV-induced skin damage [57].
Caffeine has long been reported to protect UV-induced damage. For instance, caffeine protected skin cells against UVB-induced carcinogenesis, and this effect required the inhibition of the ATR-dependent DNA damage response [13, 58]. Here we provide evidence that caffeine at ~10 μM protected skin cells from oxidative stress-induced senescence and damage, suggesting that this agent is able to elicit beneficial effects at concentrations that are much lower than previously used/thought. Even though there were studies showing the protective effects of caffeine against oxidative stress in skin cells [59-61], to the best of our knowledge, this is the first to reveal the detailed molecular mechanism. We show that this protective effect of caffeine does not involve the inhibition of ATR or mTOR; instead, it is through its primary cellular target, the adenosine receptor A2AR. Using RNAi and agonists/antagonists, we show that inhibition of A2AR by caffeine activates the SIRT3/ AMPK-regulated autophagy/mitophagy pathway to relieve oxidative stress. Most importantly, we observed similar protective effects of caffeine in skin cancer cell lines, NHEKs and mouse skin tissues, suggesting a strong pathophysiological relevance of our results. Further, our data suggest that the anti-senescence effect of caffeine is closely associated with the induction of autophagy, whereas that of NAC is mainly through the direct scavenging of oxidative free radicals. Together, our studies suggest caffeine (at relatively low dose) as an effective strategy to reduce skin damage under pathophysiological conditions.
Our results also raised several interesting questions that warrant further investigation. For instance, how does 3-MA or NAC regulate AAPH-induced BECN1 protein levels? While function of BECN1 is directly regulated by protein interaction, cellular localization and posttranslational modification, its protein levels are controlled by gene transcription [62] and protein degradation [63, 64]. Therefore, 3-MA or NAC could induce upregulation of BECN1 transcription, stabilize BECN1 protein or both. This represents an interesting research extension to the current study that will be addressed in the near future. In addition, SIRT3 has been reported to deacetylate FOXO3, which could detoxify ROS through transcriptional upregulation of antioxidant enzymes and therefore protects mitochondria from oxidative stress [65]. To determine if FOXO3 might participate in the protective effect of caffeine against oxidative stress, we measured FOXO3a acetylation levels in cells treated with AAPH in the presence or absence of caffeine. We found that AAPH actually reduced the level of acetylated FOXO3a compared with control cells, and caffeine further reduces the level of acetylated FOXO3a, although only slightly (data not shown). These results are contradictory to our expectation as AAPH reduced the level of SIRT3. We speculate that a number of reasons could have caused such a reduction in FOXO3a acetylation by AAPH. First, in addition to SIRT3, other deacetylation enzymes, such as SIRT1, SIRT2, and class IIa histone deacetylase, have been reported to deacetylate FOXO3a [66-68]. Second, even though AAPH reduced the protein level of SIRT3, there is still a large amount of SIRT3 proteins left, which might be sufficient to suppress FOXO3a acetylation. Third, AAPH might have as-yet unidentified targets that regulate FOXO3a protein acetylation.
Figure 4
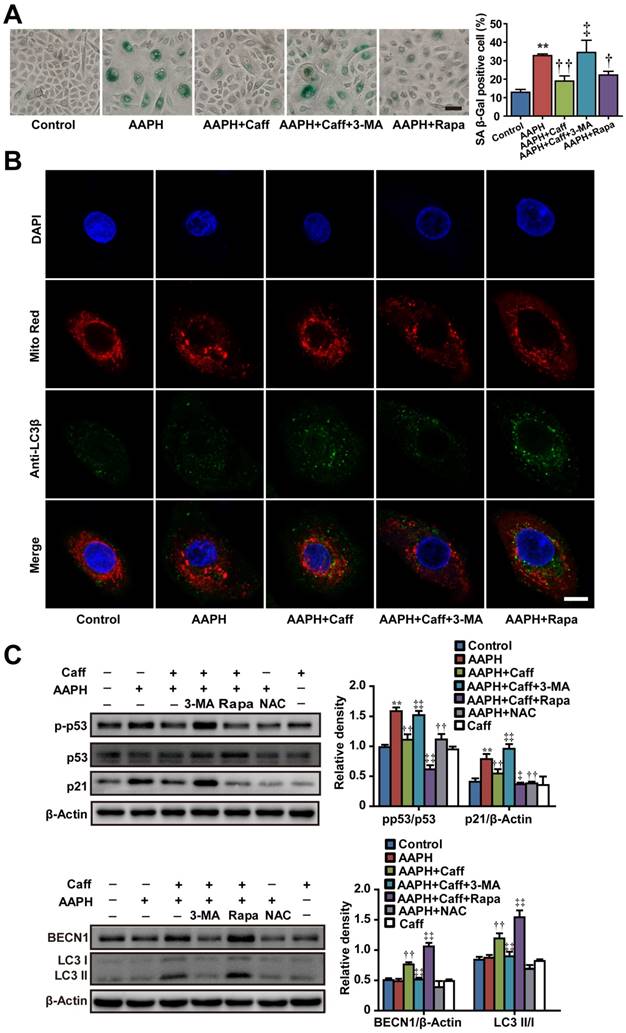
Caffeine attenuated AAPH-induced senescence in normal human epidermal keratinocytes (NHEKs) through the activation of autophagy. NHEKs were pretreated with caffeine, rapamycin, 3-MA or NAC for 1 h, and then co-incubated with AAPH for another 48 h. (A) Representative images of SA β-Gal positive cells (Left), and the quantitation is shown on the right. Scale bar = 20 μm. (B) Confocal fluorescence microscopy of NHEKs stained with LC3β (probed with primary anti-LC3β antibodies followed by anti-rabbit antibody conjugated with Alexa Flour 488) and Mito Red. Scale bar = 5 μm. (C) Protein expression of BECN1, LC3, p53, p-p53 and p21 determined by western blotting. Quantitative results represent mean ± S.E.M. is shown on the right. AAPH, 1 mM; Caff (caffeine), 10 μΜ; Rapa (rapamycin), 200 nM; 3-MA, 1 mM; NAC, 1 mM. **P < 0.01 vs. Control group, †P < 0.05 and ††P < 0.01 vs. AAPH group, ‡P < 0.05 and ‡‡P < 0.01 vs. “AAPH+Caff” group.
Figure 5
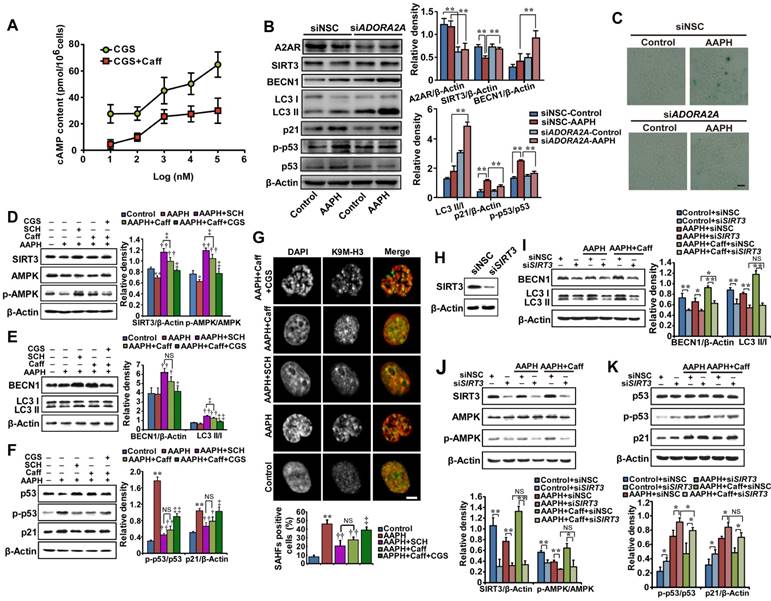
Caffeine induced autophagy via the A2AR/SIRT3/AMPK pathway. (A) Antagonism of caffeine on A2AR. A375 cells were treated with increasing concentrations of the A2AR agonist CGS21680 with or without 5 μM caffeine for 0.5 h, and cAMP production was measured. (B) Protein expressions of A2AR, SIRT3, AMPK, p-AMPK, LC3, p53, p-p53 and p21 determined by western blotting in cells transfected with control siRNA or siRNA targeting ADORA2A. Quantitation is shown on the right. **P < 0.01 vs. indicated group. (C) Representative images of SA β-Gal positive cells in cells transfected with control siRNA or siRNA targeting ADORA2A. Scale bar = 20 μm. (D-F) Protein expression of SIRT3, AMPK, p-AMPK, BECN1, LC3, p53, p-p53 and p21 determined by western blotting (left) and quantitation (right) is shown. *P < 0.05 and **P < 0.01 vs. Control group, †P < 0.05 and ††P < 0.01 vs. AAPH group, ‡P < 0.05 and ‡‡P < 0.01 vs. “AAPH+Caff” group. (G) Representative images of SAHF visualized under confocal microscopy. Percentage of SAHF-positive cells is shown below. Scale bar = 5 μm. **P < 0.01 vs. Control group, ††P < 0.01 vs. AAPH group, ‡P < 0.05 vs. “AAPH+Caff” group. (H) The effectiveness of SIRT3 siRNA evaluated by western blotting. (I-K) Protein expressions of SIRT3, AMPK, p-AMPK, BECN1, LC3, p53, p-p53 and p21 determined by western blotting in cells transfected with control siRNA or siRNA targeting SIRT3. Quantitative results represent mean ± S.E.M. from three independent experiments. AAPH, 1 mM; Caff (caffeine), 1 μΜ; SCH (SCH58261), 20 nM; CGS (CGS21680), 100 nM. *P < 0.05 and **P < 0.01 vs. indicated group.
The p53-p21 tumor-suppressing pathway plays a critical role in cell cycle arrest, cell death and cellular senescence [35]. It has been reported that p53 is able to activate AMPK through mechanisms such as increasing the AMPKα subunit phosphorylation and increasing expression of AMPK upstream mediators Sestrin1/2 [69]. On the contrary, p53 was also reported to be a downstream target of AMPK [70]. In the present study, we observed that AAPH or UV promoted p53 phosphorylation while reduced phosphorylation of AMPK, suggesting a negative correlation between p53 and AMPK in our study. Therefore, it would be interesting to determine how exactly these two proteins functionally interact, if any, in our experimental settings. Further, our data showed that autophagy was activated in both cancer cells (A375) and NHEKs by caffeine, consistent with the idea that autophagy promotes survival for both normal [71] and cancer cells [72]. Therefore, although caffeine can protect against ROS and prevent carcinogenesis in normal skin tissues, it might also benefit tumor cell growth and lead to therapy resistance. In this regard, further studies are needed to thoroughly investigate the dual roles of caffeine in normal versus transformed cells, and careful consideration should be given when using caffeine or related small molecules as an adjuvant supplement in either the clinic or during normal daily life.
Materials and methods
Reagents
Caffeine (#031-06792) and AAPH (#017-21332) were purchased from Wako (Osaka, Japan). SCH58261 (#ab120439), CGS21680 (#ab120453) and anti-K9M-H3 (#ab8898) antibody were obtained from Abcam (Cambridge, UK). Rapamycin (#V900930), 3-MA (#M9281), NAC (#A9165), Hoechst 33258 (#B1155), DAPI (#D9542) and MTT (#M5655) were purchased from Sigma (St. Louis, MO, USA). Antibodies against BECN1 (#3738), LC3 (#2775), p-p53 (#9284), β-Actin (#4970), p-mTOR (Ser2448, #5536), p-Chk1 (Ser345, #2348), p-p70S6K (Thr389, #9205), acelylated-lysine (#9441) and HRP-conjugated secondary anti-rabbit and anti-mouse antibodies (#7076 and #7074) were from Cell Signaling Technology (Beverly, MA, USA). Antibodies against p53 (#SC-6243) and p21 (#SC-397) were from Santa Cruz (California, USA). Alexa Fluor 488 goat anti-rabbit IgG (#A11008) were from Invitrogen (Carlsbad, CA, USA). Anti-FOXO3a (10849-1-AP) was purchased from Proteintech Group (Chicago, USA). Anti-4HNE (ab46545) was purchased from Abcam (Cambridge, UK). pAcGFP1-Mito (#632432) was from Clontech (Mountain View, CA, USA). Antibody against p-ATR (T1989) was provided by Dr. Tongzhen Liu (Jinan University). siRNA targeting SIRT3, ADORA2A and non-silencing controls (NSC) were purchased from Ribobio (Guanghzou, China). MDA assay kit and Masson staining kit were purchased from Nanjing Jiancheng Bioengineering Institute (Nanjing, China). Protein carbonyl content assay kit (MAK094) was purchased from Sigma (St. Louis, MO, USA).
Animal care
Eight-week old female C57BL/6 mice were purchased from Guangdong Medical Laboratory Animal Center (Guangzhou, China). All mice were housed in-group in cages with bedding, controlled temperature (23 ± 2 oC), humidity (50 ± 5%) and illumination (12 h light/dark cycles). Mice were adapted to the facility for one week before experiments. All animal experiments were performed in accordance with the National Institutes of Health's Guide for the Care and Use of Laboratory Animals (NIH publication No. 80-23, revised in 1996) and were approved by the Animal Ethics Committee of Jinan University (Approval Number: 20130904001).
UV irradiation
Seventy mice were divided into six groups: control, UV alone, UV + caffeine (10 mg/kg, p.o.), UV + caffeine (20 mg/kg, p.o.), UV + caffeine (20 mg/kg, p.o.) + 3-MA (15 mg/kg, i.p.), and UV + caffeine (20 mg/kg, p.o.) + Mdivi-1 (1.5 mg/kg, i.p.). Mouse dorsal skin was shaved and irradiated with a light tight box equipped with a 20 W UVA lamp and a 20 W UVB lamp for 6 weeks. Doses of UVA and UVB were equivalent to 50 mJ/cm2 for the first two weeks, increased to 100 mJ/cm2 in the 3rd week, and to 300 mJ/cm2 during the 4th-6th weeks. Total irradiated doses of UVA and UVB were approximately 7.7 J/cm2. During UV radiation, mice were orally given different doses of caffeine once daily. Mdivi-1 and 3-MA were intraperitoneally injected to mice 30 min before caffeine administration. Twenty-four hours after the last UV exposure, the dorsal skin tissues were collected for hematoxylin-eosin (H&E), Masson's Trichrome staining, western blotting and TEM.
Histological examination
Mice skin tissues were fixed in 10% formalin (pH 7.4) for 24 h, dehydrated, embedded in paraffin, and sectioned to 6 μm thick slices. The slices were stained with H&E to observe epidermal thickness change and images were semi-quantitatively measured by using Image Pro Plus 5.0 (Media Cybernetics, Rockville, MD, USA). Masson staining was used to detect the change of collagen fibers. The histological changes of skin were observed under optical microscope (Olympus Co., Tokyo, Japan).
Cell culture
Human A375 melanoma, mouse NIH3T3 fibroblast cells, HeLa cells and NHEKs from adult abdominal skin were obtained from American Type Culture Collection (ATCC, Manassas, VA, USA). A375 and NIH3T3 cells were cultured in DMEM (Gibco, Grand Island, NY, USA) supplemented with 10% heat inactivated (56 °C, 30 min) fetal bovine serum (ThermoFisher Scientific, Franklin, MA, USA) at 37 °C with 5% CO2. NHEKs were cultured in dermal cell basal medium supplemented with 0.4% bovine pituitary extract, rh-TGF-α (0.5 ng/mL), L-Glutamin (5 mM), rh-insulin (5 mg/mL), epinephrine (1 mM), and apo-transferrin (5 mg/mL) (ATCC, Manassas, VA, USA). Cells in the exponential phase of growth were used. The BECN1-KD HeLa cell line was constructed through RNAi and provided by Dr. Du Feng (Guangdong Medical University). It was cultured as previously reported [50].
MTT assay and inhibitory ratio calculation
MTT assay was applied to determine the effects of test reagents on cell growth. Briefly, cells were seeded in a 96-well plate with a density of 1 × 10⁵ cells per well. After 24 h, cells were treated with agents for indicated time. Then, 20 µL of MTT solution (0.5%) was added to each well and incubated for 4 h. After the supernatant was removed carefully, each well was added 150 µL of DMSO and shaken for 10 min to dissolve formazan crystals. Finally, the absorbance was read at 570 nm using a microplate reader (Thermo Fisher Scientific, Franklin, MA, USA). The cell growth inhibitory ratio (%) was calculated as following formula:
Inhibitory ratio (%) = (A570, control - A570, sample) / (A570, control-A570, blank) × 100
Oxygen Radical Absorbance Capacity (ORAC) assay
In the oxygen radical absorbance capacity (ORAC) assay, fluorescence sodium (Sigma, St. Louis, MO, USA) was used as a fluorescence probe, trolox as a standard free radical scavenger and AAPH as the peroxyl radical generator. Reaction mixture consists of 20 μL of 75 mM phosphate-buffered saline (PBS), 20 μL of caffeine (1, 5, 10 μM) or NAC (1, 5, 10 μM), 20 uL of fluorescein sodium (Sigma, St. Louis, MO, USA) and 140 μL of AAPH. The reaction was initiated with the addition of AAPH. Fluorescence was measured by a TECAN GENios fluorescence microplate reader (Männedorf, Switzerland) at 37 °C with excitation/emission at 485/535 nm and detected every 2 min for 2 h. The ORAC value was calculated as the net area under the fluorescence decay curve using 20 μM of Trolox as the calibration standard.
Figure 6
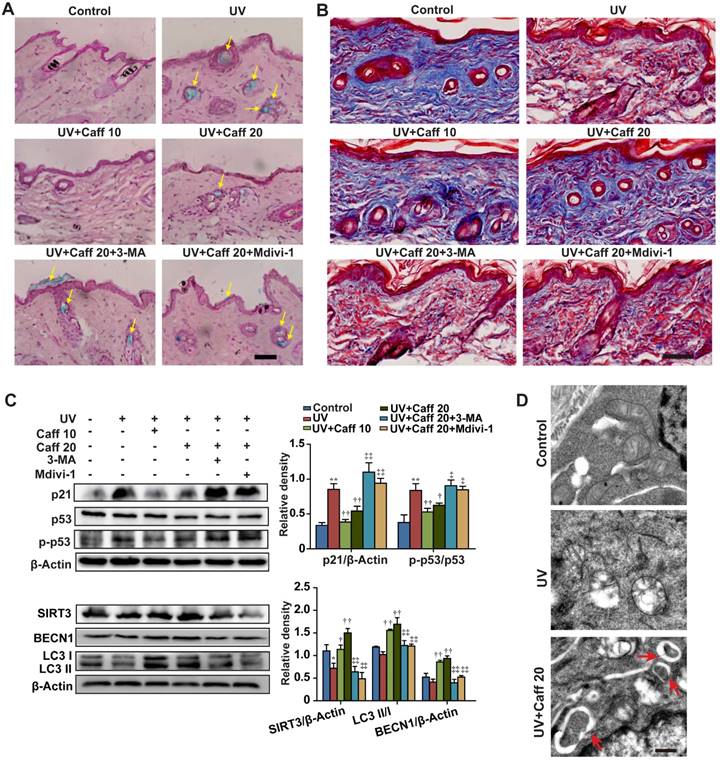
Caffeine protected mouse skin from UV damage. The dorsal skin of mice was irradiated with UV light for 6 weeks. During this period, caffeine (10 and 20 mg/kg) was orally administrated once daily. Mdivi-1 (1.5 mg/kg) or 3-MA (15 mg/kg) was intraperitoneally injected to mice 30 min before caffeine treatment. At the end of the experiment, the dorsal skin tissues were collected. (A) SA β-Gal activity assay performed in mice skin sections by SA β-Gal & H&E staining. Yellow arrows indicate SA β-Gal positive staining in mouse skin. Scale bar = 20 µm. (B) Collagen fibers were stained by Masson's Trichome staining. The blue color represents collagen fiber. Scale bar = 15 µm. (C) Expressions of autophagy and senescence related proteins by western blotting (left) and quantitation (right) is shown. (D) Autophagosomes detected by TEM. Red arrows indicate autophagosomes. Scale bar = 250 nm. Caff 10 (caffeine, 10 mg/kg); Caff 20 (caffeine, 20 mg/kg). *P < 0.05 and **P < 0.01 vs. Control group, †P < 0.05 and ††P < 0.01 vs. UV group, ‡P < 0.05 and ‡‡P < 0.01 vs. “UV+Caff 20” group.
Determination of ROS levels in A375 cells by flow cytometry
A375 cells were plated for 24 h and treated with agents for 48 h. The cells were harvested and incubated with 15 µM DCFH-DA at 37 °C for 30 min. Cells were then washed twice with PBS and immediately analyzed by using Beckman Coulter Epics XL flow cytometer equipped with Expo32 ADC.
Plasmid or siRNA transfection
RFP-LC3 was expressed in mammalian cells to measure autophagy, and pAcGFP1-Mito was used for fluorescent labeling of mitochondria. Transfection was performed using the Lipofectamine 2000 reagent (Life Technologies, Gaithersburg, MD, USA). Briefly, cells were plated for 24 h to reach around 70% confluence before transfection. Plasmid DNA (RFP-LC3 or pAcGFP1-Mito), siRNA or Lipofectamine 2000 was diluted in Opti-MEM media (Life Technologies, Gaithersburg, MD, USA), incubated for 5 min at room temperature, and mixed and incubated for 20 min to obtain the Opti-MEM-DNA/siRNA mixture. The mixture was then added to cells in Opti-MEM and cultured for 6 h. Media containing the transfection mixture was replaced with fresh full media with serum for another 18 h before agents treatment followed by various analyses. Cells were treated with chloroquine (CQ, 5 µM) to facilitate visualization of autophagosomes. Expression of RFP or GFP was confirmed by confocal microscopy. The siRNA transfection efficiency was optimized by titrating a range of concentrations of siRNA and Lipofectamne 2000. siRNA sequences used here are: siSIRT3#1 (F)-5'-GCCCAACGUCACUCACUACdTdT-3', (R)-5'-GUAGUGAGUGACGUUGGGCdTdT-3'; siSIRT3#2 (F)-5'-CUGCCAAAGACCCUUCCCAdTdT-3' (R)-5'-UGGGAAGGGUCUUUGGCAGdTdT); siADORA2A#1 (F)-5'- GCCUCUUCAUUGCCUGCUUdTdT, (R)-5'- AAGCAGGCAAUGAAGAGGCdTdT; siADORA2A#2 (F)-5'-GGCAGCAAGAACCUUUCAAdTdT-3', (R)-5'- UUGAAAGGUUCUUGCUGCCdTdT).
Determination of ROS generation rate in A375 cells
A375 cells were seeded at a density of 3×10³/well on a 96-well plate at 37 °C with 5% CO2 for 24 h. After 48 h of drugs treatment, cells were washed twice with PBS and then 10 µM DCFH-DA was added to the wells. The plate was immediately placed into a TECAN GENios fluorescence microplate reader (Männedorf, Switzerland) at 37 °C with an excitation/ emission wavelength pair at 485/535 nm. Fluorescence was detected every 2 min for 1 h. The relative ROS generation rate was expressed as the change of area under the fluorescence curve per minute.
Mitochondria and cytoplasm ROS levels in A375 cells were determined by pHyPer-dMito and pHyPer-cyto plasmids, respectively. pHyPer-cyto and pHyPer-dMito are mammalian expression vectors encoding cytoplasmic and mitochondria-targeted HyPer fluorescence proteins, respectively. When transfected, they can be used to determine the ROS levels in mitochondria and cytoplasm of cells, respectively. A375 cells were seeded at confocal dish and cultured for 24 h in DMEM with 10% FBS to reach around 70% confluency before transfection. Plasmids (pHyPer-cyto and pHyPer-dMito) were transfected as described above.
Determination of MDA level in A375 cells and skin tissues
The level of MDA was determined by the TBARS assay according to the protocol provided by the manufacturer (Nanjing Jian Cheng Bioengineering Institute, Nanjing, China). After treatment, cells were collected and lysed with sonication. For skin tissues, 10% homogenate was prepared by a homogenizer. Then the samples were centrifuged at 4000 rpm for 15 min at 4 oC, and the supernatants were used to detect the content of MDA.
Determination of protein carbonyl content in A375 cells and skin tissues
The content of protein carbonyl was measured according to the protocol provided by the manufacturer (Sigma, St. Louis, MO, USA). Skin tissues or cells were lysed and supernatants were collected for reaction. After the assay reaction, protein carbonyl content was determined by measuring absorbance at 375 nm. The results were expressed as nmol carbonyl per mg protein.
Determination of GSH level in A375 cells by HPLC-ECD
GSH analysis was measured by HPLC-ECD. Briefly, after treatment, cells were washed with cold PBS and collected by centrifugation at 2000 rpm for 15 min. Cell pellets were resuspended in 200 μl of PBS and lysed by sonication, followed by centrifugation at 15000 rpm for 15 min at 4 oC. The supernatant was collected and added with an equal volume of 6% perchloric acid and centrifuged at 15000 rpm for 1 min at 4 oC. The supernatant were filtered by a 0.22 μm filter and transferred into HPLC vials for analysis. For detection, 600 and -150 mV was applied. A C18 column (4.6×150 mm, 5 μm; Cosmosil, Japan) was used to separate the samples. Mobile phase contained 3.9 g of sodium dihydrogen phosphate and 0.31 g of ocane sulfonic acid sodium and adjusted to pH 3.0 with orthophosphoric acid. The column temperature was maintained at 40 oC, and the injection volume was 20 µL with a flow rate of 0.8 mL/min.
cAMP assay
In brief, A375 cells (3×10⁶) were incubated for 30 min at 37 °C with either the A2AR agonist CGS21680 alone or CGS21680 in different concentrations together with 5 μM of caffeine. Cells after treatment were harvested and centrifuged at 1000 rpm for 5 min, lysed and cAMP content was quantified using a cAMP assay kit (Abcam, Cambridge, UK) according to the manufacturer's instructions.
ATP measurement by HPLC
A375 cells (1×10⁶) were homogenized with 0.4 M perchloric acid. After centrifugation, the samples were adjusted to pH 6.5 and were mixed with potassium dihydrogen phosphate buffer and filtered through a 0.22 µm membrane. The C18 column (4.6 × 250 mm, Comosil, Japan) was equilibrated by 0.05 M potassium dihydrogen phosphate buffer at a flow rate of 1 mL/min. Levels of ATP were measured by a Hitachi HPLC system (Tokyo, Japan) with an UV detector at 254 nm.
SA β-galactosidase staining assay
To measure cellular senescence, cells were stained with the SA β-Gal staining kit (Beyotime Institute of Biotechnology, Nanjing, China) according to the manufacturer's instructions. Images containing >200 cells were taken using bright-field microscope, and total and blue-colored cells were counted. The percentage of SA β-Gal positive cells was represented by the ratio between the number of blue-colored cells and the number of total cells from at least three independent experiments.
To determine tissue senescence, skin sections were processed for SA β-Gal staining according to a previous report [73]. After resection and isolation from mice, skin tissues were immediately frozen in liquid nitrogen. Frozen skin tissues were immediately embedded into OCT compound, and sectioned into slices with 4 μm thickness. The slice was fixed with 1% formaldehyde in PBS for 1 min at room temperature. After fixation, slices were washed three times with PBS, and incubated with staining solution at 37 °C overnight. Subsequently, cells were washed twice with PBS, once with methanol, and stained with H&E.
Western blotting and immunoprecipitation
Skin tissues or cells (1×10⁷ cells) were lysed in lysis buffer (Beyotime Institute of Biotechnology) for 10 min on ice and lysates were collected by centrifugation (13000 g, 10 min at 4 °C). Protein concentration was determined by the Pierce® BCA protein assay kit (Thermo Fisher Scientific, Franklin, MA, USA). Approximately 10 μg of protein were separated on SDS-PAGE and transferred to PVDF membrane (Millipore, Billerica, MA, USA). Protein expressions were detected by incubating the membranes with primary antibodies followed by anti-rabbit or anti-mouse secondary antibodies conjugated with horseradish peroxidase and visualized using Pierce® ECL Western Blotting Substrate (Thermo Fisher Scientific, Franklin, MA, USA). For detecting FOXO3a acetylation by immunoprecipitation, cell lysates were cleared by centrifugation (13000 rpm, 10 min) and the supernatant was incubated anti-acetylated-lysine antibody at 4°C overnight, followed by incubating with Protein G beads (Cell Signaling Technology, Beverly, MA, USA) at 4°C for 4 h. The immuno complex beads were washed three times with lysis buffer and eluted with SDS loading buffer.
Confocal fluorescence microscopy
For confocal fluorescence analysis, cells after treatment were fixed in 3.7% formaldehyde for 15 minutes at room temperature, blocked in 3% BSA in 0.1% Triton X-100 in PBS. To detect SAHF formation in cultured cells, fixed cells were incubated with rabbit anti-K9M-H3 antibody at 4 °C overnight, followed by anti-rabbit secondary antibody conjugated with Alexa Flour 488 at room temperature for 4 h. Cells with condensed imaging of K9M-H3 that co-localized with DAPI in the nuclei were considered as SAHF positive, and were expressed as percentage of SAHF positive cells versus total cell numbers. For detecting mitochondrial morphology and LC3β expression in NHEKs, cells were first stained with Mito Red at 37 °C for 30 min, and then incubated with rabbit anti-LC3β antibody at 4 °C overnight, followed by secondary anti-rabbit antibody conjugated with Alexa Flour 488 at 37 °C for 1 h. After secondary antibody incubation, A375 or NHEKs cells were stained with DAPI for 10 min at room temperature and washed three times in PBS. Images were acquired by a Zeiss LSM510 Meta Duo Scan laser scanning confocal microscope (Carl Zeiss AG, Oberkochen, Germany).
Annexin V-FITC/PI staining for cell apoptosis analysis
The Annexin V-FITC/PI apoptosis detection kit (Kaiji, Nanjin, China) was employed to analyze cell apoptosis by flow cytometry. Briefly, cells after treatment were harvested and resuspended in binding buffer (1×10⁶ cells/mL). Aliquots of 5×10⁵ cells were mixed with 5 μL of Annexin V-FITC and 5 μL of PI, and incubated for 15 min at room temperature in dark. The samples were analyzed by flow cytometer (BD FACSCanto; BD Biosciences, Franklin Lakes, NJ, USA).
PI staining for cell cycle analysis
Cells were treated with increasing concentration of AAPH for 48 h (A375) or 24 h (NIH3T3), collected and fixed in 70% ethanol. Cells were stained in 0.05 mg/mL PI (beyotime, Shanghai, China) with RNase for 30 min at 4 °C. Single cell suspensions were analyzed by flow cytometer (BD FACSCanto; BD Biosciences, Franklin Lakes, NJ, USA).
Transmission electron microscopy (TEM)
Mouse dorsal skin tissue was cut into small fragments (1 mm3) before fixation. A375, NIH3T3 cells or skin tissues were fixed with 3% glutaraldehyde solution overnight at 4 °C. Cells were treated with CQ (5 µM) to facilitate visualization of autophagosomes. After fixation, skin tissues or cells were treated with 1% osmic acid for 2 h, washed with PBS, and dehydrated with increasing concentrations of ethanol. Following embedding in an Epon mixture and staining with uranyl acetate and lead citrate, cells were cut into ultrathin sections and photographed by using a Philips Tecnai 10 transmission electron microscope (FEI, Hillsboro, OR, USA).
Statistical analysis
All data represent results obtained from at least three independent experiments and were expressed as mean ± S.E.M. The data were analyzed by ANOVA using the Statistics Package for Social Science software (version 19.0; SPSS, Chicago, IL, USA) and LSD-post-hoc test was employed to assess the statistical significance. P-values of less than 0.05 were considered statistically significant.
Abbreviations
AAPH: 2,2'-azobis (2-amidinopropane) dihydrochloride; A2AR: adenosine A2a receptor; AMPK: 5' adenosine monophosphate-activated protein kinase; ATR: ataxia telangiectasia and Rad3-related; CPT: camptothecin; CQ chloroquine; GSH: glutathione; 4-HNE: 4-hydroxynonenal; HPLC-ECD: high performance liquid chromatography electrochemical detector; 3-MA: 3-methyladenine; mTOR: mammalian target of rapamycin; MDA: malondialdehyde; NAC: n-acetyl-L-cysteine; NHEK: normal human epidermal keratinocyte; ORAC: oxygen radical absorbance capacity; PI: propidium iodide; RNAi: RNA interference; ROS: reactive oxygen species; SA β-Gal: senescence-associated β-galactosidase; SAHF: formation of senescence-associated heterochromatin foci; SIRT3: sirtuin 3; TEM: transmission electron microscope; TBARS: thiobarbituric acid reactive substance; UV: ultraviolet.
Supplementary Material
Supplementary figures and tables.
Acknowledgements
We thank Drs. Michael Kemp and Shobhan Gaddameedhi for discussion of our data, Dr. F. J. Gonzalez for revising our manuscript, Dr. T. Yoshimori and Dr T. Liu for providing the RFP-LC3 plasmid and p-ATR (Thr1989) primary antibody, respectively, and Dr. D. Feng for sharing the HeLa BECN1-KD cell lines. This work was supported by Natural Science Foundation of China (no.81573675 & no.81473115 & no.81622050 & no.81673709 & no.81560661 & no.81873209), National Key Research and Development Program of China (2017YFC1700404), Science and Technology Program of Guangzhou (201610010182), Guangdong Science and Technology Foundation for Distinguished Young Scholars (2017A030306004), Youth Top-notch Talent Support Program of Guangdong Province (2014TQ01R229 & 2016TQ03R586), Guangdong Province Ocean and Fisheries Bureau- Key Technology Research and Development Program (A201701A02) and Program of Hong Kong Scholar (XJ2016017). Y.Z. is supported by NCI/NIH (R01 163214) and American Cancer Society (ACS RSG-15-042 DMC).
Author contributions
Y.F.L. S.H.O., H.K., Y.Z., and R.R.H. designed the experiments and wrote the paper. Y.F.L., S.H.O, L.F.T., X.W., W.L.Y., G.E.W., Y.P.W., W.J.D., H.M.Y., Z.Z.F. performed the experiments and analyzed the data.
Competing Interests
The authors have declared that no competing interest exists.
References
1. Campisi J, di Fagagna FD. Cellular senescence: when bad things happen to good cells. Nat Rev Mol Cell Biol. 2007;8:729-40
2. Velarde MC, Flynn JM, Day NU, Melov S, Campisi J. Mitochondrial oxidative stress caused by Sod2 deficiency promotes cellular senescence and aging phenotypes in the skin. Aging-Us. 2012;4:3-12
3. Waaijer MEC, Parish WE, Strongitharm BH, van Heemst D, Slagboom PE, de Craen AJM. et al. The number of p16INK4a positive cells in human skin reflects biological age. Aging Cell. 2012;11:722-5
4. Quan TH, Qin ZP, Voorhees JJ, Fisher GJ. Cysteine-rich protein 61 (CCN1) mediates replicative senescence-associated aberrant collagen homeostasis in human skin fibroblasts. J Cell Biochem. 2012;113:3011-8
5. Gannon HS, Donehower LA, Lyle S, Jones SN. Mdm2-p53 signaling regulates epidermal stem cell senescence and premature aging phenotypes in mouse skin. Dev Biol. 2011;353:1-9
6. Baumann L. Skin ageing and its treatment. J Pathol. 2007;211:241-51
7. Sies H, Berndt C, Jones DP. Oxidative stress. Annu Rev Biochem. 2017
8. Wlaschek M, Tantcheva-Poor I, Naderi L, Ma W, Schneider LA, Razi-Wolf Z. et al. Solar UV irradiation and dermal photoaging. J Photochem Photobiol B. 2001;63:41-51
9. Cappelletti S, Daria P, Sani G, Aromatario M. Caffeine: cognitive and physical performance enhancer or psychoactive drug? Curr Neuropharmacol. 2015;13:71-88
10. McLellan TM, Caldwell JA, Lieberman HR. A review of caffeine's effects on cognitive, physical and occupational performance. Neurosci Biobehav Rev. 2016;71:294-312
11. Fredholm BB. Adenosine, adenosine receptors and the actions of caffeine. Basic Clin Pharmacol Toxicol. 1995;76:93-101
12. Sarkaria JN, Busby EC, Tibbetts RS, Roos P, Taya Y, Karnitz LM. et al. Inhibition of ATM and ATR kinase activities by the radiosensitizing agent, caffeine. Cancer Res. 1999;59:4375-82
13. Zhan H, Suzuki T, Aizawa K, Miyagawa K, Nagai R. Ataxia telangiectasia mutated (ATM)-mediated DNA damage response in oxidative stress-induced vascular endothelial cell senescence. J Biol Chem. 2010;285:29662-70
14. Rallis C, Codlin S, Baehler J. TORC1 signaling inhibition by rapamycin and caffeine affect lifespan, global gene expression, and cell proliferation of fission yeast. Aging Cell. 2013;12:563-73
15. Koo S, Hirakawa S, Fujii S, Kawasumi M, Nghiem P. Protection from photodamage by topical application of caffeine after ultraviolet irradiation. Br J Dermatol. 2007;156:957-64
16. Mizushima N, Levine B, Cuervo AM, Klionsky DJ. Autophagy fights disease through cellular self-digestion. Nature. 2008;451:1069-75
17. Cuervo AM, Bergamini E, Brunk UT, Dröge W, Ffrench M, Terman A. Autophagy and aging: the importance of maintaining" clean" cells. Autophagy. 2005;1:131-40
18. Kang HT, Lee KB, Kim SY, Choi HR, Park SC. Autophagy Impairment Induces Premature Senescence in Primary Human Fibroblasts. Plos One. 2011;6:12
19. Rubinsztein DC, Marino G, Kroemer G. Autophagy and Aging. Cell. 2011;146:682-95
20. Duan W-J, Li Y-F, Liu F-L, Deng J, Wu Y-P, Yuan W-L. et al. A SIRT3/AMPK/autophagy network orchestrates the protective effects of trans-resveratrol in stressed peritoneal macrophages and RAW 264.7 macrophages. Free Radic Biol Med. 2016;95:230-42
21. Kuningas M, Mooijaart SP, Van Heemst D, Zwaan BJ, Slagboom PE, Westendorp RG. Genes encoding longevity: from model organisms to humans. Aging cell. 2008;7:270-80
22. Someya S, Yu W, Hallows WC, Xu J, Vann JM, Leeuwenburgh C. et al. Sirt3 Mediates Reduction of Oxidative Damage and Prevention of Age-Related Hearing Loss under Caloric Restriction. Cell. 2010;143:802-12
23. Hafner AV, Dai J, Gomes AP, Xiao CY, Palmeira CMK, Rosenzweig A. et al. Regulation of the mPTP by SIRT3-mediated deacetylation of CypD at lysine 166 suppresses age-related cardiac hypertrophy. Aging-Us. 2010;2:914-23
24. Brown K, Xie S, Qiu X, Mohrin M, Shin J, Liu Y. et al. SIRT3 Reverses Aging-Associated Degeneration. Cell Rep. 2013;3:319-27
25. Zhang B, Cui SY, Bai XY, Zhuo L, Sun XF, Hong Q. et al. SIRT3 overexpression antagonizes high glucose accelerated cellular senescence in human diploid fibroblasts via the SIRT3-FOXO1 signaling pathway. Age. 2013;35:2237-53
26. Meijer AJ, Codogno P. AMP-activated protein kinase and autophagy. Autophagy. 2007;3:238-40
27. Roach PJ. AMPK→ uLK1→ autophagy. Mol Cell Biol. 2011;31:3082-4
28. Zhang D, Wang W, Sun X, Xu D, Wang C, Zhang Q. et al. AMPK regulates autophagy by phosphorylating BECN1 at threonine 388. Autophagy. 2016;12:1447-59
29. Kim J, Kundu M, Viollet B, Guan KL. AMPK and mTOR regulate autophagy through direct phosphorylation of Ulk1. Nat Cell Biol. 2011;13:132-U71
30. Nakajima A, Matsuda E, Masuda Y, Sameshima H, Ikenoue T. Characteristics of the spin-trapping reaction of a free radical derived from AAPH: further development of the ORAC-ESR assay. Anal Bioanal Chem. 2012;403:1961-70
31. He R-R, Li Y, Li X-D, Yi R-N, Wang X-Y, Tsoi B. et al. A new oxidative stress model, 2, 2-azobis (2-amidinopropane) dihydrochloride induces cardiovascular damages in chicken embryo. PloS one. 2013;8:e57732
32. Werber J, Wang YJ, Milligan M, Li X, Ji JA. Analysis of 2, 2′-azobis (2-amidinopropane) dihydrochloride degradation and hydrolysis in aqueous solutions. J Pharm Sci. 2011;100:3307-15
33. Sato Y, Kamo S, Takahashi T, Suzuki Y. Mechanism of free radical-induced hemolysis of human erythrocytes: hemolysis by water-soluble radical initiator. Biochemistry. 1995;34:8940-9
34. de Jesus BB, Blasco MA. Assessing Cell and Organ Senescence Biomarkers. Circ Res. 2012;111:97-109
35. Rufini A, Tucci P, Celardo I, Melino G. Senescence and aging: the critical roles of p53. Oncogene. 2013;32:5129-43
36. Azam S, Hadi N, Khan NU, Hadi SM. Antioxidant and prooxidant properties of caffeine, theobromine and xanthine. Med Sci Monit. 2003;9:BR325-BR30
37. Hajas G, Bacsi A, Aguilera-Aguirre L, Hegde ML, Tapas KH, Sur S. et al. 8-Oxoguanine DNA glycosylase-1 links DNA repair to cellular signaling via the activation of the small GTPase Rac1. Free Radic Biol Med. 2013;61:384-94
38. Mailloux RJ, McBride SL, Harper M-E. Unearthing the secrets of mitochondrial ROS and glutathione in bioenergetics. Trends Biochem Sci. 2013;38:592-602
39. Halliwell B, Chirico S. Lipid peroxidation: its mechanism, measurement, and significance. Am J Clin Nutr. 1993;57:715S-24S
40. Weber D, Davies MJ, Grune T. Determination of protein carbonyls in plasma, cell extracts, tissue homogenates, isolated proteins: Focus on sample preparation and derivatization conditions. Redox Biol. 2015;5:367-80
41. Cao G, Alessio HM, Cutler RG. Oxygen-radical absorbance capacity assay for antioxidants. Free Radic Biol Med. 1993;14:303-11
42. Klionsky DJ, Abdelmohsen K, Abe A, Abedin MJ, Abeliovich H, Acevedo Arozena A. et al. Guidelines for the use and interpretation of assays for monitoring autophagy. Autophagy. 2016;12:1-222
43. Youle RJ, Narendra DP. Mechanisms of mitophagy. Nature reviews Molecular cell biology. 2011;12:9-14
44. Zhang X, Yan H, Yuan Y, Gao J, Shen Z, Cheng Y. et al. Cerebral ischemia-reperfusion-induced autophagy protects against neuronal injury by mitochondrial clearance. Autophagy. 2013;9:1321-33
45. Zhang Y, Hunter T. Roles of Chk1 in cell biology and cancer therapy. Int J Cancer. 2014;134:1013-23
46. Nam EA, Zhao R, Glick GG, Bansbach CE, Friedman DB, Cortez D. Thr-1989 phosphorylation is a marker of active ataxia telangiectasia-mutated and Rad3-related (ATR) kinase. J Biol Chem. 2011;286:28707-14
47. Ohta A, Ohta A, Madasu M, Kini R, Subramanian M, Goel N. et al. A2A adenosine receptor may allow expansion of T cells lacking effector functions in extracellular adenosine-rich microenvironments. J Immunol. 2009;183:5487-93
48. Kincaid B, Bossy-Wetzel E. Forever young: SIRT3 a shield against mitochondrial meltdown, aging, and neurodegeneration. Front Aging Neurosci. 2013;5:13
49. Popoli P, Reggio R, Pezzola A. Effects of SCH 58261, an adenosine A(2A) receptor antagonist, on quinpirole-induced turning in 6-hydroxydopamine-lesioned rats: Lack of tolerance after chronic caffeine intake. Neuropsychopharmacol. 2000;22:522-9
50. Liu L, Feng D, Chen G, Chen M, Zheng Q, Song P. et al. Mitochondrial outer-membrane protein FUNDC1 mediates hypoxia-induced mitophagy in mammalian cells. Nat Cell Biol. 2012;14:177-85
51. D'Orazio J, Jarrett S, Amaro-Ortiz A, Scott T. UV radiation and the skin. Int J Mol Sci. 2013;14:12222-48
52. Tavana O, Benjamin CL, Puebla-Osorio N, Sang M, Ullrich SE, Ananthaswamy HN. et al. Absence of p53-dependent apoptosis leads to UV radiation hypersensitivity, enhanced immunosuppression and cellular senescence. Cell Cycle. 2010;9:3328-36
53. Gaddameedhi S, Selby CP, Kaufmann WK, Smart RC, Sancar A. Control of skin cancer by the circadian rhythm. Proc Natl Acad Sci U S A. 2011;108:18790-5
54. Giangreco A, Qin M, Pintar JE, Watt FM. Epidermal stem cells are retained in vivo throughout skin aging. Aging Cell. 2008;7:250-9
55. Harman D. Free radical theory of aging. Mutat Res. 1992;275:257-66
56. Gambino V, De Michele G, Venezia O, Migliaccio P, Dall'Olio V, Bernard L. et al. Oxidative stress activates a specific p53 transcriptional response that regulates cellular senescence and aging. Aging Cell. 2013;12:435-45
57. Kang S, Chung JH, Lee JH, Fisher GJ, Wan YS, Duell EA. et al. Topical N-acetyl cysteine and genistein prevent ultraviolet-light-induced signaling that leads to photoaging in human skin in vivo. J Invest Dermatol. 2003;120:835-41
58. Kawasumi M, Lemos B, Bradner JE, Thibodeau R, Kim Y-s, Schmidt M. et al. Protection from UV-induced skin carcinogenesis by genetic inhibition of the ataxia telangiectasia and Rad3-related (ATR) kinase. Proc Natl Acad Sci U S A. 2011;108:13716-21
59. Silverberg JI, Patel M, Brody N, Jagdeo J. Caffeine protects human skin fibroblasts from acute reactive oxygen species-induced necrosis. J Drugs Dermatol. 2012;11:1342-6
60. Bravo J, Arbillaga L, de Pena MP, Cid C. Antioxidant and genoprotective effects of spent coffee extracts in human cells. Food Chem Toxicol. 2013;60:397-403
61. Tiwari KK, Chu C, Couroucli X, Moorthy B, Lingappan K. Differential concentration-specific effects of caffeine on cell viability, oxidative stress, and cell cycle in pulmonary oxygen toxicity in vitro. Biochem Biophys Res Commun. 2014;450:1345-50
62. Li D, Wang L, Deng R, Tang J, Shen Y, Guo J. et al. The pivotal role of c-Jun NH2-terminal kinase-mediated Beclin 1 expression during anticancer agents-induced autophagy in cancer cells. Oncogene. 2009;28:886-98
63. Elgendy M, Ciro M, Abdel-Aziz AK, Belmonte G, Dal Zuffo R, Mercurio C. et al. Beclin 1 restrains tumorigenesis through Mcl-1 destabilization in an autophagy-independent reciprocal manner. Nat Commun. 2014;5:5637
64. Xu C, Liu J, Hsu L-C, Luo Y, Xiang R, Chuang T-H. Functional interaction of heat shock protein 90 and Beclin 1 modulates Toll-like receptor-mediated autophagy. FASEB J. 2011;25:2700-10
65. Tseng AHH, Shieh S-S, Wang DL. SIRT3 deacetylates FOXO3 to protect mitochondria against oxidative damage. Free Radic Biol Med. 2013;63:222-34
66. Yao H, Chung S, Hwang JW, Rajendrasozhan S, Sundar IK, Dean DA. et al. SIRT1 protects against emphysema via FOXO3-mediated reduction of premature senescence in mice. J Clin Invest. 2012;122:2032-45
67. Wang F, Chan CH, Chen K, Guan X, Lin HK, Tong Q. Deacetylation of FOXO3 by SIRT1 or SIRT2 leads to Skp2-mediated FOXO3 ubiquitination and degradation. Oncogene. 2012;31:1546-57
68. Masui K, Tanaka K, Akhavan D, Babic I, Gini B, Matsutani T. et al. mTOR complex 2 controls glycolytic metabolism in glioblastoma through FoxO acetylation and upregulation of c-Myc. Cell Metab. 2013;18:726-39
69. Feng Z, Hu W, De Stanchina E, Teresky AK, Jin S, Lowe S. et al. The regulation of AMPK β1, TSC2, and PTEN expression by p53: stress, cell and tissue specificity, and the role of these gene products in modulating the IGF-1-AKT-mTOR pathways. Cancer Res. 2007;67:3043-53
70. Jones RG, Plas DR, Kubek S, Buzzai M, Mu J, Xu Y. et al. AMP-activated protein kinase induces a p53-dependent metabolic checkpoint. Mol Cell. 2005;18:283-93
71. Zhao Y, Zhang C-F, Rossiter H, Eckhart L, König U, Karner S. et al. Autophagy is induced by UVA and promotes removal of oxidized phospholipids and protein aggregates in epidermal keratinocytes. J Invest Dermatol. 2013;133:1629-37
72. Guo JY, Xia B, White E. Autophagy-mediated tumor promotion. Cell. 2013;155:1216-9
73. Debacq-Chainiaux F, Erusalimsky JD, Campisi J, Toussaint O. Protocols to detect senescence-associated beta-galactosidase (SA-betagal) activity, a biomarker of senescent cells in culture and in vivo. Nat Protoc. 2009;4:1798-806
Author contact
![]() Corresponding authors: Youwei Zhang (yxz169edu) and Rong-Rong He (rongrongheedu.cn)
Corresponding authors: Youwei Zhang (yxz169edu) and Rong-Rong He (rongrongheedu.cn)
Citation styles
APA
Li, Y.F., Ouyang, S.H., Tu, L.F., Wang, X., Yuan, W.L., Wang, G.E., Wu, Y.P., Duan, W.J., Yu, H.M., Fang, Z.Z., Kurihara, H., Zhang, Y., He, R.R. (2018). Caffeine Protects Skin from Oxidative Stress-Induced Senescence through the Activation of Autophagy. Theranostics, 8(20), 5713-5730. https://doi.org/10.7150/thno.28778.
ACS
Li, Y.F.; Ouyang, S.H.; Tu, L.F.; Wang, X.; Yuan, W.L.; Wang, G.E.; Wu, Y.P.; Duan, W.J.; Yu, H.M.; Fang, Z.Z.; Kurihara, H.; Zhang, Y.; He, R.R. Caffeine Protects Skin from Oxidative Stress-Induced Senescence through the Activation of Autophagy. Theranostics 2018, 8 (20), 5713-5730. DOI: 10.7150/thno.28778.
NLM
Li YF, Ouyang SH, Tu LF, Wang X, Yuan WL, Wang GE, Wu YP, Duan WJ, Yu HM, Fang ZZ, Kurihara H, Zhang Y, He RR. Caffeine Protects Skin from Oxidative Stress-Induced Senescence through the Activation of Autophagy. Theranostics 2018; 8(20):5713-5730. doi:10.7150/thno.28778. https://www.thno.org/v08p5713.htm
CSE
Li YF, Ouyang SH, Tu LF, Wang X, Yuan WL, Wang GE, Wu YP, Duan WJ, Yu HM, Fang ZZ, Kurihara H, Zhang Y, He RR. 2018. Caffeine Protects Skin from Oxidative Stress-Induced Senescence through the Activation of Autophagy. Theranostics. 8(20):5713-5730.
This is an open access article distributed under the terms of the Creative Commons Attribution (CC BY-NC) license (https://creativecommons.org/licenses/by-nc/4.0/). See http://ivyspring.com/terms for full terms and conditions.