Impact Factor
- Issue 11; 2026
- Issue 10; 2026
- Issue 9; 2026
- Issue 8; 2026
- Issue 7; 2026
- Volume 16; 2026
- Advance Articles
- Past Issues
- Cover Images
- Cover Suggestion
- Index & Coverage
- Special Issues
Introduction
Results
Discussion
Methods
Abbreviations
Supplementary Material
Acknowledgements
References
International Journal of Biological Sciences
International Journal of Medical Sciences
 Global reach, higher impact

Theranostics 2018; 8(21):5842-5854. doi:10.7150/thno.26888 This issue Cite
Research Paper
Arg1 expression defines immunosuppressive subsets of tumor-associated macrophages
Sean P. Arlauckas1*, Seth B. Garren1*, Chris S. Garris1, Rainer H. Kohler1, Juhyun Oh1, Mikael J. Pittet1, Ralph Weissleder1,2 ![]()
1. Center for Systems Biology, Massachusetts General Hospital, 185 Cambridge St, CPZN 5206, Boston, MA 02114,
2. Department of Systems Biology, Harvard Medical School, 200 Longwood Ave, Boston, MA 02115
* equal contribution
Received 2018-4-25; Accepted 2018-8-15; Published 2018-11-12
Abstract

Tumor-associated macrophages (TAM) have attracted attention as they can modulate key cancer-related activities, yet TAM represent a heterogenous group of cells that remain incompletely characterized. In growing tumors, TAM are often referred to as M2-like macrophages, which are cells that display immunosuppressive and tumorigenic functions and express the enzyme arginase 1 (Arg1).
Methods: Here we combined high resolution intravital imaging with single cell RNA seq to uncover the topography and molecular profiles of immunosuppressive macrophages in mice. We further assessed how immunotherapeutic interventions impact these cells directly in vivo.
Results: We show that: i) Arg1+ macrophages are more abundant in tumors compared to other organs; ii) there exist two morphologically distinct subsets of Arg1 TAM defined by previously unknown markers (Gbp2b, Bst1, Sgk1, Pmepa1, Ms4a7); iii) anti-Programmed Cell Death-1 (aPD-1) therapy decreases the number of Arg1+ TAM while increasing Arg1- TAM; iv) accordingly, pharmacological inhibition of arginase 1 does not synergize with aPD-1 therapy.
Conclusion: Overall, this research shows how powerful complementary single cell analytical approaches can be used to improve our understanding of drug action in vivo.
Keywords: immunotherapy, cancer, PD1, macrophage, arginase
Introduction
Tumor associated macrophages (TAM) are derived from myeloid precursors and have been shown to adopt heterogeneous phenotypes in the tumor microenvironment. These cells are attracting increasing attention as they play key roles in tumor spread and in response to different therapies [1]. TAM can substantially accelerate the progression of untreated tumors [2-4] but also influence the efficacy of anticancer drugs [5-7], including checkpoint blockade immunotherapies [8-10]. Specifically, TAM can assume opposing phenotypes and functions that are either tumoricidal (e.g., M1-like cells) or tumor-supportive (e.g., M2-like cells) [11-13].
Most of our knowledge of TAM comes from histological examinations and in vitro profiling using flow cytometry [14-16]. Despite elegant prior studies, there remains a significant knowledge gap on how TAM function in vivo and how these cellular activities can be harnessed to improve anticancer therapy. For example, we lack an understanding of i) the spatiotemporal distribution of functionally distinct TAM subtypes, ii) the optimal approach for therapeutically inhibiting TAM immunosuppressive activity, and iii) the effect of new immunotherapeutic agents, such as anti-Programmed Cell Death-1 (aPD-1) immune checkpoint inhibitors, on TAM polarization states. To advance our knowledge of immunosuppressive TAM, we combined single cell (sc) resolution intravital imaging of tumor environments [17,18], scRNA seq, and computational analyses. We hypothesized that functionally distinct TAM are topographically defined and that effective immune checkpoint blockade treatments alter TAM biology.
The immunosuppressive TAM phenotype (“M2”) is generally believed to be positive for arginase 1 (Arg1) [6]. Arg1 expression can be induced by interleukin-4 and lactic acid, both of which can be produced by tumor cells [19]. Arg1 metabolizes L-arginine into urea and L-ornithine with downstream generation of proline and polyamines, critical for cell proliferation and collagen synthesis [11]. Accordingly, Arg1+ macrophages promote wound healing and tissue fibrosis and dampen T cell activation by locally depleting L-arginine [11]. Although TAM-targeting agents are being investigated extensively for cancer therapy [1,20], there are still no clinically-approved Arg1 inhibitors [21]. Recent efforts have been made to characterize the impact of TAM on treatment efficacy using intravital microscopy [10,22,23]; however, these studies did not explore the molecular phenotypes of TAM and how this heterogeneity is affected by cancer drugs. Here we chose to dissect the function of immunosuppressive Arg1+ TAM in an immunotherapy-responsive MC38 mouse tumor model during aPD-1 treatment.
Results
Distribution of Arg1+ cells throughout the body
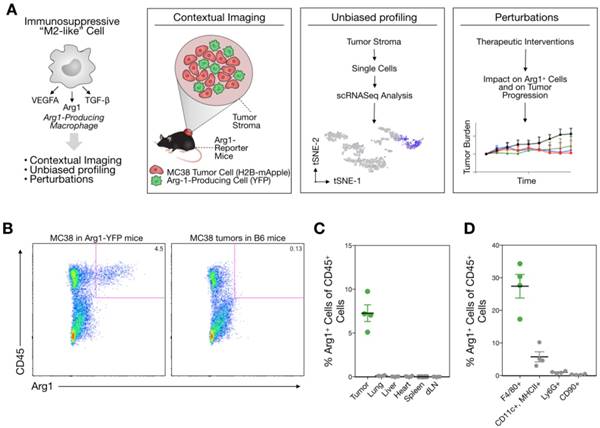
We used the syngeneic MC38 tumor model given its widespread use in immune-oncology and high macrophage content [10]. To assess Arg1 cells using conventional and single cell approaches (Figure 1A), we used Arg1-eYFP reporter animals that express an iRES-eYFP following endogenous Arg1 [24]. MC38 cancer cells expressing H2B-mApple were implanted into the reporter mice, and tumors and other organs were harvested after 7 days. Animal tissues were subsequently analyzed with a panel of immune cell markers for Arg1 expression by flow cytometry (Figure 1B). Amongst CD45+ immune cells, we found Arg1 expression to be confined to the tumor and not other organs (Figure 1C). This was confirmed by in situ imaging of resected organs prior to preparation for flow cytometry (Figure S1). Flow cytometric analysis showed 27% ± 4% of TAM to be Arg1 expressing (Figure 1D and Figure S2A). Within tumors, F4/80+ macrophages were indeed the predominant source of Arg1 (Figure S2B).
Arg1 is an immunosuppressive signal found predominantly on TAM. (A) Macrophages polarized toward immunosuppressive phenotype express Arg1. Single cell strategies to explore Arg1-producing macrophages in tumors, including intravital microscopy and scRNA seq. (B) Representative flow cytometry plots of MC38 tumor cells from an Arg1-eYFP reporter mouse (left) compared to a wild-type C57BL/6 mouse (B6, right). The percentage of total cells that are Arg1+ is noted in the top right corner. (C) The percentage of CD45+ immune cells with Arg1 positivity plotted for MC38 tumors, lung, liver, heart, spleen and tumor-draining lymph node (dLN); collected from 4 mice. (D) Arg1 positivity amongst several MC38 tumor immune cell populations defined by surface staining markers, pre-gated on CD45 positivity. Values represent mean ± SEM.
In vivo imaging of Arg1+ TAM
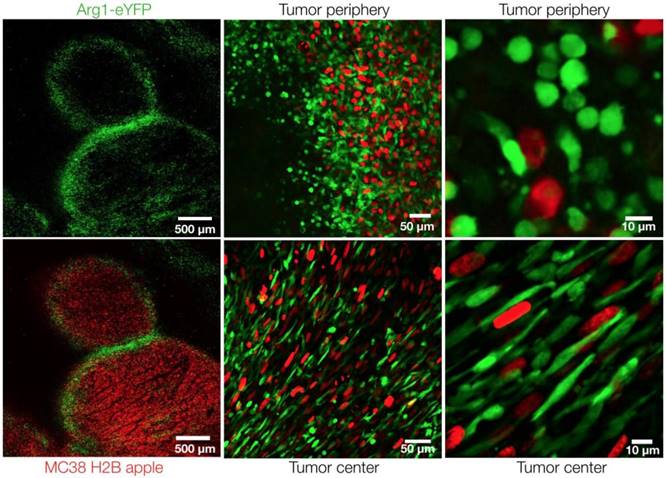
The model allowed us to analyze cancer cells (mApple; red) and the spatial distribution of Arg1-eYFP (green)-expressing cells throughout the tumor by in vivo imaging. Low-magnification confocal microscopy revealed Arg1 expression in a peri-tumoral pattern, although Arg1+ TAM were found throughout the tumor stroma (Figure 2). Arg1 expression was brightest in the periphery, whereas the tumor core contained a mixture of dim and bright Arg1-expressing cells (Figure 2). This is consistent with prior work having demonstrated that different tumor microenvironment cues can influence Arg1 expression [19,25].
Arg1+ macrophage distribution in the tumor microenvironment. Intravital microscopy images of MC38-H2B-mApple tumor cells (red) in Arg1-eYFP reporter mice. Arg1+ macrophage (green) distribution and shape at higher resolution in the center or periphery of a representative tumor implanted 8 days prior.
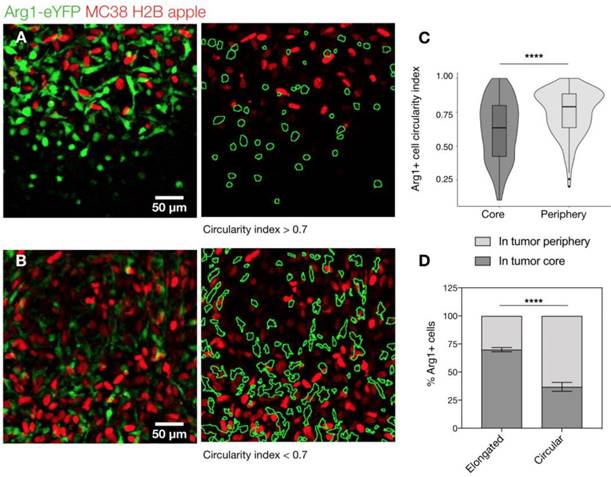
At higher resolutions, we observed a dichotomy in cellular shape among Arg1+ TAM. Cells just outside the tumor margin (Figure 3A) typically showed a rounded morphology, whereas those in the tumor core were most often elongated or stellate shaped (Figure 3B). The average circularity index of Arg1+ TAM in the tumor core (0.62 ± 0.01) was significantly lower than that of peripheral TAM (0.75 ± 0.01; p< 0.0001; Figure 3C). Three-dimensional reconstruction of confocal z-stacks showed the spherical nature of these cells at the periphery of the tumor (Movie 1). However, there was some overlap between cell shapes and locations: overall, rounded TAM were twice as likely to fall just outside the tumor margin and elongated cells were three times as likely to fall in the tumor core (Figure 3D). Tumor cell nuclei were also observed to have an elongated morphology in the tumor core, consistent with clinical histopathologic observations of spindle morphologies observed in GI tumor core biopsies [26]. In cancer cells, elongated morphologies have been linked to migratory phenotypes [27] and cytoskeleton-induced elongation has been shown to dramatically alter macrophage polarization phenotypes [28].
Arg1+ macrophage shape analysis. (A) Arg1-eYFP macrophages (green) on the periphery of an MC38-H2B-mApple tumor (red) revealed with intravital microscopy (left). Green ROIs from rounded (circularity index > 0.7) Arg1+ macrophages overlaid on tumor cells (right) (B) Arg1-eYFP cells at the same depth as (A) but in the tumor core (left). Green ROIs outlining elongated (circularity index < 0.7) Arg1+ macrophages (right). (C) Violin plots showing the circularity index probability distribution for Arg1+ macrophages at the core or periphery. Box plots represent the interquartile range. (D) The probability of each Arg1 TAM shape phenotype to be found at the tumor core or periphery. Eight fields of view compiled across 4 Arg1-eYFP reporter mice. Values represent mean ± SEM. ****P < 0.0001 (Student's t-test).
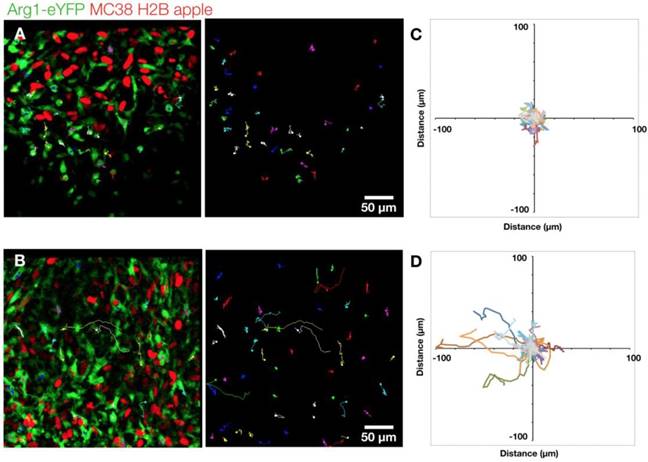
We further explored the motility of Arg1+ TAM using time-lapse microscopy. We assessed cells in both the periphery (Figure 4A) and the core of the tumor (Figure 4B and Movie 2). We found the rounded Arg1 cells at the periphery to be sessile (Figure 4C), with motility coefficient of 0.2255 ± 0.0002 μm2 min-1 (Figure S3A) and instantaneous velocity of 0.78 ± 0.02 μm min-1 (Figure S3B). In contrast, Arg1+ TAM in the core (Figure 4D) had a significantly higher motility coefficient (0.803 ± 0.001 μm2 min-1) and instantaneous velocity (1.07 ± 0.03 μm min-1, Figure S3A-B). While most Arg1+ TAM in the tumor core moved within a confined area, a subset of these cells was seen traversing the microenvironment along tumor vessels (Movie 2). The instantaneous velocity remained relatively constant during a 3 h observation (Movie 3).
Arg1+ macrophage motility. (A) Arg1+ macrophage tracks over a 60 min time-lapse at the MC38-H2B-mApple tumor periphery overlaid (left) on representative intravital microscopy images. Isolated tracks from the same representative image (right). (B) Arg1+ macrophage tracks at the tumor core shown as overlays (left) or in isolation (right). Track plots centered at the origin revealing overall displacement of Arg1+ macrophages at the periphery (C) and core (D). Images representative of time lapse experiments taken from 8 fields of view compiled across 4 Arg1-eYFP reporter mice.
To assess the presence of these Arg1+ TAM in other models, we also investigated an additional syngeneic tumor model (the EL4 lymphoma model) and found similar TAM phenotypes (Figure S4A). In the EL4 model, Arg1+ TAM were observed to be brightest just outside the margin of these lymphoma tumors (Figure S4B-C) where they often had a more rounded appearance as opposed to central TAM cells. We next surgically exposed and used confocal microscopy to investigate intradermal B16-H2B-mApple melanoma tumors implanted one week prior into a cohort of Arg1-eYFP reporter mice without the use of a dorsal skin-fold chamber (Figure S5A). We found rounded (circularity index of 0.70 ± 0.02) Arg1+ cell morphologies in the periphery and elongated (circularity index of 0.55 ± 0.05) morphologies in the core (Figure S5B), confirming that these subtypes are present in orthotopic models and not caused by the surgically-installed window chamber. Indeed, these morphologically-defined subtypes were also present in MC38 tumors implanted without the dorsal skin-fold chamber (Figure S6A-C). Interestingly, we observed a correlation in Arg1-eYFP fluorescence intensity and circularity index in Arg1+ TAM in the periphery (Figure S6A), but the same trend was not observed in the core (Figure S6B).
scRNA seq of Arg1 expression across intratumoral immune cell niches
Because we observed spatial heterogeneity amongst Arg1+ TAM, we sought to explore in greater detail the identifying genetic signatures of these cell populations. We used scRNA seq to characterize the transcriptional profile of CD45+ immune cells in the MC38 tumor model. MC38 tumor digests were FACS sorted for CD45 positivity and >1,000 cells per sample were analyzed by single-cell transcriptomic analysis. Dimensional reduction for data display was performed according to convention using t-Distributed Stochastic Neighbor Embedding (tSNE) [29]. Arg1 was predominantly expressed by macrophages (Figure S7), as were Egr2, Fcgr2b, and Fcgr3. These cells also expressed other canonical macrophage markers (Mrc1, Fn1, Chil3, Ctsb, Stab1, Vegfa, Fcgr1) [30,31]. Several markers (Lgmn, Gatm, C1qb) were particularly well correlated with Arg1 expression, while others (Hilpda and Bcl2a1b) discriminated Arg1+ from Arg1- macrophages but were expressed in other immune populations as well (Figure S7).
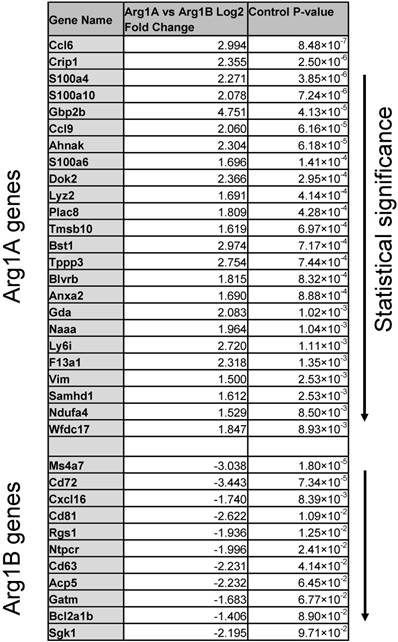
We next used a recently reported method of unbiased clustering (SPRING [32]) to plot and identify distinct immune cell niches using conventional immune cell markers defined by ImmGen (www.immgen.org) (Figure 5A). This method, unlike tSNE, is non-stochastic, which permits reproducible visualization of high-dimensional scRNA seq datasets and faithfully captures continuous expression topologies [33]. We identified a gradient of Arg1 expression across TAM in the tumor environment. Among Arg1+ TAM, we observed two distinct subsets (Figure 5A), referred to as Arg1A and Arg1B, and identified the genes that most discriminated these subsets from each other (Figure 5B and Table 1). Using the full list of genes, we then analyzed these subset-discriminating markers across all immune cell populations to identify candidate markers specific to the Arg1A or Arg1B populations (Figure S8A). The markers that most discriminated Arg1A cells from all other immune cells were Gpb2b and Bst1. These Arg1A cells also over-expressed chemokine genes such as Ccl6, Ccl9 and F13a1; however, these genes were also found in some non-macrophage niches (Figure S8A), including neutrophils, dendritic cells and monocytes. The most discriminating markers for Arg1B were Sgk1, Pmepa1 and Ms4a7 (Figure S8B). The Arg1B cells also showed over-expression of Cd72, Cxcl16 and Rgs1; however, these markers were also identified in dendritic cells, neutrophils and lymphocytes (Figure S8B).
scRNA seq reveals subsets of Arg-1 macrophages. (A) Arg1 gene expression colorized across immune cell niches clustered using SPRING analysis of scRNA seq gene expression profiles. Two distinct macrophage populations contain Arg1+ macrophages, with heterogenous (Arg1A) and homogenous (Arg1B) Arg1 expression. CD45+ cells from 4 tumors were pooled for single cell analysis. (B) Heat map representing expression values for top 20 genes that discriminate Arg1A and Arg1B populations, based on P-value.
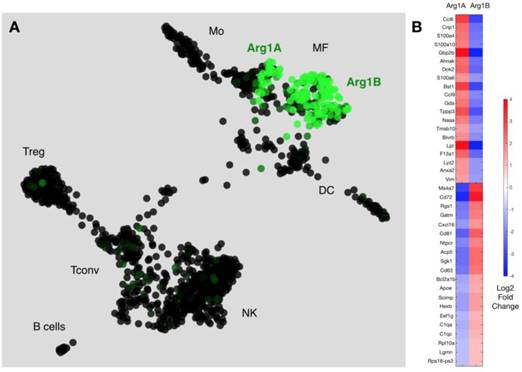
Differentially expressed genes ranked by P value that discriminate Arg1A and Arg1B macrophage clusters identified in scRNA seq of MC38 CD45+ cells.
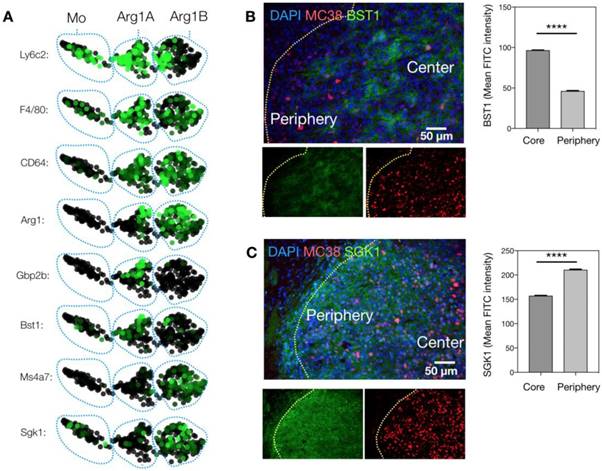
We next sought to know whether these clusters were associated with the two phenotypes observed by intravital microscopy. We used immunostaining to link the genotypes identified by scRNA seq to the phenotypes defined by imaging. Freshly frozen MC38-H2B-mApple tumors were cryo-sectioned and first stained for Bst1, a marker of the Arg1A population (Figure 6A). Bst1 staining was distributed in elongated cells in the tumor core (Figure 6B), which was also the case for Gbp2b, another Arg1A marker (Figure S9). Furthermore, Sgk1 staining was consistent with the Arg1B population around the tumor periphery (Figure 6C). Additionally, Gene Ontology (GO) analysis between Arg1A- and Arg1B-discriminating genes showed Arg1A cells to be enriched for chemotaxis and morphology markers (Figure S10A), consistent with in vivo imaging data showing Arg1+ TAM elongation and motility in the tumor core (Figure 3 and Figure S3). This further analysis also revealed that the Arg1B cluster exhibited a profile consistent with mature alternatively-activated M2 macrophages (Ly6clo, F4/80+, MS4A7hi) (Figure 6A).
Defining macrophage sub-populations by genes and tumoral location. (A) SPRING plots of scRNA seq data showing expression of myeloid maturity markers in monocyte (Mo)-, Arg1A-, and Arg1B-containing clusters. (B) Representative microscopy images of an MC38-H2B-mApple (red) tumor section stained with DAPI for cell nuclei (blue) and with BST1 for Arg1A cells. Average peri-nuclear expression of BST1 quantified in the core and periphery of 3 tumors. (C) Representative microscopy images from a concomitant slice of the same tumor stained with DAPI for cell nuclei (blue) and with SGK1 for Arg1B cells. Average peri-nuclear expression of SGK1 quantified across 4 tumors. Values represent mean ± SEM. ****P < 0.0001 (Student's t-test).
Change in Arg1 TAM phenotype during immunotherapy response
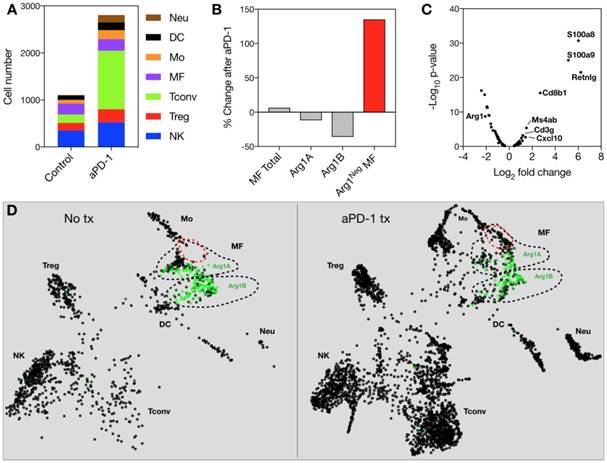
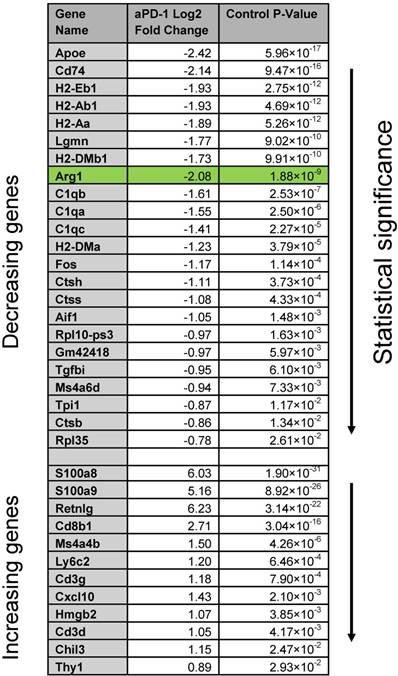
Because Arg1 TAM is generally associated with immunosuppressive activity, we sought to explore the changes these cells undergo in response to immunotherapy. The MC38 tumor line is responsive to treatment with aPD-1 monoclonal antibodies [10], which can reactivate anti-tumor functions mediated by CD8+ T cells [34]. Treatment of the MC38 tumor model with a single 200 μg i.p. dose of aPD-1 resulted in a substantial increase of T cells (Figure 7A). By contrast, the total number of macrophages changed to a lesser degree (Figure 7A). When subtypes were analyzed, it became apparent that the abundance of Arg1+ TAM decreased while the amount of Arg1- TAM increased substantially (Figure 7B). On a global scale among all CD45+ immune cells in the tumor, Arg1 was one of the most significantly down-regulated genes identified following aPD-1 treatment (Figure 7C). Several of the other most profoundly down-regulated genes were associated with macrophages and/or monocytes (Table 2). On a local scale, a phenotypic shift was observed in the cluster containing Arg1A macrophages (Figure 7D). This shift was characterized by the formation of a new subpopulation of cells enriched in chemotaxis and interferon response genes, including Gbp2, Cxcl9 and Cxcl10. GO analysis of genes enriched across all macrophages following aPD-1 showed a profound expansion in pathways associated with classical or “M1-like” activation and chemotaxis (Figure S10B).
Effects of anti-PD1 therapy on macrophages. (A) Immune cell abundance, defined by scRNA seq, in control or aPD-1-treated MC38 tumors. CD45+ cells from 4 tumors per treatment group were pooled for single cell analysis. (B) Percent change detected by scRNA seq in total, Arg1A, Arg1B, or Arg1- macrophages in response to aPD-1 treatment. (C) A volcano plot depicting differential gene expression in aPD-1-treated versus control scRNA seq samples. Genes of interest are labeled to indicate their fold change in expression after aPD-1 therapy. (D) SPRING plots of control (left) and aPD-1-treated (right) MC38 tumor scRNA seq data. Green intensity indicates normalized Arg1 gene expression, and Arg1A and Arg1B clusters are outlined with dotted black lines. A new population of Arg1- macrophages, outlined in red, was visible after aPD-1 treatment.
Global gene changes in response to aPD-1 measured by scRNA seq across all CD45+ cells in an MC38 tumor. Genes significantly (P < 0.05) enriched or depleted after aPD-1 treatment are listed alongside Log2 fold change and ranked by P value.
To better understand the changes observed in scRNA seq data, we used intravital microscopy to study aPD-1 response longitudinally in the same tumor. These studies corroborated the finding that Arg1 expression decreased in TAM (Figure S11A and Table 2), particularly in the tumor core (Figure S11B). We also injected a macrophage-targeting fluorescent nanoparticle [35], which revealed a population of Arg1- TAM distributed throughout the tumor 3 days after treatment (Figure S11A). We performed shape analysis of all Arg1+ TAM and found enhancement in the circularity index, consistent with the trend toward a reduction in the elongated Arg1A phenotype throughout the tumor following aPD-1 therapy (Figure S11C-D).
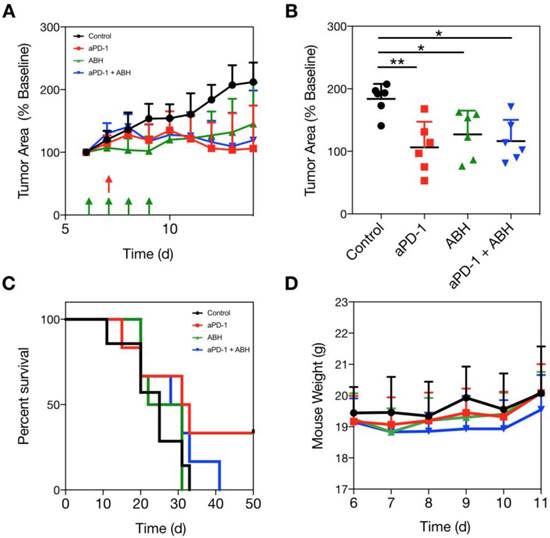
The suppression of Arg1 in TAM at the tumor core led us to hypothesize that Arg1 inhibition would provide no additional benefit when administered in combination with aPD-1 therapy. We dosed a cohort of MC38 tumor-bearing C57BL6 mice with a commercially-available Arg1 inhibitor (2-S-amino-6-boronohexanoic acid; ABH) i.p. for 4 consecutive days and monitored tumor growth rates over two weeks. Vehicle control, aPD-1, ABH, or aPD-1/ABH combination treatments were compared via caliper measurement (Figure 8A and Figure S12). Although we found both ABH and aPD-1 to significantly slow tumor growth relative to vehicle control-treated mice, the combination treatment failed to provide additive effects (Figure 8B). When treatment endpoints were compared, it emerged that ABH treatment alone did not prolong survival (Figure 8C). The therapeutic doses of aPD-1 and ABH were well tolerated (Figure 8D), but when combined actually lowered the survival rate in our mouse studies. In summary, these experiments show that Arg1 inhibition does not act synergistically with checkpoint inhibition.
Arg1 inhibition in combination with aPD-1 therapy. (A) MC38 tumors in C57BL6 mice were administered vehicle control, 100 μg ABH i.p. on days 6-9 of tumor growth, 200 μg aPD-1 (clone 29F.1A12) i.p. on day 7 after tumor implantation, or both treatments. Treatment schedules indicated by green (ABH) and red (aPD-1) arrows. (B) MC38 tumor volume for each treated cohort on day 12 after tumor implantation. Data are presented as mean ± SEM; *P < 0.05, **P < 0.01. (C) Mouse survival tracked for each treatment group. (D) Mouse weights throughout the duration of therapy. Data are depicted as the mean ± SEM for > 6 mice per group.
Discussion
Using a combination of intravital imaging and scRNA seq—complementary single cell analytical approaches—we compiled an in-depth characterization of immune-suppressive TAM in immunocompetent mouse tumor models. Two phenotypes of Arg1+ TAM were identified that were distinguished based on location, morphology, motility, and fluorescence intensity (i.e., Arg1 expression). The existence of two distinct phenotypes was recapitulated using two independent methods for unbiased clustering of immune cell niches profiled by scRNA seq [29,32,36]. Immunohistochemical staining of freshly frozen MC38 tumors then allowed us to link the phenotypes defined by imaging to the clusters identified using transcriptional profiling. The Arg1B phenotype of rounded cells was mostly distributed in the tumor periphery and was relatively sessile. Conversely, the elongated Arg1A cells were most abundant in the tumor center and were highly motile.
Differential TAM distribution in the tumor core and periphery has been reported [37-39]; however, we provide a more in-depth characterization of the full transcriptional profile of these spatially-distinct populations. Our analyses included exploration of transcriptome profiles with a focus on i) uniquely identifying genes that discriminate Arg1 subsets, ii) pathway and cell function analysis via GO and iii) expression of maturity genes. Motile Arg1A cells were enriched in several genes, such as Gpb2b and Bst1 (Figure S8), that are associated with IFNγ responses and cellular chemotaxis, respectively. These Arg1A cells also over-expressed chemokine genes such as Ccl6, Ccl9 and S100 (Table 1). The gene signature of these cells suggests active migration throughout the tumor core in response to extracellular signaling cues. Finally, the Arg1A cells also had markers indicative of less mature macrophages, being both Ly6c+ and F4/80+. Although Arg1 is attributed to M2 macrophages in mice [6,40], our findings are consistent with the prior observation that Arg1 expression can also occur in TAM prior to full maturation [37].
In contradistinction, the more sessile Arg1B cells were found in the tumor periphery. Cells were uniquely defined by expression of Sgk1, Pmepa1 and Ms4a7, among others (Figure S8). These genes are consistent with the tissue homeostasis and immune regulatory roles associated with mature M2 macrophages [41-43]. The Arg1B cells also showed over-expression of Cd72, Cxcl16 and tetraspannins (Cd63, Cd81). The exact role of these genes in M2 macrophage function remains unexplored in the tumor setting. Consistent with literature reports that have linked peripheral TAM with more mature “M2-like” cells [19,37], we observed the peripheral Arg1B population to be Ly6clo, F4/80+ and enriched for the myeloid maturity marker Ms4a7 [44]. Given the above findings, we concluded that highly motile macrophages in the tumor core are in a transition phase between circulating monocytes and mature M2 macrophages. Conversely, peripheral cells were often sessile, more mature, and function in the manner typically attributed to immune-suppressive M2 macrophages.
Myeloid cells and TAM in particular have been indicated in immunotherapy resistance [10,34,45]; however, the changes incurred during successful immunotherapy have, as of yet, not been fully examined. Interestingly, we found that the Arg1+ fraction decreased during immunotherapy response and that there was a surge in Arg1- TAM. This surge was associated with further enhancement of classical activation pathways, showing a shift along the spectrum of pro- and anti-inflammatory TAM phenotypes. The wild-type MC38 tumor model has an approximately 40% response rate to single-agent aPD-1 therapy [10]. To see if we could further improve anti PD-1 treatment, we combined this monotherapy with a potent Arg1 inhibitor (ABH) [46] to eradicate the immunosuppressive effects of TAM. Although similar strategies have been reported successful in some models [21], we found no additive nor synergistic benefits to combining these treatment strategies in this model, despite a statistically-significant effect early after treatment with either agent individually. This is not, however, inconsistent with the imaging and scRNA seq data that show aPD-1 causes a depletion in Arg1 TAM. Future adjustments to the administration schedule may further improve ABH therapeutic efficacy; however, our results show that the overlapping drug mechanisms of aPD-1 and Arg1 inhibitors may not translate into therapeutic synergy.
Although flow cytometry continues to be the most common analytical tool used in immunology, new approaches including single cell resolution intravital microscopic imaging, scRNA seq, multiplexed image cycling, and fluorescence in situ hybridization are expanding the toolset available to researchers. As single cell analytical techniques become more widely adopted, it will become ever important to synthesize the vast amount of spatial, temporal and molecular information into comprehensible data sets. Here we show that this is indeed possible and allows for powerful new approaches to understand complex biological phenomena that will ultimately translate to improved therapeutics.
Methods
Tumor models
Cells were maintained in culture at 37 °C and 5% CO2 and screened each month for mycoplasma. MC38 mouse colon carcinoma cells were kindly provided by Mark Smyth (QIMR Berghofer Medical Research Institute). The EL-4 mouse lymphoma line was purchased from ATCC. The B16F10 melanoma cell line was purchased from ATCC. All cell lines were cultured in Iscove's Modified Dulbecco's Medium supplemented with 10% heat-inactivated fetal calf serum, 100 IU penicillin, 100 μg/mL streptomycin (Invitrogen), and passaged every two days to keep cells under 75% confluency. To allow intravital imaging, the MC38, EL4, and B16 lines were stably transfected with H2B-mApple using the pLVX-H2B-mApple lentiviral vector (Clontech), as described previously [10]. Transfected cells were selected in 3 μg/mL puromycin before isolation by FACS sorting.
Animal studies
All animal studies were performed in accordance with the guidelines established by the Institutional Animal Care and Use Committees at Massachusetts General Hospital (MGH). Arg1-eYFP reporter mice (YARG mice, Jackson Labs), wherein YFP expression is under control of the endogenous Arg1 gene reporter in an IRES system, were used for flow cytometry and in vivo imaging of Arg1 expression. All other mouse studies were performed using C57BL/6 mice, unless otherwise indicated. Experiments were begun when animals reached 6-8 weeks of age. Dorsal skinfold chambers were implanted on mice for in vivo microscopy, using previously described procedures [17]. We surgically implanted 1×10⁶ H2B-mApple-labeled tumor cells as described previously [10,47]. Mouse experiments were performed using male and female mice. Prior to all tumor implantations, mice were anesthetized using 2% isoflurane in oxygen and hair was removed by shaving and Nair application. Intradermal implantation of MC38 and MC38-H2B-mApple was performed using 2×10⁶ cells per mouse. Intradermal implantation of B16-H2B-mApple was performed using 0.5×10⁶ cells per mouse. Tumors were grown for 1 week until they reached approximately an area of 30 mm2 (which is roughly equivalent to 60 mm3 in these disk-shaped intradermal tumors). Rat anti-mouse aPD-1 (clone 29F.1A12; 200 μg) and ABH (ThermoFisher; 100 μg/day for 4 days) were administered i.p. and mouse weight was monitored throughout the course of the study.
Flow cytometry
Arg1-eYFP reporter mice were implanted with MC38 tumors, and tumors were allowed to grow for 7 days until approximately 100 mm3 in size. Tumors and tissues such as heart, spleen, lung, liver, and tumor draining lymph node were then excised and digested using Collagenase Type I (Worthington) for 30 min at 37 °C. Digests were passed through a 40 µm cell strainer and stained for flow cytometry. Samples were incubated with True Stain Fc block (Biolegend) to block Fc receptors. PE-Cy7-conjugated anti-CD11c (clone N418), Brilliant Violet 605-conjugated anti-CD11b (clone M1/70), APC-conjugated anti-F4/80 (clone BM8), and Alexa 700-conjugated anti-Ly6G (clone 1A8) were from Biolegend. PE-conjugated anti-CD90.2 (clone 53-2.1) was from BD. eFluor 450-conjugated anti-MHC II (clone M5/114.15.2) and eFluor 780-conjugated anti-CD45 (clone 30-F11) were from eBioscience. Cells were stained for 30 min in PBS containing 0.5% BSA and 2 mM EDTA, washed, then run on a BD LSRII flow cytometer. Flow cytometry data was then analyzed using FlowJo software (Treestar).
Intravital microscopy
We used the dorsal skinfold chamber to image tumor cells in Arg1-eYFP mice. For MC38-H2B-mApple and EL4-H2B-mApple tumors, 106 cells were injected in the fascia. Mice were monitored daily for 8 days prior to imaging. Where indicated, mice were injected i.v. with a Pacific Blue-labeled dextran nanoparticle (containing 1 nmol Pacific Blue dye) for TAM labeling or Pacific Blue-labeled 500 kDa amino-dextran (containing 56 nmol Pacific Blue dye) for vascular labeling [48]. Mice were anesthetized (2% isoflurane in oxygen) and immobilized on a custom heating platform to maintain body temperature and minimize motion artifacts. Imaging was performed with an Olympus FV1000MPE confocal imaging system and an XLUMPLFL 20x water immersion objective (NA 0.95; Olympus America). Pacific Blue, YFP and mApple were imaged sequentially using 405-nm, 473-nm and 559-nm light sources and BA430-455, BA490-540, and BA575-620 emission filters, along with DM405/473/559 nm dichroic beam splitters (Olympus America). Excised organs were also imaged on this microscope, but for these experiments Arg1-eYFP mice were injected 2.5 h prior with 75 μL of 10 kDa dextran-Cascade Blue (ThermoFisher), and 5 min prior with rhodamine-lectin (Vector Labs) for vascular labeling.
Single cell RNA seq
C57BL/6J mice were anesthetized, their upper and lower back were shaved, and hair was removed by Nair. MC38 tumors cell were injected intradermally at 2×10⁶ cells per 50 μL at 4 sites in the mouse. After 7 days of tumor growth, treatment groups were initiated, and consisted of aPD-1 and control. aPD-1 was dosed at 200 μg per mouse with one dose at day 7. On day 10, mice were euthanized and tumors were aseptically isolated and minced into small pieces using surgical scissors. Minced samples were digested using Collagenase I (Worthington) in RPMI media at 37 °C for 30 min, and then passed through a 40 μm filter. Cells were resuspended in FACS buffer (PBS with 0.5% BSA and 2 mM EDTA) stained with anti-mouse CD45 (Clone: 30-F11) for 30 min at 4 °C. Cells were then washed and sorted on a BD FACSAria to isolate CD45+ cells. Samples from 4 tumors per treatment were pooled to reach the required amount of input material for scRNA seq.
Cells were sorted directly into PBS with 0.04% BSA (400 μg/mL) without centrifugation and stored on ice. Control (3,132) and aPD-1 treated (8,178) cells were loaded onto 2 lanes of a 10x Genomics Chromium Single Cell 3' Chip and sorted into GEMs (Gel beads in EMulsion) [49]. Libraries were prepared according to manufacturers' instructions (CG00052 Rev A), pooled and run on an Illumina Nextseq 400. Cellranger v2.1.0 was used to demultiplex barcoded samples and generate gene-barcode matrices for end user analysis on Loupe Cell Browser 2.0.0. Gene-barcode matrices were also analyzed and plotted using the Seurat R package. Gene-Barcode Matrices were filtered to exclude cells with more than 5% mitochondrial genes, fewer than 200 genes per cell, and more than 2500 genes per cell. The first 10 principle components were used for tSNE projection and clustering analysis at a resolution of 0.6 and a k seed of 100. The Arg1+ populations were identified from this PCA analysis and the cells from this cluster were identified as macrophages using pre-defined markers in the Loupe Cell Browser and verification from the ImmGen database. SPRING plots were generated using Kleintools SPRING (https://kleintools.hms.harvard.edu/tools/spring.html) [32].
Histology
Intradermal MC38-H2B-mApple tumors were embedded in OCT (Sakura Finetek) and flash-frozen in a 2-methylbutane bath on dry ice. Tumor tissue was cryo-sectioned into serial 6 μm slices and stained with the following primary antibodies: SGK1 (Rabbit polyclonal, Abcam), BST1 (Rat KT157 clone, ThermoFisher), and GBP2B (Rabbit polyclonal, ThermoFisher). Goat anti-rabbit IgG and goat anti-rat IgG antibodies conjugated with Alexa Fluor 488 (ThermoFisher) were used as secondary antibodies for immunofluorescent staining and DAPI (Invitrogen) was used for staining cell nuclei. Images were captured by using a BX63 automated fluorescence microscope (Olympus) equipped with Andor Neo sCMOS camera (Andor Technology Ltd.) and the images were processed with FIJI software.
Analysis and statistics
Flow cytometry data were analyzed and plotted using FlowJo (version 9.8.5). Microscopy images were processed and quantified using custom Java macros integrated into the FIJI MacOS bundle of ImageJ (version 1.8.0_101). Instantaneous velocity was automatically tracked using Imaris Software. Violin plots were prepared using R Studio Desktop (version 1.0.136). The P values for scRNA seq data were calculated based on the relationship between the mean and the variance of log2 normalized fold change differences between the two conditions. A Benjamini-Hochberg correction was used to account for multiple testing. Tabulated values were formatted in Microsoft Excel (version 13.6.3) and imported into GraphPad Prism (version 7) for plotting and statistical analysis. Data are presented as mean ± SEM unless otherwise indicated. Two-tailed Student's t-test was used to compare statistical significance between two datasets. If multiple comparisons were made, analysis of variance was used with post-hoc Tukey's HSD where appropriate. Survival analysis was performed by log-rank test. Significance was determined at P = 0.05.
Data availability
The data supporting the findings of this study are available within the paper and it's Supplementary Material. The full scRNA seq data set for Control and aPD-1 treated MC38 tumor immune cells have been uploaded to GEO.
Abbreviations
ABH: 2-S-amino-6-boronohexanoic acid; aPD-1: anti-Programmed Cell Death-1; Arg1: arginase 1; BSA: bovine serum albumin; EDTA: Ethylenediaminetetraacetic acid; GEMs: Gel beads in Emulsion; GO: gene ontology; i.p.: intraperitoneal; i.v.: intravenous; PBS: phosphate buffered saline; PCA: principal component analysis; SEM: standard error of the mean; sc: single cell; TAM: tumor-associated macrophages; tSNE: t-Distributed Stochastic Neighbor Embedding.
Supplementary Material
Supplementary figures.
Acknowledgements
We would like to thank Yoshi Iwamoto (MGH) for assistance in performing immunohistology, Kevin King (UCSD) and the Biopolymers facility at HMS for guidance in scRNA seq experiments, GJ Freeman (Dana Farber Cancer Institute) for the kind gift of the anti-PD1 antibody, Katy Yang (MGH) for transfection of the EL4 cell line and Caleb Weinreb and Allon Klein (Harvard Medical School) for the development and assistance of the SPRING software. This work was supported in part by US National Institutes of Health (NIH) grants R01-CA206890, R01-CA206890, R33-CA202064 and U01CA206997. MJP is supported in part by a Samana Cay MGH Research Scholar Fund. SPA and SBG are supported by T32-CA79443.
Author contributions
SPA, SBG, CSG, MJP, and RW conceived and planned the experiments. SPA, SBG, CSG, RHK, JO, and RW performed the experiments and data analysis. SPA, MJP and RW wrote the manuscript. All authors contributed feedback on the final manuscript.
Competing Interests
The authors have declared that no competing interest exists.
References
1. Engblom C, Pfirschke C, Pittet MJ. The role of myeloid cells in cancer therapies. Nat Rev Cancer. 2016;16:447-462
2. Wynn TA, Chawla A, Pollard JW. Macrophage biology in development, homeostasis and disease. Nature. 2013;496:445-455
3. Gabrilovich DI, Ostrand-Rosenberg S, Bronte V. Coordinated regulation of myeloid cells by tumours. Nat Rev Immunol. 2012;12:253-268
4. Pittet MJ, Nahrendorf M, Swirski FK. The journey from stem cell to macrophage. Ann NY Acad Sci. 2014;1319:1-18
5. De Palma M, Lewis CE. Macrophage regulation of tumor responses to anticancer therapies. Cancer Cell. 2013;23:277-286
6. Mantovani A, Allavena P. The interaction of anticancer therapies with tumor-associated macrophages. J Exp Med. 2015;212:435-445
7. Ruffell B, Coussens LM. Macrophages and therapeutic resistance in cancer. Cancer Cell. 2015;27:462-472
8. Zhu Y, Knolhoff BL, Meyer MA. et al. CSF1/CSF1R blockade reprograms tumor-infiltrating macrophages and improves response to T-cell checkpoint immunotherapy in pancreatic cancer models. Cancer Res. 2014;74:5057-5069
9. Romano E, Kusio-Kobialka M, Foukas PG. et al. Ipilimumab-dependent cell-mediated cytotoxicity of regulatory T cells ex vivo by nonclassical monocytes in melanoma patients. Proc Natl Acad Sci USA. 2015;112:6140-6145
10. Arlauckas SP, Garris CS, Kohler RH. et al. In vivo imaging reveals a tumor-associated macrophage-mediated resistance pathway in anti-PD-1 therapy. Sci Transl Med. 2017;9:eaal3604
11. Bronte V, Murray PJ. Understanding local macrophage phenotypes in disease: modulating macrophage function to treat cancer. Nat Med. 2015;21:117-119
12. Gordon S, Martinez FO. Alternative activation of macrophages: mechanism and functions. Immunity. 2010;32:593-604
13. Sica A, Mantovani A. Macrophage plasticity and polarization: in vivo veritas. J Clin Invest. 2012;122:787-795
14. Movahedi K, Laoui D, Gysemans C. et al. Different tumor microenvironments contain functionally distinct subsets of macrophages derived from Ly6C(high) monocytes. Cancer Res. 2010;70:5728-5739
15. Gentles AJ, Newman AM, Liu CL. et al. The prognostic landscape of genes and infiltrating immune cells across human cancers. Nat Med. 2015;21:938-945
16. Mantovani A, Sica A. Macrophages, innate immunity and cancer: balance, tolerance, and diversity. Curr Opin Immunol. 2010;22:231-237
17. Thurber GM, Yang KS, Reiner T. et al. Single-cell and subcellular pharmacokinetic imaging allows insight into drug action in vivo. Nat Commun. 2013;4:1504
18. Giedt RJ, Koch PD, Weissleder R. Single cell analysis of drug distribution by intravital imaging. PLoS One. 2013;8:e60988
19. Colegio OR, Chu NQ, Szabo AL. et al. Functional polarization of tumour-associated macrophages by tumour-derived lactic acid. Nature. 2014;513:559-563
20. Noy R, Pollard JW. Tumor-associated macrophages: from mechanisms to therapy. Immunity. 2014;41:49-61
21. Steggerda SM, Bennett MK, Chen J. et al. Inhibition of arginase by CB-1158 blocks myeloid cell-mediated immune suppression in the tumor microenvironment. J Immunother Cancer. 2017;5:101
22. Karagiannis GS, Pastoriza JM, Wang Y. et al. Neoadjuvant chemotherapy induces breast cancer metastasis through a TMEM-mediated mechanism. Sci Transl Med. 2017;9:eaan0026
23. Miller MA, Chandra R, Cuccarese MF. et al. Radiation therapy primes tumors for nanotherapeutic delivery via macrophage-mediated vascular bursts. Sci Transl Med. 2017;9:eaal0225
24. Reese TA, Liang HE, Tager AM. et al. Chitin induces accumulation in tissue of innate immune cells associated with allergy. Nature. 2007;447:92-96
25. Carmona-Fontaine C, Deforet M, Akkari L. et al. Metabolic origins of spatial organization in the tumor microenvironment. Proc Natl Acad Sci USA. 2017;114:2934-2939
26. Steigen SE, Straume B, Turbin D. et al. Clinicopathologic factors and nuclear morphometry as independent prognosticators in KIT-positive gastrointestinal stromal tumors. J Histochem Cytochem. 2008;56:139-145
27. Harada T, Swift J, Irianto J. et al. Nuclear lamin stiffness is a barrier to 3D migration, but softness can limit survival. J Cell Biol. 2014;204:669-682
28. McWhorter FY, Wang T, Nguyen P. et al. Modulation of macrophage phenotype by cell shape. Proc Natl Acad Sci USA. 2013;110:17253-17258
29. Butler A, Hoffman P, Smibert P. et al. Integrating single-cell transcriptomic data across different conditions, technologies, and species. Nat Biotechnol. 2018;36:411-420
30. Gautier EL, Shay T, Miller J. et al. Gene-expression profiles and transcriptional regulatory pathways that underlie the identity and diversity of mouse tissue macrophages. Nat Immunol. 2012;13:1118-1128
31. Poczobutt JM, De S, Yadav VK. et al. Expression Profiling of Macrophages Reveals Multiple Populations with Distinct Biological Roles in an Immunocompetent Orthotopic Model of Lung Cancer. J Immunol. 2016;196:2847-2859
32. Weinreb C, Wolock S, Klein A. SPRING: a kinetic interface for visualizing high dimensional single-cell expression data. Bioinformatics. 2017;34:1246-1248
33. Rodriguez-Fraticelli AE, Wolock SL, Weinreb CS. et al. Clonal analysis of lineage fate in native haematopoiesis. Nature. 2018;553:212-216
34. Schreiber RD, Old LJ, Smyth MJ. Cancer immunoediting: integrating immunity's roles in cancer suppression and promotion. Science. 2011;331:1565-1570
35. Miller MA, Arlauckas S, Weissleder R. Prediction of anti-cancer nanotherapy efficacy by imaging. Nanotheranostics. 2017;1:296-312
36. Weinreb C, Wolock S, Tusi BK. et al. Fundamental limits on dynamic inference from single-cell snapshots. Proc Natl Acad Sci USA. 2018;115:E2467-E2476
37. Georgoudaki AM, Prokopec KE, Boura VF. et al. Reprogramming tumor-associated macrophages by antibody targeting inhibits cancer progression and metastasis. Cell Rep. 2016;15:2000-2011
38. Gabrusiewicz K, Hossain M. B, Cortes-Santiago, N. et al. Macrophage ablation reduces M2-like populations and jeopardizes tumor growth in a MAFIA-based glioma model. Neoplasia. 2015;17:374-384
39. Cuccarese MF, Dubach JM, Pfirschke C. et al. Heterogeneity of macrophage infiltration and therapeutic response in lung carcinoma revealed by 3D organ imaging. Nat Commun. 2017;8:14293
40. Biswas SK, Mantovani A. Macrophage plasticity and interaction with lymphocyte subsets: cancer as a paradigm. Nat Immunol. 2010;11:889-896
41. Fagerli UM, Ullrich K, Stühmer T. et al. Serum/glucocorticoid-regulated kinase 1 (SGK1) is a prominent target gene of the transcriptional response to cytokines in multiple myeloma and supports the growth of myeloma cells. Oncogene. 2011;30:3198-3206
42. Watanabe Y, Itoh S, Goto T. et al. TMEPAI, a transmembrane TGF-beta-inducible protein, sequesters Smad proteins from active participation in TGF-beta signaling. Mol Cell. 2010;37:123-134
43. Liang Y, Tedder TF. Identification of a CD20-, FcepsilonRIbeta-, and HTm4-related gene family: sixteen new MS4A family members expressed in human and mouse. Genomics. 2001;72:119-127
44. Gingras MC, Lapillonne H, Margolin JF. CFFM4: a new member of the CD20/FcepsilonRIbeta family. Immunogenetics. 2001;53:468-476
45. Pyonteck SM, Akkari L, Schuhmacher AJ. et al. CSF-1R inhibition alters macrophage polarization and blocks glioma progression. Nat Med. 2013;19:1264-1272
46. Mehl A, Ghorbani P, Douda D. et al. Effect of arginase inhibition on pulmonary L-arginine metabolism in murine Pseudomonas pneumonia. PLoS One. 2014;9:e90232
47. Alieva M, Ritsma L, Giedt RJ. et al. Imaging windows for long-term intravital imaging: General overview and technical insights. Intravital. 2014;3:e29917
48. Miller MA, Gadde S, Pfirschke C. et al. Predicting therapeutic nanomedicine efficacy using a companion magnetic resonance imaging nanoparticle. Sci Transl Med. 2015;7:314ra183
49. Macosko EZ, Basu A, Satija R. et al. Highly parallel genome-wide expression profiling of individual cells using nanoliter droplets. Cell. 2015;161:1202-1214
Author contact
![]() Corresponding author: R. Weissleder, MD, PhD. Center for Systems Biology, Massachusetts General Hospital, 185 Cambridge St, CPZN 5206, Boston, MA, 02114. 617-726-8226 rweisslederharvard.edu
Corresponding author: R. Weissleder, MD, PhD. Center for Systems Biology, Massachusetts General Hospital, 185 Cambridge St, CPZN 5206, Boston, MA, 02114. 617-726-8226 rweisslederharvard.edu