Impact Factor
- Issue 12; 2026
- Issue 11; 2026
- Issue 10; 2026
- Issue 9; 2026
- Issue 8; 2026
- Volume 16; 2026
- Advance Articles
- Past Issues
- Cover Images
- Cover Suggestion
- Index & Coverage
- Special Issues
Introduction
Material and Methods
Results
Discussion
Conclusion
Abbreviations
Acknowledgements
References
International Journal of Biological Sciences
International Journal of Medical Sciences
 Global reach, higher impact

Theranostics 2018; 8(22):6357-6366. doi:10.7150/thno.26013 This issue Cite
Research Paper
Contrast-Enhanced µCT for Visualizing and Evaluating Murine Intestinal Inflammation
Dennis Jung1, Rafael Heiss2, Viktoria Kramer1, Oana-Maria Thoma1,5, Adrian P. Regensburger3, Wolfgang Rascher3, Michael Uder2, Markus F Neurath1,4, Ferdinand Knieling1,3* ![]() , Maximilian J. Waldner1,5*
, Maximilian J. Waldner1,5* ![]()
1. Department of Medicine 1, Friedrich-Alexander-University Erlangen-Nuremberg, Hartmannstraße 14, 91052 Erlangen, Germany
2. Department of Radiology, Friedrich-Alexander-University Erlangen-Nuremberg, Maximiliansplatz 3, 91054 Erlangen, Germany
3. Department of Pediatrics and Adolescent Medicine, Friedrich-Alexander-University Erlangen-Nuremberg, Loschgestraße 15, 91054 Erlangen, Germany
4. Ludwig Demling Center of Excellence, Friedrich-Alexander-University Erlangen-Nuremberg, Germany
5. Erlangen Graduate School in Advanced Optical Technologies (SAOT), Friedrich-Alexander-University Erlangen-Nuremberg, Germany
*shared authorship
Received 2018-3-12; Accepted 2018-10-14; Published 2018-12-7
Abstract

Rationale: To develop a simple and fast protocol for the assessment of acute and chronic experimental intestinal inflammation using contrast-enhanced µCT.
Methods: For the imaging studies, an acute 2% and 3% dextran sodium sulfate (n = 15, female, 8-12 weeks) and a chronic adoptive transfer colitis model (n = 10, female, 8-9 weeks) were established over 9 days or 6 weeks, respectively. Throughout the experiments, longitudinal measurement of murine intestinal wall thickness and time dependent perfusion was performed on a small animal µCT system (90 kV, 160 μA, FOV: 60 mm, scan time: 17 s, image size: 512x512, layer thickness: 118 µm) between 0.5 and 30 min after intravenous bolus injection of an iodine contrast agent. Weight development, small animal endoscopy, and histological ex vivo analysis were compared to contrast-enhanced µCT imaging findings.
Results: Murine intestinal wall thickness was significantly increased in inflamed colons of acute colitis at day 9 in comparison to pre-inflamed state. Perfusion analysis revealed a late contrast enhancement in acute inflamed colons and the renal medulla at day 9 compared to control mice. An increasing intestinal wall thickness was monitored 3, 5 and 6 weeks after on-set of chronic colitis in comparison to controls. A good correlation with endoscopic (r = 0.75, p < 0.0001) and histologic degree of inflammation (r = 0.83, p = 0.04) was found.
Conclusion: Contrast-enhanced µCT is a simple and fast method to assess acute intestinal inflammation and to monitor disease progression in experimental models of chronic colitis. According to our findings, one single contrast-enhanced µCT-scan is a valid non-invasive modality to quantify the degree of inflammation in the entire digestive tract in murine inflammatory models.
Keywords: contrast-enhanced µCT, murine intestinal inflammation, non-invasive detection of intestinal inflammation
Introduction
Inflammatory bowel diseases (IBD) such as Crohn's disease (CD) and ulcerative colitis (UC) are chronic and relapsing diseases with rising numbers both in industrial and developing countries [1, 2]. As pathophysiological mechanisms are still not completely understood, experimental models of IBD have been established to study the mechanisms of intestinal inflammation [2, 3]. Traditionally, histology was required to assess intestinal inflammation, which depends upon euthanasia of experimental animals and does not allow consecutive analysis of the same animal. As a consequence, in vivo imaging modalities have been developed to enable longitudinal monitoring and assessment of mucosal inflammation. Similar to human colonoscopy, small animal endoscopy has become a widely used tool to appraise experimental colitis [4]. However, endoscopy cannot assess transmural or small intestinal inflammation, while tomographic imaging allows assessment of the entire intestinal tract and its surrounding tissues [5]. For this reason, small animal cross-sectional imaging studies have been performed by using ultrasound (US) [6], multispectral optoacoustic tomography (MSOT) [7], micro computed tomography (µCT) imaging with rectal contrast filling [8], magnetic resonance imaging (MRI) [9], and positron emission tomography (PET)/µCT imaging [10]. All of these imaging techniques allow analysis of certain aspects of murine intestinal inflammation, however, imaging techniques as well as application of contrast agent are complicated and often take a long time.
The aim of the current study was to develop a simple and fast protocol to assess experimental intestinal inflammation using contract-enhanced µCT imaging (CE-µCT). We demonstrate that µCT in combination with the intravenous injection of an iodine-based contrast agent is a quick, sensitive and quantitative tool to monitor experimental murine colitis.
Material and Methods
Experimental models of intestinal inflammation
All animal studies were conducted at the University of Erlangen-Nuremberg with the approval of the Institutional Animal Care and Use Committee of the State Government of Middle Franconia (Az: 55.2-2532.1-12/13) and maintained in individually ventilated cages.
Acute dextran sodium sulfate (DSS, MP Biomedicals, Illkirch, France) colitis was established in a total of n = 15 mice (C57BL/6, female, 8-12 weeks, 17-23 g) [11]. Inflammation was induced using a concentration of 2% (n = 5) or 3% (n = 7) of dextran sodium sulfate (DSS, MP Biomedicals, Illkirch, France) [11] applied in the drinking water for eight consecutive days; it is important to assure that mice are always supplied with sufficient amount of DSS solution. Control animals (n = 3) received drinking water only. All mice were checked daily for well-being and individual weight to evaluate changes during the development of colitis.
For the experimental model of chronic intestinal inflammation, an adoptive transfer colitis was established by transferring wildtype CD4+/CD25- T-cells into n = 7 immune-deficient mice (RAG1-/-, female, 8-9 weeks, 18-20 g) [12]. For this, n = 2 gender-matched donor mice (C57BL/6, female, 6 weeks) were sacrificed and the spleens were harvested for cell isolation. CD4+/CD25- T cells were isolated using a CD4+/CD25- magnetic bead isolation kit (Miltenyi Biotec, Bergisch Gladbach, Germany) [12]. In total, 5*105 CD4+/CD25- splenocytes were suspended in 200 µl sterile PBS (phosphate buffered saline, Sigma-Aldrich, Steinheim, Germany) and injected in n = 3 RAG1-/- recipient mice intraperitoneally. In n = 3 control mice, 200 µl sterile PBS was injected; n = 1 did not reach the endpoint of the experiment and was excluded from final results. In the adoptive transfer colitis model, mice were checked for well-being and weight regularly (2-3 times a week).
In vivo imaging
Endoscopy
Small animal colonoscopy was performed on days 0, 5, and 9 in acute colitis model or before cell injection and weekly until week 6 following in chronic colitis model [4, 13]. During endoscopy, inflammation was scored by five items (mucosal translucency, vascularity, granularity, fibrin deposition, and stool consistency) on a four-point scale (0-3) [4, 13]. Briefly, mice were anesthetized with 2% isoflurane in 2 L/min of oxygen during colonoscopy. Mice were laid on the workplace and the colon was rinsed with water by 2 mL pipettes to clean it from remaining stool. Colonoscopy was executed and recorded with a high-resolution video endoscopic system (Karl Storz, Tuttlingen, Germany).
Contrast-enhanced µCT Imaging
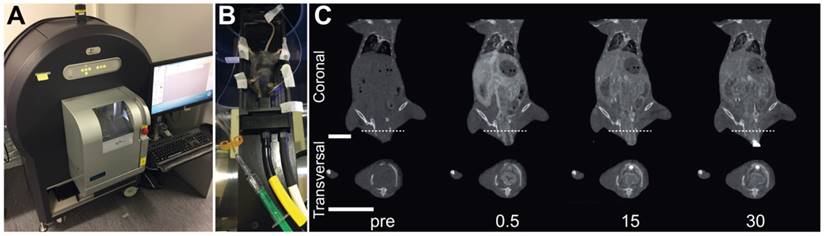
µCT imaging was performed directly after colonoscopy on days 0, 5 and 9 in acute colitis or before cell injection and weekly for chronic colitis. All imaging studies were performed on a dedicated small animal µCT system (Quantum FX, PerkinElmer, Waltham, MA, USA) (Figure 1A). For image acquisition, configurations were kept constant (parameter: 90 kV, 160 μA, FOV: 60 mm, scan time: 17 s, image size: 512x512, layer thickness: 118 µm). Mice were anesthetized with isoflurane and fixated on a stage (Figure 1B). For intravenous bolus injection of the contrast agent, a custom-made injection device was used. The device consisted of the tip of a 26 G needle (Sterican® Insulin needle, B. Braun, Melsungen, Germany) inserted into a plastic tubing system (length: 48 cm, inner diameter: 0.58 mm, Portex®, Smiths Medical, Grasbrunn, Germany) and connected to a luer-lock connector (25 G Venofix®, B. Braun, Melsungen, Germany) [14]. This injection device was pre-filled with 140 µl water or saline to avoid air bubbles in the tubing system. One native image before injection of the contrast agent was captured for every mouse. Directly after this, 0.3 mL of Iomeprol 300 mg/mL (Imeron®, Bracco, Italy) were injected over 20-30 s [14-18]. Images were acquired before and 0.5, 2, 4, 6, 10, 15, 20, 25 and 30 min after injection of contrast agents (Figure 1C). In total, n = 870 volume stacks were acquired; n = 87 of them were used for analysis of the murine wall thickness.
Experimental setup for imaging experiments. (A): All imaging studies were performed on a dedicated small animal µCT system. (B): During image acquisitions, the anesthetized mouse was fixated on a stage in supine position. (C): Representative µCT images before and 0.5, 15 and 30 min after intravenous injection of iodine contrast agent. Upper row shows coronal and lower row shows transversal imaging plane, the line indicates the section plane, bars indicate 10 mm.
µCT Image Analysis
All images were analyzed using OsiriX software (OsiriX Lite v.8.5.2, Pixmeo, Bernex, Switzerland). To measure murine wall thickness, the image acquired 0.5 min after contrast agent injection was used. The image was viewed in 3D multiplanar reformatting (3D MPR) mode to examine all planes simultaneously. Murine wall thickness was measured in transverse plane at 3 mm distance from the anus. To make sure that the murine wall was displayed in right angle, coronal and sagittal plane were adjusted orthogonally and the distance of 3 mm was again measured in coronal plane. The mean wall thickness including the surrounding contrast enhanced tissues was measured at four locations (12, 3, 6 and 9 o'clock) and the mean value was used for analysis. The murine intestinal wall and surrounding contrast enhanced tissues were included in measurements [19]. In n = 11 (12.6%) volume stacks, measurement could not be conducted, because of colonic contractions, these were excluded from the final measurements. Finally, image reconstructions for figures were generated with Amira software (Version 6.0.3, Thermo Fisher Scientific, Hillsboro, OR, USA). To analyze changes over time as a measurement of the perfusion of the colon and the renal medulla, the density was measured on a transverse plane in a representative region of interest (ROI). This was done in every scan at all time points at the same location. For the colon, the ROI was located at 3 mm distance from the anus; this distance was measured on a parallel screen in coronal plane. The medium intensity values of the ROIs were measured and plotted in a graph against time. For the renal medulla, the ROI was located in coronal plane at the kidney's largest diameter at the same location at all time points. Medium intensity values were measured and plotted in a graph against time.
Ex Vivo Analysis
After the imaging procedures on day 9 (acute colitis) or in week 6 (chronic colitis), all mice were sacrificed and the colon was collected for ex vivo analysis. Inflammation of the acute colonic tissue samples was graded histopathologically on hematoxylin/eosin (H&E) staining by a two item score (degree of inflammatory cell infiltrations and tissue damage, each on a four-point scale, resulting in a score from 0 to 6) [20]. Specimens for chronic colitis were examined histopathologically and scored from 0 to 5 as described previously [21].
Statistical Analysis
Values are given as means with standard deviations. All statistical analysis was carried out using GraphPad Prism (Prism 6.05, GraphPad, La Jolla, CA, USA). Statistical tests were performed as Pearson's correlation coefficient (r) or ANOVA using Sidak's multiple comparison tests. A p < 0.05 was considered as statistically significant and indicated as following: p < 0.05(*), p < 0.01(**), p < 0.001(***), p < 0.0001(****).
Results
Establishment of experimental acute colitis
In mice treated with both, 2% and 3% DSS, weight decreased from day 0 to day 9 and also in comparison to control mice (Figure 2A).
Assessment of acute chemically-induced colitis. (A): Weight development during the course of DSS. In acute 2% DSS colitis (*) weight decreased from day 0 to day 9 (92 ± 3.2%, p < 0.0001) and in comparison to control mice (102.8% ± 0.8%, p < 0.0001). In 3% DSS colitis (x) weight decreased from day 0 to day 9 (98% ± 1.5% at day 9, p = 0.0026) and compared to control group (102.8% ± 0.8%, p = 0.0009). (B): Endoscopic score in acute DSS colitis and control animals. Endoscopic score showed an increase in both DSS colitis groups at day 9 (2%: 4.2 ± 3.8, p = 0.028, 3%: 4.9 ± 2.6, p = 0.005) compared to day 0 (0.2 ± 0.4; 0.7 ± 1.1). (C): Histological score in acute 2% and 3% DSS colitis compared to control. Scoring in 2% DSS mice was significantly increased (5.0 ± 1.23, p = 0.0085) in comparison to control mice (1.00 ± 1.00) (D): Representative endoscopic images of days 0, 5 and 9 and representative H&E stainings from day 9. White arrows indicate fibrin exudates as markers of intestinal inflammation, red arrow indicated loss of epithelial integrity in highly inflamed tissues, and black arrows indicate immune cell infiltrates. For all graphs (A-C) n = 3 (control), n = 5 (acute colitis 2% DSS), n = 7 (acute colitis 3% DSS). Bar indicates 100 µm.
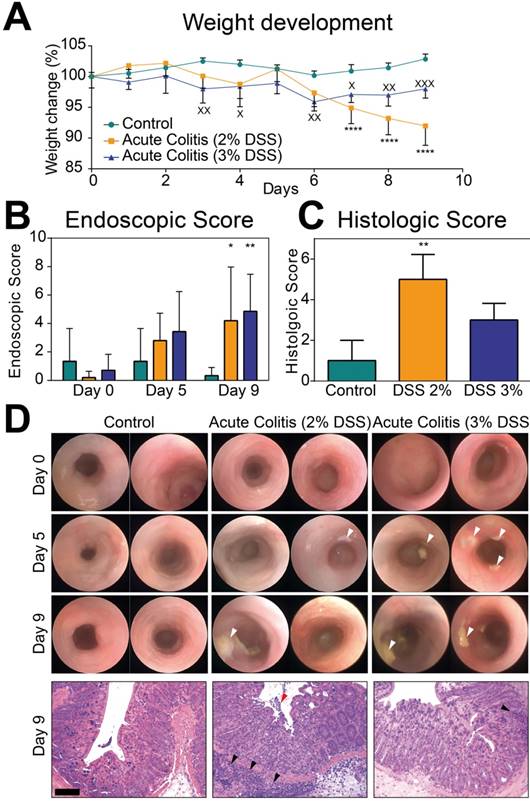
Endoscopic examinations showed an increase in the endoscopic score in both DSS colitis groups at day 9 compared to day 0. Non-treated control mice showed no inflammation at day 9 compared to day 0 (Figure 2B). Ex vivo histologic assessment of the colon showed inflammation in both DSS groups with a significantly increased inflammation score in 2% DSS mice in comparison to control mice. In the 3% DSS group, histologic scoring of inflammation failed significance (Figure 2C). Representative endoscopic and histologic images are given in Figure 2D.
Contrast-enhanced µCT imaging of intestinal wall thickness in acute colitis
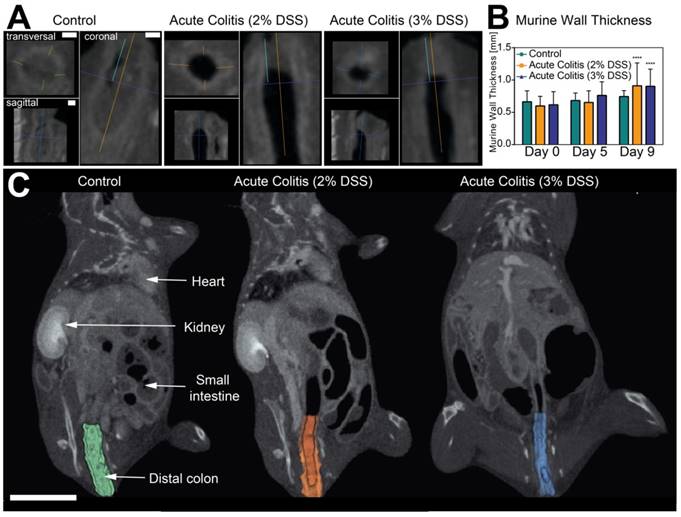
After intra-venous injection of the contrast agent, murine intestinal walls were easily assessable for image analysis (Figure 3A). Best visual contrast was given in the µCT-image acquired after 0.5 min. A significant increase in murine intestinal wall thickness was seen at day 9 in both colitis groups compared to day 0. A non-significant trend for increased murine intestinal wall thickness was already seen at day 5. There was no difference between both colitis groups and control at day 5 or 9 (Figure 3B+C).
Assessment of murine intestinal wall thickness in acute colitis. (A): Measurement of intestinal wall thickness in control (left), 2% acute DSS colitis (center) and 3% DSS (right) at day 9. Bars indicate 1 mm. (B): Intestinal wall thickness in acute DSS colitis and control animals. Measurements showed a significant increase in murine intestinal wall thickness in both colitis groups at day 9 (2%: 0.91 mm ± 0.35 mm, p < 0.0001; 3%: 0.90 mm ± 0.27 mm, p < 0.0001) compared to day 0 (0.60 mm ± 0.15 mm; 0.62 mm ± 0.20 mm). A non-significant trend for increased murine intestinal wall thickness was seen at day 5 (0.65 mm ± 0.18 mm, p = 0.082; 0.76 mm ± 0.21 mm, p = 0.08). No difference was found between both colitis groups and control group at day 5 (2%: p = 0.98: 3%: p = 0.78) or day 9 (2%: p = 0.12; 3%: p = 0.12), n = 3 (control), n = 5 (acute colitis 2% DSS), n = 7 (acute 3% DSS colitis. (C): Segmentation of the colon visualizes changes in thickness of the intestinal wall between control and colitis groups. Bar indicates 10 mm.
Contrast-enhanced µCT perfusion imaging of acute colitis
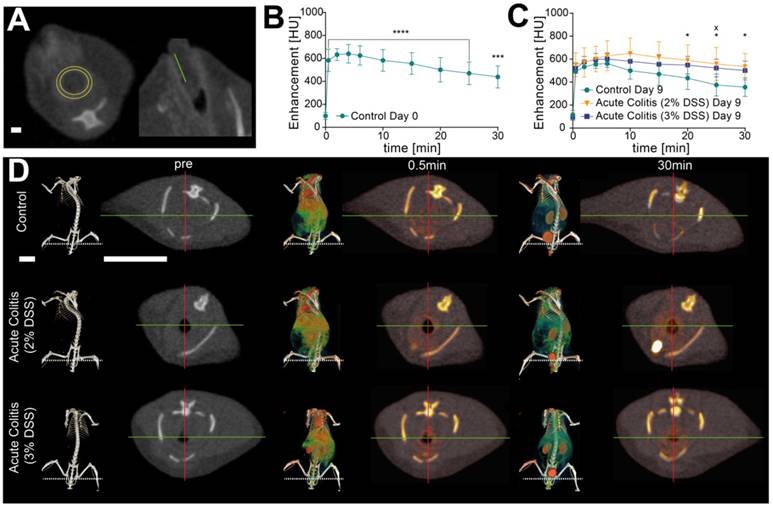
To detect potential differences in perfusion as a sign of vascular leakage between colitis and control groups, signal intensities of murine intestinal wall contrast enhancement were measured over time (Figure 4A). In all animals, a significant signal increase was visualized after injection of the contrast agent at all measured time points (Figure 4B). Perfusion values peaked between 4 and 6(-10) min after injection in colitis and control groups equally at days 0, 5 and 9 (Figure 4C). Signal intensity values for days 0 and 9 are given in Table 1. At day 9, a significant remaining contrast enhancement in the colon could be observed in 2% DSS after 20 min until 30 min and in 3% DSS after 25 min (Figure 4D, Table 1). Simultaneously, there were increased signal intensities in the renal medulla 10 to 30 min after injection in DSS treated animals (Table 2).
Assessment of contrast-enhanced µCT perfusion in acute colitis. (A): Measurement of 3 mm distance to the anus (right), Positioning of ROI for perfusion analysis (left). Bar indicates 1 mm. (B): Perfusion measurement pre- and post-injection in control mice at day 0. A significant signal increase was visualized after injection of the contrast agent at all time points (p < 0.0001 for 0.5 min to 25 min, p = 0.0004 for 30 min after injection) each compared to t = 0 min (n = 3). (C): Perfusion analysis in diseased 2% DSS (*, n = 5) and 3% DSS (x, n = 7) mice compared to control mice (n = 3). Signal intensity values are given in Table 1. Significant remaining contrast enhancement in 2% DSS after 20 min until 30 min (p = 0.048, p = 0.018) and in 3% DSS after 25 min (p = 0.047) (D): 3D visualization and transversal sections of signal intensities before, 0.5 and 30 min post injection in control and acute colitis mice. Cardiovascular system is enhanced after 0.5 min; after 30 min signal intensities dominate in the urinary tract. Native CT 2D: -700/2400 (grayscale)), contrast signal 2D: 200/2000 (white/red), Native CT 3D: 400/800 (grayscale, contrast signal -50/800 (green/red). Bars indicate 10 mm.
Perfusion analysis in acute colitis
| Time | 0 | 0.5 | 2 | 4 | 6 | 10 | 15 | 20 | 25 | 30 | |
|---|---|---|---|---|---|---|---|---|---|---|---|
| Day 0 | Control | 100±30 | 583±97 | 633±51 | 640±81 | 626±84 | 583±94 | 555±94 | 501±106 | 471±99 | 438±97 |
| Acute colitis (2% DSS) | 63±43 (0.8395) | 491±180 (0.3398) | 504±125 (0.1224) | 543±119 (0.2954) | 548±84 (0.4625) | 548±80 (0.8581) | 495±89 (0.6230) | 468±108 (0.8637) | 424±124 (0.7576) | 406±120 (0.8711) | |
| Acute colitis (3% DSS) | 108±56 (0.9900) | 456±73 (0.1052) | 508±74 (0.1098) | 531±84 (0.1865) | 532±83 (0.2868) | 525±74 (0.6231) | 498±62 (0.6192) | 459±68 (0.7738) | 424±65 (0.7295) | 402±67 (0.8304) | |
| Day 9 | Control | 113±41 | 493±15 | 533±14 | 557±38 | 562±34 | 500±73 | 470±99 | 434±98 | 375±96 | 356±81 |
| Acute colitis (2% DSS) | 104±32 (0.9986) | 553±103 (0.7205) | 572±126 (0.9014) | 601±111 (0.8672) | 631±130 (0.6338) | 650±135 (0.0606) | 615±137 (0.0728) | 591±134 (0.0475) | 558±144 (0.0155) | 536±115 (0.0176) | |
| Acute colitis (3% DSS) | 98±28 (0.9918) | 520±44 (0.9579) | 576±48 (0.8529) | 596±55 (0.8903) | 602±53 (0.8799) | 581±71 (0.4495) | 556±82 (0.4022) | 549±77 (0.1729) | 523±78 (0.0472) | 501±82 (0.0533) |
Medium values (± SD) of signal intensity measurements of the colon in acute colitis and control mice at days 0 and 9 of experiment for all time points. All data are given in Hounsfield Units (HU); p-values are stated for the DSS groups in comparison to control group for each time point. Significant results are highlighted in bold.
Perfusion analysis in acute colitis
| Time | 0 | 0.5 | 2 | 4 | 6 | 10 | 15 | 20 | 25 | 30 |
|---|---|---|---|---|---|---|---|---|---|---|
| Control | 67±20 | 1234±111 | 1233±99 | 1342±89 | 1392±114 | 1196±360 | 990±323 | 835±115 | 770±70 | 721±43 |
| Acute colitis (2% DSS) | 84±22 (0.9925) | 1254±90 (0.9896) | 1257±77 (0.9853) | 1330±63 (0.9962) | 1408±94 (0.9929) | 1486±125 (0.1225) | 1385±236 (0.0238) | 1147±329 (0.0897) | 1145±280 (0.0333) | 1113±347 (0.0249) |
| Acute colitis (3% DSS) | 66±29 (>0.9999) | 1336±139 (0.7370) | 1352±150 (0.6607) | 1354±162 (0.9960) | 1345±228 (0.9359) | 1315±313 (0.6622) | 1222±325 (0.2163) | 1061±329 (0.2357) | 945±261 (0.4141) | 855±160 (0.5928) |
Medium values (± SD) signal intensity measurements of the renal medulla for acute colitis (both DSS groups) and control group at day 9. All data are given in HU; p-values are stated for the DSS groups in comparison to control group for each time point. Significant results are highlighted in bold.
Establishment of chronic colitis
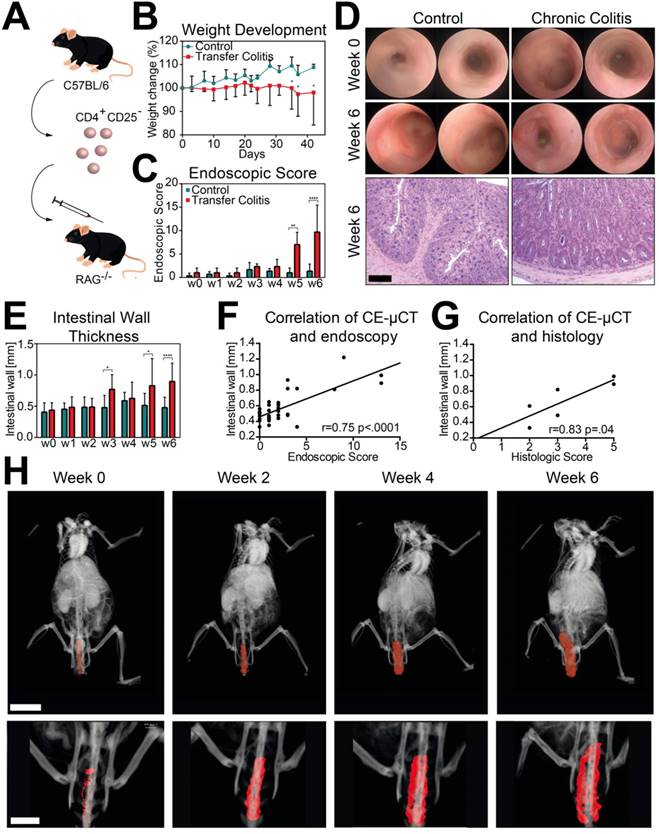
Chronic colitis was established using adoptive transfer of CD4+ CD25- T cells into Rag1-/- mice (Figure 5A). Weight development was steady in colitis mice, while weight in control mice increased during experiment. These changes were significant from week 5 until the end of the experiment at week 6 (Figure 5B). Repeated endoscopic examinations showed a significant increase in the endoscopic score at weeks 5 and 6 compared to control mice (Figure 5C), which was verified by histology at week 6 (Figure 5D).
Monitoring of chronic intestinal inflammation. (A): Establishment of chronic adoptive T cell transfer colitis using Intraperitoneal injection of CD4+ CD25- T cells into RAG1-/- recipient mice. (B): Weight development during course of chronic colitis. Weight development in transfer colitis mice (*) was steady (98.1% ± 13.9% at week 6) compared to increasing weight in control group (108.8% ± 1.4% at week 6). (C): Endoscopic score over 6 weeks of colitis. Endoscopic examinations showed a significantly increased score in colitis mice at weeks 5 and 6 (*, week 5: 7.0 ± 2.6, p = 0.0053; week 6: 9.7 ± 5.8, p < 0.0001) compared to control mice (week 0: 1.0 ± 1.0; week 6: 1.3 ± 1.5). (D): Representative endoscopic images of weeks 0 and 6 and H&E stainings from week 6 of colitis and control mice. Bar indicates 100 μm. (E): Measured intestinal wall thickness of colitis mice (*) in comparison to control mice. Values are shown in Table 3. (F): Correlation of murine intestinal wall thickness measured in CE-μCT and endoscopic score (r = 0.75, p < 0.0001). (G): Correlation of murine intestinal wall thickness measured in CE-µCT and histologic score (r = 0.83, p = 0.04). (H): 3-dimensional (upper row) and 2-dimensional (lower row) segmentation of a colon of a representative diseased mouse at weeks 0, 2, 4 and 6. Bars indicate 10 mm. For all graphs (B, C, E, F and G) n = 7 (transfer colitis) and n = 3 (control).
Monitoring of disease progression in chronic colitis
Visible contrast of the murine intestinal wall was best at 0.5 min post-injection (p.i.) and this time point was used for weekly measurements during the development of chronic colitis. A significant increase in intestinal wall thickness was measured at week 6 in colitis mice compared to week 0. In comparison to non-treated control animals, a significant increase in intestinal wall thickness was already observed in week 3 (Figure 5E). These trends were confirmed at weeks 5 and 6 (Table 3). A good correlation was found between CE-µCT and endoscopy and histology (Figures 5F+G). Representative images and segmentations of the distal colon are given in Figure 5H.
Intestinal wall thickness in chronic colitis
| week | 0 | 1 | 2 | 3 | 4 | 5 | 6 |
|---|---|---|---|---|---|---|---|
| Control | 0.41±0.15 | 0.45±0.1 | 0.49±0.16 | 0.48±0.19 | 0.59±0.14 | 0.51±0.19 | 0.48±0.17 |
| Chronic colitis | 0.44±0.12 (>0.9999) | 0.48±0.17 (>0.9999) | 0.49±0.14 (>0.9999) | 0.77±0.24 (0.03) | 0.63±0.26 (0.99) | 0.83±0.44 (0.01) | 0.9±0.3 (<0.0001) |
Medium values (± SD) of murine wall thickness measurements of the colon in control and chronic colitis mice over 6 weeks of experiment. All data are given in mm; p-values are stated for colitis group in comparison to control group for each week. Significant results are highlighted in bold.
As established before, signal intensities were measured over time. A significant increase in signal intensities p.i. was measured in all mice at all time points compared to native µCT-images. Values peaked between 4 and 6 min equally in control and colitis group during 6 weeks of experiment. After 30 min a significant late enhancement in colitis group in comparison to control mice, as detected in acute colitis experiment could not be confirmed. Medium values for all time points are presented in Table 4.
Perfusion analysis in chronic colitis
| Time | 0 | 0.5 | 2 | 4 | 6 | 10 | 15 | 20 | 25 | 30 |
|---|---|---|---|---|---|---|---|---|---|---|
| Control | 84±38 | 473± 95 | 530± 78 | 550± 59 | 541± 70 | 496±26 | 441± 36 | 413± 23 | 386± 19 | 372± 40 |
| Chronic Colitis | 119± 17 (0.9997) | 609± 162 (0.2264) | 629± 129 (0.6501) | 606±108 (0.9860) | 589± 62 (0.9959) | 549±62 (0.9893) | 502±57 (0.9711) | 477± 33 (0.9642) | 461±51 (0.9047) | 455± 62 (0.8299) |
Medium values (± SD) of signal intensity measurements of the colon for chronic colitis and control mice at week 6 of experiment. All data are given in HU; p-values are stated for colitis group in comparison to control group for each time point.
Discussion
Within this study, we developed a simple and fast method to use CE-µCT for the assessment of experimental intestinal inflammation. In two different models of murine colitis, i.e. acute chemically-induced (DSS) and chronic adoptive T cell transfer colitis, we demonstrate the feasibility and application to measure intestinal wall thickness and intestinal perfusion in mice. Our µ-tomographic measurements reflected endoscopic and histological findings, as well as indirect signs of inflammation, such as weight loss. Acute DSS and chronic T cell transfer colitis are useful models to imitate chronic inflammatory bowel diseases for experimental investigation. However, different mice and genotypes may react differently to DSS exposure [11]. In our experiments, dosage of 3% DSS did not result in higher weight loss and higher histological scores compared to 2% DSS; higher dosage did nonetheless lead to higher or similar results concerning endoscopic score and murine intestinal wall thickness.
Previous studies have already investigated the murine wall thickness in µCT and MR imaging as a way to predict colitis through in vivo imaging. These studies showed promising results, however, the necessity of feasting and double contrast procedures [8] as well as long scan times [22, 23] complicated the imaging protocols. According to our results, only one image 0.5 min after bolus injection of 0.3 mL of iodine contrast agent is necessary to assess and monitor intestinal inflammation in mice. Further, image reconstruction allows 3-dimensional illustration of the inflamed colon. Using a scan time of only 17 s, the proposed protocol is quick, effective and simple and can most likely be conducted with any small animal µCT system that provides high quality, fine layer thickness and provides - as proposed in our protocol - the possibility to perform inhalational anesthesia. However, short scan times as exercised in our protocol are recommended to avoid imprecise images due to peristaltic motion. In pre-experiments, CT scans of higher quality that need scan times of 2 and 4.5 min were unfeasible for murine intestinal wall analysis.
For the first time, we also evaluated changes of intestinal wall contrast enhancement over time as a surrogate for intestinal perfusion. These measurements revealed significant differences in inflamed colon walls after 20-30 min compared to healthy controls. This might indicate changes in the vascular structure, such as increased vessel density and increased vascular permeability [24]. Interestingly, we could not reproduce these findings in chronic adoptive transfer colitis, which might display the different pathophysiological features of acute and chronic colitis [25].
These changes might also be attributed to other pathophysiological factors, such as renal perfusion. Our CE-µCT imaging approach was also able to visualize a significant hyperenhancement of the intestinal walls in acute colitis 10-30 min p.i. compared to control mice. However, if impaired kidney function or dehydration due to intestinal fluid loss in colitis contribute to these effects, needs to be elucidated in future studies. In clinical settings, dosages of 32-45 g of iodine are used to obtain sufficient contrast enhancement [26, 27]. This equals a dosage of about 500 mg/kg body weight. In our approaches, 0.3 mL of injected contrast agent resulted in a dosage of approximately 3600 mg/kg mouse. Injection of iodine contrast agent was well tolerated by the mice in longitudinal imaging protocols and resulted in sufficient contrast enhancement to analyze murine intestinal walls. However, some mice suffered from sporadic gross hematuria, but still recovered quickly after imaging. Higher dosages would, thus, most likely result in kidney impairment and are not advisable.
While standard endoscopic techniques are restricted to the visualization of the inner mucosal layer, tomographic imaging can also access transmural inflammation. In chronic colitis, inflammation was already measured from week 3 onwards. Comparatively, endoscopy only allowed the detection of mucosal inflammation at weeks 5 and 6. Hence, we might assume that for monitoring early disease progression, intestinal wall thickness measured by CE-µCT is a more sensitive marker compared to standard endoscopy.
In contrast to other imaging modalities, ionizing radiation might raise concerns about potential harm to experimental subjects and altered experimental outcome by radiation. Depending on the dosage, µCT-induced radiation has been reported to induce side effects on various organs. Among these, direct effects on the intestinal epithelium [28] and hematopoietic stem cells [29] are most critical for studies on mucosal immunology. However, a risk for these side effects seems to be avoided when applying a cumulative dose of 194.3 mGy during a 4-week scanning period [28] or even a radiation dose of 434 mGy per scan in 3 consecutive scans [29]. Also, Fredin et al. [22] could not find any significant difference between single and multiple imaging in mice. Modern µCT imaging systems produce radiation doses of around 10 mGy in the center of the subject during a 17 s scan [30]. To evaluate acute or chronic colitis in experimental models, imaging according to the proposed protocol is sufficient for at least ten consecutive scans at different time points to not reach the 5% limit of the critical cumulative dose (1-2 Gy) [30]. Goldman reports that higher radiation doses can improve image quality by reducing image noise, however, other parameters such as kilovolt peaks, amperages, slice thicknesses, and reconstruction filters are equally important for good image quality [31]. Improved image quality at increased radiation doses has to be balanced against the need for sequential imaging without exceeding tolerable cumulative doses.
To further save the necessity of intravenous injections, phase contrast imaging might provide high contrast visualization of soft tissue. However, this technology is still experimental and can only be performed on special CT systems. Zeller-Plumhoff et al. recently reported ex vivo phase contrast radiation computed tomography of the mouse soleus muscle with scanning times of 6 min [32]. Preissner et al. required synchronized image acquisition with the ventilator to perform high resolution propagation-based imaging for in vivo dynamic computed tomography of lungs in small animals [33]. Even with the use of butylscopolamin, scanning times and the need for synchronization limit its application to the murine intestinal tract imaging. In its current state, phase contrast imaging is an interesting technique but might only be used to analyze murine intestinal inflammation ex vivo.
Conclusion
While the sophisticated perfusion protocol might remain restricted to specific scientific questions, the assessment of murine intestinal wall thickness is a quick and easily accessible parameter for intestinal inflammatory activity and disease progression. According to our results, a single scan at 0.5 min after bolus injection of 0.3 mL of iodine contrast agent is sufficient for a three-dimensional quantitative assessment and monitoring of inflammation in the whole intestinal tract in mice and correlates well with endoscopic and histologic degree of inflammation especially in chronic inflammation.
Abbreviations
µCT: micro computed tomography; 3D-MPR: 3D multiplanar reformatting; CD: crohn's disease; CE-µCT: contrast-enhanced micro computed tomogramphy; DSS: dextran sodium sulfate; H&E: hematoxylin/eosin; IBD: inflammatory bowel disease; MRI: magnetic resonance imaging; MSOT: multispectral optoacustic tomography; p.i.: post-injection; PET: positron emission tomography; ROI: region of interest; UC: ulcerative colitis; US: ultrasound
Acknowledgements
The present work was performed in fulfillment of the requirements for obtaining the degree “Dr. med.”
We thank Daniel Bess for excellent technical assistance during the experiments.
Funding
This work was supported by the Integrated Research Training Group of the Collaborative Research Center 1181 “Checkpoints for resolution of inflammation”, Friedrich-Alexander-University Erlangen-Nuremberg, Germany to DJ; Erlangen Graduate School in Advanced Optical Technologies (SAOT) by the German Research Foundation (DFG) in the framework of the German excellence initiative and funding by the German Research Foundation (DFG) within the Klinische Forschergruppe 257 (KFO 257), Forschergruppe 2438 (FOR 2438) and the Collaborative Research Center 241 (Transregio 241) “Immune-Epithelial Communication in Inflammatory Bowel Diseases” to OMT , MJW and MFN; the Emerging Fields Initiative of the Friedrich-Alexander-Universität Erlangen-Nürnberg and the German Research Foundation (DFG) within Collaborative Research Center 1181 “Checkpoints for resolution of inflammation” to MFN.
Competing Interests
The authors have declared that no competing interest exists.
References
1. Molodecky NA, Soon IS, Rabi DM, Ghali WA, Ferris M, Chernoff G. et al. Increasing incidence and prevalence of the inflammatory bowel diseases with time, based on systematic review. Gastroenterology. 2012;142:46-54 e42; quiz e30
2. AE MK. Inflammatory bowel disease: an expanding global health problem. Clinical Medicine Insights: Gastroenterology. 2013;6:33-47
3. Wirtz S, Neurath MF. Mouse models of inflammatory bowel disease. Adv Drug Deliv Rev. 2007;59:1073-83
4. Becker C, Fantini MC, Neurath MF. High resolution colonoscopy in live mice. Nat Protoc. 2006;1:2900-4
5. Bruckner M, Lenz P, Mucke MM, Gohar F, Willeke P, Domagk D. et al. Diagnostic imaging advances in murine models of colitis. World J Gastroenterol. 2016;22:996-1007
6. Deshpande N, Lutz AM, Ren Y, Foygel K, Tian L, Schneider M. et al. Quantification and monitoring of inflammation in murine inflammatory bowel disease with targeted contrast-enhanced US. Radiology. 2012;262:172-80
7. Bhutiani N, Grizzle WE, Galandiuk S, Otali D, Dryden GW, Egilmez NK. et al. Noninvasive Imaging of Colitis Using Multispectral Optoacoustic Tomography. J Nucl Med. 2017;58:1009-12
8. Boll H, Bag S, Nolte IS, Wilhelm T, Kramer M, Groden C. et al. Double-contrast micro-CT colonoscopy in live mice. Int J Colorectal Dis. 2011;26:721-7
9. A. Larsson SM, E. Rehnström. Magnetic Resonance Imaging of Experimental Mouse Colitis and Association with Inflammatory Activity. Inflammatory bowel diseases. 2006;12:478-85
10. Brewer S, McPherson M, Fujiwara D, Turovskaya O, Ziring D, Chen L. et al. Molecular imaging of murine intestinal inflammation with 2-deoxy-2-[18F]fluoro-D-glucose and positron emission tomography. Gastroenterology. 2008;135:744-55
11. Waldner MJ, Neurath MF. Chemically induced mouse models of colitis. Curr Protoc Pharmacol. 2009 Chapter 5: Unit 5 55
12. Powrie F, Leach MW, Mauze S, Menon S, Caddle LB, Coffman RL. Inhibition of Th1 responses prevents inflammatory bowel disease in scid mice reconstituted with CD45RBhi CD4+ T cells. Immunity. 1994;1:553-62
13. Wirtz S, Billmeier U, McHedlidze T, Blumberg RS, Neurath MF. Interleukin-35 mediates mucosal immune responses that protect against T-cell-dependent colitis. Gastroenterology. 2011;141:1875-86
14. Schambach SJ, Bag S, Groden C, Schilling L, Brockmann MA. Vascular imaging in small rodents using micro-CT. Methods. 2010;50:26-35
15. Kiessling F, Greschus S, Lichy MP, Bock M, Fink C, Vosseler S. et al. Volumetric computed tomography (VCT): a new technology for noninvasive, high-resolution monitoring of tumor angiogenesis. Nat Med. 2004;10:1133-8
16. Kirschner S, Felix MC, Hartmann L, Bierbaum M, Maros ME, Kerl HU. et al. In vivo micro-CT imaging of untreated and irradiated orthotopic glioblastoma xenografts in mice: capabilities, limitations and a comparison with bioluminescence imaging. J Neurooncol. 2015;122:245-54
17. Pandit P, Johnston SM, Qi Y, Story J, Nelson R, Johnson GA. The utility of micro-CT and MRI in the assessment of longitudinal growth of liver metastases in a preclinical model of colon carcinoma. Acad Radiol. 2013;20:430-9
18. Schambach SJ, Bag S, Schilling L, Groden C, Brockmann MA. Application of micro-CT in small animal imaging. Methods. 2010;50:2-13
19. Carbo AI, Reddy T, Gates T, Vesa T, Thomas J, Gonzalez E. The most characteristic lesions and radiologic signs of Crohn disease of the small bowel: air enteroclysis, MDCT, endoscopy, and pathology. Abdom Imaging. 2014;39:215-34
20. Mudter J, Amoussina L, Schenk M, Yu J, Brustle A, Weigmann B. et al. The transcription factor IFN regulatory factor-4 controls experimental colitis in mice via T cell-derived IL-6. J Clin Invest. 2008;118:2415-26
21. Asseman C, Mauze S, Leach MW, Coffman RL, Powrie F. An essential role for interleukin 10 in the function of regulatory T cells that inhibit intestinal inflammation. J Exp Med. 1999;190:995-1004
22. Fredin MF, Hultin L, Hyberg G, Rehnstrom E, Hultgren Hornquist E, Melgar S. et al. Predicting and monitoring colitis development in mice by micro-computed tomography. Inflamm Bowel Dis. 2008;14:491-9
23. Bianchi A, Bluhmki T, Schonberger T, Kaaru E, Beltzer A, Raymond E. et al. Noninvasive Longitudinal Study of a Magnetic Resonance Imaging Biomarker for the Quantification of Colon Inflammation in a Mouse Model of Colitis. Inflamm Bowel Dis. 2016;22:1286-95
24. Haep L, Britzen-Laurent N, Weber TG, Naschberger E, Schaefer A, Kremmer E. et al. Interferon Gamma Counteracts the Angiogenic Switch and Induces Vascular Permeability in Dextran Sulfate Sodium Colitis in Mice. Inflamm Bowel Dis. 2015;21:2360-71
25. Machtaler S, Knieling F, Luong R, Tian L, Willmann JK. Assessment of Inflammation in an Acute on Chronic Model of Inflammatory Bowel Disease with Ultrasound Molecular Imaging. Theranostics. 2015;5:1175-86
26. Fuentes-Orrego JM PD, Kulkarni NM, Agrawal M, Ghoshhjara BB, Sahani DV. New and Evolving Concepts in CT for Abdominal Vascular Imaging. Radio Graphics. 2014;34:1363-84
27. Pinho DF, Kulkarni NM, Krishnaraj A, Kalva SP, Sahani DV. Initial experience with single-source dual-energy CT abdominal angiography and comparison with single-energy CT angiography: image quality, enhancement, diagnosis and radiation dose. Eur Radiol. 2013;23:351-9
28. Miyahara N, Kokubo T, Hara Y, Yamada A, Koike T, Arai Y. Evaluation of X-ray doses and their corresponding biological effects on experimental animals in cone-beam micro-CT scans (R-mCT2). Radiol Phys Technol. 2016;9:60-8
29. Laperre K, Depypere M, van Gastel N, Torrekens S, Moermans K, Bogaerts R. et al. Development of micro-CT protocols for in vivo follow-up of mouse bone architecture without major radiation side effects. Bone. 2011;49:613-22
30. Product note Quantum FX µCT, PerkinElmer, Waltham, MA, USA.
31. Goldman LW. Principles of CT: radiation dose and image quality. J Nucl Med Technol. 2007;35:213-25 quiz 26-8
32. Zeller-Plumhoff B, Roose T, Katsamenis OL, Mavrogordato MN, Torrens C, Schneider P. et al. Phase contrast synchrotron radiation computed tomography of muscle spindles in the mouse soleus muscle. J Anat. 2017;230:859-65
33. Preissner M, Murrie RP, Pinar I, Werdiger F, Carnibella RP, Zosky GR. et al. High resolution propagation-based imaging system for in vivo dynamic computed tomography of lungs in small animals. Phys Med Biol. 2018;63:08NT3
Author contact
![]() Corresponding authors: Ferdinand Knieling, MD, Department of Pediatrics and Adolescent Medicine, Friedrich-Alexander-University Erlangen-Nuremberg, Germany, Loschgestraße 15, 91054 Erlangen, Germany. Phone: +49 9131 85-33118; Email: Ferdinand.Knielingde and Maximilian Waldner, MD, Department of Medicine 1, Friedrich-Alexander-University Erlangen-Nuremberg, Germany, Ulmenweg 18, 91054 Erlangen, Germany. Phone: +49 9131 85-35204; Email: Maximilian.Waldnerde
Corresponding authors: Ferdinand Knieling, MD, Department of Pediatrics and Adolescent Medicine, Friedrich-Alexander-University Erlangen-Nuremberg, Germany, Loschgestraße 15, 91054 Erlangen, Germany. Phone: +49 9131 85-33118; Email: Ferdinand.Knielingde and Maximilian Waldner, MD, Department of Medicine 1, Friedrich-Alexander-University Erlangen-Nuremberg, Germany, Ulmenweg 18, 91054 Erlangen, Germany. Phone: +49 9131 85-35204; Email: Maximilian.Waldnerde