Theranostics
13.3
Impact Factor
- Current Issue
- Advance Articles
- Volume 16; 2026
- Volume 15; 2025
- Volume 14; 2024
- Volume 13; 2023
- Volume 12; 2022
- Archive
- Cover Images
- Cover Suggestion
- Special Issues
Top
Introduction
Results and Discussion
Conclusions
Methods
Abbreviations
Supplementary Material
Acknowledgements
References
Introduction
Results and Discussion
Conclusions
Methods
Abbreviations
Supplementary Material
Acknowledgements
References
International Journal of Biological Sciences
International Journal of Medical Sciences
 Global reach, higher impact

Theranostics 2019; 9(1):20-33. doi:10.7150/thno.28857 This issue Cite
Research Paper
Self-Luminescing Theranostic Nanoreactors with Intraparticle Relayed Energy Transfer for Tumor Microenvironment Activated Imaging and Photodynamic Therapy
Ming Wu1,4, Lingjie Wu1,4, Jiong Li1,3,4, Da Zhang1,4, Shanyou Lan1,2,4, Xiaolong Zhang1,4, Xinyi Lin1,4, Gang Liu5, Xiaolong Liu1,3,4 ![]() , Jingfeng Liu1,2,3,4
, Jingfeng Liu1,2,3,4 ![]()
1. The United Innovation of Mengchao Hepatobiliary Technology Key Laboratory of Fujian Province, Mengchao Hepatobiliary Hospital of Fujian Medical University, Fuzhou 350025, P.R. China
2. Liver Disease Center, The First Affiliated Hospital of Fujian Medical University, Fuzhou 350005, P. R. China
3. Key Laboratory of Design and Assembly of Functional Nanostructures, Fujian Institute of Research on the Structure of Matter, Chinese Academy of Sciences, Fuzhou 350002, P.R. China.
4. The Liver Center of Fujian Province, Fujian Medical University, Fuzhou 350025, P.R. China
5. Center for Molecular Imaging and Translational Medicine, Xiamen University, Xiamen 361005, P. R. China
Received 2018-7-30; Accepted 2018-11-20; Published 2019-1-1
Citation:
Wu M, Wu L, Li J, Zhang D, Lan S, Zhang X, Lin X, Liu G, Liu X, Liu J. Self-Luminescing Theranostic Nanoreactors with Intraparticle Relayed Energy Transfer for Tumor Microenvironment Activated Imaging and Photodynamic Therapy. Theranostics 2019; 9(1):20-33. doi:10.7150/thno.28857. https://www.thno.org/v09p0020.htm
Other stylesAbstract

The low tissue penetration depth of external excitation light severely hinders the sensitivity of fluorescence imaging (FL) and the efficacy of photodynamic therapy (PDT) in vivo; thus, rational theranostic platforms that overcome the light penetration depth limit are urgently needed. To overcome this crucial problem, we designed a self-luminescing nanosystem (denoted POCL) with near-infrared (NIR) light emission and singlet oxygen (1O2) generation abilities utilizing an intraparticle relayed resonance energy transfer strategy.
Methods: Bis[3,4,6-trichloro-2-(pentyloxycarbonyl) phenyl] oxalate (CPPO) as a chemical energy source with high reactivity toward H2O2, poly[(9,9'-dioctyl-2,7-divinylene-fluorenylene)-alt-2-methoxy- 5-(2-ethyl-hexyloxy)-1,4-phenylene] (PFPV) as a highly efficient chemiluminescence converter, and tetraphenylporphyrin (TPP) as a photosensitizer with NIR emission and 1O2 generation abilities were coencapsulated by self-assembly with poly(ethyleneglycol)-co-poly(caprolactone) (PEG-PCL) and folate-PEG-cholesterol to form the POCL nanoreactor, with folate as the targeting group. A series of in vitro and in vivo analyses, including physical and chemical characterizations, tumor targeting ability, tumor microenvironment activated imaging and photodynamic therapy, as well as biosafety, were systematically investigated to characterize the POCL.
Results: The POCL displayed excellent NIR luminescence and 1O2 generation abilities in response to H2O2. Therefore, it could serve as a specific H2O2 probe to identify tumors through chemiluminescence imaging and as a chemiluminescence-driven PDT agent for inducing tumor cell apoptosis to inhibit tumor growth due to the abnormal overproduction of H2O2 in the tumor microenvironment. Moreover, the folate ligand on the POCL surface can further improve the accumulation at the tumor site via a receptor-mediated mechanism, thus enhancing tumor imaging and the therapeutic effects both in vitro and in vivo but without any observable systemic toxicity.
Conclusion: The nanosystem reported here might serve as a targeted, smart, precise, and noninvasive strategy triggered by the tumor microenvironment rather than by an outside light source for cancer NIR imaging and PDT treatment without limitations on penetration depth.
Keywords: self-luminescing theranostic nanoreactors, intraparticle relayed energy transfer, chemiluminescent imaging, PDT, H2O2
Introduction
Self-luminescence imaging, including bioluminescence (BL) and chemiluminescence (CL), is defined as the light emission resulting from a specific chemical reaction rather than from external excitation, which can avoid the autofluorescence interference that is often involved in photoluminescence (PL) to provide high image contrast in in vivo media [1,2]. BL is produced by an enzyme and a luminescent substrate, for example, the luciferase reporter system, which has been well exploited for tracking biological processes [3,4]. However, this imaging model is unsuitable for clinical diagnosis due to the high risk of transgenic manipulation of ectogenic enzymes and the accompanying luminescent substrate [5]. Although incorporating luciferase proteins into nanoparticles is a potential method to partially resolve these problems, these proteins also make luminescing systems more complicated [6]. Compared with BL, nonenzymatic CL of fluorescent dyes triggered by a chemical reaction, commonly between H2O2 and a high-energy compound (peroxyoxalate, luminol, Lucigenin, etc.), will be more convenient for H2O2 detection, as no genetic modification was required in this imaging model [1,7]. H2O2, as a main reactive oxygen species (ROS), plays a crucial role in physiological regulation. It is widely accepted that the abnormal overproduction of H2O2 is closely related to various diseases, such as cardiovascular disease [8], Alzheimer's disease [9], arthritis [10], cardiovascular disease [11], and cancer [12]. For example, H2O2 can induce some key alterations in cancer, including DNA variation, cell proliferation, apoptosis, invasion, metastasis, and angiogenesis [13]. The H2O2 concentration at the tumor site is reported to be 10-6 M, which is much higher than the normal conditions (10-7 M) [5,14]. However, most of the currently used molecular imaging probes, such as boronate-based fluorophores [15] and recombinant proteins [16], as well as sensitive nanosystems [17,18], are mainly applied in vitro rather than in vivo due to the extremely strong interference from autofluorescence of biological matrices in living animals under external excitation [15,19]. CL systems based on peroxalate esters and fluorescent dyes thus might be a promising alternative, which was first reported by Lee et al. for H2O2 imaging in vivo with high specificity and sensitivity [1].
In addition to disease diagnosis that is associated with H2O2 overproduction, the CL system also enables the use of photodynamic therapy (PDT) without an external light source, which can avoid the limitations associated with light penetration of PDT in deep lesions [3,4]. However, most of the present photosensitizers for PDT based on porphyrin, chlorin, or their derivatives are poorly soluble in aqueous solution, which makes them difficult to deliver into lesions [20]. More seriously, these photosensitizer molecules often suffer from the aggregation-caused quenching (ACQ) effect, leading to a decreased luminescence intensity and 1O2 generation [21,22]. Nanoparticle-formulated photosensitizing agents with proper dopant contents could be a good substitute to improve the photosensitizer's solubility and accumulation at tumor sites but with less ACQ effect. Additionally, aggregation-induced enhancement of photoluminescence is another popular approach to improve imaging contrast [21,23]. Recently, Liu et al. synthesized an aggregation-induced emission luminogen (AIEgen) that exhibits fluorescence emission and achieves 1O2 production when excited by the chemical reaction between peroxyoxalate and H2O2, which is successfully applied in cancer diagnosis and therapy in vivo [3]. Compared with small molecules, AIEgens or other dyes, semiconductor polymers (SPs) possess large extinction coefficients, good energy harvesting ability and photostability and have been developed as a versatile nanoplatform for CL imaging of ROS detection in living animals with high brightness and signal amplification [24,25]. After systematically investigating the chemiluminescence efficiency of SPs with different optoelectronic properties, Zhen et al. found that the energy level alignment between SPs and a high-energy intermediate, such as dioxetanedione, played a major role in determining the chemiluminescence intensity of SPs. Therefore, poly [(9,9'-dioctyl-2,7-divinylene-fluorenylene)-alt-2-methoxy-5-(2-ethyl-hexyloxy)-1,4-phenylene] (PFPV) with a minimized energy interval lower than that of dioxetanedione showed the highest CL intensity [26]. Even so, the short emission wavelength of PFPV (500-600 nm) hinders its further use for bioimaging in vivo, and the chemiexcited 1O2 generation is very low (also demonstrated in this work) [26]. Therefore, a chemiluminescence system based on SPs such as PFPV to achieve bright NIR emission and effective 1O2 generation might be preferable but still challenging for cancer imaging and treatment.
In this study, we developed a novel theranostic nanoreactor enabling targeted delivery, self-luminescence and effective 1O2 generation for cancer imaging and treatment (Scheme 1). To achieve this aim, bis[3,4,6-trichloro-2-(pentyloxycarbonyl) phenyl] oxalate (CPPO) as a chemical power source with high reactivity to H2O2, poly[(9,9'-dioctyl-2,7-divinylene- fluorenylene)-alt-2-methoxy-5-(2-ethyl-hexyloxy)-1,4-phenylene] (PFPV) as a highly efficient chemiluminescence converter, and tetraphenylporphyrin (TPP) as a photosensitizer with NIR emission and 1O2 stimulation abilities were coencapsulated by PEG-PCL/folate-PEG-cholesterol micelles, with folate as the targeting group of cancer cells to enhance nanoreactor accumulation at the tumor site. Upon utilization of intraparticle cascade energy transfer processes initiating from CPPO, relayed by PFPV, and finally received by TPP, the tumor has been successfully converted to a “light on” state and automatically destroyed by the generated 1O2. Therefore, the theranostic effect of our prepared nanoreactor (POCL) is triggered by H2O2 in the tumor microenvironment instead of by an outside light source, and this nanosystem might serve as a novel noninvasive strategy for cancer imaging and treatment.
Results and Discussion
In this work, we used the as-prepared PEG-PCL (the synthesis route and characterization are shown in Figure S1) as the main vehicle to encapsulate CPPO, PFPV and TPP. Compared with the commercially available amphiphilic copolymer (PEG-b-PPG-b-PEG), which is frequently applied as the shelter to endow chemiluminescent nanoreactors with good solubility and biocompatibility [2,3,5,21,26], PEG-PCL as a container provided a stronger chemiluminescence signal in the presence of H2O2 (Figure S2), which was ascribed to the more hydrophobic core assembled by the PCL segment in PEG-PCL to prevent the hydrolysis of CPPO in comparison with the core constructed by the PPG segment in PEG-b-PPG-b-PEG.
The key to chemiluminescence imaging and chemiexcited PDT is the choice of a suitable pair of a semiconductor polymer and a photosensitizer to establish an efficient energy-transfer system for NIR emission and ROS generation. Although poly[(9,9-dioctylfluorenyl-2,7-diyl)-co-(1,4-benzo-2,1′,3-thiadazole)] (PFBT) and TPP have been previously proven to be a good donor and accepter pair because of the complete overlay of the PFBT emission spectrum with the Q band absorbance of TPP [20], PFBT is not optimal as a chemiluminescent substrate since its highest occupied molecular orbital (HOMO) is quite far from the lowest unoccupied molecular orbital (LUMO) of 1,2-dioxetanedione (a high-energy intermediate in the reaction of CPPO and H2O2) in comparison with the HOMO of PFPV (Figure 1A), which limits its electron transfer to 1,2-dioxetanedione to trigger chemiluminescence [26,27]. Consequently, PFPV showed a significantly higher chemiluminescence signal than PFBT (Figure S3), which was also demonstrated in a previous report [26]. Another reason for our selection of PFPV is that its emission spectrum is very similar to that of PFBT in the range from 500-700 nm, which can also overlay with the Q band absorption of TPP to facilitate resonance energy transfer (Figure 1B). Next, we investigated the fluorescence spectroscopic changes by adjusting the TPP dopant ratio versus PFPV to verify the efficient energy transfer from PFPV to TPP. As shown in Figure 1C, the fluorescence from PFPV gradually decreased with the increase in the TPP doping content and was completely quenched at a TPP content of 20 wt%. In contrast, the TPP fluorescence reached saturation at 5 wt %, while only a slight increase or even a reduction was observed at higher doping contents above 10 wt %, which was ascribed to the formation of minor aggregates with aggregation-caused quenching (ACQ) side-effects. Therefore, we selected PFPV and TPP with a feeding ratio of 5 wt % for subsequent studies.
A theranostic nanoreactor (POCL) was prepared by coencapsulation of CPPO, PFPV and TPP in the PEG-PCL/folate-PEG-cholesterol matrix according to the nanoprecipitation method described previously [2]. The obtained POCL exhibited a spherical shape with a good diameter distribution of approximately 50 nm, as evidenced by transmission electron microscopy (TEM) (Figure 1D and S4). Dynamic light scattering (DLS) showed that POCL possessed an average hydrodynamic diameter of 115.4 nm, which is larger than that measured by TEM (Figure 1E) due to shrinkage during TEM observation. Furthermore, no significant aggregation or obvious size alteration was observed during storage in PBS with 10% fetal bovine serum (FBS) even for 10 days (Figure 1F), demonstrating the excellent colloid stability of POCL under physiological conditions. POCL showed a slightly positive potential of 1.23 mV (Figure S5), which is beneficial for contact with the negative cell membrane for cell endocytosis. To further verify the coencapsulation of CPPO, PFPV and TPP in POCL, UV-vis spectra were recorded. Accordingly, the characteristic absorption peaks of CPPO, PFPV and TPP were all present in POCL (Figure 1G). According to the absorption data of CPPO (3.487 L/g/cm at 290 nm), PFPV (82.72 L/g/cm at 466 nm) and TPP (3.244 L/g/cm at 586 nm), the loading contents of CPPO, PFPV and TPP were estimated to be 13.9%, 7.1% and 3.4%, respectively, suggesting that nearly all three of these components were encapsulated into POCL. To investigate the stability of CPPO in the POCL nanoreactor, the release profiles were measured under different buffer conditions at pH 7.4 (PBS, 10 mM, 37 °C) and 5.0 (acetate buffer, 10 mM, 37 °C), which were used to simulate the corresponding normal physiological environment and acidic cellular endosomes, respectively. As shown in Figure S6, the CPPO was released slowly at both pH values of 7.4 and 5.0, and the amount of CPPO released was only 10.9% and 8.6%, respectively, even after 48 h of incubation. These results indicate that CPPO molecules are tightly packed into the POCL, which can guarantee that the POCL plays a role after entering the cancer cells. To confirm the feasibility of POCL for H2O2 response, we measured the CL signals upon addition of H2O2 at various concentrations through the ChemiDocTM MP Imaging System (BIO-RAD). As shown in Figure 1H, the CL signal increased gradually with the increase of H2O2 concentration, and a linear dependence of the CL intensity vs. the H2O2 concentration (R2 = 0.998) ranging from 0 to 10 μM was observed, implying the potential of H2O2 response of our POCL in biological tissues. Next, to validate the CRET from PFPV to TPP, the CL spectra of POCL with various TPP dopant ratios vs. PFPV were recorded in the presence of excess H2O2 (1 M). The results are very similar to the fluorescence spectra (Figure 1I), and the CL color obviously tuned from green to red with 5 wt % TPP relative to PFPV and could even be observed by the naked eye (top inset in Figure 1I), indicating the efficient CRET from PFPV to TPP. Furthermore, we compared the NIR emission of POCL with a similar counterpart but without PFPV doping (POCL/PFPV-) to demonstrate the light conversion role of PFPV to enhance TPP NIR emission. As expected, the POCL showed much higher CL than the POCL/PFPV- group in the NIR range of 600-800 nm in the presence of H2O2 (Figure S7).
In addition to the NIR emission of TPP bridged by PFPV between CPPO and TPP, the singlet oxygen generation (1O2) triggered by the CL irradiation resulting from POCL in the presence of H2O2 was also evaluated by using 9,10-anthracenediyl-bis (methylene) dimalonic acid (ABDA) as a tracer. Figure 2A showed the absorption spectra of ABDA as a function of the H2O2 addition amount in the presence of POCL. The decrease in ABDA absorbance with increasing H2O2 concentration revealed efficient 1O2 generation, as the ABDA dye will be bleached by 1O2 oxidation [28-30]. Furthermore, the normalized ABDA absorbance (recorded at 380 nm) in POCL solution with the addition of H2O2 at various concentrations is presented in Figure 2B. The results indicate that H2O2 can trigger 1O2 generation from POCL. To further demonstrate the important role of CPPO, PFPV and TPP in the 1O2 generation, we compared the ABDA absorption in POCL with that in the similar counterparts but not doped with CPPO (POCL/ CPPO-), PFPV (POCL/PFPV-) or TPP (POCL/PFPV-). As expected, all three defective counterparts showed negligible 1O2 generation in the presence of 8 μM H2O2 (Figure 2C and 2D). Taken together, these results imply that the singlet oxygen generation will be amplified by the relayed energy transfer of CPPO-PFPV-TPP, which is initiated by H2O2.
Scheme 1
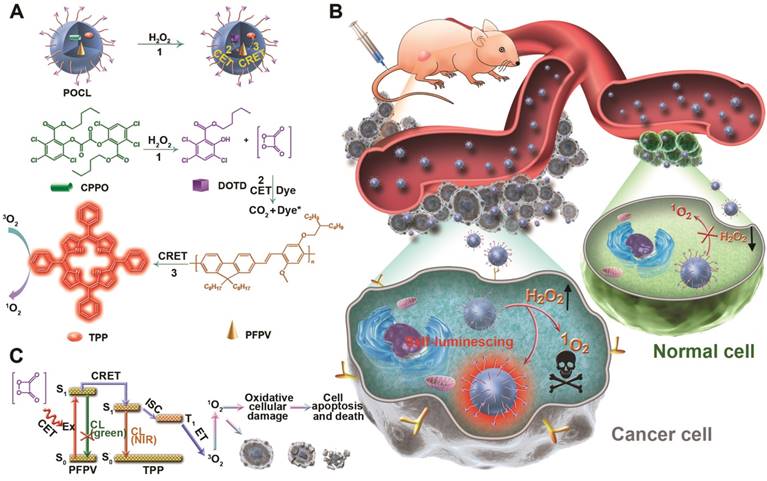
(A) Schematic representation of the nanoreactor formulation (POCL), chemical structures of the constituents, and the principle of chemiluminescence and 1O2 generation of POCL in the presence of H2O2. (B) Schematic view of POCL luminescence and application in photodynamic therapy (PDT) specifically in tumors triggered by H2O2 after targeted delivery through intravenous injection. (C) Mechanism of the NIR chemiluminescence and PDT.
Figure 1
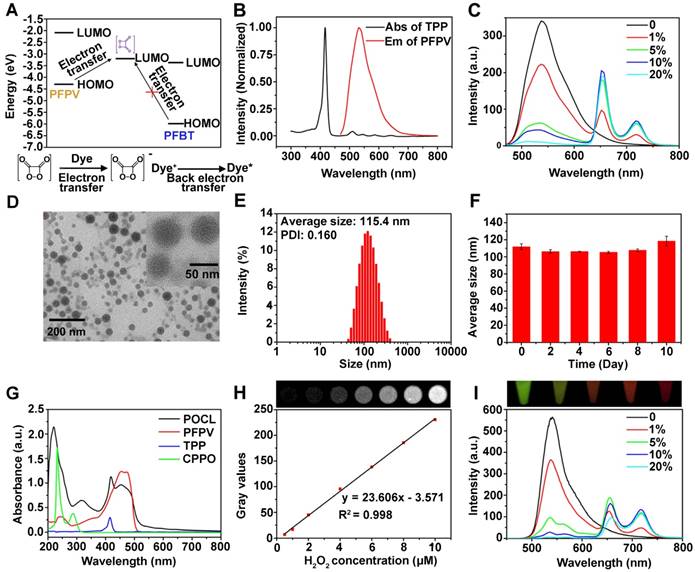
(A) The energy levels of PFPV, TPP and the high-energy intermediate DOTD. (B) Normalized emission and absorption spectra of PFPV and TPP, respectively. (C) Fluorescence spectra of POCL with different TPP dopant ratios vs. PFPV. (D) TEM image of POCL. (E) Size distribution of POCL in water measured by DLS. (F) Average hydrodynamic diameters of POCL as a function of time after storage in PBS with 10% FBS. (G) UV-vis absorption spectra of POCL, free PFPV, free TPP, and free CPPO. (H) CL images of POCL upon the existence of various concentrations of H2O2 collected by the ChemiDocTM MP Imaging System (BIO-RAD) with a 10 min exposure by open filter (top inset), and a correlation between the amounts of H2O2 and the corresponding gray values was calculated by ImageJ software (bottom inset). (I) Chemiluminescence spectra of POCL with different TPP dopant ratios vs. PFPV by the addition of an excess of H2O2 (1 M). The top inset is a photograph of the generated CL taken by a camera.
Figure 2
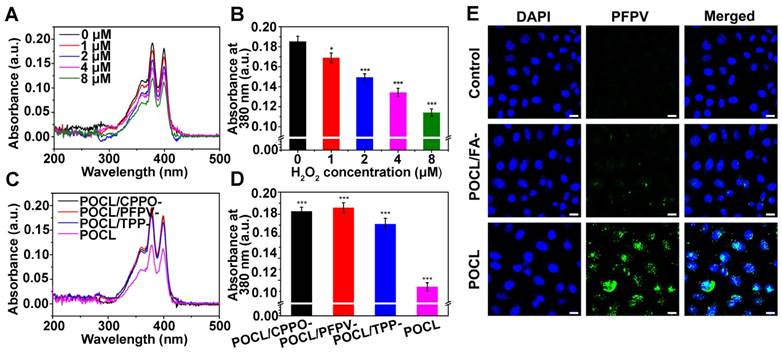
(A) UV-Vis spectra of ABDA and (B) normalized absorbance of ABDA at 380 nm in POCL solutions after the addition of H2O2 at different concentrations (*P < 0.05, **P < 0.01, ***P < 0.001; n = 3 per group). (C) UV-Vis spectra of ABDA and (D) normalized absorbance of ABDA at 380 nm in POCL, POCL/CPPO-, POCL/PFPV- or POCL/TPP- solutions after the addition of 8 μM H2O2 (*P < 0.05, **P < 0.01, ***P < 0.001; n = 3 per group). (E) CLSM images of HeLa cells after incubation with POCL or POCL/FA- for 4 h. Scale bar = 20 µm.
In our design, folic acid (FA) was introduced on the outer layer of POCL through self-assembly of FA-PEG-CHO and PEG-PCL to specifically bind to the folate receptor (FR), which is overexpressed in many types of cancer cells [31,32]. To demonstrate this hypothesis, FR-positive human cervical carcinoma HeLa cells were incubated with POCL or the related counterpart of POCL/FA- without FA ligand on the surface, and the cellular uptake was evaluated by confocal laser scanning microscopy (CLSM). To facilitate the observation, the nanoparticles used in CLSM measurements contained no TPP molecules, and thus, the PFPV fluorescence signal was monitored to track the cellular uptake by excitation at 488 nm. The results showed that the PFPV fluorescence intensity of the cells treated with POCL was much higher than that of cells treated with POCL/FA- (Figure 2E). A similar result was also obtained in another FR-positive human liver cancer cell line, SMMC-7721 (Figure S8). Furthermore, MCF-7 cells with low FR expression (determined by western blot analysis in Figure S9) were also used as a negative control to evaluate the cellular uptake of POCL and POCL/FA-. As shown in Figure S10, the green fluorescence signals in both POCL- and POCL/ FA-treated cells are very weak and are much lower than those of the POCL-treated HeLa cells. These results confirmed the enhanced cellular uptake of POCL in cancer cells mediated by FA ligands on the nanoparticle surface.
Before investigating the chemiexcited photodynamic therapeutic effect of POCL, we first evaluated the cytotoxicity of these nanoparticles on normal liver LO2 cells by using a CCK8 assay. As shown in Figure 3A, the POCL showed a negligible cell inhibition effect at all tested concentrations after incubation for 24 h or 48 h, indicating low cytotoxicity of POCL itself. Next, we explored the therapeutic effect of POCL on cancer cells, such as HeLa cells, as the CL of PFPV could act as an inner light source to excite 1O2 generation from TPP in the presence of H2O2. However, in the cell experiment, considering that high concentrations of H2O2 will cause extreme cytotoxicity, the cell tolerance of H2O2 at different concentrations was determined prior to the chemiexcited PDT effect. The results showed that nearly all the cells remained alive at H2O2 concentrations below 0.2 μM after 24 h or 48 h of treatment (Figure S11); thus, a cell medium containing 0.2 μM H2O2 was selected as a safe concentration for the following in vitro anti-cancer experiments to produce as much 1O2 as possible. The cytotoxicity of POCL at various concentrations with or without addition of H2O2 is shown in Figure 3B. Without the addition of H2O2, a negligible cell inhibition effect was found in PFPV containing various concentrations of POCL ranging from 2 μg/mL to 40 μg/mL. However, when the cells were co-incubated with PFPV and H2O2, the cell viability dramatically decreased, and the percentage of living cells was only 33.5% at a PFPV concentration of 40 μg/mL after 48 h of incubation. These results demonstrated that H2O2 could trigger POCL to exert a PDT effect without any external light sources.
We further checked the toxicity of different kinds of nanoparticles (e.g., POCL, POCL/CPPO-, POCL/ PFPV-, POCL/TPP-, POCL, POCL/FA-, as indicated above) at an equivalent PFPV concentration of 40 μg/mL combined with H2O2 treatment. As shown in Figure 3C, POCL/CPPO-, POCL/PFPV- and POCL/ TPP- did not exhibit any cytotoxicity against HeLa cells due to little 1O2 generation without the help of relayed energy transfer of CPPO-PFPV-TPP. In contrast, when the cells were treated with the nanomicelles containing all three functional components of CPPO, PFPV and TPP, the percentage of viable cells decreased significantly. In addition, the targeting effect of FA can further improve the therapeutic effects, resulting in much higher cytotoxicity than POCL/FA- without FA ligands on the surface. The anticancer efficacy was further qualitatively analyzed by fluorescence microscopic imaging for the observation of living and dead cells, which could present green and red fluorescence after stained with the LIVE/DEAD Cell Vitality Assay Kit, respectively. As shown in Figure 3D, compared with the POCL/CPPO-, POCL/PFPV-, POCL/TPP- and POCL/FA- groups, which showed entire or partly green fluorescence for live cells, most of the cells were dead after POCL treatment, which was in accordance with the results obtained from the CCK8 assay in Figure 3C. To further confirm whether the cell killing effect of POCL occurred through the cell apoptotic pathway, Annexin V-FITC and PI staining were employed to detect the apoptosis rate in HeLa cells by flow cytometry. In the scatter plot in four quadrants that represent normality (lower left), necrosis (upper left), early apoptosis (lower right) and late apoptosis (upper right) (Figure 3E), almost all cells were located in a viable region in the POCL/CPPO-, POCL/PFPV-, and POCL/TPP- groups. POCL and POCL/FA-, however, increased the cell percentage in the early and late apoptosis quadrants. The most significant result was observed in the POCL group, which exhibited 8.2% in the early apoptosis region, 32.5% in the late apoptosis region, and 13.9% in the necrosis region. The enhanced apoptosis effect of POCL was consistent with its remarkable cytotoxicity, which might be ascribed to the enhanced cellular uptake mediated by FA and the efficient 1O2 generation in cancer cells. Therefore, we next used 2',7'-dichlorodihydrofluorescein diacetate (DCFH-DA) as the probe to track 1O2 generation in the cells treated with the various kinds of nanoparticles mentioned above, since the DCFH-DA will be converted into DCFH by cellular esterases to be retained in the cells and then rapidly oxidized to highly green fluorescent DCF by intracellular ROS, including 1O2 [33,34]. As expected, no or limited green fluorescence was observed in the cells treated with POCL/CPPO-, POCL/PFPV-, POCL/TPP-, or POCL/FA-. By contrast, the green fluorescence in the POCL group integrated with all functional components was much higher than that in the other groups (Figure 1F), indicating the excellent ROS generation capacity of POCL in the cancer cells. It is well known that 1O2 destroys the cell membrane at the onset of endocytosis. However, when both POCL and H2O2 are internalized, the 1O2 generated in the cytosol can also act on other targets (e.g., lysosomes, mitochondria, endoplasmic reticulum, nuclei) to mediate cytotoxicity [35,36].
To confirm that POCL can be targeted to the tumor site, a tumor-bearing mouse model was constructed by subcutaneous inoculation of HeLa cells into BALB/c nude mice. First, POCL was intravenously injected into the mice through the tail vein to investigate the tumor accumulation of these FA-modified nanoparticles, which could be reflected by whole-body fluorescence imaging, since TPP in POCL has a long emission wavelength that is beneficial for signal detection in small animal imaging systems. POCL fluorescence was steadily enriched in the tumor site and achieved a maximum within 3 h. Afterward, the fluorescence decreased with time but remained noticeable even after 24 h of injection. In contrast, POCL/FA- showed a much weaker fluorescence signal at the tumor site. We further performed ex vivo imaging analysis of the tumor and other major organs, for which the mice were killed at 24 h. Although POCL inevitably entered into metabolic organs, such as the liver and spleen, a considerable amount of POCL was also found to be distributed in the tumor (Figure 4C). The MFI of the tumor site was calculated to be 2.96 × 10⁷ p/sec/cm2/sr/μW, which was almost 2.6-fold higher than that in the POCL/FA- group (Figure 4D). In comparison, both POCL and POCL/FA- showed limited accumulation in MCF-7 tumors, as evidenced in Figure S12. To further explore their biodistribution, the TPP molecules were extracted from the major organs, including tumor tissues, and their content was determined by fluorescence spectrophotometry. As shown in Figure 4E, the TPP level in the tumor was 1.14% ID/g after 24 h of i.v. injection of POCL, while the corresponding TPP level for mice administered POCL/FA- was only 0.67% ID/g after 24 h of injection. The higher tumor accumulation might be ascribed to the FA targeting ligand on POCL for elevating the uptake of cancer cells overexpressing FA receptors [37,38]. Another reason for the higher tumor retention of POCL than of POCL/FA- is the improved pharmacokinetics with longer blood circulation times. The TPP concentrations in plasma as a function of time are shown in Figure 4F. Although both POCL and POCL/FA- were rapidly eliminated after injection, POCL showed a significantly slower clearance rate than POCL/FA-. The circulation half-lives of POCL and POCL/FA- were calculated to be 1.075 h and 0.498 h by curve fitting, respectively.
In the above investigation, although the tumor tissues can be visualized by NIR FL imaging of POCL that accumulated at this site by a targeting effect mediated by the FA ligand, the high noise associated with whole-body autofluorescence and the interference from the POCL in other organs such as liver make the tumor detection more complicated and less accurate. Alternatively, we next checked whether our as-prepared nanoreactor could achieve tumor microenvironment activated chemiluminescent imaging by responding to the overproduced H2O2 in vivo. As shown in Figure 4G, the tumor area could be particularly lit up by CL signal, and the signal persisted for approximately 2 h, while the most intense signal appeared at 1 h post i.v. injection. The short imaging time was ascribed to the rapid consumption of CPPO fuel by water and the high H2O2 level at the tumor site (Figure S13) [26]. Furthermore, due to the enhanced tumor accumulation of POCL compared to POCL/FA-, the CL intensity of POCL in the tumor tissue was also much higher than that of POCL/FA- (10.220×10³ counts vs. 5.347×10³ counts) at 1 h post-injection (Figure 4H). These results indicate that chemiluminescence imaging of POCL is promising for imaging tumors with high specificity and accuracy. To further validate H2O2 as a power source for CL emission and 1O2 generation in vivo, the intratumoral H2O2 was analyzed by colorimetry after complexation with a TiOSO4/H2SO4 reagent. As shown in Figure S14, the intratumoral H2O2 concentration in the control mouse group treated with saline injection was determined to be 7.57 μmol/g, but the POCL-treated mice showed a decreased value of 3.12 μmol/g, confirming that POCL can consume the intratumoral H2O2 for CL emission and 1O2 generation.
To further evaluate whether our POCL nanoreactor exert in vivo therapeutic efficacy that resulted from the efficient tumor accumulation and the subsequent generation of 1O2 triggered by the relayed energy transfer between CPPO-PFPV-TPP in the presence of a high level of H2O2 in tumor tissue, the mice bearing subdermal HeLa xenografts were randomly divided into six groups with various treatments, including control (PBS received), POCL/CPPO-, POCL/PFPV-, POCL/TPP-, POCL/FA- and POCL at a TPP equivalent dose of 20 μg per mouse. The treatment regime is schematically illustrated in Figure 5A. A tumor growth delay study revealed that POCL without CPPO, PFPF, or TPP dopant could not inhibit tumor growth compared with that in the PBS control group. However, when all three functional components of CPPO, PFPV, and TPP were co-encapsulated in the nanoreactor (POCL and POCL/FA-), the tumor growth was remarkably delayed. Most significantly, POCL with FA ligands demonstrated a substantially robust tumor growth inhibition effect in comparison with other groups (Figure 5B and S15). Accordingly, the digital photos of dissected tumors showed that POCL treatment led to a much smaller size than those in other groups at day 21 post-injection (Figure 5C). In addition, the resected tumors were also weighed at the end of the treatment on day 21 (Figure 5D). The average tumor weight in the POCL group was significantly reduced by 85% compared with the control group, which was much higher than the data in other groups (POCL/CPPO-: 10%; POCL/PFPV-: 13%; POCL/TPP-: 16%; POCL/FA-: 38%). The in vivo antitumor activity is consistent with the in vitro cytotoxicity, confirming the effectiveness of the PDT effect even in the absence of an external light source.
Figure 3
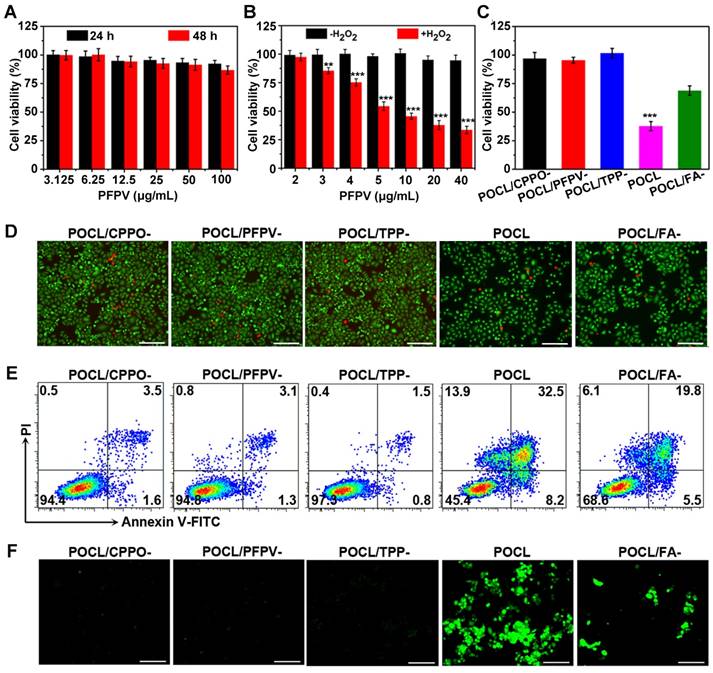
(A) The cytotoxicity of POCL against LO2 cells after incubation for 24 h or 48 h. (B) The cytotoxicity of POCL against HeLa cells at various PFPV concentrations in the presence or absence of 0.2 μM H2O2 (*P < 0.05, **P < 0.01, ***P < 0.001; n = 4 per group). (C) The cytotoxicity of different kinds of nanoparticles (expressed as POCL/CPPO-, POCL/PFPV-, POCL/TPP-, POCL, or POCL/FA-) against HeLa cells in the presence of 0.2 μM H2O2. All concentrations of nanoparticles were kept the same with the counterpart PFPV of 40 μg/mL (*P < 0.05, **P < 0.01, ***P < 0.001; n = 4 per group). (D) Fluorescence microscopic images of HeLa cells stained by the live/dead cell staining kit after different treatments as mentioned above. Scale bar = 100 µm. (E) Evaluation of the cell death mechanisms through Annexin V-FITC and PI staining after different treatments as mentioned above. (F) Intracellular ROS generation mediated by different treatments as mentioned above. Scale bar = 100 µm.
Figure 4
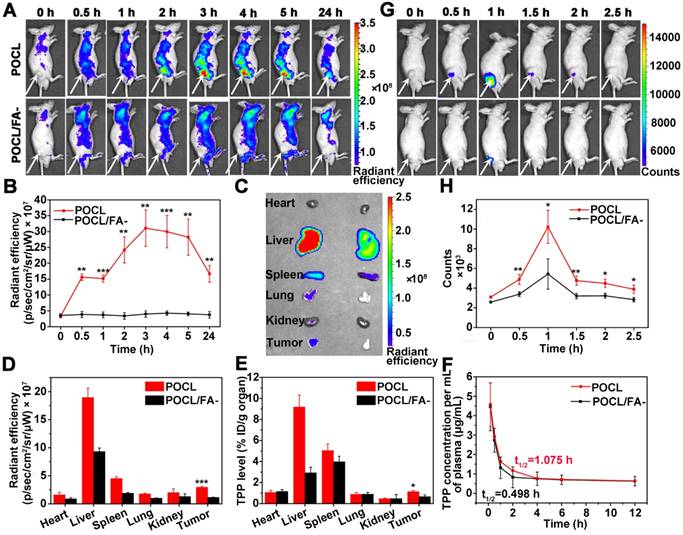
(A) Time course fluorescence images of tumor-bearing mice receiving i.v. injection of POCL or POCL/FA- (0.2 mg/mL based on TPP, 100 μL per mouse). Tumor regions are indicated by white arrows. Fluorescence images were acquired for 1 s of exposure with excitation at 465 nm and emission at 640 nm. (B) Fluorescence signal intensities of the tumors in mice from A over time (*P < 0.05, **P < 0.01, ***P < 0.001; n = 3 per group). (C) Ex vivo fluorescence images and (D) corresponding fluorescence signal intensities of the dissected organs and tumors from the mice after 24 h of injection as indicated above (*P < 0.05, **P < 0.01, ***P < 0.001; n = 3 per group). (E) Biodistribution of POCL or POCL/FA- based on TPP at 24 h post-injection as indicated above (n = 3 per group). (F) Pharmacokinetics of POCL or POCL/FA- based on TPP in mice from 0 to 12 h after intravenous injection (n = 3 per group). (G) Time course chemiluminescence images of tumor-bearing mice receiving i.v. injection of POCL or POCL/FA- (0.2 mg/mL based on TPP, 100 μL per mouse). Tumor regions are indicated by white arrows. (H) Chemiluminescence signal intensities of the tumor in mice from G over time (*P < 0.05, **P < 0.01, ***P < 0.001; n = 3 per group).
To further confirm the therapeutic efficacy, the dissected tumor tissues from different groups were analyzed by hematoxylin and eosin (H&E) staining, immunohistochemical staining for antigen Ki67, and TUNEL staining (Figure 5E). From the pathological images of tumor tissues with H&E staining, much of the nucleus shrinkage and necrosis representing cell destruction was observed after treatment with POCL, which is much higher than that in other groups. For Ki67 staining, the nuclei of proliferative cells showed much less positive staining as brown granules than those of other groups, while the most apoptotic cells with brown staining were observed in this group via TUNEL assay. To further demonstrate that the antitumor effect was resulted from the oxidative stress of POCL, the typical features of singlet oxygen toxicity, such as hemorrhage and high expression of carbonyl proteins in tumor tissue after 1 h of treatment, were evaluated through H&E and protein carbonyl immunohistochemical staining, respectively. As shown in Figure S16, the tumor tissue in the POCL group had a large area of hemorrhage in comparison with other groups. Moreover, this group also exhibited the most significant positive brown signal of carbonyl protein. These results demonstrate that POCL, as a targeted and tumor microenvironment activated nanoreactor, is capable of exerting PDT therapeutic effects in vivo.
The potential in vivo toxicity is another strong concern in clinical applications; thus, the influence of POCL in mice was examined from the following aspects. First, the hemolysis profile demonstrated that POCL triggered no apparent destruction of RBCs, as the supernatant only exhibited a yellow color from POCL itself rather than a strong red color like the positive control (Figure S17). Second, from H&E staining of organ slices, unnoticeable physiological morphological changes were observed, suggesting the slight side effects of POCL (Figure S18). Furthermore, the blood analysis at different intervals indicated that POCL did not influence hepatic and kidney function after i.v. injection (Figure S19). Overall, these results confirmed the biocompatibility of our POCL in vivo.
Figure 5
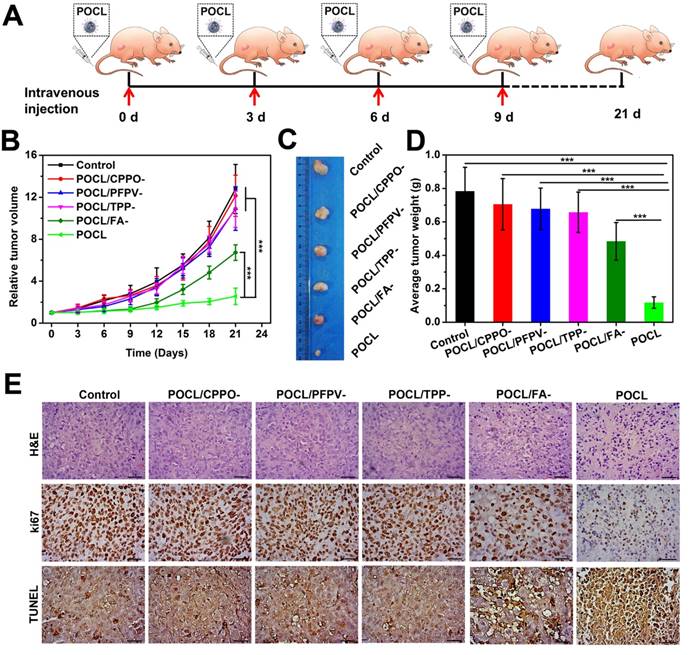
In vivo tumor therapeutic effect. (A) Schematic illustration of the treatment regimen. The i.v. injection was implemented on an every-three-day schedule four times (TPP dose: 4 mg/kg). The mice were sacrificed on day 21 for tumor separation. (B) Tumor growth curves with different treatments (*P < 0.05, **P < 0.01, ***P < 0.001; n = 5 per group). (C) Representative tumor images. (D) Tumor weight after 21 d of different treatments (*P < 0.05, **P < 0.01, ***P < 0.001; n = 5 per group). (E) Optical microscopic images of tumor slices stained by H&E, Ki67 antigen immunohistochemistry, and terminal deoxynucleotidyl transferase deoxyuridine triphosphate nick-end labeling (TUNEL). Scale bar = 50 μm.
In this article, we report a self-luminescence nanoreactor for noninvasive in vivo chemiluminescence imaging and photodynamic therapy without an external light source. Although chemiluminescence imaging alone has been reported in previous studies, the chemiexcited PDT, especially for in vivo applications, is still very rare, which might be ascribed to several factors, including fluorescence quenching of traditional photosensitizers (PSs), weak chemiluminescence, and mismatched energy levels of the chemical source and the PSs. Recently, Liu et al. synthesized an aggregation-induced emission nanoagent (AIEgen) for in vivo chemiluminescence imaging-guided tumor therapy [3]. However, we noticed that the cancer cells sill maintained a relatively high viability of 78%, even with AIEgen treatment. To enhance the antitumor efficiency, Liu et al. combined β-phenylethyl isothiocyanate (FEITC) to enhance the H2O2 concentration in the tumor site in addition to improve the therapeutic effect of AIEgens, except for its own cytotoxicity [3]. In return, cancer cell viability significantly decreased to 42%, and tumor growth was effectively inhibited. However, even without FEITC, our POCL still exhibited a comparable anticancer effect, with the cell viability decreasing to 38% and tumor growth being similarly significantly delayed. Therefore, these promising results will motivate more studies for future clinical translation.
Conclusions
In summary, we have reported a self-luminescing nanoreactor encapsulating CPPO, PFPV, and TPP for tumor microenvironment activated chemiluminescence imaging-guided cancer therapy through an intraparticle relayed resonance energy transfer process. The relay was initiated with the reaction between CPPO and H2O2 to produce the high-energy intermediate DOTD, while PFPV was used as both the acceptor of chemical energy from DOTD and the CRET donor and the photosensitizer TPP was used as the CRET acceptor. This energy transfer strategy endowed POCL with intense NIR chemiluminescence and good 1O2 generation capacity in the presence of H2O2. Considering the high level of H2O2 in the tumor microenvironment and the folate receptor on cancer cells, POCL with an FA targeting ligand could efficiently induce 1O2 generation in cancer cells and in turn exhibited significant cytotoxicity against cancer cells. Notably, these nanoreactors showed a chemiluminescence image specifically at the tumor site with high image contrast and a high antitumor effect in tumor-bearing mice with low systemic toxicity after systematic administration. Therefore, our research provides a novel NIR imaging and PDT strategy without the need for an external light source, which might hold great promise for cancer imaging and treatment in the future.
Methods
Materials
The conjugated polymers poly[(9,9'-dioctyl-2,7-divinylene-fluorenylene)-alt-2-methoxy-5-(2-ethyl-hexyloxy)-1,4-phenylene] (PFPV) and poly[(9,9-dioctylfluorenyl-2,7-diyl)-co-(1,4-benzo-(2,1′,3)-thiadazole)] (PFBT) were purchased from Luminescence Technology Corp. and ADS Dyes, Inc., respectively. Tetraphenylporphyrin (TPP) was purchased from Adamas-beta, and bis[3,4,6-trichloro-2-(pentyloxycarbonyl) phenyl] oxalate (CPPO) was supplied by TCI. Poly(ethylene glycol)-poly(ε-caprolactone) (PEG-PCL) was synthesized according to previously reported methods.1 Cholesterol-PEG-folate (Mw = 2000) was purchased from Xi'an Ruixi Biological Technology Co., Ltd. 9,10-Anthracenediyl-bis(methylene) dimalonic acid (ABDA) and 2,7-dichlorodihydrofluorescein diacetate (DCFH-DA) were purchased from Sigma-Aldrich. 4',6-Diamidino-2-phenylindole (DAPI) and Cell Counting Kit-8 (CCK-8) were obtained from Dojindo Molecular Technologies. The LIVE/DEAD Viability/Cytotoxicity Kit and Annexin V-fluorescein isothiocyanate (FITC)/propidium iodide (PI) apoptosis detection kit were provided by Invitrogen. All other chemicals, if not specified, were used as received without further purification.
Characterization
The 1HNMR spectrum was recorded on a Bruker Avance III 400 spectrometer. The molecular weight, including its distribution (Mw/Mn) of PEG-PCL, was measured by gel permeation chromatography (GPC) using a Waters-2690D HPLC equipped with Shodex K802.5 and K805 columns, a Wyatt multiangle light scattering detector, and a Waters 2,100 differential refractive index detector. Fluorescence and chemiluminescence spectra were recorded on a Cary Eclipse Fluorescence Spectrophotometer (Agilent Technologies). Chemiluminescence images of CPPO solutions were collected on a ChemiDocTM MP Imaging System (BIO-RAD). The UV-Vis absorbance was measured using a Spectra Max M5 microplate reader (Molecular Devices, Sunnyvale, CA, USA). Dynamic light scattering (DLS) was conducted on a Zetasizer Nano ZS (Malvern Instruments Ltd., UK). TEM images of negatively stained particles (with 2 wt % uranyl acetate) were obtained by transmission electron microscopy (TEM, FEI Company, Hillsboro, OR) with an accelerating voltage of 200 kV.
Synthesis of POCL
PEG-PCL (10 mg), cholesterol-PEG-folate (1 mg), CPPO (2 mg), PFPV or PFBT (1 mg), TPP (0.05 mg) were homogeneously dissolved in 1 mL of tetrahydrofuran (THF). The mixture was then rapidly injected into 10 mL of Milli-Q water under sonication with a sonicator probe (SCIENTZ - II D). Afterward, the THF in the mixture was evaporated through a nitrogen flow, and the remaining solution was filtered through a 0.22 μm syringe-driven filter (Millipore). Ultimately, the obtained POCL dispersion was concentrated by ultrafiltration and used immediately in the following experiments. Other types of nanoparticles, such as POCL/CCPO-, POCL/PFPV-, POCL/TPP-, or POCL/FA-, were prepared according to the same procedure, except for the addition of CPPO, PFPV, TPP, or cholesterol-PEG-folate.
Cell experiments
Human cervical carcinoma HeLa cells, human breast cancer MCF-7 cells, human hepatocellular carcinoma SMMC-7721 cells, and human normal liver LO2 cells were obtained from ATCC. All of these cells were cultured in DMEM supplemented with 10% fetal bovine serum and 100 U/L penicillin-streptomycin at 37 °C in a humidified atmosphere with 5% CO2.
For the cellular uptake assessment, HeLa, MCF-7 and SMMC-7721 cells were seeded at a density of 2 × 10⁵ cells onto 35 mm glass-bottom Petri dishes and incubated for 24 h. Subsequently, the cells were incubated with POCL or POCL/FA- at a PFPV equivalent of 20 µg/mL for another 4 h. The cells were then washed twice with PBS and fixed with 4% paraformaldehyde, and the cell nuclei were stained with DAPI. Images of cells were observed on a confocal laser scanning microscope (CLSM, Zeiss LSM780) with 488 nm laser excitation for PFPV and 405 nm laser excitation for DAPI.
For the in vitro toxicity test, LO2 cells were seeded in a 96-well plate at a density of 5 × 10³ cells per well and cultured for 24 h. Afterwards, the cells were further incubated for 24 or 48 h in fresh medium containing POCL at PFPV equivalent concentrations ranging from 3.125 to 100 µg/mL. Then, 100 µL of PBS was replaced in each well, and 10 µL of CCK-8 solution was added. After the cells were further incubated for 1 h at 37 °C, the absorbance at 450 nm in each well was recorded on a SpectraMax M5 Microplate Reader (Molecular Devices, USA). The cell viability was calculated using the following formula:
Cell viability = (A1-Ablank) / (A0-Ablank) × 100%.
Here, A1 and A0 are the absorbance values of nontreated cells and treated cells, respectively, while Ablank is the absorbance of CCK-8 itself. The cell viability was presented as the averaged value from four independent wells.
For in vitro anticancer measurements, HeLa cells were seeded in a 96-well plate at a density of 5 × 10³ cells per well and cultured for 24 h. Afterwards, the cells were further incubated for 24 or 48 h in fresh medium containing the POCL at the PFPV equivalent concentration ranging from 2 to 40 µg/mL and H2O2 (0.2 μM). After 48 h of incubation, cytotoxicity was evaluated using the CCK8 assay as indicated above. Cytotoxicity of POCL without the addition of H2O2 was also conducted as a control. Before this investigation, the viability of cells treated only with H2O2 at different concentrations was evaluated. In addition, the cytotoxicity of different kinds of nanoparticles (POCL/CPPO-, POCL/PFPV-, POCL/TPP- and POCL/FA-) in the presence of H2O2 (0.2 μM) was also assessed and compared with that of the POCL group using the CCK8 assay. Then, the cells were treated according to the same protocols as mentioned above. Furthermore, these treated cells were also stained with a LIVE/DEAD® Viability/ Cytotoxicity Kit to evaluate their viability. The stained cells were examined by a fluorescence microscope (Zeiss Axio Vert.A1, Germany) with 488 nm laser excitation for calcein AM and 543 nm laser excitation for ethidium homodimer-1.
The cell death induced by POCL was further evaluated by using the Annexin V-FITC/PI dual-staining assay. Typically, HeLa cells were seeded into a 6-well plate at a density of 2 × 10⁶ cells per well and cultured for 24 h. Afterward, the cells underwent the same treatments as indicated above, and the cells were then stained with an Annexin V-FITC/PI apoptosis detection kit. For apoptosis measurements, the cells were analyzed by flow cytometry (FCM, BD FACSVerse, USA).
For intracellular ROS generation, the cells treated with different kinds of nanoparticles as indicated above were added with 40 µM DCFH-DA and further incubated for 30 min. Then, the cells were washed twice with PBS, and the fluorescence signal on the plate bottom was visualized by a fluorescence microscope with 488 nm laser excitation.
Animal experiments
The animal studies were conducted strictly under the guidelines of “National animal management regulations of China” and approved by the Animal Ethics Committee of Mengchao Hepatobiliary Hospital of Fujian Medical University. For cancer model preparation, six-week-old BALB/c nude mice (obtained from China Wushi, Inc.) were injected subcutaneously with 5 × 10⁵ HeLa cells or MCF-7 cells. When the tumor volume reached ~100 mm3, the mice were used in the following in vivo imaging and anti-tumor therapy studies.
In vivo imaging: The mice bearing HeLa tumors were intravenously injected with 100 μL of POCL or POCL/FA- (0.2 mg/mL based on TPP) through the tail vein. At different time points, the mice were anesthetized with intraperitoneal injection of 1 wt% pentobarbital sodium for whole-animal fluorescence and chemiluminescence imaging by an IVIS Spectrum imaging system (PerkinElmer). Chemiluminescence images were acquired for 600 s with an open filter, and fluorescence images were acquired for 1 s with excitation at 465 nm and emission at 640 nm. Finally, tumor tissue and major organs (heart, liver, spleen, kidney, and lung) were collected for fluorescence imaging and biodistribution analysis. The imaging results were quantified with the IVIS Living Image® 4.4 software. For the tissue distribution study, the dissected tissues, including heart, liver, spleen, lung, kidney, and tumor, were collected and weighed. Each tumor was disaggregated by homogenization, and the TPP molecules in the solution were extracted by chloroform. The TPP (Ex/Em, 420/670 nm) concentration in the chloroform layer of each tissue was analyzed using a fluorescence spectrometer. For the pharmacokinetic study, 4-6 week old SD rats (obtained from China Wushi, Inc.) were injected with POCL or POCL/FA- (8 mg/kg per rat) via the tail vein. The blood samples were obtained at the 10 min, 0.5 h, 1 h, 2 h, 4 h, 6 h, and 12 h time points. Appropriate PBS was added. The samples were repeatedly freeze-thawed and then ultrasonicated for 5 min. The TPP molecules in the samples were extracted with chloroform and determined by fluorescence spectroscopy as indicated above.
Measurement of the intratumoral H2O2 concentration: The tumor-bearing nude mice were injected with saline (control) and POCL (20 μg per mouse based on TPP), respectively. At 1 h post-injection, the tumors were weighed and homogenized with 6 mL acetone in an ice bath. Then, 6 mL of supernatant acetone was collected by centrifugation at 8000 rpm for 10 min to remove the suspended cells. After the addition of 100 μL TiOSO4 (0.03 mol/L) and 200 μL NH3·H2O into acetone, yellow precipitation was obtained by centrifugation at 5000 rpm for 10 min and dissolved in 3 mL H2SO4 (1 mol/L) to test the absorbance at 405 nm. The intratumoral H2O2 concentration was finally determined according to the drawn standard curve.
In vivo antitumor therapy: HeLa-tumor-bearing mice were randomly divided into six groups with five mice in each group as follows: saline injection, POCL/CPPO- injection, POCL/PFPV- injection, POCL/TPP- injection, POCL/FA- injection, and POCL injection. The injection volume was 100 μL per mouse; the injection doses based on TPP were 20 μg per mouse, and the administration method was intravenous injection repeated at day 0, day 3, day 6, and day 9. The tumor volume was recorded every 3 days for 21 days, and the tumor diameter at each time point was measured by using an electronic caliper. The tumor volume was calculated according to the following formula: tumor volume (V) = length × width2/2. The relative volume V/V0 (V0 was the initial tumor volume before treatment) was used to evaluate the relative tumor growth ratio. After 21 days of treatment, the tumor of each nude mouse was excised and weighed. Furthermore, the dissected tumor tissues were fixed in formalin, embedded in paraffin, sectioned into slices for H&E, Ki67 immunohistochemistry, and TUNEL staining and analyzed by optical microscopy (Axio Lab.A1, Germany).
Hemolysis assay: Blood samples were obtained from the SD rats. Then, the purified RBCs were isolated from blood samples and diluted with normal physiological saline (NS, 0.9%) according to a previously reported method. Afterwards, 0.6 mL of a diluted RBC suspension was incubated with 2.4 mL of deionized water (as a positive control), NS (as a negative control), and POCL solution (25, 50 and 100 μg/mL based on TPP). The mixtures were kept under static conditions at room temperature for 2 h, and then the changes in RBCs were visualized.
Blood biochemical analysis and histopathological examination: For blood biochemical analysis, SD rats were intravenously injected with a dose of 20 μg/kg per rat based on TPP. Then, the blood samples were collected at 5 day, 10 day and 20 day to assess the POCL toxicity, while the rats without any treatment were used as controls (defined as day 0). After the collection of blood, fresh samples were centrifuged to obtain plasma, which was stored at -20 °C until measurement. The blood biochemical markers were analyzed with a biochemical autoanalyzer (CX5, Beckman, USA). The levels of albumin (ALB), alkaline phosphatase (ALP), alanine aminotransferase (ALT), aspartate aminotransferase (AST), blood urea nitrogen (BUN) and creatinine (CRE) were examined to reflect liver and kidney function. Histologic analysis was performed to study the possible toxicity by examining the morphological changes of the major organs (heart, liver, spleen, lung, and kidney) through H&E staining, according to the aforementioned methods.
Abbreviations
FL: fluorescence; PDT: photodynamic therapy; NIR: near-infrared; CPPO: bis[3,4,6-trichloro-2-(pentyloxycarbonyl) phenyl] oxalate; PFPV: poly[(9,9'-dioctyl-2,7-divinylene-fluorenylene)-alt-2-methoxy-5-(2-ethyl-hexyloxy)-1,4-phenylene]; TPP: tetraphenylporphyrin; PEG-PCL: poly(ethyleneglycol)-co-poly(caprolactone); DOTD: 1,2-dioxetanedione; CRET: chemiluminescence resonance energy transfer; BL: bioluminescence; CL: chemiluminescence; PL: photoluminescence; ROS: reactive oxygen species; PDT: photodynamic therapy; ACQ: aggregation-caused quenching; SPs: semiconductor polymers; PFBT: poly[(9,9-dioctylfluorenyl-2,7-diyl)-co-(1,4-benzo-2,1′,3-thiadazole)]; HOMO: highest occupied molecular orbital; LUMO: lowest unoccupied molecular orbital; ABDA: 9, 10-anthracenediyl-bis (methylene) dimalonic acid; FA: folic acid.
Supplementary Material
Supplementary figures.
Acknowledgements
This work is supported by the Natural Science Foundation of China (Grant Nos. 81601538, 81671813, U1505221, 61727823, 61575044, 21705022, and 61805041), the Joint Funds for the innovation of science and Technology, Fujian province (Grant Nos. 2016Y9062 and 2016Y9061), the Scientific Foundation of the Fujian provincial Health and Family Planning Commission (Grant No. 2017-ZQN-75 and 2018-ZQN-75), and the Scientific Foundation of the Fuzhou Health and Family Planning Commission (Grant No. 2016-S-wt5).
Competing Interests
The authors have declared that no competing interest exists.
References
1. Lee D, Khaja S, Velasquez-Castano JC, Dasari M, Sun C, Petros J. et al. In vivo imaging of hydrogen peroxide with chemiluminescent nanoparticles. Nat Mater. 2007;6:765-9
2. Lim CK, Lee YD, Na J, Oh JM, Her S, Kim K. et al. Chemiluminescence-generating nanoreactor formulation for near-infrared imaging of hydrogen peroxide and glucose level in vivo. Adv Funct Mater. 2010;20:2644-8
3. Mao D, Wu W, Ji S, Chen C, Hu F, Kong D. et al. Chemiluminescence-guided cancer therapy using a chemiexcited photosensitizer. Chem. 2017;3:991-1007
4. Yuan H, Chong H, Wang B, Zhu C, Liu L, Yang Q. et al. Chemical molecule-induced light-activated system for anticancer and antifungal activities. J Am Chem Soc. 2012;134:13184-7
5. Singh A, Seo YH, Lim CK, Koh J, Jang WD, Kwon IC. et al. Biolighted nanotorch capable of systemic self-delivery and diagnostic imaging. ACS Nano. 2015;9:9906-11
6. Xiong L, Shuhendler AJ, Rao J. Self-luminescing BRET-FRET near-infrared dots for in vivo lymph-node mapping and tumour imaging. Nat Commun. 2012;3:1193
7. Jie X, Yang H, Wang M, Zhang Y, Wei W, Xia Z. A peroxisome-inspired chemiluminescent silica nanodevice for the intracellular detection of biomarkers and its application to insulin-sensitizer screening. Angew Chem Int Ed. 2017;56:14596-601
8. Zhao J, Wu W, Sun J, Guo S. Triplet photosensitizers: from molecular design to applications. Chem Soc Rev. 2013;42:5323-51
9. Liu G, Wang C, Zheng W, Pan L, Zhang C, Yang X. et al. Organic biomimicking memristor for information storage and processing applications. Adv Electron Mater. 2016;2:1500298
10. Peiró Cadahía J, Bondebjerg J, Hansen CA, Previtali V, Hansen AE, Andresen TL. et al. Synthesis and evaluation of hydrogen peroxide sensitive prodrugs of methotrexate and aminopterin for the treatment of rheumatoid arthritis. J Med Chem. 2018;61:3503-15
11. Kalwa H, Sartoretto JL, Martinelli R, Romero N, Steinhorn BS, Tao M. et al. Central role for hydrogen peroxide in P2Y1 ADP receptor-mediated cellular responses in vascular endothelium. Proc Natl Acad Sci U S A. 2014;111:3383-8
12. Trachootham D, Alexandre J, Huang P. Targeting cancer cells by ROS-mediated mechanisms: a radical therapeutic approach? Nat Rev Drug Discov. 2009;8:579-91
13. López-Lázaro M. Dual role of hydrogen peroxide in cancer: possible relevance to cancer chemoprevention and therapy. Cancer Lett. 2007;252:1-8
14. Fan W, Lu N, Huang P, Liu Y, Yang Z, Wang S. et al. Glucose-responsive sequential generation of hydrogen peroxide and nitric oxide for synergistic cancer starving-like/gas therapy. Angew Chem Int Ed. 2016;55:1-6
15. Miller EW, Albers AE, Pralle A, Isacoff EY, Chang CJ. Boronate-based fluorescent probes for imaging cellular hydrogen peroxide. J Am Chem Soc. 2005;127:16652-9
16. Belousov VV, Fradkov AF, Lukyanov KA, Staroverov DB, Shakhbazov KS, Terskikh AV. et al. Genetically encoded fluorescent indicator for intracellular hydrogen peroxide. Nat Methods. 2006;3:281-6
17. Jin H, Heller DA, Kalbacova M, Kim JH, Zhang J, Boghossian AA. et al. Detection of single-molecule H2O2 signalling from epidermal growth factor receptor using fluorescent single-walled carbon nanotubes. Nat Nanotechnol. 2010;5:302-9
18. Shiang YC, Huang CC, Chang HT. Gold nanodot-based luminescent sensor for the detection of hydrogen peroxide and glucose. Chem Commun. 2009;0:3437-9
19. Leblond F, Davis SC, Valdés PA, Pogue BW. Pre-clinical whole-body fluorescence imaging: review of instruments, methods and applications. J Photochem Photobiol B. 2010;98:77-94
20. Li S, Chang K, Sun K, Tang Y, Cui N, Wang Y. et al. Amplified singlet oxygen generation in semiconductor polymer dots for photodynamic cancer therapy. ACS Appl Mater Interfaces. 2016;8:3624-34
21. Lee YD, Lim CK, Singh A, Koh J, Kim J, Kwon IC. et al. Dye/peroxalate aggregated nanoparticles with enhanced and tunable chemiluminescence for biomedical imaging of hydrogen peroxide. ACS Nano. 2012;6:6759-66
22. Yuan Y, Feng G, Qin W, Tang BZ, Liu B. Targeted and image-guided photodynamic cancer therapy based on organic nanoparticles with aggregation-induced emission characteristics. Chem Commun. 2014;50:8757-60
23. Geng J, Li K, Qin W, Tang BZ, Liu B. Red-emissive chemiluminescent nanoparticles with aggregation-induced emission characteristics for in vivo hydrogen peroxide imaging. Part Part Syst Charact. 2014;31:1238-43
24. Li P, Liu L, Xiao H, Zhang W, Wang L, Tang B. A new polymer nanoprobe based on chemiluminescence resonance energy transfer for ultrasensitive imaging of intrinsic superoxide anion in mice. J Am Chem Soc. 2016;138:2893-6
25. Shuhendler AJ, Pu K, Cui L, Uetrecht JP, Rao J. Real-time imaging of oxidative and nitrosative stress in the liver of live animals for drug-toxicity testing. Nat Biotechnol. 2014;32:373-80
26. Zhen X, Zhang C, Xie C, Miao Q, Lim KL, Pu K. Intraparticle energy level alignment of semiconducting polymer nanoparticles to amplify chemiluminescence for ultrasensitive in vivo imaging of reactive oxygen species. ACS Nano. 2016;10:6400-9
27. Maruyama T, Narita S, Motoyoshiya J. The hammett correlation between distyrylbenzene substituents and chemiluminescence efficiency providing various ρ-values for peroxyoxalate chemiluminescence of several oxalates. J Photochem Photobiol A Chem. 2013;252:222-31
28. Zhang XL, Wu M, Li J, Lan S, Zeng Y, Liu X. et al. Light-enhanced hypoxia-response of conjugated polymer nanocarrier for successive synergistic photodynamic and chemo-therapy. ACS Appl Mater Interfaces. 2018;10:21909-19
29. Li J, Wang X, Zheng D, Lin X, Wei Z, Zhang D. et al. Cancer cell membrane-coated magnetic nanoparticles for MR/NIR fluorescence dual-modal imaging and photodynamic therapy. Biomater Sci. 2018;6:1834-45
30. Zhang D, Wu M, Cai Z, Liao N, Ke K, Liu H. et al. Chemotherapeutic drug based metal-organic particles for microvesicle-mediated deep penetration and programmable pH/NIR/hypoxia activated cancer photochemotherapy. Adv Sci. 2018;5:1700648
31. Kelemen LE. The role of folate receptor α in cancer development, progression and treatment: cause, consequence or innocent bystander? Int J Cancer. 2006;119:243-50
32. Lu Y, Sega E, Leamon CP, Low PS. Folate receptor-targeted immunotherapy of cancer: mechanism and therapeutic potential. Adv Drug Deliv Rev. 2004;56:1161-76
33. Han K, Wang SB, Lei Q, Zhu JY, Zhang XZ. Ratiometric biosensor for aggregation-induced emission-guided precise photodynamic therapy. ACS Nano. 2015;9:10268-77
34. Chen X, Zhong Z, Xu Z, Chen L, Wang Y. 2′,7′-Dichlorodihydrofluorescein as a fluorescent probe for reactive oxygen species measurement: forty years of application and controversy. Free Radic Res. 2010;44:587-604
35. Agostinis P, Berg K, Cengel K, Foster TH, Girotti AW, Gollnick SO. et al. Photodynamic therapy of cancer: an update. CA Cancer J Clin. 2011;61:250-81
36. Dolmans D, Fukumura D, Jain R. Photodynamic therapy for cancer. Nat Rev Cancer. 2003;3:380-7
37. Chien YH, Chou YL, Wang SW, Huang ST, Liau MC, Chao YJ. et al. Near-infrared light photocontrolled targeting, bioimaging, and chemotherapy with caged upconversion nanoparticles in vitro and in vivo. ACS Nano. 2013;7:8516-28
38. Zhang Y, Chen Y, Li X, Zhang J, Chen J, Xu B. et al. Folic acid-functionalized AIE pdots based on amphiphilic PCL-b-PEG for targeted cell imaging. Polym Chem. 2014;5:3824-30
Author contact
![]() Corresponding authors: X. Liu. E-mail: xiaoloong.liucom and J. Liu. E-mail: drjingfengcom
Corresponding authors: X. Liu. E-mail: xiaoloong.liucom and J. Liu. E-mail: drjingfengcom
Citation styles
APA
Wu, M., Wu, L., Li, J., Zhang, D., Lan, S., Zhang, X., Lin, X., Liu, G., Liu, X., Liu, J. (2019). Self-Luminescing Theranostic Nanoreactors with Intraparticle Relayed Energy Transfer for Tumor Microenvironment Activated Imaging and Photodynamic Therapy. Theranostics, 9(1), 20-33. https://doi.org/10.7150/thno.28857.
ACS
Wu, M.; Wu, L.; Li, J.; Zhang, D.; Lan, S.; Zhang, X.; Lin, X.; Liu, G.; Liu, X.; Liu, J. Self-Luminescing Theranostic Nanoreactors with Intraparticle Relayed Energy Transfer for Tumor Microenvironment Activated Imaging and Photodynamic Therapy. Theranostics 2019, 9 (1), 20-33. DOI: 10.7150/thno.28857.
NLM
Wu M, Wu L, Li J, Zhang D, Lan S, Zhang X, Lin X, Liu G, Liu X, Liu J. Self-Luminescing Theranostic Nanoreactors with Intraparticle Relayed Energy Transfer for Tumor Microenvironment Activated Imaging and Photodynamic Therapy. Theranostics 2019; 9(1):20-33. doi:10.7150/thno.28857. https://www.thno.org/v09p0020.htm
CSE
Wu M, Wu L, Li J, Zhang D, Lan S, Zhang X, Lin X, Liu G, Liu X, Liu J. 2019. Self-Luminescing Theranostic Nanoreactors with Intraparticle Relayed Energy Transfer for Tumor Microenvironment Activated Imaging and Photodynamic Therapy. Theranostics. 9(1):20-33.
This is an open access article distributed under the terms of the Creative Commons Attribution (CC BY-NC) license (https://creativecommons.org/licenses/by-nc/4.0/). See http://ivyspring.com/terms for full terms and conditions.