Theranostics
13.3
Impact Factor
- Current Issue
- Advance Articles
- Volume 16; 2026
- Volume 15; 2025
- Volume 14; 2024
- Volume 13; 2023
- Volume 12; 2022
- Archive
- Cover Images
- Cover Suggestion
- Special Issues
Top
Introduction
Methods
Results
Discussion
Conclusions
Abbreviations
Supplementary Material
Acknowledgements
References
Introduction
Methods
Results
Discussion
Conclusions
Abbreviations
Supplementary Material
Acknowledgements
References
International Journal of Biological Sciences
International Journal of Medical Sciences
 Global reach, higher impact

Theranostics 2019; 9(1):34-47. doi:10.7150/thno.29407 This issue Cite
Research Paper
Loss of ABAT-Mediated GABAergic System Promotes Basal-Like Breast Cancer Progression by Activating Ca2+-NFAT1 Axis
Xingyu Chen1,3*, Qianhua Cao1,3*, Ruocen Liao1,3*, Xuebiao Wu1,3*, Shining Xun2, Jian Huang1, Chenfang Dong1,3 ![]()
1. Department of Pathology and Pathophysiology, and Department of Surgical Oncology (breast center) of the Second Affiliated Hospital, Zhejiang University School of Medicine, Hangzhou 310058, China.
2. Affiliated Hospital of Shaanxi University of Chinese Medicine, Xi'an712000, China
3. Zhejiang Key Laboratory for Disease Proteomics, Zhejiang University School of Medicine, Hangzhou 310058, China.
*These authors contributed equally to this study.
Received 2018-8-22; Accepted 2018-11-16; Published 2019-1-1
Citation:
Chen X, Cao Q, Liao R, Wu X, Xun S, Huang J, Dong C. Loss of ABAT-Mediated GABAergic System Promotes Basal-Like Breast Cancer Progression by Activating Ca2+-NFAT1 Axis. Theranostics 2019; 9(1):34-47. doi:10.7150/thno.29407. https://www.thno.org/v09p0034.htm
Other stylesAbstract

Basal-like breast cancer (BLBC) is the most aggressive subtype with a poor clinical outcome; however, the molecular mechanisms underlying aggressiveness in BLBC remain poorly understood.
Methods: The effects of gamma-aminobutyrate aminotransferase (ABAT) on GABA receptors, Ca2+-NFAT1 axis, and cancer cell behavior were assessed by Ca2+ imaging, Western blotting, immunostaining, colony formation, and migration and invasion assays. We elucidated the relationship between ABAT and Snail by luciferase reporter and ChIP assays. The effect of ABAT expression on BLBC cells was determined by in vitro and in vivo tumorigenesis and a lung metastasis mouse model.
Results: We showed that, compared to other subtypes, ABAT was considerably decreased in BLBC. Mechanistically, ABAT expression was downregulated due to Snail-mediated repression leading to increased GABA production. GABA then elevated intracellular Ca2+ concentration by activating GABA-A receptor (GABAA), which contributed to the efficient activation of NFAT1 in BLBC cells. ABAT expression resulted in inhibition of tumorigenicity, both in vitro and in vivo, and metastasis of BLBC cells. Thus, loss of ABAT contributed to BLBC aggressiveness by activating the Ca2+-NFAT1 axis. In breast cancer patients, loss of ABAT expression was strongly correlated with large tumor size, high grade and metastatic tendency, poor survival, and chemotherapy resistance.
Conclusions: Our findings have provided underlying molecular details for the aggressive behavior of BLBC. The Snail-mediated downregulation of ABAT expression in BLBC provides tumorigenic and metastatic advantages by activating GABA-mediated Ca2+-NFAT1 axis. Thus, our results have identified potential prognostic indicators and therapeutic targets for this challenging disease.
Keywords: ABAT, basal-like breast cancer (BLBC), GABA, Snail, NFAT1
Introduction
Basal-like breast cancer (BLBC) subtype accounts for approximately 10-20% of breast cancers and frequently occurs in younger patients. BLBC tumors are usually of larger size and higher grade with a tendency for recurrence and metastasis and have a poor response to chemotherapy [1, 2]. This subtype is often triple negative—lacks the expression of estrogen receptor (ER), progesterone receptor (PR) and epidermal growth factor receptor 2 (HER2)—which limits the use of targeted treatments such as endocrine and anti-HER2 therapies, often leading to a fatal clinical outcome. Furthermore, BLBC has an increased propensity to metastasize to the brain and lungs, sites that are associated with poor prognosis and short survival [3-7]. Because of its aggressiveness and lack of effective therapeutics, there is a critical need to elucidate the underlying molecular mechanisms and identify molecular targets in BLBC.
Gamma-aminobutyric acid (GABA) is a major inhibitory neurotransmitter in the mammalian central nervous system [8]. The biological effects of GABA are mediated by ionotropic GABA-A receptor (GABAA), a family of ion channels, and by the metabotropic GABA-B receptor (GABAB), which is a G protein-coupled receptor. In addition to functioning as an inhibitory neurotransmitter, it can also operate as a trophic factor during neural development to regulate the proliferation, migration, differentiation, and death of neuronal cells [9]. Additionally, it has become clear that GABA and GABA receptors are also present in non-neuronal tissues [10]. Studies have revealed the involvement of GABA in cancer growth and metastasis. GABA has inhibitory effects on colon cancer [11], gastric cancer [12], and hepatocellular carcinoma [13]. GABA has also been shown to promote pancreatic cancer growth through upregulation of the pi-subunit expression of the GABAA receptor [14], and elevated levels of GABA and glutamate decarboxylase (GAD) were observed in metastatic prostate cancer [15]. These findings suggest a critical role for the GABAergic system in cancer and enforce the need for further evaluation of this pathway in distinct types of cancers.
GABA levels are maintained by its biosynthetic and catabolic pathways. Much attention has been focused on modulation of the biosynthetic pathway of GABA, whereas its catabolic pathway is less studied but may play an equally critical role in the GABAergic system in tumor cells. Gamma-aminobutyrate aminotransferase (ABAT), a key enzyme responsible for the catabolism of GABA, catalyzes the transfer of the amino group of GABA to α-ketoglutarate, producing succinic semialdehyde and L-glutamate. Patients with ABAT deficiency display elevated GABA levels along with a severe phenotype including psychomotor retardation, lethargy, refractory seizures, hypotonia, and hyperreflexia [16, 17] attributed to the loss of ABAT-mediated disruption of the GABAergic system. In this study, we report that loss of ABAT expression occurs specifically in BLBC and predicts poor prognosis. Loss of ABAT expression promotes tumorigenic and metastatic potential of BLBC cells by activating GABA-mediated Ca2+-NFAT1 axis. Our study provides a molecular understanding of how loss of ABAT contributes to tumor growth and metastasis in BLBC.
Methods
Plasmids and antibodies
Human ABAT and Snail genes were amplified from MCF7 and MDA-MB-231 cDNA libraries, respectively, and sub-cloned in pBABE-Puro.
Antibodies against ABAT, G9a, H3K9me2, H3K9Ac, and NFAT1 were purchased from Abcam. Antibodies against Vimentin and Snail were acquired from Neomarkers and Cell Signaling Technology, respectively. Antibody for E-cadherin was purchased from BD Transduction Laboratories. Antibodies for mCherry and β-actin were obtained from Sigma-Aldrich.
Cell culture
MDA-MB-231 and SUM159 cells were grown in DMEM/F12 supplemented with 10% fetal bovine serum (FBS). BT-549, BT-483, MCF7, and HCC1428 cells were grown in RPMI1640 plus 10% FBS. For establishing stable transfectants with ABAT expression, BLBC cells were transfected with pBABE-ABAT; stable clones were selected with puromycin (300 ng/mL) for 4 w.
Quantitative real-time PCR
Total RNA was isolated using RNeasy Mini kit (Qiagen) according to the manufacturer's instructions. Specific quantitative real-time PCR experiments were performed using SYBR Green Power Master Mix following the manufacturer's protocol (Applied Biosystems).
Luciferase reporter assay
The assay was performed according to the procedure described previously [18, 19]. All experiments were performed in triplicate.
Chromatin immunoprecipitation (ChIP)
ChIP assays were performed as described previously [18, 19]. The following primers were used for ChIP assays: 5'- CAAATACCTCTAGAAAGCTGT -3′ and 5'- GAAGGTGCCTTTCTACCGTTG -3′ for the ABAT promoter. The cells were prepared to perform ChIP assay with the Imprint ChIP Kit (Sigma) according to the manufacturer's instructions and as described recently [18].
Ca2+ imaging
MDA-MB-231 cells plated on glass bottom cell culture dishes were loaded with the calcium-sensitive fluorescent dye Fluo-4/AM (4 mM; Invitrogen) in Hank's Balanced Salt Solution containing 0.02% pluronic acid (Sigma) for 45 min at 37 °C. GABA (Sigma), CGP (Santa Cruz), picrotoxin (Santa Cruz) and cyclopiazonic acid (CPA; Sigma) were applied at concentrations of 2 mM, 10 μM, 10 μM, and 10 μM, respectively. The Ca2+-free buffer contained 1 mM EDTA. Fluorescence was measured by an Olympus Confocal Laser Scanning Microscope (DU-897D-CS0) using MetaMorph software. Serial scanning was performed at 488/530 nm excitation/emission wavelengths at 1 s intervals. Fluorescence intensity changes (F%) were shown as the percentage of baseline fluorescence.
HPLC
The cells were washed twice with PBS and suspended in 0.4 M perchloric acid for 10 min, and then supernatants were collected by centrifugation. Supernatants were reacted with 1-dimethyl aminonaphthalenesulfonyl chloride (10 g/L in acetone) at 80 ℃ and terminated by adding 100 μL acetic acid (1 M in acetone). After filtering, supernatants were subjected to HPLC system using C18 column (5 μm, 4.6 × 250 mm). Chromatography was carried out with 42% methanol and 58% 0.1 M sodium acetate (v/v) containing 1% tetrahydrofuran and 14 mM 1-heptanesulfonic acid sodium salt. The flow rate was 1 mL/min and the detection was performed at 360/500 nm.
Immunostaining
Cells were grown on glass bottom cell culture dishes and incubated with NucBlue™ Live ReadyProbes™ Reagent (Invitrogen) for 25 min at room temperature. After three washes with HBSS, fluorescence was measured using an Olympus Confocal Laser Scanning Microscope (OLYMPUS IX83-FV3000-OSR).
Colony formation assay
Colony formation assay was performed using double-layer soft agar in 24-well plates with a top layer of 0.35% agar and a bottom layer of 0.7% agar. Cells were seeded in 24-well plates in desired medium and cultured at 37 °C for 15 to 20 days, and the colonies were stained and counted.
Migration and invasion assays
Migration and invasion assays were performed as described previously [18, 19]. All experiments were repeated at least twice in triplicate. Statistical analysis was performed using the Student's t-test; a p-value of <0.05 was considered significant.
Tumorigenesis assay and lung metastasis model
Animal experiments were performed according to procedures approved by the Institutional Animal Care and Use Committee at Zhejiang University. To examine the effect of ABAT on tumorigenesis, female SCID mice (5-8 w old) were injected with 1×10⁶ exogenous ABAT-overexpressing cells on the left flank and vector control cells on the right flank. Tumor formation was monitored every 2 to 4 days for 30 days. Tumor size and weight were measured. To test the effect of ABAT on tumor metastasis, SCID mice were injected via tail vein with MDA-MB-231 cells (1×10⁶ cells/mouse) with stable empty vector or ABAT overexpression (6 mice/group). After 4 w, lung metastasis was analyzed by an IVIS-100 imagining system (Xenogen). Mice were sacrificed and lung metastatic nodules were detected in paraffin-embedded sections by staining with hematoxylin and eosin. Data were analyzed using the Student's t-test; a p-value <0.05 was considered significant.
Statistical analysis
Results are expressed as mean ± SD or SEM as indicated. Comparisons were made by the two-tailed Student's t-test or one-way ANOVA. Correlations between ABAT and Snail were analyzed by Pearson's correlation method and Spearman's rank correlation test. Survival curves were plotted using the Kaplan-Meier method, and differences were analyzed by the log-rank test. In all statistical tests, p < 0.05 was considered statistically significant.
Results
ABAT expression is downregulated in BLBC subtype
We recently reported that several metabolic genes—fructose-1,6-biphosphatase (FBP1), aldo-keto reductase 1 member B1 (AKR1B1), and urine diphosphate-galactose ceramide galactosyltransferase (UGT8)—were associated with BLBC aggressiveness [20-22]. To explore other clinically relevant determinants for BLBC, we analyzed gene expression profiles of breast cancer in multiple publicly available cDNA microarray datasets, GSE1456, GSE25066, NKI295, TCGA, and MEBTABRIC, which contain 159, 508, 295, 1215, and 1904 breast cancer patients, respectively [23-25]. Several known genes previously shown to have critical roles in BLBC exhibited remarkable differences between BLBC and other subtypes, such as lactate dehydrogenase B (LDHB), AKR1B1, UGT8, and FBP1. Notably, in contrast to other subtypes, ABAT expression was markedly downregulated in BLBC (Figure 1A and Figure S1A). Consistent with this observation, ABAT protein expression was also significantly decreased in BLBC by proteogenomic analysis of a TCGA dataset that contains 105 breast tumor samples [26] (Figure 1B). To confirm this observation, we collected freshly frozen breast tumor tissues from 21 cases of luminal subtype and 9 cases of the triple-negative subtype that have a significant overlap with BLBC. ABAT expression was elevated in the luminal subtype of breast cancers but significantly downregulated in triple-negative breast cancer (Figure 1C and Figure S1B). To better characterize the link between ABAT and basal subtype, we evaluated ABAT expression in four other gene expression datasets, GSE12777, GSE10890, E-TABM-157, and E-MTAB-181, containing 51, 52, 51, and 56 breast cancer cell lines, respectively [27-29]. Consistently, loss of ABAT was correlated with the basal subtype of breast cancer cell lines (Figure 1D). Subsequently, we confirmed these findings by semi-quantitative RT-PCR or quantitative real-time PCR in a panel of breast cancer cell lines containing 5 luminal and 5 BLBC cell lines. ABAT mRNA expression was consistently much lower in BLBC cells than in luminal cells (Figure 1E-F and Figure S1C). We also detected loss of expression of the epithelial marker E-cadherin but elevated levels of mesenchymal markers vimentin and Snail in BLBC cells. Like E-cadherin, ABAT protein was also lost in BLBC cell lines, whereas it was elevated in luminal cell lines (Figure 1G and Figure S1D). Thus, our data confirmed that loss of ABAT expression was primarily restricted to BLBC, underscoring its underlying functions in this subtype of breast cancer.
Figure 1
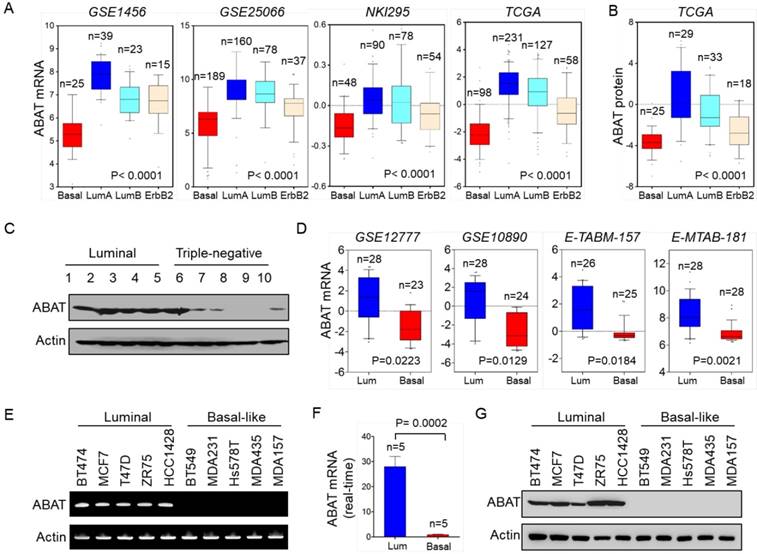
Downregulation of ABAT expression highly correlates with BLBC. (A) Box-plots indicate ABAT mRNA expression in different subtypes of breast cancer from four datasets (GSE1456, GSE25066, NKI295 and TCGA). (B) Box-plots indicate ABAT protein expression in different subtypes of breast cancer from the TCGA dataset. (C) Expression of ABAT was examined by Western blotting in tumor samples from five cases each of luminal and triple-negative breast cancers. Full analyses of 30 cases of tumor samples are presented in Figure S1B. (D) Box-plots indicate ABAT expression in luminal and BLBC cell lines from four datasets (GSE12777, GSE10890, E-TABM-157 and E-MTAB-181). (E-F) Expression of ABAT mRNA was analyzed by either semi-quantitative RT-PCR (E) or quantitative real-time PCR (F) in a representative panel of breast cancer cell lines. (G) Expression of ABAT in cells from (E) was examined by Western blotting.
ABAT expression is downregulated by Snail-mediated repression
While investigating the expression of ABAT in BLBC, we noticed inverse expression patterns of ABAT and Snail in breast cancer cell lines (Figure S1D). To confirm this observation, we examined the expression of ABAT and Snail in the TCGA dataset. As expected, ABAT expression negatively correlated with Snail expression (Figure 2A). We also analyzed Snail expression in different subtypes of breast cancer and found that, contrary to ABAT, Snail was significantly upregulated in BLBC in the TCGA dataset (Figure 2B). To elucidate the causal relationship between ABAT and Snail, we analyzed ABAT expression in MCF7 cells with ectopic Snail expression in two previous datasets (GSE29672 and GSE58252) [30, 31] and observed dramatic downregulation of ABAT expression by Snail (Figure 2C). Next, we expressed Snail in three luminal breast cancer cell lines, BT483, HCC1428, and MCF7. As expected, Snail expression significantly downregulated ABAT expression in these cell lines (Figure 2D-E). These results indicated that Snail, as a transcriptional repressor, may suppress ABAT expression through direct transcriptional regulation.
We next investigated whether ABAT expression is regulated directly by Snail. Analysis of the DNA sequence in the ABAT promoter revealed that it contains four putative Snail-binding E-boxes (CAGGTG) from -3300 bp to the transcription start site (TSS) (Figure 2F). To determine whether these E-boxes are crucial for Snail-mediated transcriptional repression, we cloned the human ABAT promoter and created several deletion mutants of promoter-luciferase constructs based on the location of the E-boxes, including FL1 (-3300 bp), FL2 (-2901 bp), FL3 (-2489 bp), and FL4 (-1293 bp) (Figure 2F). Upon expression of FL1 in BT483, HCC1428, and MCF7 cells, Snail significantly repressed ABAT promoter luciferase activity (Figure 2G). Notably, the constructs without the regions between -3300 bp and -1293 bp still maintained low reporter activity induced by Snail, indicating that the E-box between -1293 bp and TSS might be critical for Snail-mediated ABAT repression (Figure 2H). To test this, we introduced a point mutation in the E-box at -728 bp. As anticipated, a mutation in this E-box (mut) remarkably abolished Snail-mediated ABAT repression (mut vs. FL1) (Figure 2I), suggesting that Snail represses the ABAT promoter in an E-box-dependent fashion and that the E-box at -728 bp is required for Snail-induced transcriptional repression.
Figure 2
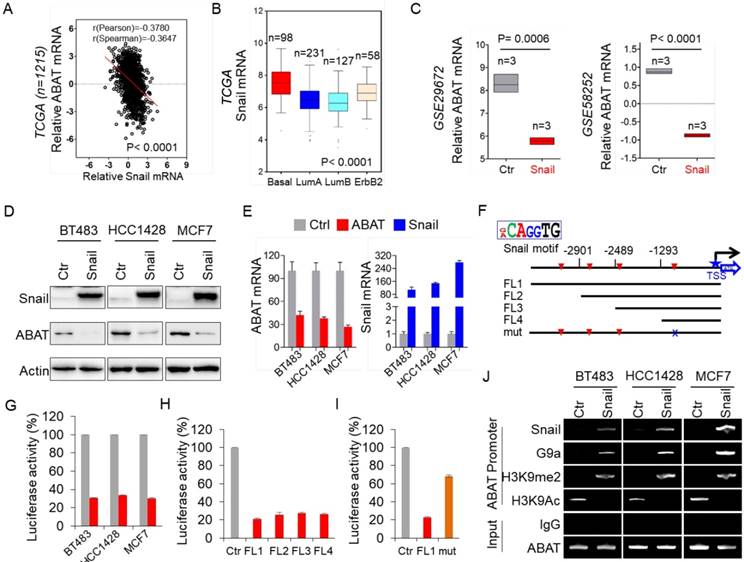
Loss of ABAT results from Snail-mediated transcriptional repression. (A) Analysis of TCGA dataset for the expression of ABAT and Snail. The relative level of ABAT was plotted against that of Snail. (B) Box-plots indicate Snail mRNA expression in different subtypes of breast cancer from the TCGA dataset. (C) Analysis of GSE29672 and GSE58252 datasets for ABAT mRNA expression in MCF7 cells with or without Snail expression. (D-E) Expression of ABAT and Snail was analyzed by Western blotting (D) and quantitative real-time PCR (E) in BT483, HCC1428 and MCF7 cells infected with empty vector or Snail-expressing vector. (F) Schematic diagram showing positions of potential Snail-binding E-boxes in the ABAT promoter. ABAT promoter luciferase constructs and mutated derivative are also shown. (G) ABAT promoter luciferase construct (FL1) was co-expressed with empty vector or Snail-expressing vector in BT483, HCC1428 and MCF7 cells. After 48 h, luciferase activities were analyzed (mean ± SD in three separate experiments). (H) ABAT promoter luciferase constructs (FL1, FL2, FL3, and FL4) were co-expressed with empty vector or Snail-expressing vector in HEK-293T cells. Luciferase activities were analyzed as in (G). (I) ABAT promoter luciferase construct (FL1) as well as its mutant (mut) were co-expressed with empty vector or Snail-expressing vector in HEK-293T cells. Luciferase activities were analyzed as in (G). (J) The association of Snail and G9a, and the levels of H3K9me2 and H3K9Ac in the ABAT promoter in cells from (D) were analyzed by ChIP.
To determine whether Snail targets ABAT directly, we performed chromatin immunoprecipitation (ChIP) assays in BT483, HCC1428, and MCF7 cells with Snail overexpression. The results showed that Snail directly bound to the ABAT promoter (Figure 2J), indicating that ABAT is a direct target of Snail. Our previous study showed that Snail-G9a complex binds to the E-cadherin promoter for epigenetic silencing of its expression [20]. We speculated that this complex might repress ABAT expression by binding to its promoter. Indeed, the downregulation of ABAT was associated with increased H3K9me2 and decreased H3K9 acetylation in the ABAT promoter in breast cancer cell lines (Figure 2J). We also detected a dramatic enrichment of G9a, a major methyltransferase responsible for H3K9me2, in the ABAT promoter (Figure 2J), suggesting involvement of the Snail-G9a complex in the up-regulation of H3K9me2 in the ABAT promoter. The increased Snail, G9a, and H3K9me2 at the ABAT promoter correlated well with the downregulation of ABAT expression (Figure 2D, J). Together, these data indicated that Snail-mediated epigenetic modification is critical for silencing ABAT expression.
ABAT expression reduces GABA level and enhances breast cancer cell migration and invasion
GABA is a substrate of ABAT in the GABA catabolic pathway (Figure 3A). We first analyzed the association of GABA with aggressive breast cancer using the previous metabolomics data [32] and found that the GABA level was significantly elevated in BLBC and ER-negative breast cancer (Figure 3B). To explore the association between GABA and ABAT expression levels, we generated stable clones with the ABAT expression vector or the empty vector in MDA-MB231, SUM159 and BT549 cells (Figure 3C). Subsequent analysis showed that ABAT expression caused a remarkable decrease in GABA level (Figure 3D), indicating that ABAT is required for decreasing its expression in breast cancer cells. We also examined the effect of ABAT expression, vigabatrin (an inhibitor of ABAT), and GABA on breast cancer cell proliferation, migration, and invasion. There was no significant effect on the growth of MDA-MB231, SUM159, and BT549 cells by all three treatments (Figure 3E and Figure S2A). However, ABAT expression markedly repressed the migration and invasion of all three breast cancer cell lines, whereas vigabatrin and GABA significantly restored the decreased migration and invasion of these cells with stable ABAT expression (Figure 3F-G and Figure S2B-C). These data suggest a key role of GABA in the loss of ABAT-mediated migratory and invasive ability in breast cancer cells.
ABAT expression downregulates intracellular Ca2+ concentration and represses NFAT1 activation
In immature neurons, GABA increased the intracellular Ca2+ concentration by activating GABAA receptor [33-35]. We examined the intracellular Ca2+ concentration in MDA-MB231 cells by monitoring Ca2+ changes. GABA caused a sharp increase of fluorescence in these cells, indicating a quick induction of transient Ca2+ followed by long-lasting oscillations (Figure 4A-B). To investigate whether activation of GABA receptors is critical for Ca2+ changes in tumor cells, we determined the effect of picrotoxin and CGP, inhibitors of GABAA and GABAB, respectively, on Ca2+ entry. Treatment with picrotoxin (10 μM) almost completely blocked the GABA-mediated Ca2+ rise, whereas application of CGP (10 μM) only caused a partial decrease of intracellular Ca2+ concentration in MDA-MB231 cells (Figure 4A-B), indicating that GABA functions largely via GABAA-mediated signaling. To determine whether the Ca2+ rise was caused by Ca2+ influx through voltage-gated Ca2 + channels (VGCCs) or intracellular Ca2+ store release, we used the specific inhibitor CPA, a sarco-endoplasmic reticulum Ca2+-ATPase (SERCA) blocker. In the presence of CPA (10 μM), GABA evoked partially reduced transient Ca2+ (Figure 4A-B). When Ca2+ was omitted from the buffer, GABA-evoked transient Ca2+ was completely blocked by CPA or picrotoxin but slightly reduced by CGP (Figure S3A-B). These data suggest that both Ca2+ influx and intracellular Ca2+ store release trigger GABA-mediated Ca2+ rise, and intracellular Ca2+ store release is controlled mainly by GABAA-mediated signaling. We examined the basal Ca2+ concentration in MDA-MB231 and BT549 cells transfected with stable empty vector or ABAT expression vector. Remarkably, ABAT expression reduced the intracellular Ca2+ concentration, providing evidence for the loss of ABAT-mediated Ca2+ rise (Figure 4C-D).
To explore the association of ABAT with basal Ca2+ concentration, we first analyzed Ca2+ concentration in four luminal and BLBC cell lines. The Ca2+ concentration was much higher in BLBC cells without ABAT expression than in luminal cells with endogenous ABAT-expression (Figure 5A and Figure S4A), confirming that loss of ABAT expression contributes to Ca2+ rise. Nuclear factors 1-4 (NFAT1-4) of activated T cells are important Ca2+ sensors and NFAT1 and NFAT2 are activated in aggressive breast cancer [36-41]. To explore the association of ABAT-mediated Ca2+ changes with NFAT1 and NFAT2, we determined the effect of ABAT on nuclear translocation of both factors. Our results showed that ABAT expression led to a significant decrease in nuclear translocation of NFAT1 in MDA-MB231 and SUM159 cells as detected by immunostaining-confocal analysis (Figure 5B-C). Similar results were observed by Western blotting analysis (Figure 5D). However, ABAT expression did not significantly change the nuclear entry of NFAT2 (Figure S4B-C), suggesting that ABAT functions mainly via NFAT1-mediated signaling.
Figure 3
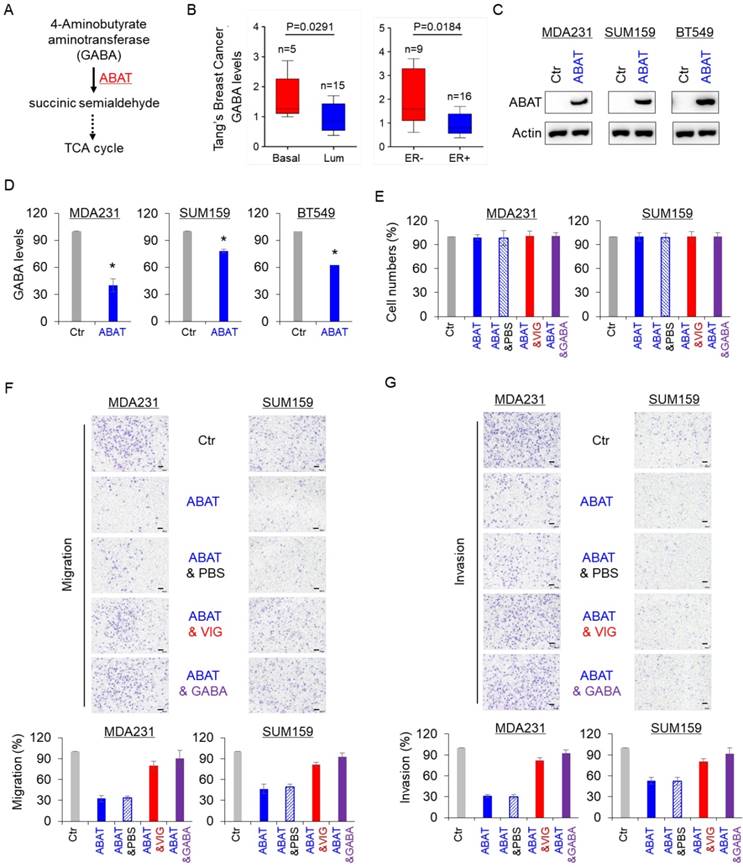
ABAT decreases intracellular GABA levels and inhibits breast cancer cell migration and invasion. (A) GABA catabolic pathway. (B) GABA level was analyzed in BLBC versus luminal, and ER- versus ER+ tumors from Tang's metabolomics dataset. (C) Stable ABAT expression was established in MDA-MB231, SUM159, and BT549 cells. ABAT expression in these cells was analyzed by Western blotting. Actin was used as a loading control. (D) The level of GABA was measured in MDA-MB231, SUM159, and BT549 cells with stable empty vector or ABAT expression. The level of GABA is shown in the bar graph (mean ± SD of three separate experiments). *p< 0.01 by Student's t-test. (E) Growth of MDA-MB231 and SUM159 cells with stable empty vector or ABAT expression and of ABAT-expressing MDA-MB231 and SUM159 cells treated with or without vigabatrin (0.2 mM) or GABA (10 mM) was measured by cell-count assay for 2 days. Data are shown as a percentage of control cells (mean ± SD in two independent experiments). No significant change was observed by Student's t-test. (F-G) Migratory ability (F) and invasiveness (G) of MDA-MB231 and SUM159 cells with stable empty vector or ABAT expression and of ABAT-expressing MDA-MB231 and SUM159 cells treated with or without vigabatrin (0.2 mM) or GABA (10 mM) were analyzed. Scale bar = 100 μm (right). The percentage of migratory and invasive cells is shown in the bar graph (mean ± SD of three separate experiments). *p< 0.01 by Student's t-test.
Figure 4
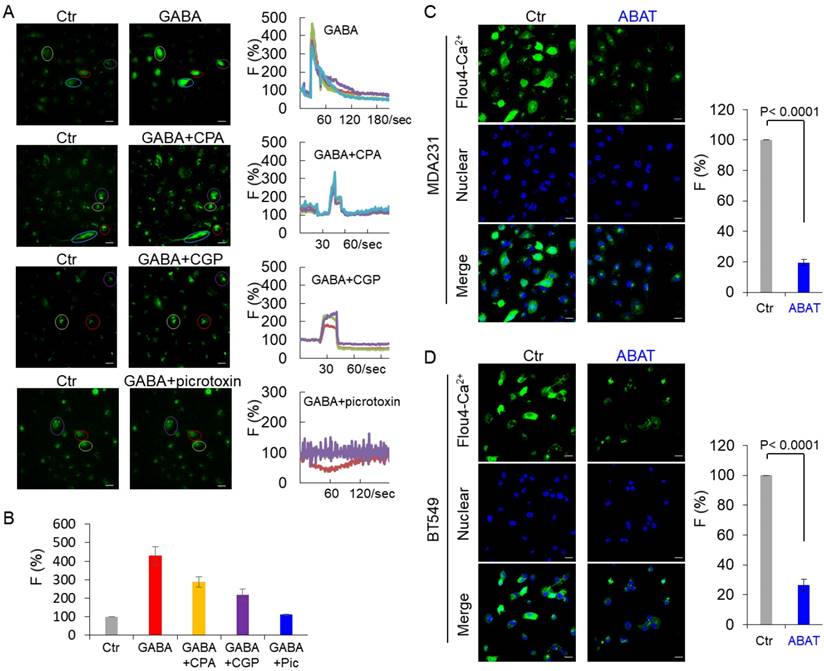
ABAT expression downregulates intracellular Ca2+ concentration. (A) Representative recordings of Ca2+ changes following treatment with GABA (2 mM) or CGP (10 μM), picrotoxin (10 μM) or CPA (10 μM) followed by co-application of GABA (2 mM) are shown in MDA-MB231 cells. Scale bar = 30 μm (right). (B) Average GABA-evoked changes in fluorescence intensities [F (%)] were analyzed for different drug treatments as indicated in (A). (C-D) Representative recordings of Ca2+ changes of MDA-MB231 (C) and BT549 cells (D) with stable empty vector or ABAT expression are shown (left panel). Scale bar = 30 μm (right). Average changes in fluorescence intensities were analyzed in these cells (right panel).
ABAT suppresses tumorigenicity of breast cancer
Given the strong association of ABAT loss with GABAergic signaling in BLBC, we assessed the functional role of ABAT in tumor formation using the soft-agar assay. Although ABAT expression did not significantly affect the proliferation of MDA-MB231, SUM159, and BT549 cells (Figure 3E), it resulted in a remarkable decrease in colony formation of these cells, which was significantly restored by vigabatrin in cells with stable ABAT expression (Figure 6A and Figure S5A). To test the in vivo tumorigenicity, we performed tumor xenograft experiments in which female SCID mice were injected with MDA-MB231 and SUM159 cells with the stable empty vector or ABAT expression vector. As shown in Figure 6B-C, MDA-MB231 and SUM159 cells with stable ABAT expression led to significantly reduced tumor growth compared with their corresponding vector control cells. We extended our observations to a clinicopathologically relevant context by exploring a possible association between ABAT expression and clinical specimens. We first analyzed ABAT expression and its correlation with tumor size of breast cancer patients in NKI295 and MEBTABRIC datasets. Patients were divided into two groups according to the primary tumor size. There was a significant association between small tumor size and ABAT expression (Figure 6D). We then evaluated the relationship between ABAT expression and histological grades of the tumors in MEBTABRIC, GSE25066, NKI295, GSE7390, and GSE1456 datasets in which tumors had been scored for tumor grade. We segregated patients into three groups according to histological grades of tumors. ABAT expression was present predominantly in grade 1 and 2 tumors but to a much lesser extent in grade 3 tumors (Figure 6E and Figure S5B). These data reinforced the notion that loss of ABAT expression is critical for tumorigenicity and functions as an important mediator of tumor aggressiveness.
Figure 5
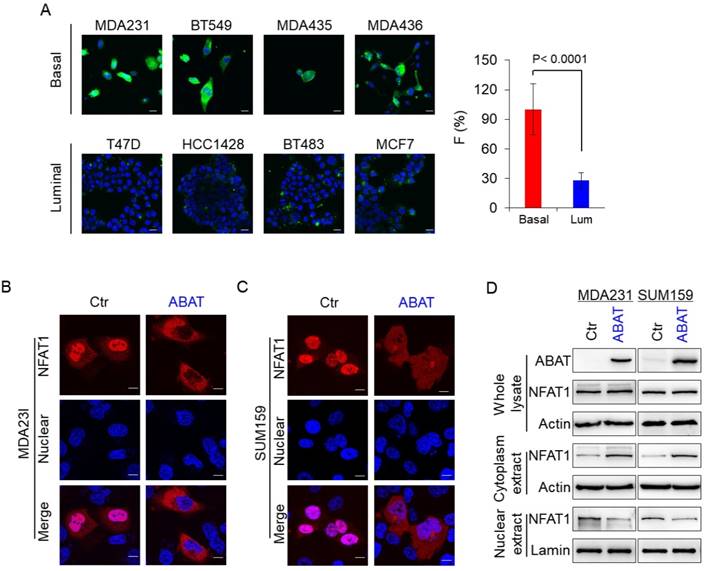
ABAT represses NFAT1 activation by downregulating intracellular Ca2+ concentration. (A) Representative images of intracellular Ca2+ concentration in 4 basal and 4 luminal cell lines are presented. Average changes in fluorescence intensities were analyzed in these cells (right panel). Scale bar = 30 μm (right). (B-C) Nuclear translocation of NFAT1 was measured by immunofluorescent staining in MDA-MB231 (B) and SUM159 cells (C) with stable empty vector or ABAT expression. Scale bar = 10 μm (right). (D) Expression of NFAT1 and ABAT was analyzed by Western blotting in MDA-MB231 (left panel) and SUM159 cells (right panel) with stable empty vector or ABAT expression.
ABAT suppresses breast cancer metastasis
Because NFAT1 can promote cell migration, invasion, and metastasis, and because loss of ABAT is associated with NFAT1 activation, we speculated that loss of ABAT expression might be critical for breast cancer metastasis. To test this notion, we first tested whether ABAT expression affected tumor metastasis in a xenograft model in which MDA-MB231 cells were injected via the tail vein to generate pulmonary metastases. Remarkably, ABAT expression suppressed lung metastasis (Figure 7A). Next, we sought to elucidate the clinical relevance of this observation. We first assessed whether ABAT expression was correlated with metastasis in the GSE25066 dataset. Patients were divided into two groups according to their metastatic status. Tumors with low ABAT expression had a higher probability of developing metastasis than those with high ABAT expression (Figure 7B). We then evaluated if there was a correlation between ABAT expression and metastatic sites in the GSE12276 dataset with 204 breast cancer patients [42]. Consistent with the metastatic tendency of BLBC, primary tumors with low ABAT expression preferentially metastasized to the brain and lungs (Figure S6A).
Given the critical function of ABAT expression in breast cancer, we performed Kaplan-Meier analyses to determine whether ABAT is a prognostic marker for clinical outcomes by analyzing NKI295 and GSE25066 datasets [23, 24]. Patients were divided into two groups based upon ABAT expression levels, with low ABAT expression having shorter overall (OS), relapse-free (RFS), and distant metastasis-free survival (DMFS) (Figure 7C and Figure S6B). We also used an aggregate breast cancer dataset to determine its clinical relevance [43], showing that tumors with low ABAT expression exhibited shorter OS, RFS, and DMFS (Figure 7D). A similar result was observed by analyzing RFS in BLBC patient samples of this dataset (Figure S6C). We then determined whether ABAT expression was associated with chemotherapy sensitivity in the GSE25066 dataset in which patients were treated with chemotherapy containing sequential taxane and anthracycline-based regimens. A significant trend was observed between reduced ABAT expression and chemotherapy resistance (Figure 7E). These data suggest that ABAT expression is potentially useful in prognostic stratification of patients with breast cancer.
Figure 6
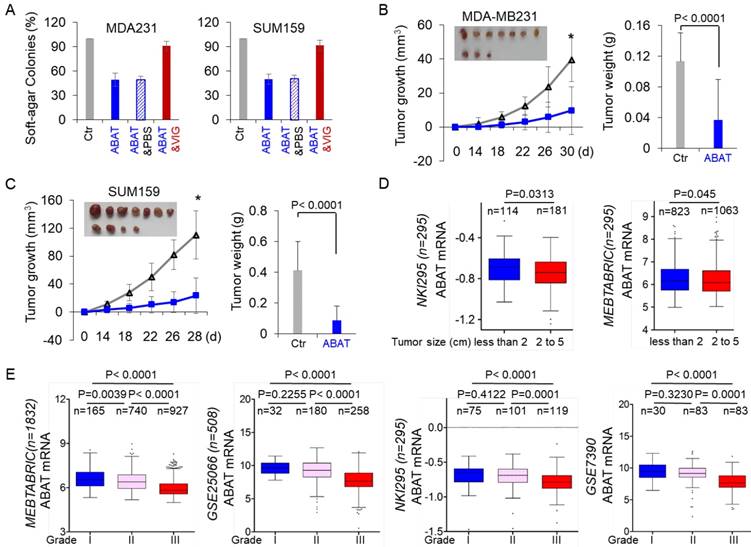
ABAT suppresses tumorigenicity in vitro and in vivo. (A) Soft-agar assay was performed using MDA-MB231 and SUM159 cells with stable empty vector or ABAT expression as well as ABAT-expressing MDA-MB231 and SUM159 cells treated with or without vigabatrin (0.2 mM). Data are presented as a percentage of empty vector cell lines (mean ± SD of three separate experiments). *p< 0.01 by Student's t-test. (B-C) MDA-MB231 (B) and SUM159 (C) cells with stable empty vector or ABAT expression were injected into the mammary fat pad of SCID mice. The growth of tumors was monitored every two days. Tumor size and weight were recorded. Data are presented as mean ± SEM of eight mice. *p< 0.001. (D) Box-plots indicate ABAT expression in different tumor sizes of breast cancer from NKI295 and MEBTABRIC datasets. (E) Box-plots indicate ABAT expression in different histological grades of breast cancer from MEBTABRIC, GSE25066, NKI295, and GSE7390 datasets.
Discussion
ABAT expression is specifically down-regulated in BLBC, the most aggressive subtype of breast cancer. Our study provides several mechanistic and clinical insights into the essential role of ABAT loss in BLBC aggressiveness by elucidating the upstream and downstream molecular events leading to decreased levels of ABAT and consequently activating the Ca2+-NFAT axis.
Snail-mediated repression leads to loss of ABAT
Snail is a key transcriptional repressor that binds to the E-box motif (CAGGTG) controlling cell proliferation, migration and metastasis, and therapeutic response [44, 45]. Furthermore, Snail is highly expressed in BLBC [18, 20, 46, 47], suggesting it is a master regulator of the BLBC phenotype. Correlation analysis in a large breast cancer gene expression dataset demonstrated a negative correlation between ABAT and Snail expression. Interestingly, ectopic expression of Snail in breast cancer cells significantly repressed ABAT expression. Our data identified Snail as a direct transcriptional repressor of ABAT. We recently showed that Snail formed a complex with H3K9 methyltransferase G9a, which is required for Snail-mediated H3K9me2 on the E-cadherin promoter in BLBC cells [18]. Consistent with this finding, Snail recruited G9a to ABAT promoter for H3K9m2 to directly inhibit the transcription of ABAT. Our data indicated that Snail-mediated epigenetic modification is critical for downregulation of ABAT expression in BLBC.
Figure 7
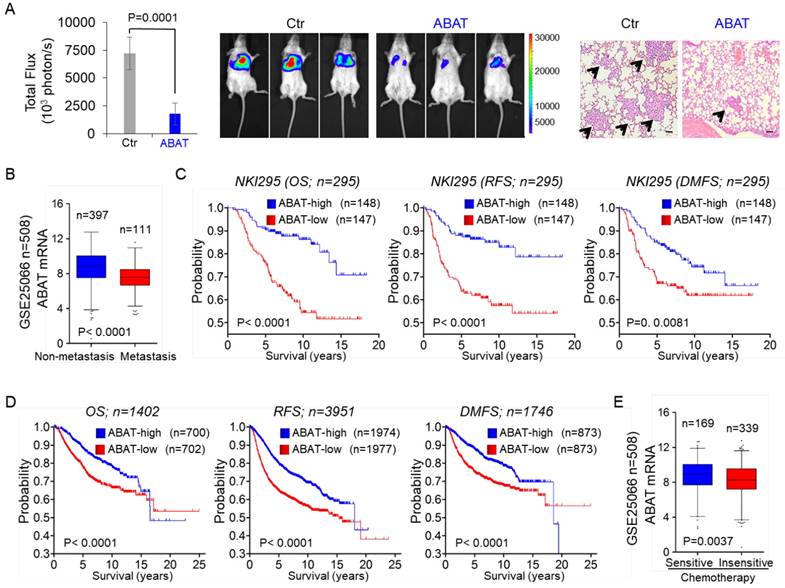
ABAT suppresses breast cancer cell metastasis in vivo and low ABAT expression predicts poor clinical outcome. (A) MDA-MB231 cells with stable empty vector or knockdown of ABAT expression were injected into SCID mice via the tail vein. After 4 weeks, lung metastases were quantified using bioluminescence imaging (mean of 8 animals ± SEM) (left). Representative bioluminescence images from each group are shown (middle). Mice were also sacrificed; the paraffin-embedded sections from lung metastatic specimens were stained with hematoxylin and eosin. Scale bar = 100 μm (right). (B) Analysis of ABAT expression in breast cancer patients with or without metastasis from the GSE25066 dataset. (C) Kaplan-Meier survival analysis for OS, RFS, and DMFS of patients in the NKI295 dataset according to ABAT expression status. The p value was determined using the log-rank test. (D) Kaplan-Meier survival analysis for OS, RFS, and DMFS of patients in an aggregate breast cancer dataset according to ABAT expression status. The p value was determined using the log-rank test. (E) Analysis of GSE25066 dataset for the relationship between ABAT expression and chemotherapy sensitivity.
Loss of ABAT expression activates Ca2+-NFAT1 axis
It has been reported that ABAT expression is downregulated in ER-negative breast cancer [48, 49]. In this study, we extended this observation and found low ABAT expression and high GABA levels in BLBC. Aberrant GABA levels have been described in many tumor tissues such as neuroblastoma, colorectal, ovarian, and pancreatic carcinomas [14, 15, 50], but the underlying mechanisms remain unclear. We showed that BLBC, compared with other subtypes of breast cancers, had significantly elevated GABA content due to loss of ABAT expression, which was consistent with the previous observation that patients with ABAT deficiency had increased GABA production [16, 17]. When the tricarboxylic acid cycle was inhibited, GABA could function as a trophic source to confer a survival advantage for cells through GABA shunt [51]. However, even if tumor cells had relatively high GABA production, it was not sufficient for cancer cells proliferation [52]. These studies suggest that loss of ABAT expression regulates BLBC aggressiveness by activating GABAergic signaling.
The altered Ca2+ signaling was associated with critical events during tumor progression, such as proliferation, migration, invasion, and metastasis [53]. In immature neurons, GABA activated GABAA to produce sufficient depolarization to elevate the intracellular Ca2+ concentration by activating voltage-dependent Ca2+ channels [33-35]. Consistent with this notion, loss of ABAT expression mediated intracellular Ca2+ rise through activation of GABAA because picrotoxin, an inhibitor of GABAA, almost completely blocked GABA-mediated Ca2+ rise. Additionally, the intracellular Ca2+ rise could be partially inhibited in the presence of SERCA blocker but could be almost entirely blocked after Ca2+ was omitted from the buffer, indicating that loss of ABAT-mediated intracellular Ca2+ rise was due to Ca2+ influx through VGCCs and intracellular Ca2+ store release.
Ca2+ signaling functions in cancer cells through upregulating oncogenes and/or downregulating tumor suppressors. NFAT, as a Ca2+ sensor, has a remarkable ability to sense dynamic changes of intracellular Ca2+ and frequency of Ca2+ oscillations in cells [54]. NFAT proteins are phosphorylated and reside in the cytoplasm in resting cells; upon stimulation by Ca2+, they are dephosphorylated and translocate to the nucleus where they are transcriptionally active, thus providing a direct and important link between intracellular Ca2+ signaling and downstream gene expression. The oncogenic potential of NFAT1 proteins has been documented by their involvement in controlling migration and invasion of tumor cells [38-41]. Importantly, NFAT1 is constitutively activated in triple-negative breast cancer and promotes tumorigenesis and metastasis [36, 37]. Indeed, in our study, basal Ca2+ rise and nuclear translocation of NFAT1 were observed in BLBC cells. Consistently, ectopic ABAT expression in BLBC cells suppressed tumorigenicity and metastasis in vitro and in vivo by keeping NFAT1 in a heavily inactive state. These data support the crucial role of ABAT loss-mediated Ca2+-NFAT1 axis in the aggressive behavior of BLBC.
Taken together, ABAT expression was downregulated due to Snail-mediated repression. Loss of ABAT expression then resulted in Ca2+ rise by activating the GABA receptor, which contributed to the activation of NFAT1 in BLBC cells. These findings provide a link between loss of ABAT expression and remodeling of Ca2+-NFAT signaling that facilitates BLBC progression.
Our study provides potential prognostic indicators and therapeutic targets for BLBC
We have shown that loss of ABAT expression is associated with several factors that identify patients who are at risk of cancer progression and predict patient prognosis. These include: 1. Breast cancer subtypes (low ABAT expression occurs specifically in BLBC); 2. Grade (a significantly high frequency of low ABAT expression exists in patients with higher grade tumors); 3. Tumor size (low ABAT expression is significantly correlated with larger tumor size); 4. Tumor metastasis (low ABAT expression has a significantly higher risk of metastasis and is highly associated with metastatic dissemination to the brain and lungs, consistent with the metastatic tendency of BLBC); 5. Survival rate (low ABAT expression predicts poor overall, relapse-free, and distant metastasis-free survival); and, 6. Chemotherapy (low ABAT expression is correlated with poor treatment outcome in breast cancer patients). These findings strongly suggest that ABAT is a useful and independent prognostic factor and its expression needs to be evaluated in breast cancer patients. This may be especially critical for determining which breast cancer patients may benefit from chemotherapy and which may not and should therefore avoid the unnecessary side effects of chemotherapy [55].
Treatment of BLBC represents a significant clinical challenge due to the lack of effective targeted agents and poor response to standard chemotherapy. Therefore, identification of novel molecular targets in BLBC is urgently needed. GABAergic signaling molecules may provide potential targets for controlling BLBC progression. Blockade of GABA or its receptors by small molecules or antibodies may provide a promising new approach to molecular therapy for BLBC. Notably, several inhibitors of GABA and GABA receptors are available for treatment of epilepsy. Whether these inhibitors are effective and safe in patients with BLBC needs to be investigated. Furthermore, CsA and FK506, as potent NFAT inhibitors that prevent its nuclear translocation, have been widely used as immunosuppressive agents in organ transplant to prevent rejection. Both agents might be promising targeted drugs for treating BLBC. Further elucidating GABAergic signaling and corresponding antagonistic drugs may help the GABAergic system become a valuable target for treating BLBC.
Conclusions
To summarize, we demonstrated that loss of ABAT drives BLBC progression by activating Ca2+-NFAT1 axis. Our data suggested that loss of ABAT-mediated GABAergic system is associated with the aggressive behavior of BLBC, providing potential prognostic indicators and therapeutic targets for BLBC.
Abbreviations
ABAT: gamma-aminobutyrate aminotransferase; BLBC: basal-like breast cancer; ChIP: chromatin immunoprecipitation; DMFS: distant metastasis-free survival; GABAA: GABA-A receptor; GABAB: GABA-B receptor; GAD: glutamate decarboxylase; OS: overall survival; RFS: relapse-free survival.
Supplementary Material
Supplementary figures and tables.
Acknowledgements
The authors thank Dr. Yuezhou Li, Jie Yu and Xia Li for their technical assistance. This work was supported by grants from the Natural Science Foundation of China (No. 81772801 and 81472455 to CD), Key Program of Zhejiang Province Natural Science Foundation (No. LZ17H160002 to CD), National Key R&D Program of China (No. 2016YFC1303200 to CD), Fundamental Research Funds for Central Universities of China (to CD), and the Thousand Young Talents Plan of China (to CD).
Authors' contributions
CD conceptualized and participated in the design and coordination of this research. XC, QC, RL and XW designed and performed most of the experiments. SX and JH did the data analysis. CD supervised the work and wrote the manuscript.
Authors' information
Xingyu Chen, Qianhua Cao, Ruocen Liao, and Xuebiao Wu are joint first authors.
Availability of data and materials
The microarray datasets that were utilized in the study were retrieved from NIH-GEO dataset database (http://www.ncbi.nlm.nih.gov/gds/), including GSE1456, GSE25066, GSE12777, GSE10890, GSE29672, GSE58252 and GSE12276, and EMBL-EBI dataset database (https://www.ebi.ac.uk/), including E-TABM-157 and E-MTAB-181. Information about TCGA and the investigators and institutions that constitute the TCGA research network can be found at http://cancergenome.nih.gov/. Other data generated during this study are included in this published article.
Ethics approval and consent to participate
The tumor samples were collected from resected breast tumors from patients with informed consent. The experiments were performed according to the approved guidelines established by the institutional review board at the Zhejiang University, Hangzhou, China. Animal experiments were performed according to procedures approved by the Institutional Animal Care and Use Committee at the Zhejiang University, Hangzhou, China.
Competing Interests
The authors have declared that no competing interest exists.
References
1. Kreike B, van Kouwenhove M, Horlings H, Weigelt B, Peterse H, Bartelink H. et al. Gene expression profiling and histopathological characterization of triple-negative/basal-like breast carcinomas. Breast Cancer Res. 2007;9:R65
2. Rakha EA, Reis-Filho JS, Ellis IO. Basal-like breast cancer: a critical review. J Clin Oncol. 2008;26:2568-81
3. Bergamaschi A, Hjortland GO, Triulzi T, Sorlie T, Johnsen H, Ree AH. et al. Molecular profiling and characterization of luminal-like and basal-like in vivo breast cancer xenograft models. Mol Oncol. 2009;3:469-82
4. Blick T, Widodo E, Hugo H, Waltham M, Lenburg ME, Neve RM. et al. Epithelial mesenchymal transition traits in human breast cancer cell lines. Clin Exp Metastasis. 2008;25:629-42
5. Hennessy BT, Gonzalez-Angulo AM, Stemke-Hale K, Gilcrease MZ, Krishnamurthy S, Lee JS. et al. Characterization of a naturally occurring breast cancer subset enriched in epithelial-to-mesenchymal transition and stem cell characteristics. Cancer Res. 2009;69:4116-24
6. Sarrio D, Rodriguez-Pinilla SM, Hardisson D, Cano A, Moreno-Bueno G, Palacios J. Epithelial-mesenchymal transition in breast cancer relates to the basal-like phenotype. Cancer Res. 2008;68:989-97
7. Storci G, Sansone P, Trere D, Tavolari S, Taffurelli M, Ceccarelli C. et al. The basal-like breast carcinoma phenotype is regulated by SLUG gene expression. J Pathol. 2008;214:25-37
8. Owens DF, Kriegstein AR. Is there more to GABA than synaptic inhibition? Nat Rev Neurosci. 2002;3:715-27
9. Ring H, Mendu SK, Shirazi-Fard S, Birnir B, Hallbook F. GABA maintains the proliferation of progenitors in the developing chick ciliary marginal zone and non-pigmented ciliary epithelium. PloS one. 2012;7:e36874
10. Watanabe M, Maemura K, Kanbara K, Tamayama T, Hayasaki H. GABA and GABA receptors in the central nervous system and other organs. Int Rev Cytol. 2002;213:1-47
11. Joseph J, Niggemann B, Zaenker KS, Entschladen F. The neurotransmitter gamma-aminobutyric acid is an inhibitory regulator for the migration of SW 480 colon carcinoma cells. Cancer Res. 2002;62:6467-9
12. Iishi H, Tatsuta M, Baba M, Okuda S, Taniguchi H. Attenuating effect of ornithine decarboxylase inhibitor (1,3-diaminopropane) on bombesin enhancement of gastric carcinogenesis induced by N-methyl-N'-nitro-N-nitrosoguanidine. Int J Cancer. 1992;50:311-4
13. Sun D, Gong Y, Kojima H, Wang G, Ravinsky E, Zhang M. et al. Increasing cell membrane potential and GABAergic activity inhibits malignant hepatocyte growth. Am J Physiol Gastrointest Liver Physiol. 2003;285:G12-9
14. Takehara A, Hosokawa M, Eguchi H, Ohigashi H, Ishikawa O, Nakamura Y. et al. Gamma-aminobutyric acid (GABA) stimulates pancreatic cancer growth through overexpressing GABAA receptor pi subunit. Cancer Res. 2007;67:9704-12
15. Azuma H, Inamoto T, Sakamoto T, Kiyama S, Ubai T, Shinohara Y. et al. Gamma-aminobutyric acid as a promoting factor of cancer metastasis; induction of matrix metalloproteinase production is potentially its underlying mechanism. Cancer Res. 2003;63:8090-6
16. Jaeken J, Casaer P, de Cock P, Corbeel L, Eeckels R, Eggermont E. et al. Gamma-aminobutyric acid-transaminase deficiency: a newly recognized inborn error of neurotransmitter metabolism. Neuropediatrics. 1984;15:165-9
17. Tsuji M, Aida N, Obata T, Tomiyasu M, Furuya N, Kurosawa K. et al. A new case of GABA transaminase deficiency facilitated by proton MR spectroscopy. J Inherit Metab Dis. 2010;33:85-90
18. Dong C, Wu Y, Yao J, Wang Y, Yu Y, Rychahou PG. et al. G9a interacts with Snail and is critical for Snail-mediated E-cadherin repression in human breast cancer. J Clin Invest. 2012;122:1469-86
19. Lin Y, Wu Y, Li J, Dong C, Ye X, Chi YI. et al. The SNAG domain of Snail1 functions as a molecular hook for recruiting lysine-specific demethylase 1. EMBO J. 2010;29:1803-16
20. Dong C, Yuan T, Wu Y, Wang Y, Fan TW, Miriyala S. et al. Loss of FBP1 by Snail-mediated repression provides metabolic advantages in basal-like breast cancer. Cancer Cell. 2013;23:316-31
21. Wu X, Li X, Fu Q, Cao Q, Chen X, Wang M. et al. AKR1B1 promotes basal-like breast cancer progression by a positive feedback loop that activates the EMT program. J Exp Med. 2017;214:1065-79
22. Cao Q, Chen X, Wu X, Liao R, Huang P, Tan Y. et al. Inhibition of UGT8 suppresses basal-like breast cancer progression by attenuating sulfatide-alphaVbeta5 axis. J Exp Med. 2018;215(6):1679-1692
23. van de Vijver MJ, He YD, van't Veer LJ, Dai H, Hart AA, Voskuil DW. et al. A gene-expression signature as a predictor of survival in breast cancer. N Engl J Med. 2002;347:1999-2009
24. Hatzis C, Pusztai L, Valero V, Booser DJ, Esserman L, Lluch A. et al. A genomic predictor of response and survival following taxane-anthracycline chemotherapy for invasive breast cancer. Jama. 2011;305:1873-81
25. Pawitan Y, Bjohle J, Amler L, Borg AL, Egyhazi S, Hall P. et al. Gene expression profiling spares early breast cancer patients from adjuvant therapy: derived and validated in two population-based cohorts. Breast Cancer Res. 2005;7:R953-64
26. Mertins P, Mani DR, Ruggles KV, Gillette MA, Clauser KR, Wang P. et al. Proteogenomics connects somatic mutations to signalling in breast cancer. Nature. 2016;534:55-62
27. Heiser LM, Sadanandam A, Kuo WL, Benz SC, Goldstein TC, Ng S. et al. Subtype and pathway specific responses to anticancer compounds in breast cancer. Proc Natl Acad Sci U S A. 2012;109:2724-9
28. Hoeflich KP, O'Brien C, Boyd Z, Cavet G, Guerrero S, Jung K. et al. In vivo antitumor activity of MEK and phosphatidylinositol 3-kinase inhibitors in basal-like breast cancer models. Clin Cancer Res. 2009;15:4649-64
29. Neve RM, Chin K, Fridlyand J, Yeh J, Baehner FL, Fevr T. et al. A collection of breast cancer cell lines for the study of functionally distinct cancer subtypes. Cancer Cell. 2006;10:515-27
30. Dhasarathy A, Phadke D, Mav D, Shah RR, Wade PA. The transcription factors Snail and Slug activate the transforming growth factor-beta signaling pathway in breast cancer. PloS one. 2011;6:e26514
31. McGrail DJ, Mezencev R, Kieu QM, McDonald JF, Dawson MR. SNAIL-induced epithelial-to-mesenchymal transition produces concerted biophysical changes from altered cytoskeletal gene expression. FASEB J. 2015;29:1280-9
32. Tang X, Lin CC, Spasojevic I, Iversen ES, Chi JT, Marks JR. A joint analysis of metabolomics and genetics of breast cancer. Breast Cancer Res. 2014;16:415
33. Borodinsky LN, O'Leary D, Neale JH, Vicini S, Coso OA, Fiszman ML. GABA-induced neurite outgrowth of cerebellar granule cells is mediated by GABA(A) receptor activation, calcium influx and CaMKII and erk1/2 pathways. J Neurochem. 2003;84:1411-20
34. Ganguly K, Schinder AF, Wong ST, Poo M. GABA itself promotes the developmental switch of neuronal GABAergic responses from excitation to inhibition. Cell. 2001;105:521-32
35. Labrakakis C, Patt S, Hartmann J, Kettenmann H. Functional GABA(A) receptors on human glioma cells. Eur J Neurosci. 1998;10:231-8
36. Qin JJ, Wang W, Zhang R. Experimental therapy of advanced breast cancer: targeting NFAT1-MDM2-p53 pathway. Prog Mol Biol Transl Sci. 2017;151:195-216
37. Quang CT, Leboucher S, Passaro D, Fuhrmann L, Nourieh M, Vincent-Salomon A. et al. The calcineurin/NFAT pathway is activated in diagnostic breast cancer cases and is essential to survival and metastasis of mammary cancer cells. Cell Death Dis. 2015;6:e1658
38. Yoeli-Lerner M, Yiu GK, Rabinovitz I, Erhardt P, Jauliac S, Toker A. Akt blocks breast cancer cell motility and invasion through the transcription factor NFAT. Mol Cell. 2005;20:539-50
39. Mancini M, Toker A. NFAT proteins: emerging roles in cancer progression. Nat Rev Cancer. 2009;9:810-20
40. Perotti V, Baldassari P, Molla A, Vegetti C, Bersani I, Maurichi A. et al. NFATc2 is an intrinsic regulator of melanoma dedifferentiation. Oncogene. 2016;35:2862-72
41. Singh SK, Chen NM, Hessmann E, Siveke J, Lahmann M, Singh G. et al. Antithetical NFATc1-Sox2 and p53-miR200 signaling networks govern pancreatic cancer cell plasticity. EMBO J. 2015;34:517-30
42. Bos PD, Zhang XH, Nadal C, Shu W, Gomis RR, Nguyen DX. et al. Genes that mediate breast cancer metastasis to the brain. Nature. 2009;459:1005-9
43. Gyorffy B, Lanczky A, Eklund AC, Denkert C, Budczies J, Li Q. et al. An online survival analysis tool to rapidly assess the effect of 22,277 genes on breast cancer prognosis using microarray data of 1,809 patients. Breast Cancer Res Treat. 2010;123:725-31
44. Shirley SH, Hudson LG, He J, Kusewitt DF. The skinny on Slug. Mol Carcinog. 2010;49:851-61
45. Nieto MA. The snail superfamily of zinc-finger transcription factors. Nat Rev Mol Cell Biol. 2002;3:155-66
46. Dong C, Wu Y, Wang Y, Wang C, Kang T, Rychahou PG. et al. Interaction with Suv39H1 is critical for Snail-mediated E-cadherin repression in breast cancer. Oncogene. 2013;32:1351-62
47. Geradts J, de Herreros AG, Su Z, Burchette J, Broadwater G, Bachelder RE. Nuclear Snail1 and nuclear ZEB1 protein expression in invasive and intraductal human breast carcinomas. Hum Pathol. 2011;42:1125-31
48. Budczies J, Brockmoller SF, Muller BM, Barupal DK, Richter-Ehrenstein C, Kleine-Tebbe A. et al. Comparative metabolomics of estrogen receptor positive and estrogen receptor negative breast cancer: alterations in glutamine and beta-alanine metabolism. J Proteomics. 2013;94:279-88
49. Budczies J, Denkert C. Tissue-based metabolomics to analyze the breast cancer metabolome. Recent Results Cancer Res. 2016;207:157-75
50. Young SZ, Bordey A. GABA's control of stem and cancer cell proliferation in adult neural and peripheral niches. Physiology. 2009;24:171-85
51. Ludewig F, Huser A, Fromm H, Beauclair L, Bouche N. Mutants of GABA transaminase (POP2) suppress the severe phenotype of succinic semialdehyde dehydrogenase (ssadh) mutants in Arabidopsis. PloS one. 2008;3:e3383
52. Nicholson-Guthrie CS, Guthrie GD, Sutton GP, Baenziger JC. Urine GABA levels in ovarian cancer patients: elevated GABA in malignancy. Cancer Lett. 2001;162:27-30
53. Monteith GR, McAndrew D, Faddy HM, Roberts-Thomson SJ. Calcium and cancer: targeting Ca2+ transport. Nat Rev Cancer. 2007;7:519-30
54. Li W, Llopis J, Whitney M, Zlokarnik G, Tsien RY. Cell-permeant caged InsP3 ester shows that Ca2+ spike frequency can optimize gene expression. Nature. 1998;392:936-41
55. Allegra CJ, Paik S, Colangelo LH, Parr AL, Kirsch I, Kim G. et al. Prognostic value of thymidylate synthase, Ki-67, and p53 in patients with Dukes' B and C colon cancer: a National Cancer Institute-National Surgical Adjuvant Breast and Bowel Project collaborative study. J Clin Oncol. 2003;21:241-50
Author contact
![]() Corresponding author: Chenfang Dong, MD, PhD., E-mail: chenfangdongedu.cn; Phone: +86 571 88208990; Fax: +86 571 88208990
Corresponding author: Chenfang Dong, MD, PhD., E-mail: chenfangdongedu.cn; Phone: +86 571 88208990; Fax: +86 571 88208990
Citation styles
APA
Chen, X., Cao, Q., Liao, R., Wu, X., Xun, S., Huang, J., Dong, C. (2019). Loss of ABAT-Mediated GABAergic System Promotes Basal-Like Breast Cancer Progression by Activating Ca2+-NFAT1 Axis. Theranostics, 9(1), 34-47. https://doi.org/10.7150/thno.29407.
ACS
Chen, X.; Cao, Q.; Liao, R.; Wu, X.; Xun, S.; Huang, J.; Dong, C. Loss of ABAT-Mediated GABAergic System Promotes Basal-Like Breast Cancer Progression by Activating Ca2+-NFAT1 Axis. Theranostics 2019, 9 (1), 34-47. DOI: 10.7150/thno.29407.
NLM
Chen X, Cao Q, Liao R, Wu X, Xun S, Huang J, Dong C. Loss of ABAT-Mediated GABAergic System Promotes Basal-Like Breast Cancer Progression by Activating Ca2+-NFAT1 Axis. Theranostics 2019; 9(1):34-47. doi:10.7150/thno.29407. https://www.thno.org/v09p0034.htm
CSE
Chen X, Cao Q, Liao R, Wu X, Xun S, Huang J, Dong C. 2019. Loss of ABAT-Mediated GABAergic System Promotes Basal-Like Breast Cancer Progression by Activating Ca2+-NFAT1 Axis. Theranostics. 9(1):34-47.
This is an open access article distributed under the terms of the Creative Commons Attribution (CC BY-NC) license (https://creativecommons.org/licenses/by-nc/4.0/). See http://ivyspring.com/terms for full terms and conditions.