Impact Factor
- Issue 13; 2026
- Issue 12; 2026
- Issue 11; 2026
- Issue 10; 2026
- Issue 9; 2026
- Volume 16; 2026
- Advance Articles
- Past Issues
- Cover Images
- Cover Suggestion
- Index & Coverage
- Special Issues
Introduction
Materials and methods
Results
Discussion
Supplementary Material
Acknowledgements
References
International Journal of Biological Sciences
International Journal of Medical Sciences
 Global reach, higher impact

Theranostics 2019; 9(1):152-166. doi:10.7150/thno.27175 This issue Cite
Research Paper
Multimodal and Multiscale Analysis Reveals Distinct Vascular, Metabolic and Inflammatory Components of the Tissue Response to Limb Ischemia
Tamar Kapanadze1,2*, Jens P. Bankstahl3*, Alexander Wittneben3, Wolfgang Koestner3,4, Matthias Ballmaier5, Jaba Gamrekelashvili1,2, Kashyap Krishnasamy1,2, Anne Limbourg6, Tobias L. Ross3, Geerd-Jürgen Meyer3, Hermann Haller2, Frank M. Bengel3, Florian P. Limbourg1,2 ![]()
1. Vascular Medicine Research, Dept. of Nephrology and Hypertension, Hannover Medical School, Hannover, Germany
2. Dept. of Nephrology and Hypertension, Hannover Medical School, Hannover, Germany
3. Dept. of Nuclear Medicine, Hannover Medical School, Hannover, Germany
4. Dept. of Diagnostic and Interventional Radiology, Hannover Medical School, Hannover, Germany
5. Central Research Facility Cell Sorting, Hannover Medical School, Hannover, Germany,
6. Dept. of Plastic, Aesthetic, Reconstructive Surgery, Hannover Medical School, Hannover, Germany
* equal contribution
Received 2018-5-9; Accepted 2018-11-12; Published 2019-1-1
Abstract

Ischemia triggers a complex tissue response involving vascular, metabolic and inflammatory changes.
Methods: We combined hybrid SPECT/CT or PET/CT nuclear imaging studies of perfusion, metabolism and inflammation with multicolor flow cytometry-based cell population analysis to comprehensively analyze the ischemic tissue response and to elucidate the cellular substrate of noninvasive molecular imaging techniques in a mouse model of hind limb ischemia.
Results: Comparative analysis of tissue perfusion with [99mTc]-Sestamibi and arterial influx with [99mTc]-labeled albumin microspheres by SPECT/CT revealed a distinct pattern of response to vascular occlusion: an early ischemic period of matched suppression of tissue perfusion and arterial influx, a subacute ischemic period of normalized arterial influx but impaired tissue perfusion, and a protracted post-ischemic period of hyperdynamic arterial and normalized tissue perfusion, indicating coordination of macrovascular and microvascular responses. In addition, the subacute period showed increased glucose uptake by [18F]-FDG PET/CT scanning as the metabolic response of viable tissue to hypoperfusion. This was associated with robust macrophage infiltration by flow cytometry, and glucose uptake studies identified macrophages as major contributors to glucose utilization in ischemic tissue. Furthermore, imaging with the TSPO ligand [18F]-GE180 showed a peaked response during the subacute phase due to preferential labeling of monocytes and macrophages, while imaging with [68Ga]-RGD, an integrin ligand, showed prolonged post-ischemic upregulation, which was attributed to labeling of macrophages and endothelial cells by flow cytometry.
Conclusion: Combined nuclear imaging and cell population analysis reveals distinct components of the ischemic tissue response and associated cell subsets, which could be targeted for therapeutic interventions.
Keywords: ischemia, vascular, metabolic, inflammatory
Introduction
Peripheral artery disease (PAD) and the resultant limb ischemia is a major health problem, affecting 10-20% of individuals over 70 years and 200 million patients worldwide [1]. PAD patients have a high incidence of limb complications, including the need for peripheral revascularization and amputation [2]. However, current therapies to improve critical limb perfusion show limited effectiveness, and the need for investigational studies to promote blood vessel growth remains high [3].
Obstruction to blood flow and ischemia cause two distinct and characteristic vascular responses that cooperate in restoration of blood flow, angiogenesis and arteriogenesis, which are characterized by microvascular endothelial sprouting and enlargement of pre-existing collateral arteries and their remodeling to conductance vessels, respectively [4, 5]. However, although angiogenesis and arteriogenesis are interconnected, the precise temporal coupling on the level of tissue perfusion is not well understood. Furthermore, besides a vascular response, ischemia also triggers an inflammatory response involving diverse circulating leukocytes, and the recruitment of monocytes and their local maturation into macrophages is essential for arteriogenesis and ischemic tissue repair [6, 7]. Importantly, all of these aspects can be truthfully studied in a mouse model of hind limb ischemia (HLI), which recapitulates the clinical problem most commonly encountered in patients with PAD, i. e. obstruction of the superficial branch of the femoral artery, causing ischemia and inflammation in dependent muscles and collateral development from the deep femoral branch [5, 7]. This model is therefore widely used to study procresses related to limb ischemia, but also to analyze general mechanisms of angiogenesis and blood vessel growth.
Nuclear imaging studies employing dedicated tracers in single photon emission computed tomography (SPECT) or positron emission tomography (PET) combined with x-ray based computed tomography (CT) for anatomical co-localization provide non-invasive tools for the functional evaluation of perfusion, metabolism, angiogenesis and inflammation in ischemic tissues [8, 9]. For example, [99mTc]-Sestamibi is a lipophilic cationic isonitrile which distributes in muscular tissue proportionally to the local blood flow which is used clinically in patients with PAD and provides complementary information on ischemic blood flow to Laser-Doppler imaging in animal models [10, 11]. In contrast, 99mTc-labeled human serum albumin (HSA) micro-particles given intra-arterially can be used as a marker for arterial vascularization [12], as the particles are trapped in the arterial side of the capillaries. [18F]-Fluorodeoxyglucose (FDG) is a glucose analogue that is taken up by muscle fibers, endothelial cells (EC) and macrophages via glucose transporters and trapped inside the cell, thus imaging glucose metabolism for assessment of inflammation and viability [9, 13, 14]. In addition, the combination of perfusion and metabolic studies can detect mismatches between glucose metabolism and perfusion considered the hallmark of myocardial ischemic hibernation [14].
Another group of tracers are used preclinically or clinically in the setting of inflammation or ischemia, but the cellular targets for the molecular probes are less well defined. For example, RGD (Arg-Gly-Asp) peptide sequence had been previously described in extracellular matrix proteins as a specific site responsible for binding to different integrin molecules [15], including αVβ3 integrin, which represents common marker of EC [16] and is frequently used target to evaluate angiogenesis by radioactively labeled synthetic RGD tripeptide [17-19]. Another target, translocator protein (TSPO) is expressed in the outer mitochondrial membrane of immune cells and TSPO-targeting tracers are frequently used markers of peripheral and particularly neuroinflammation [20-25].
Here, we combined hybrid SPECT/CT or PET/CT nuclear imaging studies of perfusion, metabolism and molecular tracers with multicolor flow cytometry-based cell population analysis of single cell suspensions to analyze the ischemic tissue response on multiple levels and to validate the cellular targets of nuclear imaging techniques in a mouse model of hind limb ischemia [5].
Materials and methods
Mice
All experiments were performed on 10-12 weeks old male mice. Cx3cr1gfp/+ or littermate C57BL/6 wt mice were previously described [26]. Mice were housed in the animal facility of Hannover Medical School under specific pathogen-free conditions at 14/10hr day/night rhythm. Animals had free access to standard lab animal diet (Altromin) and autoclaved tap water. All experiments were approved by local animal welfare boards of Hannover Medical School and Niedersachsen (LAVES).
Mouse hind limb ischemia (HLI)
Hind limb ischemia was induced as described [5, 7]. Briefly, mice were anesthetized by the mixture of Ketanest (25mg/ml ketamine, Pfizer) and Rompun (2% xylazine, Bayer Healthcare) at a dose of 80mg/kg and 2.5mg/kg bodyweight, respectively. After a right inguinal incision, the neurovascular bundle was exposed and the superficial branch of the femoral artery surgically ligated distal to the origin of the deep femoral branch. Sham animals underwent the whole experimental procedure apart from the vessel occlusion. To avoid post-operative hypothermia, mice were maintained on heating pads until they had been fully awake.
PET/CT and SPECT/CT imaging
SPECT and PET tracers
[99mTc]-HSA microspheres (Ø 10-30 µm) and [99mTc]-sestamibi were generated from commercial kits (Rotop and GE Healthcare respectively). [18F]-FDG was produced for standard in-house clinical use. [18F]-GE 180 was prepared as described previously [27]. For [68Ga]-NODAGA-c(RGDyK) (ABX GmbH, hereafter: [68Ga]-RGD), elution of the gallium generator was performed using a cation exchange cartridge [28] and labeling was performed as described [29], under optimized conditions: at 85°C for 6 minutes in 1.5 M 4-(2-hydroxyethyl)-1-piperazineethanesulfonic acid (HEPES) buffer. The product was trapped on a tC18 SepPak cartridge (Waters), eluted using 0.5 ml 30% ethanol and diluted for injection with purified water.
Radiochemical purity was checked by thin layer chromatography or HPLC in routine quality control (97.1±1.2% for [99mTc]-sestamibi, 98.4±1.1% for [99mTc]-HSA microspheres, >99% for [18F]-FDG, >99% for [18F]-GE180), or determined for the respective syntheses (90.6±4.3% for [68Ga]-RGD). The following activity doses were used for in vivo administration: 106.8±1.8MBq for [99mTc]-sestamibi, 24.5±1.5MBq [99mTc]-HSA microspheres, 8.5±0.1MBq for [18F]-FDG, 16.3±2.5MBq for [18F]-GE180 and 10.3±0.2MBq for [68Ga]-RGD.
Imaging protocol
Animals were anesthetized using humidified 3-5% isoflurane in 100% oxygen for induction and about 1-1.5% for maintenance. Except for the [99mTc]-HSA microspheres, all tracers were injected via a lateral tail vein. [99mTc]-HSA microspheres were administered intra-arterially about 10 mm above the aortic bifurcation after opening the abdomen via a small incision. The amounts of [99mTc]-HSA microspheres finally reaching both legs were rather unsteady due to variable drain into other large vessels originating from the aorta in this area. Under continuous anesthesia, animals were placed into a warmed (~37°C) animal chamber (Minerve) and were positioned in the center of the field of view of the SPECT/CT (TriFoil Imaging eXplore SPECT/CT120) or the PET/CT (Siemens Inveon PET/CT) scanner. Mice were monitored for breathing frequency and heart rate throughout the scan (m2m Biovet). Details of the scan protocols can be found in the respective figures. After an uptake phase at rest (under anesthesia) of 30 minutes for [99mTc]-sestamibi and [18F]-FDG, 20 minutes for [99mTc]-HSA microspheres, 50 minutes for [18F]-GE180 and 60 minutes for [68Ga]-RGD, animals were scanned for 30 minutes (10 minutes for [18F]-GE180). In addition, a low dose CT was acquired for anatomical co-registration. All imaging time points were compared to baseline as major outcome. To evaluate a potential influence of the surgery itself, additional sham animals were only evaluated for [99mTc]-HSA microspheres and [18F]-FDG (one perfusion tracer and one tracer visualizing metabolic changes and inflammation). As for these two tracers no significant changes could be found at the time points of the most prominent changes in the HLI animals (Figure 1e and Figure 2b), we refrained from doing these measurements in additional groups of animals. Scan protocols were chosen according to initial continuous or repetitive static scans. The finally analyzed static scans were chosen with regards to a relatively stable tracer signal and a visually good signal-to-noise-ratio (data not shown), coexisting with a reasonably short scan duration to optimize throughput per tracer synthesis. Animals were imaged serially whenever possible. Nevertheless, imaging was not possible for every animal at every time point due to logistical limitations. Therefore they had to be handled as unpaired subsets of animals. Only for the [99mTc]-HSA, animals were sacrificed at every time point.
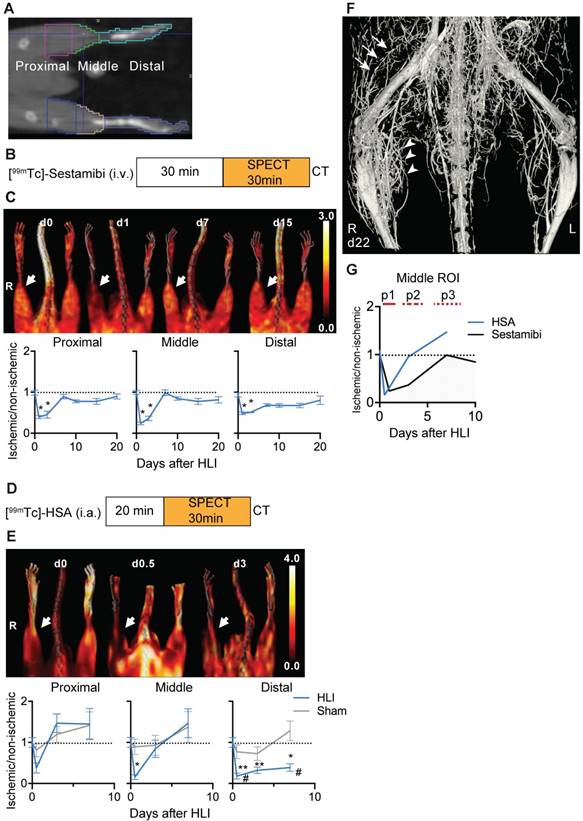
SPECT/CT analysis of regional limb perfusion. (a) Regions of interest for nuclear imaging measurements. (b) [99mTc]-sestamibi imaging protocol. (c) [99mTc]-sestamibi quantification by VOI analysis, cumulative average ratios of radiotracer uptake, n=6 (d0), n=7 (d1, 3, 7, 10 and 15) and n=4 (d21). Representative maximum intensity projections (MIP) SPECT/CT images (right panel). (d) [99mTc]-HSA microspheres imaging protocol. (e) [99mTc]-HSA microspheres quantification by VOI analysis, cumulative average ratios of radiotracer uptake, HLI: n=9 (d0), n=5 (d0.5), n=9 (d3) and n=10 (d7), sham: n=5 (d0.5), n=5 (d3) and n=4 (d7). Representative MIP SPECT/CT images (right panel). (f) Contrast-enhanced Micro CT image of hind limb region 22 days after induction of ischemia. Proximal collateral formation (arrows), distal branching in the ischemic muscle area (arrowheads). * vs. baseline and # vs. sham, P<0.05, Kruskal-Wallis test. The color bars represent the color spectrum scaled to the middle VOI of the control leg and indicate the ischemic to non-ischemic ratio.
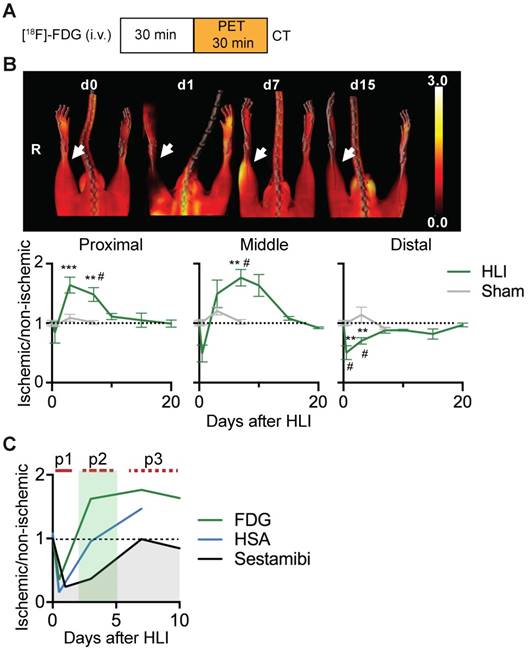
[18F]-FDG PET/CT analysis of regional glucose uptake. (a) [18F]-FDG imaging protocol. (b) [18F]-FDG scans, representative MIP PET/CT images (upper panel), quantification by VOI analysis, cumulative average ratios of radiotracer uptake, HLI: n=12 (day 0); n=5 (d0.5), n=10 (d3), n=12 (d7) and n=2 (d10, d15, d20); sham: n=5 (d0.5), n=3 (d3) and n=6 (d7). * vs. baseline and # vs. sham, Kruskal-Wallis test. The color bar represents the color spectrum scaled to the middle VOI of the control leg and indicates the ischemic to non-ischemic ratio. (c) Combined analysis of radiotracer uptake in middle VOI from [99mTc]-Sestamibi, [99mTc]-HSA (see Figures 1c and 1e) and [18F]-FDG.
Data analysis
Acquired imaging data were reconstructed using iterative algorithms (ordered subset expectation maximization (OSEM) 3D for PET and maximum likelihood expectation maximization for SPECT) and standard corrections per manufacturer defaults. Based on the low dose CT, three 3D volumes of interest (VOIs) were defined: a distal a middle, and a proximal (Figure 1a). After separation of tissue from surrounding air, the distal VOI was defined from the tip of the paw to an axial section at the distal end of the calf muscle. In the next step a VOI from this section to a axial section through the knee joint was split into two VOIs of equal longitudinal length (middle and distal VOI). These regions were chosen as they could be applied entirely on the basis of the co-registered CT scan and reflect different areas of tissue affected by HLI. The proximal region is located in just below the vessel occlusion. The middle VOI contains major parts of the affected muscular tissue (i.e. the calf muscle) and the distal VOI contains mainly bone, skin and connective tissue. Like in all VOIs a total tissue value was calculated and no separation into different tissues was performed. This approach was chosen due the available nuclear imaging resolution. Furthermore we did not recognize a imaging signal distribution that suggested a major focal skin or bone signal. For the figures, nuclear images are displayed as maximal intensity projections (MIPs), co-registered with the CT image. For all scans, the ratio between ischemic and non-ischemic side was calculated,to reduce potential inter-individual variation and to provide a comparable analysis for all imaging data. Additional analysis of [18F]-FDG data (in %ID/cc) of the middle VOI of the non-occluded leg over time resulted values of 0.97%±0.07 %ID/cc (data not shown). No significant changes were found for the six imaging time points compared to control. The same is true for [99mTc]-sestamibi. For this tracer, we divided the average counts given by the scanner by the injected activity. For the middle VOI of the healthy leg, no significant differences could be detected over time (data not shown). For the receptor-binding tracers [68Ga]-RGD and [18F]-GE180, results were corrected by normalization to average [99mTc]-sestamibi SPECT perfusion values. This approach was chosen according to a recent publication after heart ischemia [30] It was exemplarily verified by in-vitro autoradiography also showing a clear peak in [18F]-GE180 binding at d4 after HLI (data not shown).
Micro CT
Mice were deeply anesthetized with 3-fold higher dose of anesthetic (see above). To induce vasodilation, animals were first perfused through the right heart ventricle with the 37° C warm phosphate buffered saline (PBS with Ca2+ and Mg2+, Lonza) containing papaverine hydrochloride (4μg/ml, Sigma), adenosine (1mg/ml, Roth) and heparin (50IU/ml, Ratiopharm), followed by infusion of fixative 4% parafolmaldehyde (PFA, Sigma) in PBS. Contrast solution, containing 50% of Bi3OCl and 5% bovine skin gelatin (both from Sigma) was prepared ahead and pre-warmed to 420C. Mice were first perfused with PBS to remove excess fixative followed by slow infusion of 700μl of the contrast solution, during 2 min. with 120mm Hg pressure. Mice were chilled immediately and immersed in 2% of PFA overnight. For the CT scan (TriFoil imaging eXplore CT 120), the body of the animal was placed into an imaging chamber and positioned with the hind limb region in the center of the field of view. A 360° scan consisting of 1200 single views with a 1 second delay between two views (100 ms, 80 kV, 32 mA) resulted in a voxel size of 50x50x50 µm3. Data were visualized using Osirix viewer software.
Cell isolation
For flow cytometry, additional mice were sacrificed, semimembranosus and tibialis anterior muscles were incised, minced and incubated with 500U/ml collagenase II (Worthington) in Dulbecco's modified Eagle's medium (Millipore) containing 1% penicillin-streptomycin (Biochrom) for 20min. at 370C, then processed through GentleMACS tissue dissociator (Miltenyi Biotec) and incubation step was repeated for another 20min. The tissue lysate was homogenized by pipetting, filtered through the nylon mesh (40μM, Greiner bio-one) and washed with PBS (Millipore). Finally, cells were resuspended in PBS and counted in the Neubauer chamber. Dead cells were excluded from counting using Trypan blue (Roth) staining.
Flow cytometry
RGD peptide binding: 106 cells were washed with pre-warmed integrin-binding buffer (IBB) containing 0.2% bovine serum albumin, 25mM Tris-base, 150mM NaCl, 1mM MgCl2 (all from Roth), 2mM CaCl2, 1mM MnCl2 (both from Sigma) [29, 31, 32] and incubated in IBB containing 200nM of Cruz Fluor 750-RGD conjugate (Santa-Cruz Biotechnology) at 370C, under gentle agitation at 70rpm. After 1 h cells were washed with the IBB. Fc receptors were blocked with TrueStain fcX anti-CD32/16 (Clone 93, Biolegend) in the same buffer on ice and cells were stained with the following anti-mouse antibody mixes: a) anti-CD11b (M1/70, Biolegend) and anti-F4/80 (BM8, Serotec); b) anti-CD45 (30-F11, Biolegend) and anti-CD31 (2H8, Serotec); c) anti-CD11b and lineage cocktail: anti-CD19 (6D5), CD3 (17A2), NK1.1 (PK136), Ly6G (1A8) (all from Biolegend). After staining, samples were analyzed on MoFlo XDP Cell sorter (Beckman Coulter). Cruz Fluor 750 was excited with the 751 nm line of a Krypton ion laser and detected using a 794/34 nm band pass filter.
Glucose uptake: 106 cells were resuspended in the glucose- and bicarbonate-free RPMI-1640 medium (Sigma), supplemented with 10% FCS (Biochrom), 0.2% NaHCO3 (AppliChem), 1% Glutamax (Gibco), 1% Penicilin/Streptomycin (Biochrom) and incubated for 370C. After 40min. 2-NBDG (Cayman Chemicals) was added at a 50μM of final concentration and incubation was prolonged for the next 30min. Further, cells were washed, Fc receptor blockade was performed as described above and surface phenotyping was performed using the anti-mouse antibodies specific to CD19 (6D5), CD3 (17A2), NK1.1 (PK136), Ly6G (1A8), CD11b (M1/70), F4/80 (BM8), Ly6C (HK1.4), CD45 (30-F11), Ia/Ie (M5/114.15.2), CD11c (N418), CX3CR1 (SA011F11), CD45 (30-F11) (all from Biolegend), CD43 (S7, BD Biosciences) and CD31 (2H8, Serotec). Dead cells were excluded by staining with Propidium Iodide (Fluka).
TSPO (PBR) expression: Fc receptor blocking and surface staining was performed as described in (b). 7AAD (Biolegend) was used for dead cell exclusion. Further, cells were fixed and permeabilized by fixation-permeabilization buffer for 45 min., then washed with permeabilization buffer (both from eBioscience) and stained with anti-PBR (EPR5384, Abcam) or appropriate isotype control antibody for 30min. All steps were performed at room temperature.
Analysis of glucose uptake and TSPO/PBR expression was performed using LSR II flow cytometer (BD Biosciences).
Statistical analysis
As it was not possible to perform this study in a true longitudinal design, subsets of data were handled as unpaired data. Results have been analyzed using GraphPad Prism Software. Data are expressed as mean±SEM. Difference between groups was evaluated using 1-way ANOVA, with Bonferroni multiple comparison test and Kruskal-Wallis test or unpaired 2-tailed Student's t-test. P<0.05 was considered as a significant difference.
Results
Regional limb perfusion after hind limb ischemia
The HLI model is characterized by development of collateral circulation in the thigh region and angiogenesis in the dependent ischemic muscles. We used nuclear perfusion imaging to investiate these processes in the HLI model [5]. This model shows high reproducibility, as tested in an independent series of C57BL/6 mice, in which perfusion after ligation in the ischemic limb was reduced to 6.3±2,2% (mean, sd) compared to non-ischemic side; 5.7% of animals showed less than 90% reduction in ischemic perfusion (n=53). On day 7, ischemic perfusion was 91.5±7.6% of the non-ischemic side.
To determine in detail the regional perfusion changes in the ischemic limb after HLI we defined 3 volumes of interest (VOI). The proximal VOI included the area of collateral development in the semimembranosus muscle, the middle VOI included the ischemic calf muscles (tibialis anterior and gastrocnemius muscles) and the distal region included the paw, which is the site of perfusion studies with Laser-Doppler imaging (Figure 1a) [5].
We first studied regional tissue perfusion in response to HLI with the radiotracer [99mTc]-sestamibi by SPECT/CT, normalizing the ischemic signal to the non-ischemic signal in resting mice (Figure 1b, c, Table 1). The proximal and middle VOI showed profound reductions in tissue perfusion (up to 76% reduction at d1 in the middle VOI, p=0.0002), which transiently normalized at d7 but maintained small perfusion deficits up to d21. Of note, a comparision of medial/lateral sub-regions of the middle VOI containing mostly muscle tissue with the regular middle VOI showed identical changes in signal over time, suggesting that the signal was mostly muscle derived (Supplementary Figure 1). In contrast, the distal VOI showed profound and prolonged signal deficits and recovered to near baseline values only at d21.
SPECT/CT analysis of [99mTc]-sestamibi uptake
| [99mTc]-sestamibi | HLI | |||||||
|---|---|---|---|---|---|---|---|---|
| Days | 0 | 1 | 3 | 7 | 10 | 15 | 21 | |
| Mouse N= | 6 | 7 | 7 | 7 | 7 | 7 | 4 | |
| VOI | Proximal | 0,99±0,06 | 0,39±0,04 | 0,45±0,08 | 0,89±0,05 | 0,78±0,04 | 0,78±0,07 | 0,90±0,06 |
| Middle | 1±0,05 | 0,24±0,03 | 0,36±0,06 | 0,99±0,07 | 0,847±0,04 | 0,774±0,07 | 0,815±0,07 | |
| Distal | 0,937±0,05 | 0,486±0,03 | 0,509±0,01 | 0,686±0,03 | 0,6757±0,04 | 0,677±0,05 | 0,803±0,1 | |
To evaluate arterial influx, we used intra-arterially administered [99mTc]-labeled HSA microspheres in mice undergoing HLI or sham surgery (Figure 1d). Reflecting rapid arterial remodeling in response to HLI, the arterial influx signal in the proximal and middle VOI showed a transient decrease (up to 85% directly after induction of ischemia in middle VOI, p=0.038) but increased to baseline or above normal values on d3 and thereafter, the perfusion kinetics in the middle VOI being only slightly protracted. In contrast, the signal in the distal VOI was severely impaired and did not recover during the study period (Figure 1e, Table 2).
SPECT/CT analysis of [99mTc]-HSA uptake
| [99mTc]-HSA | HLI | Sham | |||||||
|---|---|---|---|---|---|---|---|---|---|
| Days | 0 | 0.5 | 3 | 7 | 0 | 0.5 | 3 | 7 | |
| Mouse N= | 9 | 5 | 9 | 9 | 9 | 4 | 5 | 5 | |
| VOI | Proximal | 1±0,12 | 0,38±0,12 | 1,31±0,25 | 1,30±0,37 | 1±0,12 | 0,81±0,16 | 1,2±0,2 | 1,42±0,32 |
| Middle | 1±0,12 | 0,15±0,06 | 0,75±0,21 | 1,47±0,35 | 1±0,12 | 0,89±0,19 | 0,93±0,24 | 1,38±0,37 | |
| Distal | 1±0,12 | 0,18±0,07 | 0,32±0,08 | 0,39±0,09 | 1±0,12 | 0,77±0,17 | 0,73±0,16 | 1,29±0,24 | |
By micro CT analysis of the arterial system, the vascular network showed extensive branching in the ischemic muscle area corresponding to the middle VOI, and collateral formation in the proximal VOI (Figure 1f).
An overlay of the patterns of arterial vs. tissue perfusion revealed three distinct perfusion patterns after HLI: an early ischemic period of matched suppression of tissue and arterial influx during the first 24h after HLI (termed p1), a subacute period of normalized arterial influx but impaired tissue perfusion around d3 after HLI (termed p2) and a protracted post-ischemic period of hyperdynamic arterial and normalized tissue perfusion around d7-10 after HLI (termed, p3; Fig. 1g).
Ischemic glucose metabolism
We next performed glucose uptake studies using [18F]-FDG PET/CT after HLI or sham surgery (Figure 2a). Immediately after induction of HLI, glucose uptake decreased in the middle and distal VOI, but did not change in the proximal region. At d3 however, glucose uptake was increased in the proximal and middle VOI, which persisted at least until d7 in both areas (maximal increase by 76% at d7 in middle VOI, p= 0.0082). In contrast, glucose uptake in the distal leg returned to normal levels at about d7 and remained there during the course of the study. Mice undergoing sham surgery did not show significant changes in [18F]-FDG uptake (Figure 2b, Table 3).
PET/CT analysis of [18F]-FDG uptake
| [18F]-FDG | HLI | Sham | ||||||||||
|---|---|---|---|---|---|---|---|---|---|---|---|---|
| Days | 0 | 0.5 | 3 | 7 | 10 | 15 | 21 | 0 | 0.5 | 3 | 7 | |
| Mouse N= | 12 | 5 | 10 | 12 | 2 | 2 | 2 | 12 | 5 | 4 | 6 | |
| VOI | Proximal | 1±0,05 | 0,84±0,18 | 1,64±0,13 | 1,48±0,12 | 1,11±0,05 | 1,05±0,12 | 0,99±0,06 | 1±0,05 | 0,97±0,02 | 1,09±0,06 | 1,01±0,03 |
| Middle | 1±0,05 | 0,49±0,14 | 1,5±0,23 | 1,76±0,14 | 1,63±0,18 | 1,08±0,03 | 0,92±0,02 | 1±0,05 | 1,02±0,04 | 1,21±0,06 | 1,02±0,04 | |
| Distal | 1±0,05 | 0,5±0,12 | 0,7±0,05 | 0,88±0,04 | 0,88±0,01 | 0,82±0,09 | 0,97±0,03 | 1±0,05 | 1±0,04 | 1,14±0,13 | 0,92±0,02 | |
An overlay of the patterns of perfusion and glucose utilization in the region of ischemic muscle revealed that the early ischemic p1 period was characterized by matched suppression of tissue perfusion, arterial influx and metabolism, while the subacute p2 phase showed a mismatch pattern with reduced tissue perfusion and increased glucose uptake. Of note, this phase was accompanied by normalization of arterial influx. During the late p3 phase, tissue perfusion returned to baseline, but arterial influx and glucose metabolism remained elevated (Figure 2c).
Cellular population kinetics and glucose utilization in response to ischemia
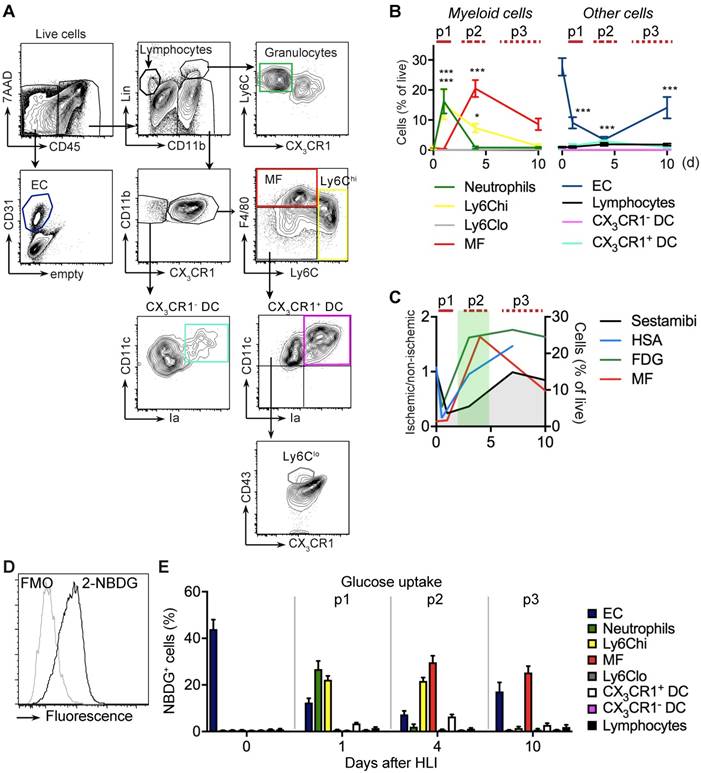
We next wanted to characterize changes in the prevalence and glucose uptake pattern of several cell populations after ischemia. To comprehensively analyze multiple cell populations in ischemic muscle over time we performed flow cytometry of cells isolated after muscle digestion (Table 1). We devised gating strategies to discriminate live cell populations of lymphocytes, myeloid cell subsets, including monocytes and macrophages, and also resident EC (Figure 3a, Table 4) [33].
Flow cytometry analysis of cell populations and glucose uptake in single cell suspension of ischemic muscle. (a) Gating strategy for flow cytometry to define various cell populations, representative HLI d4. (b) Quantification of cell populations over time. Data represent cumulative of 7 independent experiments. n=5 (d0), n=3 (d1), n=6 (d4), n=5 (d10). Statistical analysis compares each time point vs baseline. *P<0.05, **P<0.01, ***P<0.001, 1-way ANOVA with Bonferroni's multiple comparison test. (c) Schematic combination of SPECT/CT and [18F]-FDG PET/CT data with the dynamics of macrophage frequencies before and after induction of HLI. (d-e) Glucose uptake studies in single cell suspensions with 2-NBDG. (d) Representative flow cytometry of 2-NBDG fluorescence, HLI d4. (e) Cumulative relative frequencies of various cell populations in the total 2-NBDG+ cell gate, pooled from 7 independent experiments. n=5 (d0), n=6 (d1), n=7 (d4), n=4 (d10).
Cell definitions by flow cytometry
| Phenotype | Cell type |
|---|---|
| Lin+CD11b- | Lymphocytes (B, T, NK, NKT) |
| Lin+CD11b+CX3CR1-Ly6Cint | Granulocytes |
| Lin-CD11b+F4/80loCX3CR1intLy6Chi | Ly6Chi Monocytes |
| Lin-CD11b+F4/80loCX3CR1hiLy6Clo/negCD11c+CD43+ | Ly6Clo Monocytes |
| Lin-CD11b+F4/80hiCX3CR1+Ly6Clo/neg | Macrophages |
| Lin-CD11b+CX3CR1-CD11chiIa+ | CX3CR1- DC |
| Lin-CD11b+CX3CR1+F4/80loLy6Clo/negCD11chiIa+ | CX3CR1+ DC |
| CD45-CD31+ | EC |
Lin: CD19, CD3, NK1.1, Ly6G
The early p1 phase of ischemia was characterized by a transient influx of neutrophils and a more prolonged recruitment of Ly6Chi monocytes, but also by a significant and sustained loss of viable EC (Figure 3b, Table 2). This was followed by a slow and sustained rise in macrophages, which in the subacute p2 period became the dominant cell type in ischemia (Figure 3b). During the protracted p3 phase, Ly6Chi monocytes and macrophages gradually decreased and EC numbers partially recovered. All other CD45+ cell populations did not show significant changes (Figure 3b, Table 5). Together, these data demonstrate dynamic changes in the cellular composition in ischemic muscle over time, key features of which are the origin of a macrophage population and loss of EC. At the same time, this analysis revealed that the origin of macrophages occurs during the p2 phase associated with the increase in glucose uptake and normalization of arterial influx (Figure 3c).
Absolute and relative cell numbers in muscle at baseline and after ischemia
| Cell type | Days | ||||
|---|---|---|---|---|---|
| 0 (n=5 ) | 1 (n=3 ) | 4 (n=6) | 10 (n=5) | ||
| Granulocytes | 0.2±0.0 | 16.2±4.1 | 0.8±0.4 | 0.8±0.3 | % of live |
| 14.1±5.4 | 2375±816 | 135±93 | 83.7±35.0 | N/mg tissue | |
| Ly6ChiMonocytes | 0.2±0.1 | 15.1±4.8 | 7.2±1.7 | 0.7±0.1 | % of live |
| 21.0±10.3 | 2252±874 | 661±222 | 79±37.6 | N/mg tissue | |
| macrophages | 0.8±0.3 | 0.3±0.1 | 12.0±3.2 | 4.4±1.9 | % of live |
| 76.3±35.2 | 47.4±16.6 | 1069±277 | 605±413 | N/mg tissue | |
| EC | 27.7±2.9 | 9.1±1.9 | 3.1±1.2 | 9.8±3.2 | % of live |
| 2495±994 | 1314±423 | 246±34 | 1001±436 | N/mg tissue | |
To determine glucose uptake of the measured cell populations we analyzed single cell uptake of a fluorescent glucose analogue, 2-NBDG, by flow cytometry in gated cell populations (Figure 3d). At baseline, resident EC were the major consumers of glucose among all measured cell populations (Figure 3e). During the early p1 phase of ischemia, glucose uptake of EC steadily declined, while glucose uptake shifted to recruited neutrophils and monocytes. In contrast, during the subacute p2 phase, macrophages were the dominant glucose consumers, which continued into the late p3 stage, at which time EC resumed to contribute significantly to glucose consumption (Figure 3e). Thus, macrophages are major glucose consumers in ischemic tissue, particularly during the subacute p2 phase.
TSPO imaging and cellular targets in ischemia
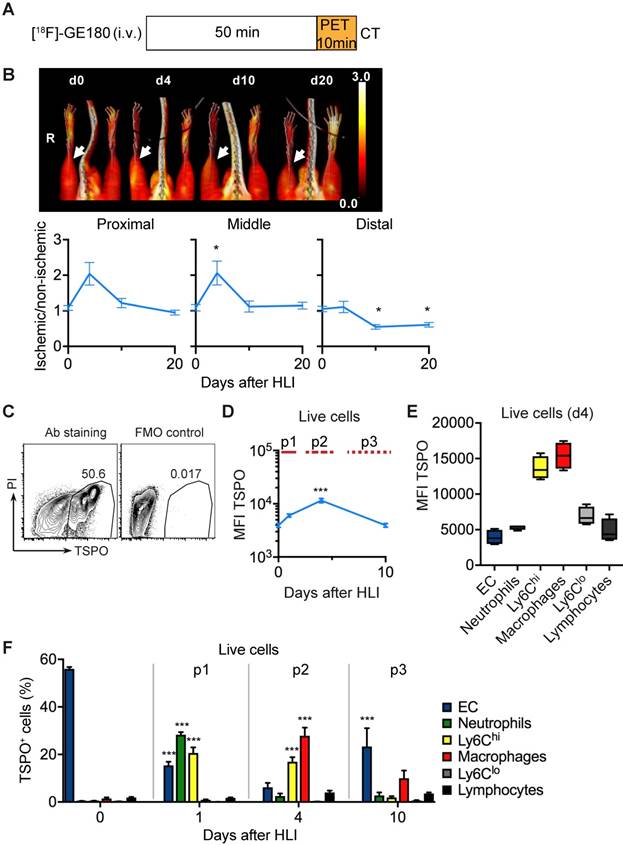
To analyze the in vivo signature of TSPO-based tracers after ischemia we first performed PET/CT analysis with [18F]-GE180 (flutriciclamide), a third generation TSPO-ligand [34], after HLI (Figure 4a). [18F]-GE180 signal intensity increased sharply after HLI, reaching a maximum during the p2 phase (d4) in the proximal and middle VOI (maximal increase by 106% at d4 in middle VOI, not significant, p= 0.064), but returned to baseline levels at d10 (Figure 4b), which paralleled the course of inflammatory cell recruitment during the p2 phase. To define the cellular targets of TSPO we stained single cell solutions isolated from muscle with a specific anti-TSPO antibody and characterized expression levels in different cell populations by flow cytometry (Figure 4c, Table 6).
TSPO imaging and cellular targets. (a) [18F]-GE-180 imaging protocol (b) representative MIP PET/CT [18F]-GE-180 images (upper panel, non-perfusion-corrected) and quantification by VOI analysis, cumulative average ratios of perfusion-normalized radiotracer uptake, n=6 (d0); n=4 (d4), n=6 (d10) and n=8 (d20) and * vs. baseline, P<0.05, Kruskal-Wallis test. The color bar represents the color spectrum scaled to the middle VOI of the control leg and indicates the ischemic to non-ischemic ratio. (c-f) TSPO expression by flow cytometry in single cell suspensions from the muscles. (c) Representative flow cytometry after TSPO staining. (d) Total TSPO expression in the live cell gate. (e) Box plot (5-95 percentile) of TSPO expression in live cell populations. (f) Relative frequencies of cell populations in total TSPO+ cellular pool over time Data represent cumulative of 7 independent experiments. n=5 (d0), 3 (d1), 6 (d4), 5 (d10). Statistical analysis compares each time point with d0. *P<0.05, **P<0.01, ***P<0.001, 1-way ANOVA with Bonferroni's multiple comparison test.
PET/CT analysis of [18F]-GE 180 uptake
| [18F]-GE 180 | HLI | ||||
|---|---|---|---|---|---|
| Days | 0 | 4 | 10 | 20 | |
| Mouse N= | 6 | 4 | 6 | 8 | |
| VOI | Proximal | 1,09±0,07 | 2,04±0,32 | 1,22±0,13 | 0,95±0,07 |
| Middle | 1,09±0,09 | 2,06±0,33 | 1,12±0,16 | 1,15±0,1 | |
| Distal | 1,05±0,08 | 1,11±0,16 | 0,55±0,06 | 0,61±0,07 | |
Total TSPO staining intensity increased after induction of ischemia, reached a maximum at d4 and decreased to baseline values at d10 (Figure 4d), resembling the dynamics of [18F]-GE180 tracer uptake (Figure 4b). We next wondered whether TSPO was differently expressed in different cell populations and whether expression changed during ischemia. Interestingly, TSPO levels were highest in Ly6Chi monocytes and macrophages compared to all other measured cell populations, i. e. Ly6Clo monocytes, granulocytes, lymphocytes and EC (Figure 4e). Expression levels did not change during the course of ischemia (Supplementary Figure 2).
We next characterized the contribution of cell populations to the TSPO+ cell pool in response to ischemia. At baseline, the pool of TSPO+ cells was dominated by EC, however, signal intensity was low (Figure 4f, compare Figure 4d, b). Following HLI, the fraction of EC in the TSPO+ cell population rapidly declined, but the fraction of different myleoid subsets in the TSPO+ cell population robustly increased, initially (d1) through the recruitment of granulocytes and Ly6Chi monocytes, and later (d4) through the origin of macrophages in ischemic muscle (Figure 4f). Thus, ischemia is characterized by a TSPO+ cell response comprised of different myeloid subsets, and the peak TSPO signal, which occurs during the subacute p2 phase, is mainly derived from macrohages and their cellular precursors, Ly6Chi monocytes.
RGD imaging and cellular targets
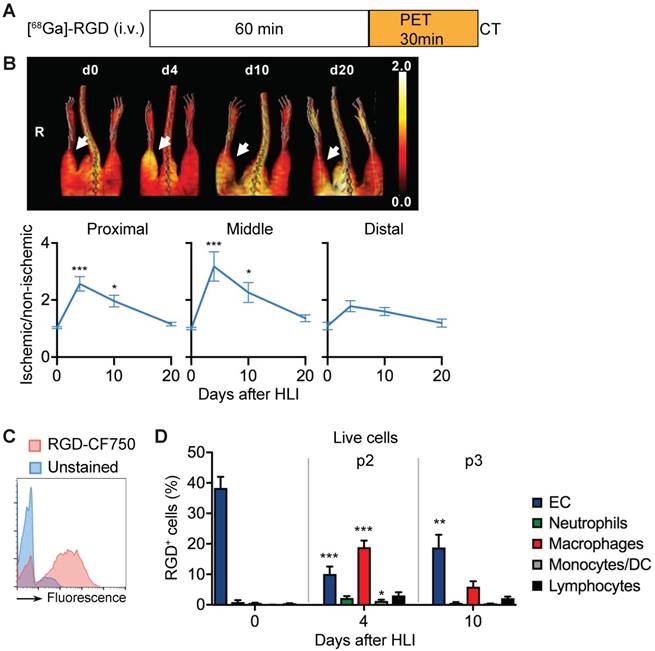
We next compared the in vivo signal and the corresponding cellular targets of the RGD peptide sequence. In [68Ga]-RGD PET/CT imaging (Figure 5a), the signal intensity significantly increased in the proximal and middle VOI, peaked during the p2 period at d4 after HLI (reaching an increase by 218% in middle VOI, p= 0.0002), but remained significantly elevated throughout the protracted p3 post-ischemic phase (Figure 5b), thus displaying a prolonged signal response (Figure 5b, Table 7).
RGD binding analysis and cellular targets. (a) [68Ga]-RGD imaging protocol. (b) Representative MIP PET/CT [68Ga]-RGD scans (upper panel, non-perfusion-corrected), quantification by VOI analysis, cumulative average ratios of perfusion-normalized radiotracer uptake, n=6 (d0); n=11 (d4), n=10 (d10) and n=9 (d20). * vs. baseline, Kruskal-Wallis test. The color bar represents the color spectrum scaled to the middle VOI of the control leg and indicates the ischemic to non-ischemic ratio. (c-d) RGD-binding analysis by flow cytometry with CruzFluor750-labeled RGD peptide in single cell suspensions from muscles. (c) Representative flow cytometry of RGD-CF750. (d) Relative frequencies of cell populations in total RGD-CF750+ gate, pooled from 6 independent experiments. n=5 (d0), 6 (d4), 8 (d10). *P<0.05, **P<0.01 ***P<0.001, one-way ANOVA with Bonferroni's multiple comparison test.
PET/CT analysis of [68Ga]-RGD uptake
| [68Ga]-RGD | HLI | ||||
|---|---|---|---|---|---|
| Days | 0 | 4 | 10 | 20 | |
| Mouse N= | 6 | 11 | 10 | 9 | |
| VOI | Proximal | 1,03±0,04 | 2,57±0,26 | 1,96±0,2 | 1,15±0,06 |
| Middle | 1±0,04 | 3,18±0,51 | 2,26±0,35 | 1,36±0,12 | |
| Distal | 1,1±0,13 | 1,79±0,2 | 1,6±0,14 | 1,19±0,14 | |
To define potential cellular targets of RGD we stained single-cell muscle preparations with a fluorescence-labled RGD and analyzed RGD-binding of different cell populations by flow cytometry over time (Figure 5c, Table 8).
Definition of cell populations for RGD-binding analysis:
| Phenotype | Cell type |
|---|---|
| CD11b+F4/80+CX3CR1+ | Macrophages |
| CD11b+F4/80lo/-CX3CR1+ | Monocytes, DC |
| Lin+CD11b+CX3CR1- | Neutrophils |
| Lin+CD11b- | Lymphocytes (B, T, NK, NKT) |
| CD45-CD31+ | EC |
Lin: CD19, CD3, NK1.1, Ly6G.
In non-ischemic muscle, RGD-binding capacity was attributed mostly to EC (Figure 5d). In contrast, during the peak in vivo RGD signal at d4, RGD-binding capacity was attributed to EC and macrophages, with the latter being the dominant cell population. Lymphocytes showed low, but significantly increased binding capacity, while neutrophils did not contribute to RGD-binding (Figure 5d, Table 8). Overall, these data demonstrate that the RGD signal is a composite derived from monocytes, macrophages and EC in varying proportions.
Discussion
Angiogenesis and arteriogenesis contribute to neovascularization after ischemia but are thought to be distinct and partially independent processes [35]. Comparing nuclear imaging patterns for the arterial phase and tissue perfusion we show that recovery of arterial influx precedes recovery of tissue perfusion, and that the subacute p2 phase after ischemia is characterized by impaired tissue perfusion despite normalized arterial influx. We also confirm earlier findings that tissue perfusion by [99mTc]-sestamibi imaging seems to be normalized at d7 [11], which could also be explained by increased permeability, and that small impairments in perfusion continue to develop for a prolonged period of time. Arteriogenesis is capable of fully restoring blood flow by means of remodeling of small collateral arteries into conductance vessels [4]. However, our data suggest that, although a prerequisite for restoration of perfusion, arteriogenesis is not the sole determinant of perfusion recovery and that microvascular adaptations occurring during ischemia and angiogenesis are equally important in determining perfusion recovery after ischemia. One explanation could be our observation that the subacute phase after ischemia is characterized by a transient but pronounced loss of viable EC in ischemic muscle (in relative and absolute numbers), which contributes to capillary rarefication in addition to other processes, such as microvascular thrombosis. We also show that for most nuclear imaging parameters, the proximal and middle VOI behave in a similar manner with the exception of arterial influx, which recovers quicker and more pronounced in the proximal VOI. This is consistent with rapid remodelling of collateral arteries in the proximal muscle region during arteriogenesis [5, 36].
Our systematic analysis also revealed that there is a transient window of depressed tissue perfusion but increased or normalized glucose utilization in peripheral muscle after induction of limb ischemia, which occurred in the subacute p2 phase. Analysis of cellular changes in ischemic tissue revealed that the number of macrophages, but not monocytes or lymphocytes, was closely associated with this signature, and macrophages were identified as major glucose consumers during this phase. This signature is reminiscent of hybernating, post-ischemic myocardium [14]. Indeed, while most studies focus on the cellular and subcellular changes in ischemic muscle fibers observed in hibernating tissue [37], there is evidence for a local inflammatory response in hibernating myocardial tissue characterized by active recruitment of macrophages, and the presence of macrophages is associated with improved functional recovery after revascularization [38, 39]. Thus, the signature of hibernating myocardium by nuclear imaging studies might also indicate the presence of macrophages in addition to metabolic changes in muscle, since macrophages use glucose metabolism as their major energy source during inflammation [40]. However, a direct comparison between heart and peripheral muscle in our setting is difficult, since we performed scans in resting, aneastesized mice with inactive limb muscles, while the heart muscle is always active. Furthermore, our data also support and complement clinical data from patient with stroke [41], myocardial infarction [42] and atherosclerosis [13] showing upregulation of glucose metabolism during ischemia or inflammation.
In addition, we found a close association between normalization of arterial influx and the appearance of macrophages after limb ischemia during the subacute p2 phase. Indeed, following ischemia, Ly6Chi monocytes are recruited to ischemic muscle, where they mature into macrophages that promote collateral remodelling and arteriogenesis, which is required for ischemic tissue recovery [6, 7]. The demonstration of a close association between macrophages and arterial influx imaging thus supports the essential role of macrophages for arteriogenesis on the level of circulatory parameters. In addition, the prolonged presence of macrophages in ischemic muscle might also contribute to EC recovery and restoration of tissue perfusion, since macrophages exert pro-angiogenic effects [43].
In search for a non-invasive and clinically useful marker for monocytes and macrophages we performed nuclear imaging with the highly specific TSPO agonist [18F]-GE180 [24]. TSPO (peripheral benzodiazepine receptor) is an evolutionary conserved mitochondrial outer membrane protein that plays a role in immune functions by regulating transmembrane transport of cholesterol, steroidogenesis, mitochondrial fatty acid metabolism and proliferation [20, 23, 44]. TSPO is involved in oxygen consumption and ATP synthesis of microglia [45], a brain myeloid cell population, and TSPO radioprobes selectively label activated microglia and macrophages after nerve or brain injury [24, 45, 46]. Our analysis of TSPO expression in single cells by flow cytometry revealed that in ischemic muscle, Ly6Chi monocytes and macrophages express the highest levels of TSPO. In addition, we found that TSPO nuclear imaging activity and total TSPO cell expression were temporarily matched, and that the peak of TSPO signal by nuclear imaging or flow cytometry coincided with the window of macrophage accumulation during hibernation. This suggests that TSPO nuclear imaging is useful to characterize myeloid inflammation in peripheral tissues or tumors, maybe in conjunction with glucose uptake studies. It might therefore also serve as another marker of hibernation ischemic tissue.
In contrast to the TSPO signal, RGD-based imaging displayed a more prolonged time course after HLI, although the peak signal likewise occurred during the subacute p2 phase. These data are in line with the previous reports using 125I-c(RGD(I)yV) [47]. The RGD tripeptide binds αVβ3 integrin expressed in a variety of conditions, such as inflammatory cell recruitment, angiogenesis, wound healing or tumor metastasis [48], due to expression on EC and macrophages [16, 49]. Consequently, cell population analysis of RGD-binding capacity by flow cytometry after ischemia revealed that EC and macrophages contribute differentially to RGD-binding capacity in tissues during different phases of the ischemic tissue response. While EC are major contributors to RGD-binding capacity at baseline and during the protracted post-ischemic phase, which is most likely explained by cell population kinetics, macrophages are major contributors to the RGD-binding capacity during the subacute phase, again explained by cell kinetics. Thus, RGD-based imaging might give a composite signal comprised of inflammatory cells and EC, which dynamically change during ischemia, leading to a prolonged, but less specific signal.
Our study has some limitations. First, our study was performed on a non-atherosclerotic backround with mice on normal chow. Second, it was not possible to combine arterial influx and tissue perfusion studies in a truly longitudinal design in individual mice since analysis of the former requires sacrifice of the animal. Third, due to logistical and technical limitations we were not able to perform different tracer studies in the same set of mice, but used separate groups of mice for each study, as indicated in the tables. Nevertheless, the high grade of standardization of the animal model facilitates a comparision between different groups. Fourth, imaging resolution of small animal nuclear imaging scanners is usually limited to 1.5-2 mm. As the target structures in mice are rather small, tissue subtypes like skin, subcutaneous tissue, and muscle or bone tissue were not discretely separated for the imaging analysis in the chosen VOI, while in flow cytometry we focused on analysis of whole muscle tissue. Although this might introduce some bias, we did not recognize a signal distribution in nuclear imaging suggesting a major focal skin or bone signal. This problem applies to perfusion studies, but also to RGD-binding studies, since RGD domain compounds used in our studies can bind to other integrin subtypes, such as αVβ5 and αVβ1, expressed by cell types represented in the imaging studies but excluded in cellular analysis by flow cytometry [50, 51]. Furthermore, although we used the same c(RGDyK) domain-containing agents for integrin labeling studies, the compounds used in vitro and in vivo differ, which might result in differential cell binding in vivo and in vitro. Furthermore, in vitro studies might overestimate in vivo integrin binding activity, which is influence by the concentration of cations in the medium [32]. Last, the [99mTc]-sestamibi signal might reflect increased permeability rather than perfusion, which might explain the transient peak in tissue perfusion at d7 (Fig. 1c), but this would not explain the observed mismatch between arterial influx and tissue perfusion observed at ealier timepoints, which correlate with high glucose utilization and macrophage influx.
On the other hand, the potential impact of our findings is underscored by the fact that nuclear imaging is a translational technique, which is clinically available. The findings described in the study, i. e. a period of arterial recovery marked by high glucose/macrophage signature, might help to better identify responders to establish or new therapeutic intervention (e. g. cell-based therapies) vs. non-responders. Also, it might stimulate further basic and clinical reasearch influencing inflammation and/or metabolism to alter ischemic tissue fate.
In summary, our data suggest that recovery of ischemic tissues requires close coupling of arteriogenesis and angiogenesis. In addition, there is a transient period marked by reduced tissue perfusion but increased glucose uptake, which is characterized by increased arterial influx and prominent macrophage infiltration. While [18F]-GE180 imaging is relatively specific for monocytes and macrophages, thus showing a peaked response during the subacute phase, [68Ga]-RGD imaging shows a prolonged time course due to binding to both of macrophages and EC.
Supplementary Material
Supplementary figures.
Acknowledgements
We would like to thank S. Sablotny and S. Eilert for expert technical help and J. Thackeray for helpful discussions. Use of [18F]-GE180 was granted by a license from GE. This research was funded by grants from Deutsche Forschungsgemeinschaft (Li948/5-1) and Bundesministerium für Bildung und Forschung (IFB-Tx 01EO1302) to F.P.L and the Excellence Cluster REBIRTH to F. M. B.
Author contributions
TK, JPB, AW, WK, MB, JG, KK, TLR, GM performed experiments. TK, JBP, AW, MB and FPL analyzed the data. TK, JPB, AL, HH, FMB and FPL wrote and edited the manuscript. FPL conceived the study.
Competing Interests
The authors have declared that no competing interest exists.
References
1. Kullo IJ, Rooke TW. CLINICAL PRACTICE. Peripheral Artery Disease. The New England journal of medicine. 2016;374:861-71
2. Kumbhani DJ, Steg PG, Cannon CP, Eagle KA, Smith SC Jr, Goto S. et al. Statin therapy and long-term adverse limb outcomes in patients with peripheral artery disease: insights from the REACH registry. Eur Heart J. 2014;35:2864-72
3. Cooke JP, Losordo DW. Modulating the vascular response to limb ischemia: angiogenic and cell therapies. Circulation research. 2015;116:1561-78
4. Carmeliet P. Mechanisms of angiogenesis and arteriogenesis. Nat Med. 2000;6:389-95
5. Limbourg A, Korff T, Napp LC, Schaper W, Drexler H, Limbourg FP. Evaluation of postnatal arteriogenesis and angiogenesis in a mouse model of hind-limb ischemia. Nat Protoc. 2009;4:1737-46
6. Arras M, Ito WD, Scholz D, Winkler B, Schaper J, Schaper W. Monocyte activation in angiogenesis and collateral growth in the rabbit hindlimb. J Clin Invest. 1998;101:40-50
7. Krishnasamy K, Limbourg A, Kapanadze T, Gamrekelashvili J, Beger C, Hager C. et al. Blood vessel control of macrophage maturation promotes arteriogenesis in ischemia. Nat Commun. 2017;8:952
8. Stacy MR, Paeng JC, Sinusas AJ. The role of molecular imaging in the evaluation of myocardial and peripheral angiogenesis. Annals of nuclear medicine. 2015;29:217-23
9. Stacy MR, Sinusas AJ. Novel Applications of Radionuclide Imaging in Peripheral Vascular Disease. Cardiol Clin. 2016;34:167-77
10. Miles KA, Barber RW, Wraight EP, Cooper M, Appleton DS. Leg muscle scintigraphy with 99Tcm-MIBI in the assessment of peripheral vascular (arterial) disease. Nuclear medicine communications. 1992;13:593-603
11. Hendrikx G, Vries MH, Bauwens M, De Saint-Hubert M, Wagenaar A, Guillaume J. et al. Comparison of LDPI to SPECT perfusion imaging using (99m)Tc-sestamibi and (99m)Tc-pyrophosphate in a murine ischemic hind limb model of neovascularization. EJNMMI Res. 2016;6:44-9
12. Grosser OS, Ruf J, Kupitz D, Pethe A, Ulrich G, Genseke P. et al. Pharmacokinetics of 99mTc-MAA- and 99mTc-HSA-Microspheres Used in Preradioembolization Dosimetry: Influence on the Liver-Lung Shunt. J Nucl Med. 2016;57:925-7
13. Rudd JH, Warburton EA, Fryer TD, Jones HA, Clark JC, Antoun N. et al. Imaging atherosclerotic plaque inflammation with [18F]-fluorodeoxyglucose positron emission tomography. Circulation. 2002;105:2708-11
14. Ghosh N, Rimoldi OE, Beanlands RSB, Camici PG. Assessment of myocardial ischaemia and viability: role of positron emission tomography. European Heart Journal. 2010;31:2984-95
15. Ruoslahti E. RGD and other recognition sequences for integrins. Annu Rev Cell Dev Biol. 1996;12:697-715
16. Ruoslahti E, Pierschbacher MD. New perspectives in cell adhesion: RGD and integrins. Science. 1987;238:491-7
17. Haubner R, Wester HJ, Reuning U, Senekowitsch-Schmidtke R, Diefenbach B, Kessler H. et al. Radiolabeled alpha(v)beta3 integrin antagonists: a new class of tracers for tumor targeting. J Nucl Med. 1999;40:1061-71
18. Chen X, Park R, Shahinian AH, Tohme M, Khankaldyyan V, Bozorgzadeh MH. et al. 18F-labeled RGD peptide: initial evaluation for imaging brain tumor angiogenesis. Nuclear medicine and biology. 2004;31:179-89
19. Gaertner FC, Kessler H, Wester HJ, Schwaiger M, Beer AJ. Radiolabelled RGD peptides for imaging and therapy. Eur J Nucl Med Mol Imaging. 2012;39(Suppl 1):S126-38
20. Papadopoulos V, Baraldi M, Guilarte TR, Knudsen TB, Lacapere JJ, Lindemann P. et al. Translocator protein (18kDa): new nomenclature for the peripheral-type benzodiazepine receptor based on its structure and molecular function. Trends Pharmacol Sci. 2006;27:402-9
21. Motloch LJ, Hu J, Akar FG. The mitochondrial translocator protein and arrhythmogenesis in ischemic heart disease. Oxid Med Cell Longev. 2015;2015:234104
22. Kunduzova OR, Escourrou G, De La Farge F, Salvayre R, Seguelas MH, Leducq N. et al. Involvement of peripheral benzodiazepine receptor in the oxidative stress, death-signaling pathways, and renal injury induced by ischemia-reperfusion. J Am Soc Nephrol. 2004;15:2152-60
23. Li F, Liu J, Liu N, Kuhn LA, Garavito RM, Ferguson-Miller S. Translocator Protein 18 kDa (TSPO): An Old Protein with New Functions? Biochemistry. 2016;55:2821-31
24. Boutin H, Murray K, Pradillo J, Maroy R, Smigova A, Gerhard A. et al. 18F-GE-180: a novel TSPO radiotracer compared to 11C-R-PK11195 in a preclinical model of stroke. Eur J Nucl Med Mol Imaging. 2015;42:503-11
25. Largeau B, Dupont AC, Guilloteau D, Santiago-Ribeiro MJ, Arlicot N. TSPO PET Imaging: From Microglial Activation to Peripheral Sterile Inflammatory Diseases? Contrast Media Mol Imaging. 2017;2017:6592139
26. Jung S, Aliberti J, Graemmel P, Sunshine MJ, Kreutzberg GW, Sher A. et al. Analysis of fractalkine receptor CX(3)CR1 function by targeted deletion and green fluorescent protein reporter gene insertion. Mol Cell Biol. 2000;20:4106-14
27. Brackhan M, Bascunana P, Postema JM, Ross TL, Bengel FM, Bankstahl M. et al. Serial Quantitative TSPO-Targeted PET Reveals Peak Microglial Activation up to 2 Weeks After an Epileptogenic Brain Insult. J Nucl Med. 2016;57:1302-8
28. Mueller D, Klette I, Baum RP, Gottschaldt M, Schultz MK, Breeman WA. Simplified NaCl based (68)Ga concentration and labeling procedure for rapid synthesis of (68)Ga radiopharmaceuticals in high radiochemical purity. Bioconjug Chem. 2012;23:1712-7
29. Pohle K, Notni J, Bussemer J, Kessler H, Schwaiger M, Beer AJ. 68Ga-NODAGA-RGD is a suitable substitute for (18)F-Galacto-RGD and can be produced with high specific activity in a cGMP/GRP compliant automated process. Nuclear medicine and biology. 2012;39:777-84
30. Thackeray JT, Hupe HC, Wang Y, Bankstahl JP, Berding G, Ross TL. et al. Myocardial Inflammation Predicts Remodeling and Neuroinflammation After Myocardial Infarction. J Am Coll Cardiol. 2018;71:263-75
31. Zhang X, Xiong Z, Wu Y, Cai W, Tseng JR, Gambhir SS. et al. Quantitative PET imaging of tumor integrin alphavbeta3 expression with 18F-FRGD2. J Nucl Med. 2006;47:113-21
32. Hu DD, Hoyer JR, Smith JW. Ca2+ suppresses cell adhesion to osteopontin by attenuating binding affinity for integrin alpha v beta 3. The Journal of biological chemistry. 1995;270:9917-25
33. Gamrekelashvili J, Giagnorio R, Jussofie J, Soehnlein O, Duchene J, Briseno CG. et al. Regulation of monocyte cell fate by blood vessels mediated by Notch signalling. Nat Commun. 2016;7:12597
34. Wadsworth H, Jones PA, Chau WF, Durrant C, Fouladi N, Passmore J. et al. [(1)(8)F]GE-180: a novel fluorine-18 labelled PET tracer for imaging Translocator protein 18 kDa (TSPO). Bioorg Med Chem Lett. 2012;22:1308-13
35. Heil M, Eitenmuller I, Schmitz-Rixen T, Schaper W. Arteriogenesis versus angiogenesis: similarities and differences. J Cell Mol Med. 2006;10:45-55
36. Helisch A, Wagner S, Khan N, Drinane M, Wolfram S, Heil M. et al. Impact of mouse strain differences in innate hindlimb collateral vasculature. Arterioscler Thromb Vasc Biol. 2006;26:520-6
37. Wijns W, Vatner SF, Camici PG. Hibernating myocardium. The New England journal of medicine. 1998;339:173-81
38. Dewald O, Frangogiannis NG, Zoerlein M, Duerr GD, Klemm C, Knuefermann P. et al. Development of murine ischemic cardiomyopathy is associated with a transient inflammatory reaction and depends on reactive oxygen species. Proceedings of the National Academy of Sciences of the United States of America. 2003;100:2700-5
39. Frangogiannis NG, Shimoni S, Chang SM, Ren G, Shan K, Aggeli C. et al. Evidence for an active inflammatory process in the hibernating human myocardium. The American journal of pathology. 2002;160:1425-33
40. O'Neill LA, Hardie DG. Metabolism of inflammation limited by AMPK and pseudo-starvation. Nature. 2013;493:346-55
41. Bunevicius A, Yuan H, Lin W. The potential roles of 18F-FDG-PET in management of acute stroke patients. Biomed Res Int. 2013;2013:634598
42. Ghesani M, Depuey EG, Rozanski A. Role of F-18 FDG positron emission tomography (PET) in the assessment of myocardial viability. Echocardiography. 2005;22:165-77
43. Wynn TA, Chawla A, Pollard JW. Macrophage biology in development, homeostasis and disease. Nature. 2013;496:445-55
44. Tu LN, Zhao AH, Hussein M, Stocco DM, Selvaraj V. Translocator Protein (TSPO) Affects Mitochondrial Fatty Acid Oxidation in Steroidogenic Cells. Endocrinology. 2016;157:1110-21
45. Banati RB, Middleton RJ, Chan R, Hatty CR, Kam WW, Quin C. et al. Positron emission tomography and functional characterization of a complete PBR/TSPO knockout. Nat Commun. 2014;5:5452
46. Cagnin A, Brooks DJ, Kennedy AM, Gunn RN, Myers R, Turkheimer FE. et al. In-vivo measurement of activated microglia in dementia. Lancet. 2001;358:461-7
47. Lee KH, Jung KH, Song SH, Kim DH, Lee BC, Sung HJ. et al. Radiolabeled RGD uptake and alphav integrin expression is enhanced in ischemic murine hindlimbs. J Nucl Med. 2005;46:472-8
48. Truong H, Danen EH. Integrin switching modulates adhesion dynamics and cell migration. Cell Adh Migr. 2009;3:179-81
49. Beer AJ, Pelisek J, Heider P, Saraste A, Reeps C, Metz S. et al. PET/CT imaging of integrin alphavbeta3 expression in human carotid atherosclerosis. JACC Cardiovasc Imaging. 2014;7:178-87
50. Sarin V, Gaffin RD, Meininger GA, Muthuchamy M. Arginine-glycine-aspartic acid (RGD)-containing peptides inhibit the force production of mouse papillary muscle bundles via alpha 5 beta 1 integrin. The Journal of physiology. 2005;564:603-17
51. Pedchenko V, Zent R, Hudson BG. Alpha(v)beta3 and alpha(v)beta5 integrins bind both the proximal RGD site and non-RGD motifs within noncollagenous (NC1) domain of the alpha3 chain of type IV collagen: implication for the mechanism of endothelia cell adhesion. The Journal of biological chemistry. 2004;279:2772-80
Author contact
![]() Corresponding author: Prof. Dr. Florian P. Limbourg, Dept. of Nephrology and Hypertension, Hannover Medical School, Hannover, Germany. email: limbourg.floriande
Corresponding author: Prof. Dr. Florian P. Limbourg, Dept. of Nephrology and Hypertension, Hannover Medical School, Hannover, Germany. email: limbourg.floriande