Theranostics
13.3
Impact Factor
 Global reach, higher impact
Theranostics 2019; 9(2):311-323. doi:10.7150/thno.29755 This issue Cite
Research Paper
Microhexagon gradient array directs spatial diversification of spinal motor neurons
Geok Soon Lim1,2*, Jin Hui Hor2,3*, Nicholas R.Y. Ho1,2, Chi Yan Wong1,2, Shi Yan Ng2,4,5,6, Boon Seng Soh2,3,6 ![]() , Huilin Shao1,2,5,7,8
, Huilin Shao1,2,5,7,8 ![]()
1. Biomedical Institute for Global Health Research and Technology, National University of Singapore, 117599, Singapore
2. Institute of Molecular and Cell Biology, Agency for Science, Technology and Research, 138673, Singapore
3. Department of Biological Sciences, Faculty of Science, National University of Singapore, 117543, Singapore
4. Department of Physiology, Yong Loo Lin School of Medicine, National University of Singapore, 117456, Singapore
5. National Neuroscience Institute, 308433, Singapore
6. Key Laboratory for Major Obstetric Diseases of Guangdong Province, The Third Affiliated Hospital of Guangzhou Medical University, Guangzhou, 510150, China
7. Department of Biomedical Engineering, Faculty of Engineering, National University of Singapore, 117583, Singapore
8. Department of Surgery, Yong Loo Lin School of Medicine, National University of Singapore, 119228, Singapore
* These authors contributed equally
Received 2018-9-6; Accepted 2018-11-20; Published 2019-1-1
Citation:
Lim GS, Hor JH, Ho NRY, Wong CY, Ng SY, Soh BS, Shao H. Microhexagon gradient array directs spatial diversification of spinal motor neurons. Theranostics 2019; 9(2):311-323. doi:10.7150/thno.29755. https://www.thno.org/v09p0311.htm
Other stylesAbstract

Motor neuron diversification and regionalization are important hallmarks of spinal cord development and rely on fine spatiotemporal release of molecular cues. Here, we present a dedicated platform to engineer complex molecular profiles for directed neuronal differentiation.
Methods: The technology, termed microhexagon interlace for generation of versatile and fine gradients (microHIVE), leverages on an interlocking honeycomb lattice of microstructures to dynamically pattern molecular profiles at a high spatial resolution. By packing the microhexagons as a divergent, mirrored array, the platform not only enables maximal mixing efficiency but also maintains a small device footprint.
Results: Employing the microHIVE platform, we developed optimized profiles of growth factors to induce rostral-caudal patterning of spinal motor neurons, and directed stem cell differentiation in situ into a spatial continuum of different motor neuron subtypes.
Conclusions: The differentiated cells showed progressive RNA and protein signatures, consistent with that of representative brachial, thoracic and lumbar regions of the human spinal cord. The microHIVE platform can thus be utilized to develop advanced biomimetic systems for the study of diseases in vitro.
Keywords: Microfluidics, molecular gradient, stem cell, motor neuron, spinal cord
Introduction
The spinal cord consists of a continuum of multiple subtypes of motor neurons, spatially organized to relay signals from the brain to individual muscle groups and actuate movements [1]. Such neuronal diversity and regionalization are important in both health and disease [2]. Motor neuron subtype diversification and interaction are necessary to maintain neuronal connectivity, and could shed light on the neurons' differential vulnerability in many human neurodegenerative diseases (e.g., amyotrophic lateral sclerosis) [3, 4]. To develop advanced biomimetic systems for disease modeling and regenerative medicine, there is thus intense interest to establish an in vitro spinal cord model that can recapitulate motor neuron diversification and regionalization [5, 6].
Recent progress in embryonic patterning and stem cell reprogramming has identified that spinal motor neuron development is a highly complex and regulated process [7-9]. Precise spatial and temporal release of a multitude of growth factors directs stem cell differentiation into motor neuron subtypes. For example, after the specification of neural progenitor cells along the rostral-caudal axis, fine spatiotemporal gradients of multiple signaling molecules (e.g., retinoic acid, Wnt and FgF signals) provide a precise roadmap for the cells to interpret their relative local coordinates, to refine cellular differentiation into various spinal motor neuron identifies (e.g., through the induction of differential patterns of HOX gene expression), and to regionalize correctly with respect to other subtypes along the spinal cord [10, 11].
Despite such progress, it remains challenging to achieve spinal motor neuron diversification and regionalization in vitro. This is largely due to limitations of existing technologies to implement and regulate complex and fine molecular gradients [12]. Conventional cell culture technologies rely primarily on bath applications of growth factors; such discrete treatments not only have limited scalability for combinatorial analysis of multiple growth factors but also lack the ability to direct subtype differentiation in a spatial continuum. New technologies have been developed to address this challenge [13-16]; however, they too face limitations. For example, microdevices based on passive Fickian diffusion could generate simple, static gradient profiles, but have limited ability to implement complex, dynamic profiles [17, 18]. Microfluidic devices based on fluid mixing and splitting (e.g., Christmas tree-type devices [19]) could enable better dynamic control and generate more complex profiles, but they commonly have a limited spatial resolution which could only be improved at the expense of a significantly larger device footprint [20].
Inspired by the compact honeycomb lattice structure, we developed a dedicated platform to direct spinal motor neuron diversification and regionalization. Termed microhexagon interlace for generation of versatile and fine gradients (microHIVE), the device consists of a divergent, mirrored array of microhexagons to engineer complex and precise molecular concentration profiles, and an all-polymer cell culture chamber for directed stem cell differentiation into a continuous assembly of different motor neurons. We optimized each microhexagon structure in the divergent array to define fluidic branching and mixing, thus enabling versatile and dynamic gradient patterning at a high spatial resolution. By arranging a dense array of these microstructures as an interlocking honeycomb lattice, we showed that the platform not only enabled maximal mixing efficiency but also maintained a small device footprint. This unique implementation thus helps to address all of the aforementioned challenges: the microhexagon lattice enables dynamic and fine spatiotemporal control of complex gradients; the all-polymer culture chamber supports cellular differentiation, and could be readily dissected for molecular analysis and spatial correlation. Employing the microHIVE platform, we generated complex and high-resolution molecular gradients of multiple growth factors, and directed the diversification and regionalization of spinal motor neurons in situ. The continuum of differentiated motor neurons showed progressive and characteristic RNA and protein signatures, consistent with that of representative brachial, thoracic and lumbar regions of the human spinal cord.
Results
Honeycomb lattice for directed differentiation of spinal motor neurons
The microHIVE platform consists of an interlocking array of microhexagons, arranged as a divergent honeycomb lattice, which opens into a cell culture chamber (Fig. S1A). The device is thus designed to achieve three functional steps: (i) cell seeding, (ii) gradient generation and directed differentiation, and (iii) binning and analysis (Fig. 1A). By orientating the cell culture chamber orthogonal with respect to the fluidic inflow from the honeycomb lattice, we could position the long axis of the seeded cells perpendicular to the influx of growth factors, thereby mimicking the natural development of the rostral-caudal axis of the spinal cord [8, 10]. We apply different combinations of growth factors through the honeycomb lattice to spatially direct cellular differentiation. Specifically, the streams of growth factors repeatedly branch and mix between the microhexagons to generate complex and high-resolution molecular gradients (Fig. S1B-C); this enables diversification and regionalization of different motor neuron subtypes along the culture chamber (made entirely of soft polymers, Fig. S2). Finally, by sectioning the culture chamber into discrete bins, we could characterize the spatial continuum of motor neuron identities, through independent RNA and protein analyses.
In directing motor neuron differentiation along the rostral-caudal axis, we varied the molecular profiles of retinoic acid and growth differentiation factor 11 (GDF11) [2, 21] to induce local diversification and regionalization (Fig. 1B). We applied an optimized profile of both retinoic acid and GDF11 to guide spatial differentiation, thereby promoting rostralization of motor neurons in the brachial region and caudalization in the thoracic and lumbar regions. The combinatorial effects resulted in coordinated molecular programming, through differential induction of HOX gene expressions, to confer precise cellular and positional identities. To validate the spinal motor neuron subtypes, we characterized their expressions of region-associated HOX genes.
Figure 1C shows a prototype microHIVE platform developed for directed differentiation of spinal motor neurons. The device was designed with three inlets to enable simultaneous inflow of multiple growth factors, and to improve its versatility in complex gradient patterning along the length of the culture chamber. With the interlocking microhexagon lattice (Fig. 1C, insert), we could increase the density of the branching network in the gradient generator. This not only enhances the spatial resolution of the generated molecular profiles, but also maximizes the mixing efficiency while maintaining a small device footprint. The mirrored lattice connecting to the waste outlet helps to stabilize the gradient profile across the transverse cross-section of the culture chamber.
Figure 1
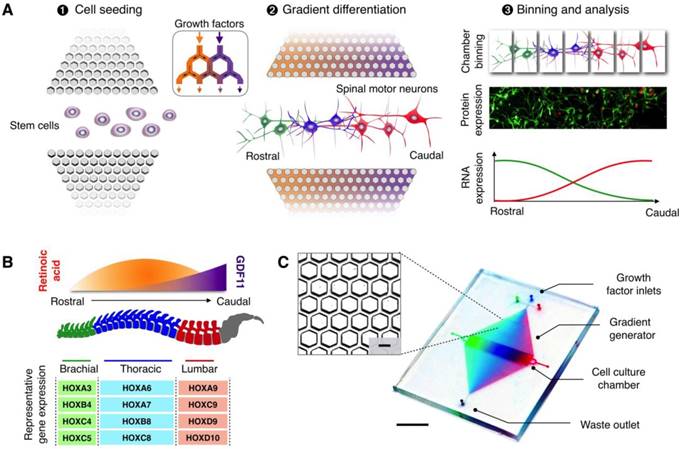
MicroHIVE platform for directed differentiation of spinal motor neurons. (A) The microHIVE platform consists of a divergent honeycomb lattice of microhexagon structures that opens into a cell culture chamber, to enable stem cell seeding, generation of molecular gradients for directed cellular differentiation, and device binning and analysis. Seeded stem cells are exposed to fine spatiotemporal release of growth factors, whose flow streams branch and mix between the microhexagons to generate complex and high-resolution molecular gradients. These local molecular changes direct stem cell differentiation into an organized, continuous assembly of different spinal motor neuron subtypes. Through binning of the all-polymer culture chamber, the motor neuron assembly can be spatially dissected and its cellular identities characterized through RNA and protein measurements. (B) Schematic representation of an optimized molecular profile of retinoic acid and GDF11 to guide rostral-caudal motor neuron differentiation. The differentiated motor neurons can be categorized according to their associated regions in the spinal cord (i.e., brachial, thoracic and lumbar), as characterized by their differential expressions of region-associated HOX genes. (C) Photograph of the developed microHIVE platform. Scale bar indicates 1 cm. Insert shows a magnified view of the interlocking array of microhexagons. Scale bar of the insert indicates 100 μm.
Characterization of microhexagon array
We first optimized the design of each microhexagon structure to improve the platform's lateral resolution for gradient generation (Fig. 2A). Through numerical simulation (Comsol), we varied the length of the microstructures, while keeping constant the inter-structure spacing (50 μm) as well as the final divergent length of the culture chamber (28 mm) (Fig. S1B). The smallest microstructures tested (20 μm in length) were unable to provide sufficient diffusion length for effective mixing, resulting in a poor lateral resolution. Between the range of 100 μm to 1000 μm, the resolution improved as the microstructure length decreased. We attribute this improvement to the increase in packing density of the shorter microstructures into the same device footprint, hence enabling more channel openings into the culture chamber. In comparison to an established “Christmas-tree” serpentine mixer, which was designed to occupy the same device footprint (Fig. S3A-B), the optimized microhexagons (100 μm) demonstrated >16 fold improvement in lateral resolution. We next investigated the effects of repeated fluid branching and mixing at the junctions (i.e., number of rows of microhexagons in the lattice) on the mixing efficiency (Fig. 2B). While the diffusion length around each microhexagon was significantly shorter than that of conventional serpentine mixer, the microstructures could achieve complete mixing by repeated branching and mixing at recurrent junctions - a microfluidic phenomenon that decreases the striation length and increases the overall area across which diffusion takes place [22]. The optimized array was thus designed to incorporate an interlocking lattice of microhexagons, arranged to accommodate >100 junctions along the fluid pathway, to ensure optimal mixing while maintaining a high lateral resolution.
Figure 2
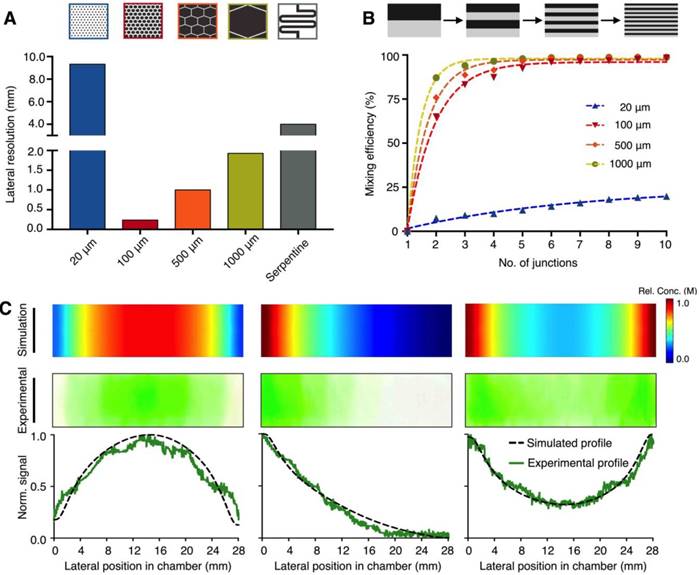
Microhexagon array for gradient generation. (A) Optimization of the microhexagon dimensions. To improve the microHIVE platform's lateral resolution for gradient generation, through numerical simulation, we varied the lengths of the microhexagons while keeping constant the inter-structure spacing and the final divergent length of the culture chamber. The performance of the microhexagon arrays were also compared against that of a conventional “Christmas-tree” serpentine mixer, designed to occupy the same device footprint as the microHIVE platform. Lateral resolution was defined as the lateral length of the culture chamber, normalized by the number of branched channel openings into the chamber. (B) Effects of repeated fluid branching and mixing at recurring junctions on the platform's mixing efficiency. Numerical simulations were performed to investigate the effects of microhexagon dimensions, as well as the number of recurrent junctions, on fluidic branching and mixing, so as to decrease striation length and improve fluid diffusion per microhexagon unit. (C) Versatile and accurate generation of complex gradients. By varying the respective positions, concentrations and flow rates at the three inlets, we designed and implemented representative gradient profiles on the microHIVE platform. Numerical simulations (top) were first performed to determine the shapes and slopes of the profiles. This was followed by experimental validation using colored dyes (middle). Quantitative correlation of the simulated and experimental profiles (bottom) illustrated the smoothness and accuracy of the generated gradients.
We further tested the versatility and accuracy of the developed platform in creating complex gradient profiles. By varying the position and concentration of inflow at the three inlets, as well as their respective flow rates, we could adjust the gradient profiles developed at the culture chamber (Fig. 2C). Specifically, we developed three different types of gradient profiles: (i) a symmetrical negative parabolic profile with a water-dye-water implementation; (ii) an asymmetrical cubic profile with a dye-water-water implementation; and (iii) a symmetrical parabolic profile with reduced amplitude with a dye-water-dye implementation. We first performed numerical simulations to predict and ascertain the shapes and slopes of the profiles (Fig. 2C, top). We then experimentally validated and imaged the profiles with colored dyes on the microHIVE platform (Fig. 2C, middle). When correlated to the simulated profiles, the microHIVE platform could generate accurate and smooth profiles across the entire lateral length of the culture chamber (Fig. 2C, bottom), and multiplex different gradient profiles simultaneously (Fig. S4). This is in comparison to the discrete step-wise changes generated by a similar-sized “Christmas-tree” gradient generator, when used to prepare these three profiles (Fig. S3C). Importantly, in the microHIVE platform, the mirrored network connecting to the waste outlet not only enabled accurate profile variation along the lateral positions of the culture chamber (i.e., x-axis), but also maintained a uniform concentration along its width (i.e., y-axis, Fig. S5A) and depth (i.e., z-axis, Fig. S5B).
Generation of molecular profiles
We next applied the microHIVE platform to generate molecular profiles with different growth factors (i.e., retinoic acid and GDF11). We first designed representative molecular profiles of the growth factors (Fig. 3A, top). We then varied multiple empirical parameters (e.g., position and concentration of growth factors, flow rates at different inlets) (Fig. 3A, middle) to achieve robust and corresponding experimental molecular profiles (Fig. 3A, bottom). To evaluate the exact concentrations of the experimental profiles, we sectioned the culture chamber into seven bins and quantified the concentrations of the eluted growth factors from each bin through spectrometric measurements (Fig. S6).
Figure 3
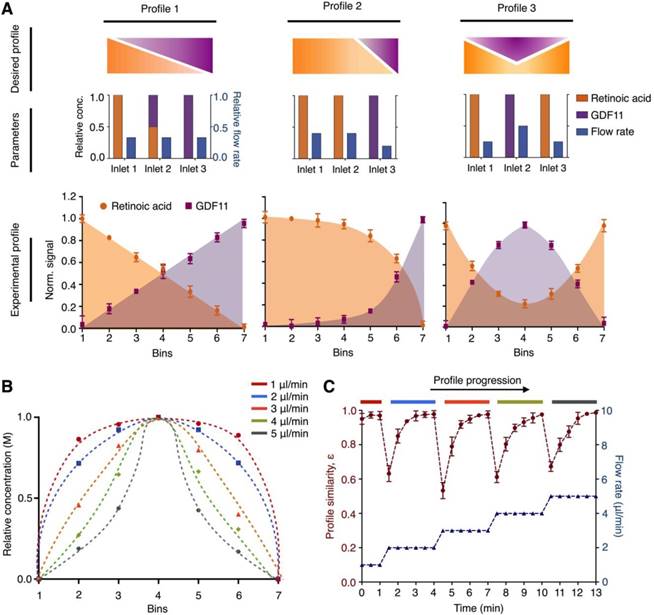
Versatile and dynamic control of molecular profiles. (A) Generation of simultaneous molecular profiles with retinoic acid and GDF11. We designed representative molecular profiles of the growth factors (top). By varying multiple empirical parameters including the positions, concentrations and flow rates of the growth factors at the respective inlets (middle), we generated and quantified corresponding experimental molecular profiles on the microHIVE platform (bottom). To measure the exact concentrations of the experimental profiles, we sectioned the culture chamber laterally into seven equal bins and quantified the concentrations of the eluted growth factors from each bin through spectrometric measurements. (B) Different molecular profiles with flow rate changes. To investigate the effects of flow rates in dynamically changing the shape of the molecular profile, we simulated a series of steady-state parabolic profiles of retinoic acid, by increasing the flow rates from 1 μl/min to 5 μl/min. (C) Dynamic response of the microHIVE platform. We empirically implemented these simulated parabolic molecular profiles on the microHIVE platform, by varying the flow rates accordingly, and monitored the changes in the experimental profile continuously. To quantitatively compare the experimental profile (under different flow rate regime) to their respective steady-state profile, we defined a profile similarity metric ε, based on the sum of the squares of the concentration offset at different spatial locations (see Methods for additional details). Note that the microHIVE platform not only generated accurate molecular profiles, but also showed a rapid response to equilibrate to steady-state. All experimental measurements were performed in triplicate, and the data are displayed as mean ± s.d in A and C.
We further investigated the effects of flow rate to dynamically change the shape of the molecular gradient profile. We first simulated a series of steady-state parabolic profiles of retinoic acid, by increasing the flow rates from 1 μl/min to 5 μl/min (Fig. 3B). We then experimentally varied the flow rates accordingly and measured the generated molecular profiles continuously (Fig. 3C). In comparing the key differences between the simulations and experimental data, we note that the simulated data showed only steady-state gradient profiles. The experimental data, however, showed dynamic changes before reaching empirical steady-states. We thus used this key difference to evaluate the time response characteristic of the microHIVE platform. Specifically, to quantitatively compare the empirical profile against the respective simulated steady-state profile, we defined a profile similarity metric ε, based on the sum of the squares of the concentration offsets at different spatial locations (see Methods for details). We found that the microHIVE platform not only generated highly accurate and predictive molecular profiles, but also showed a fast and robust response time (~ 1 minute) to dynamically equilibrate to steady-state. Importantly, when keeping to a constant flow rate, the microHIVE could maintain the desired molecular profiles for >14 days (Fig. S7), an important feature necessary to complete the duration of motor neuron differentiation.
Derivation of rostral-caudal motor neurons from human pluripotent stem cells
To generate diverse spinal motor neurons in vitro, we developed a differentiation protocol to investigate the varying effects of retinoic acid and GDF11 [2, 21], both of which are known to contribute to the rostral-caudal patterning of motor neurons (Fig. 4A). We developed the protocol by adapting our established differentiation method [23] that uses only fixed concentration of retinoic acid to generate rostral motor neurons (Fig. S8A). Specifically, to derive diverse spinal motor neurons, we used induced pluripotent stem cells (iPSC) that express pluripotency markers, OCT4 and SOX2 (Fig. S8B). We first induced neutralization of iPSC, through simultaneous activation of Wnt pathway (CHIR9902) and inhibition of Bone Morphogenic Protein (BMP) signaling (LDN-193189). At day 3, retinoic acid and GDF11 were added to start rostral-caudal patterning. Purmorphamine, a Sonic Hedgehog pathway agonist, was also added as a ventralizing signal. This generated homogeneous neural progenitor cells (NPC) at day 10 that expressed identifying markers, SOX1 and Nestin (Fig. 4B, top). Finally, neurotrophic factors (i.e., BDNF and GDNF) were introduced to the neuronal culture at day 17 to promote maturation of motor neurons. Elevated expressions of motor neuron markers, ISL1 and SMI-32, confirmed the successful differentiation of spinal motor neurons (MN) on day 28 (Fig. 4B, bottom). All cellular identities were further validated by RNA analysis (Fig. 4C).
Using the developed differentiation protocol, we next determined the effects of retinoic acid and GDF11 on inducing diversification of spinal motor neurons. We treated the cells with varying concentrations of retinoic acid and GDF11 from day 3 to day 17, and measured the corresponding changes in HOX gene expressions (Fig. 4D). All primers and antibodies used for cellular characterization can be found in Tables S1-2. By manipulating only the retinoic acid concentrations in an increasing manner (i.e., in the absence of GDF11), the neuronal cultures showed elevated expressions of many brachial / thoracic-associated HOX genes when treated with 1.0 - 5.0 μM retinoic acid (Fig. 4D, left). Neuronal cultures treated with increasing concentrations of GDF11 (10 - 200 ng/ml) and a fixed retinoic acid concentration (1.0 μM) adopted an increasing caudal spinal cord patterning, with up-regulation of thoracic / lumbar-associated HOX mRNA transcripts (Fig. 4D, right) as well as associated protein expression (Fig. S9).
On-chip spinal motor neuron diversification and regionalization
Through correlative analysis of growth factor concentrations and corresponding RNA profiling, we thus designed and developed a continuous profile of retinoic acid and GDF11, to induce rostral-caudal patterning of motor neurons in a spatial continuum (Fig. 5A). Specifically, we chose a parabolic profile for retinoic acid, peaking in the thoracic region, to direct differentiation of the upper and middle (brachial and thoracic) spinal cord, and an increasing profile for GDF11, to induce the development of the lower (lumbar) motor neurons. The microHIVE experimental profile showed a close correlation to the designed target profile (similarity metric ε = 0.991, Fig. 5A, right). Stem cells were thus seeded in the all-polymer microHIVE culture chamber and subjected to the growth factors for continuous proliferation and differentiation (Fig. S10).
To molecularly characterize the cellular identities of the differentiated motor neurons, along the lateral positions of the culture chamber, we sectioned the all-polymer chamber into seven bins (Fig. 5B). The microHIVE platform was fitted onto a custom 3D-printed chip holder with guiding grooves for sectioning (Fig. S11). We performed RNA and protein expression analyses on all bin sections. Specifically, high-quality, intact RNA was extracted from each polymer section (Fig. S12), and we measured its differential expression of HOX genes (Fig. 5C). We further performed RNA sequencing analysis on the different bins to characterize the cellular patterning (Fig. S13). Several characteristic transcripts were identified to be upregulated across specific bins corresponding to the brachial, thoracic and lumbar regions of the spinal cord (i.e., bins 1-3 correlated to the brachial region; bins 4-5 to the thoracic region; and bins 6-7 to the lumbar region). Immunofluorescence staining of region-specific HOX proteins also confirmed the RNA expression trends (Fig. 5D).
Figure 4
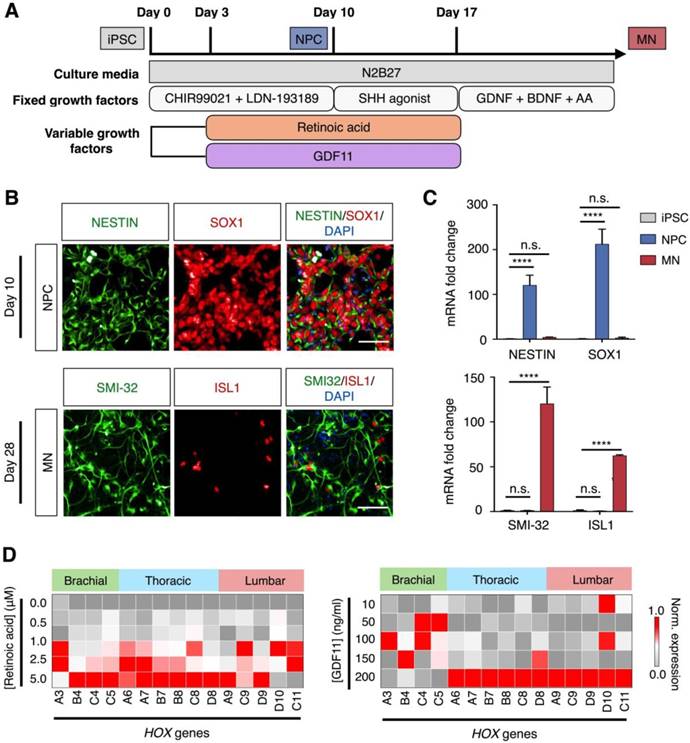
Derivation of spinal motor neurons from human pluripotent stem cells. (A) Schematic illustration of spinal motor neuron differentiation from induced pluripotent stem cell (iPSC). Varying concentrations of retinoic acid and GDF11 were used to generate thoracic/lumbar motor neurons. (B) Immunofluorescence analysis of cellular identities. (Top) Co-staining of Nestin (green) and SOX1 (red) confirmed the generation of neural progenitor cells (NPC) at day 10 of cellular differentiation. (Bottom) Co-staining of SMI-32 (green) and ISL1 (red) at day 28 demonstrated successful differentiation of iPSCs into spinal motor neurons (MN). Cellular nuclei were counterstained with DAPI (blue). All scale bars indicate 50 μm. (C) RNA confirmation of cellular identities. mRNA expression levels of the corresponding neural progenitor and motor neuron markers were measured by quantitative PCR. All gene expression analyses were normalized to that of iPSC mRNA levels. (**** P < 0.0001, n.s. not significant, Student's t-test.) (D) Effects of retinoic acid and GDF11 on motor neuron HOX gene expressions. Motor neurons were differentiated in increasing concentrations of retinoic acid (left) and GDF 11 (right, at a fixed concentration of 1.0 μM retinoic acid), respectively. HOX gene expressions were profiled on day 28 of the differentiation protocol via quantitative PCR. All gene expression analyses were made relative to intrinsic GAPDH mRNA levels. Heat map signals were then gene (column) normalized across all treatments to compare respective HOX gene expression trends. All measurements were performed in triplicate, and the data are displayed as mean ± s.d. in C.
Figure 5
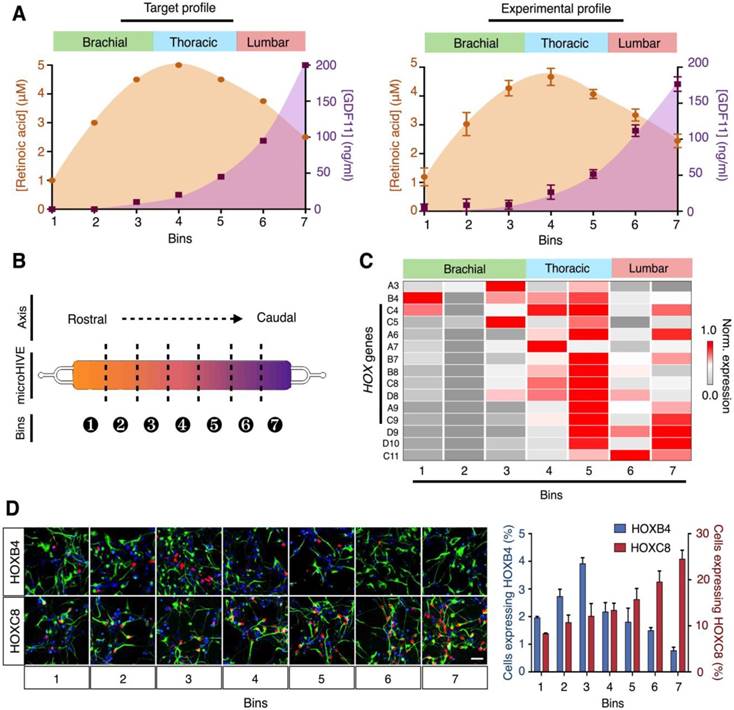
microHIVE differentiation of spinal motor neurons. (A) Target and experimental molecular profiles of retinoic acid and GDF11. (Left) Based on correlative analysis of growth factor concentrations and RNA profiling, we designed a continuous profile of retinoic acid and GDF11 to induce rostral-caudal patterning of motor neurons, to correspond to the brachial, thoracic and lumbar regions of the spinal cord. (Right) The microHIVE experimental profile showed a close correlation to the desired target profile (profile similarity metric, ε = 0.991). (B) Schematic illustration of chamber binning. After motor neuron differentiation (day 28), the all-polymer cell culture chamber could be sectioned into seven bins for cellular characterization and spatial correlation. (C) Differential expressions of HOX genes across the chamber bins. HOX gene expressions were profiled from the respective chamber sections through quantitative PCR. All gene expression analyses were made relative to intrinsic GAPDH mRNA levels, and subsequently gene (column) normalized across all bins to compare respective gene expression trends in the form of a heat map. (D) Immunofluorescence confirmation of HOX protein expressions. Immunostaining of HOXB4 and HOXC8 (red) and SMI-32 (green) across the seven culture bins demonstrated successful generation of rostral (HOXB4) to caudal (HOXC8) motor neurons. Cellular nuclei were counterstained with DAPI (blue). Scale bar, 50 μm. Cellular quantification based on positive staining of HOXB4 and HOXC8 further confirmed the respective protein expression trends. All measurements were performed in triplicate, and the data are displayed as mean ± s.d. in A and D.
Discussion
Motor neuron diversification and regionalization are important hallmarks of spinal cord development and rely on fine, complex spatiotemporal gradients of molecular cues. Inspired by the interconnected and branching network of the honeycomb lattice, we developed a microfluidic platform to engineer complex molecular concentration profiles at a high spatial resolution, and directed motor neuron differentiation and regionalization in situ. In comparison to other gradient generators (e.g., passive diffuser and tree-type mixer), the microHIVE platform presents significant advantages: (1) its optimized microhexagon structures enable versatile and dynamic patterning of complex gradients at a high spatial resolution (>16 fold improvement over conventional), (2) the high density, divergent array not only ensures maximal mixing efficiency but also maintains a small device footprint, and (3) its detachable, all-polymer cell culture supports cellular proliferation and differentiation, and facilitates easy spatial binning and cellular characterization (e.g., RNA and protein analyses from individual culture sections). Using the developed platform, we established complex molecular gradients, and directed spinal motor neuron diversification and regionalization. The differentiated motor neurons were formed in a spatial continuum and showed RNA and protein signatures consistent with the brachial, thoracic and lumbar regions of the spinal cord.
The scientific and technical applications of the technology are potentially broad. The microHIVE lattice enables precise and dynamic patterning of complex molecular profiles; the all-polymer chamber supports stem cell differentiation and facilitates easy and spatial cellular dissection. We thus envision that the technology could be applied to investigate combinatorial effects (e.g., concentrations, durations) of multiple factors (e.g., growth factors, drugs), thereby developing advanced biomimetic systems for disease modeling and regenerative medicine. In the current application, with its ability to induce spinal motor neuron diversification and organization, the technology could be further applied as a developmental platform as well as to improve disease modeling of acute spinal cord injury [24] and multiple neurodegenerative diseases [25, 26]. For example, using genetically engineered cells, the technology could be used to investigate the effects of different genetic variants on human spinal cord development, thereby reducing the need for generating animal models [27, 28]. Through additional calcium labeling [29] and electrophysiological measurements [30] of spatially-organized motor neuron subtypes, the platform could be used to investigate the establishment (and disruption) of stereotypical neural circuits and communication between neuronal subtypes. Such development will not only advance our functional understanding of disease progression (e.g., preferential susceptibility of neuronal subtypes in amyotrophic lateral sclerosis), but also provide reflective platforms to screen and identify novel therapies to protect and regenerate motor circuitry [25].
We further anticipate that several technical modifications could be made to enhance the current technology. First, by leveraging on the small footprint of the present fluidics, we can readily revise the design to confer additional dimensionality (i.e., 3D profile modulation). By adding microHIVEs in orthogonal planes and stacking multiple layers of microHIVEs, we can generate variable gradients in the y- and z-axis, respectively. This could be used to create more complex gradients of differentiation factors to better mimic the native developmental environment of the spinal cord [31]. The culture chamber can also be modified, with the integration of biocompatible matrix [32, 33], to develop 3D culture systems for more precise modeling. Second, while the current study focused primarily on the differentiation and diversification of spinal motor neurons, concurrent development of different cellular lineages or co-culture with other cell types (e.g., interneurons, muscle cells) can significantly advance the current system [34]. These modifications will not only enable the generation of controlled, biomimetic organoids on-chip, but also enhance functional evaluation of cellular interaction and communication at different stages of development and pathology [35-37].
Methods
Device fabrication
The microHIVE platform, comprising the concentration gradient generator and cell culture chamber, was fabricated from polydimethylsiloxane (PDMS, Dow Corning) and borosilicate glass. Briefly, a 100 µm-thick master mold was prepared via conventional soft lithography using negative photoresist (SU-8, MicroChem) and silicon wafer. The PDMS positive replica was fabricated by pouring uncured PDMS (10:1 elastomer base to curing agent ratio) onto the master mold followed by polymer curing at 75 °C for 30 minutes. An approximately 1 mm-thick PDMS film was also coated onto a 75 x 50 mm glass slide (Corning) and cured using the same parameters as above. The PDMS positive replica was then irreversibly bonded onto the PDMS film via reactive oxygen plasma bonding (50 mTorr, 50 W, 1 minute). The PDMS film was reversibly attached to the glass slide to permit removal (i.e., peeling) of the PDMS platform from the glass support for sectioning of the cell culture chamber and DNA extraction.
Device preparation
To sterilize the device for culture and differentiation of motor neurons, excess ethanol was used to flush the device. Residual ethanol was allowed to evaporate in a sterile class II biological safety cabinet. All devices were further sterilized under UV irradiation (30 minutes) before coating of the culture chamber with matrigel (Corning) for cell seeding. During the coating step, the matrigel basement membrane matrix (phenol red-free) was diluted 10x in PBS and introduced into the cell culture chamber via the cell seeding inlet. The device was then incubated at 37 °C to allow the matrigel to form a thin coat on the bottom PDMS film, so as to improve cell adhesion. Unpolymerized matrigel was flushed with excess PBS and removed from the cell culture chamber via the cell seeding outlet.
Gradient simulation
A 3D CAD model was designed using Solidworks, and imported into Comsol Multiphysics to create a simulation model with actual device geometry. Both 'Laminar Flow (spf)' and 'Transport of Diluted Species' physic trees were used concurrently for all subsequent steady-state simulations. We first performed comparative simulation studies to optimize the microhexagonal lattice. Specifically, different dimensional parameters of the hexagonal microstructures were tested to determine the optimal diffusion length and lateral resolution in the cell culture chamber. We next tested the effects of repeated fluid branching and mixing at the hexagonal junctions on the mixing efficiency. We varied the number of rows of microhexagons in the lattice to determine the number of junctions and measured the concentration distribution to determine the mixing efficiency. Using the optimized microhexagon geometry (i.e., microstructure size, number of rows, array arrangement), we tested different parameters (e.g., flow rates, relative concentrations and positions of solute) to develop various gradient profiles.
Gradient generation with color dyes
To experimentally validate these simulated profiles on the microHIVE platform, we used color dyes to generate various gradient profiles. We varied the combined flow rates (i.e., total flow rate from all three inlets) from 1 μl/min to 5 μl/min to determine the effects of flow rates on gradient generation. All color gradient images were captured using a tripod-mounted camera (Canon) and de-convoluted into their RGB color intensities using ImageJ. The gradient profiles and their slopes were determined using the normalized color intensities as described below.
Color signal normalization
(1)
(2)
where
ΔIgreen(𝑥) = relative green signal intensity at a given location along chamber (𝑥);
Icolor(𝑥) = raw green/red/blue signal intensity at a given location (𝑥);
Ĩgreen(𝑥) = normalized green signal intensity at a given location (𝑥);
ΔIgreen, max = maximum green signal intensity along chamber
A RGB color profiler was used to de-convolute and quantify captured images into their respective red, green and blue component intensities. The relative signal intensity of the color-of-choice (e.g., green) at a given x coordinate was determined by subtracting average raw intensities of the other two colors (e.g., red and blue). This subtraction removed any color artifacts from background noise as well as variations in the white balance during image capture. The relative color intensities were then normalized against the maximum intensity of each experimental run.
Molecular profile generation and characterization
To generate various molecular profiles, we used different concentrations of growth factors (i.e., retinoic acid and GDF11). To characterize the molecular profiles, we assigned seven bins/outlets in the cell culture chamber and measured their respective eluted concentrations of retinoic acid and GDF11. Calibration curves were made for both retinoic acid and GDF11 in order to determine their respective concentrations in the microHIVE platform. Briefly, the normalized signal for retinoic acid was obtained from its peak absorbance at 350 nm. A range of concentration from 0 to 5 μM was measured. For GDF11, the normalized signal was obtained from the absorbance measurement at 280 nm. All absorbance measurements were made on a spectrometer reader (Tecan).
Comparison of simulated and experimental profiles
To quantitatively compare the gradient profiles (e.g., experimental vs. targeted, or profile maintenance over time), we defined a profile similarity metric (ε) to quantify the differences based on the sum of the squares of the concentration offset at different spatial locations.
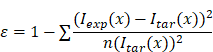
where
ε = profile similarity;
Iexp(𝑥) = measured signal at a given location/bin (𝑥);
Itar(𝑥) = target signal at a given location/bin (𝑥);
n = number of measured points
Determination of gradient resolution
Lateral resolution was determined by dividing the lateral length (i.e., along the x-axis) of the culture chamber by the number of branched channel openings into the chamber, provided that the diffusion length and/or time was sufficient to allow for effective mixing. The results were validated by simulation of fixed gradient profiles. While optimizing the platform's lateral resolution for gradient generation, we further implemented a mirrored microhexagonal array to connect to the waste outlet, to ensure profile uniformity across the cross-sectional plane of the culture chamber. To experimentally validate and visualize the concentration uniformity across the width (i.e., along the y-axis) of the culture chamber, color-dye images of the generated gradient were captured at different flow rates from 1 μl/min to 5 μl/min and analyzed as previously described. Similarly, to visualize the concentration differences across the depth (i.e., along the z-axis), fluorescein dye (Sigma-Aldrich) was used to generate gradients at flow rates from 1 μl/min to 5 μl/min. A confocal microscope (Zeiss) was used to capture the fluorescence intensities at 5 μm z-steps to determine the concentration uniformity in the cross-section.
Comparison with gold standard microfluidic gradient generator
To compare the microHIVE platform with a gold standard microfluidic gradient generator, we designed and fabricated a device comprising a 'Christmas-tree' concentration gradient generator with serpentine channels. Briefly, we designed a 3-inlets/7-outlets fluidic circuit with a similar device footprint (and cell culture chamber length of 28 mm) as the microHIVE platform. This ensured common dimensional restrictions to allow for direct comparisons between the two microfluidic platforms. The device was fabricated through conventional soft lithography using negative photoresist and silicon wafer, as described previously. We subjected this gold standard microfluidic platform to the same conditions and protocols as described above to compare the generated gradient profiles.
Culture and differentiation of human pluripotent stem cells
Wild-type BJ fibroblast-derived iPSCs (BJ-iPS) were cultured feeder-free on matrigel-coated plates in MACS iPS-Brew media (Miltenyi Biotec). Routine passaging using ReLeSR (Stem Cell Technologies) was performed once every 6-7 days. Pluripotent stem cells were differentiated towards the spinal motor neuron fate following established protocols described previously. Briefly, we first neutralized the BJ-iPS by activating Wnt pathways with CHIR99021 treatment (4.25 μM, Miltenyi Biotec) while blocking Bone Morphogenic Protein (BMP) signaling by LDN-193189 treatment (0.5 μM, Miltenyi Biotec) at the same time. At day 3, variable concentrations of retinoic acid and GDF11 were added to initiate the rostral-caudal patterning, in the presence of fixed concentration of Purmorphamine (1 μM, Miltenyi Biotec), a Sonic Hedgehog pathway agonist, as a ventralizing signal. Neurotrophic factors, BDNF (20 ng/ml, Miltenyi Biotec) and GDNF (20 ng/ml, Miltenyi Biotec), were added to the neuronal cultures at day 17 to promote neuronal maturation into motor neurons.
microHIVE differentiation
According to the above-mentioned differentiation protocol, stem cell suspension (40 μl suspension of 1x10⁶ cells/ml) was introduced into the cell culture chamber via the cell seeding inlet, and placed in a cell incubator (37 °C, 5% CO2) to allow cell adhesion to the matrigel-coated chamber. Tygon tubing (Upchurch) was inserted into the three growth factor inlets at the top of the gradient generator, and connected to three syringes containing culture media and respective growth factors (e.g., retinoic acid and GDF11). The cell seeding inlet and outlet were sealed to prevent any transverse fluidic flow from the cell culture chamber. A neMESYS syringe pump (Cetoni) with three low pressure pump modules was used to control the individual flow rates from the syringes. A continuous perfusion of media at a combined flow rate of 1 μl/min was used to maintain a stable gradient profile throughout the differentiation protocol.
Monitoring of on-chip cell growth
We monitored cellular proliferation and confluence in the cell culture chamber daily during the differentiation protocol. Briefly, a phase contrast light microscope (Nikon) was used to capture various fields of view of the cell culture chamber at 10x magnification. Image analysis was performed using ImageJ to determine the percentage confluence. Additionally, we performed live/dead cell viability analysis to compare cellular growth in the microfluidic culture and conventional culture (i.e., plasma-treated polystyrene). Specifically, a live/dead viability assay kit for mammalian cells (Invitrogen) was used to determine the percentage of live cells to dead cells in both platforms. Calcin-AM (2 μM) and ethidium homodimer-1 (4 μM) were added to Dulbecco's phosphate buffered saline (DPBS) and incubated with the cells at room temperature for 40 minutes. Subsequently, fluorescence images were acquired as previously described, and image analyses including cell counts and intensity measurements were performed using Columbus (Perkin Elmer).
Sectioning of culture chamber into equal bins
A custom 3D-printed holder (Envisiontec) was fabricated to house the PDMS microfluidic chip once it had been separated from the supporting glass slide. Guiding grooves were incorporated into the mold to allow for sectioning of the cell culture chamber into seven equal bins via a sterilized scalpel (#10 blade). Once sectioned, the bins were removed from the holder to enable RNA extraction and protein analysis (see below).
RNA extraction and expression analysis
Cells were harvested in Trizol reagent for RNA extraction using RNeasy Mini Kit following the manufacturer's instruction (Qiagen). For RNA extraction from the culture sections, the bins with their respective populations of adherent cells were placed directly in lysis reagent. RNA was extracted from the lysate, per manufacturer's protocol. Extracted RNA samples were quantified and evaluated with 2100 Bioanalyzer (Agilent) using a RNA Pico Chip.
Extracted RNA was reverse-transcribed to generate first-strand cDNA (High-Capacity cDNA Reverse Transcription, Ambion). Specific transcripts were quantified through real-time quantitative PCR (qPCR) using FAST SYBR Master Mix (Applied Biosystems) on a QuantStudio 5 Real-Time PCR System (Applied Biosystems). Amplification condition consisted of 1 cycle of 95 °C for 30 seconds, 40 cycles of 95 °C for 3 seconds and 60 °C for 30 seconds. All gene expressions were normalized to respective GAPDH. A list of the qPCR primers used is provided in Table S1.
For bin-based RNA sequencing, polyA enrichment of mRNA was performed for Illumina sequencing library preparation, according to the manufacturer's kit instructions with standard index sequences (Illumina). Samples were run on NextSeq with a 2x150bp configuration. Reads were preprocessed with FASTX-toolkit to remove and trim low quality bases. Reads were then assessed with FastQC and sequencing adapters trimmed using cutadapt [38]. Finally, STAR aligner [39] was used to align reads to GRCh38.p12 human reference genome using gencode 29 for gene annotation. For analysis, differential gene expression (DESeq2 version 1.22.0) [40], Gene Ontology enrichment, and clustering of gene expression was performed in R (version 3.5.1).
Immunofluorescence
Cells were fixed in 4% paraformaldehyde for 15 minutes, permeabilized in 0.1% Triton X-100 for 15 minutes and blocked in buffer containing 5% FBS and 1% BSA for an hour at room temperature. Primary antibodies were diluted in the blocking buffer and incubated overnight at 4 °C. The following primary antibodies (and their respective dilutions) were used: rabbit SOX1 (1:1000) (Abcam, ab87775), mouse Nestin (1:1000) (Abcam, ab22035), rabbit ISL1 (1:1500) (Abcam, ab109517), mouse SMI-32 (1:1000) (Calbiochem, NE-1023), rabbit HOXB4 (1:200) (Abcam, ab133521), rabbit HOXC8 (1:200) (Abcam, ab86236), mouse MAP2 (1:1000) (Abcam, ab11267), rabbit OCT4 (1:100) (Santa Cruz, sc-9081), and goat SOX2 (1:200) (Santa Cruz, sc-17320). The list of primary antibodies used and their functions can also be found in Table S2. Cells were washed thrice in PBS before incubation with secondary antibodies. The respective secondary antibodies (Molecular Probes, Invitrogen) were diluted 1:1000 in blocking buffer and incubated at room temperature, in the dark, for 60 minutes. DAPI (Invitrogen) was used at 0.1 μg/ml to visualize cellular nuclei.
Images of cultured cells were acquired using a high content microscope Opera Phenix (Perkin Elmer) using the 20x objective. Image analyses including cell counts and intensity measurements were performed using Columbus (Perkin Elmer). Nuclei were detected based on DAPI staining, with dead cells filtered based on abnormally high DAPI intensity and small (<20 μm2) nuclei area. Intensity of HOXB4 and HOXC8 staining within nuclei was determined and a cut-off above background intensity was used to identify and quantify brachial and thoracic neurons.
Statistical analysis
At least three biological replicates were performed for each experiment, and all results are presented as mean ± standard deviation, unless otherwise specified. All significance tests were performed with two-tailed unpaired Student's t-test and P < 0.05 was considered statistically significant. All image processing was performed with ImageJ (version 1.48) and statistical analysis with GraphPad Prism (version 7.0c).
Data availability
Data that support the findings of this study are available from the corresponding authors on reasonable request.
Supplementary Material
Supplementary figures and tables.
Acknowledgements
We thank Luke P. Lee for helpful discussion, Yuan Chen, Xianguang Ding, Haitao Zhao and Xuecheng Sun for experimental assistance, and Li Yi Tan for help with cell culture. Funding: This work was supported in part by funding from NUS Research Scholarship, MOE, NMRC, A*STAR IMCB Independent Fellowship and NUS Early Career Research Award.
Author contributions
G.S.L. and H.S. designed the microHIVE platform. G.S.L., S.Y.N., B.S.S. and H.S. designed the research. G.S.L., J.H.H., N.R.Y.H. and C.Y.W. performed the research. G.S.L., J.H.H., N.R.Y.H., C.Y.W., S.Y.N., B.S.S. and H.S. analyzed the data and wrote the paper.
Competing Interests
The authors have declared that no competing interest exists.
References
1. Jessell TM. Neuronal specification in the spinal cord: inductive signals and transcriptional codes. Nat Rev Genetics. 2000;1:20-9
2. Davis-Dusenbery BN, Williams LA, Klim JR, Eggan K. How to make spinal motor neurons. Development. 2014;141:491-501
3. Hardiman O. et al. Amyotrophic lateral sclerosis. Nat Rev Dis Primers. 2017;3:17071
4. Lee S, Huang EJ. Modeling ALS and FTD with iPSC-derived neurons. Brain Res. 2017;1656:88-97
5. Kanning KC, Kaplan A, Henderson CE. Motor neuron diversity in development and disease. Annu Rev Neurosci. 2010;33:409-40
6. Tao Y, Zhang S-C. Neural subtype specification from human pluripotent stem cells. Cell Stem Cell. 2016;19:573-86
7. Gage FH. Mammalian neural stem cells. Science. 2000;287:1433-38
8. Temple S. The development of neural stem cells. Nature. 2001;414:112-7
9. Anderson DJ. Stem cells and pattern formation in the nervous system. Neuron. 2001;30:19-35
10. Liu J-P, Laufer E, Jessell TM. Assigning the positional identity of spinal motor neurons. Neuron. 2001;32:997-1012
11. Philippidou P, Dasen J. HOX genes: choreographers in neural development, architects of circuit organization. Neuron. 2013;80:12-34
12. Khademhosseini A, Langer R, Borenstein J, Vacanti JP. Microscale technologies for tissue engineering and biology. Proc Natl Acad Sci U S A. 2006;103:2480-7
13. Diao J. et al. A three-channel microfluidic device for generating static linear gradients and its application to the quantitative analysis of bacterial chemotaxis. Lab Chip. 2006;6:381-8
14. Cheung YK, Azeloglu EU, Shiovitz DA, Costa KD, Seliktar D, Sia SK. Microscale control of stiffness in a cell-adhesive substrate using microfluidics-based lithography. Angew Chem Int Ed Engl. 2009;48:7188-92
15. Salmanzadeh A, Lee LP. An integrated liver- and heart-on-a-chip platform. Biophys J. 2014;106(a):812
16. Zhao X. et al. Injectable stem cell-laden photocrosslinkable microspheres fabricated using microfluidics for rapid generation of osteogenic tissue constructs. Adv Funct Mater. 2016;26:2809-19
17. Keenan TM, Grinager JR, Procak AA, Svendsen CN. In vitro localization of human neural stem cell neurogenesis by engineered FGF-2 gradients. Integr Biol. 2012;4:1522-31
18. Demers CJ. et al. Development-on-chip: in vitro neural tube patterning with a microfluidic device. Development. 2016;143:1884-92
19. Jeon NL, Baskaran H, Dertinger SKW, Whitesides GM, Van De Water L, Toner M. Neutrophil chemotaxis in linear and complex gradients of interleukin-8 formed in a microfabricated device. Nat Biotechnol. 2002;20:826-30
20. Wang X, Liu Z, Pang Y. Concentration gradient generation methods based on microfluidic systems. RSC Adv. 2017;7:29966-84
21. Maden M. Retinoic acid in the development, regeneration and maintenance of the nervous system. Nat Rev Neurosci. 2007;8:755-65
22. Capretto L, Cheng W, Hill M, Zhang X. Micromixing within microfluidic devices. Top Curr Chem. 2011;304:27-68
23. Ng S-Y. et al. Genome-wide RNA-seq of human motor neurons implicates selective ER stress activation in spinal muscular atrophy. Cell Stem Cell. 2015;17:569-84
24. Cheriyan T. et al. Spinal cord injury models: a review. Spinal Cord. 2014;52:588-595
25. Kiernan MC. Progress towards therapy in motor neuron disease. Nat Rev Neurol. 2018;14:65-6
26. Osaki T, Shin Y, Sivathanu V, Campisi M, Kamm RD. In vitro Microfluidic Models for Neurodegenerative Disorders. Adv Healthc Mater. 2018;7:10.1002 /adhm.1700489
27. Chen Y. et al. Engineering Human Stem Cell Lines with Inducible Gene Knockout using CRISPR/Cas9. Cell Stem Cell. 2015;17:233-44
28. Tsai PC. et al. A recurrent WARS mutation is a novel cause of autosomal dominant distal hereditary motor neuropathy. Brain. 2017;140:1252-66
29. Grienberger C, Konnerth A. Imaging calcium in neurons. Neuron. 2012;73:862-85
30. Hochbaum DR. et al. All-optical electrophysiology in mammalian neurons using engineered microbial rhodopsins. Nat Methods. 2014;11:825-33
31. Duncombe TA, Tentori AM, Herr AE. Microfluidics: reframing biological enquiry. Nat Rev Mol Cell Biol. 2015;16:554-67
32. Kraehenbuehl TP, Langer R, Ferreira LS. Three-dimensional biomaterials for the study of human pluripotent stem cells. Nat Methods. 2011;8:731-6
33. Webber MJ, Appel EA, Meijer EW, Langer R. Supramolecular biomaterials. Nat Mater. 2016;15:13-26
34. Butler SJ, Bronner ME. From classical to current: analyzing peripheral nervous system and spinal cord lineage and fate. Dev Biol. 2015;398:135-46
35. Shuler ML, Hickman JJ. Toward in vitro models of brain structure and function. Proc Natl Acad Sci U S A. 2014;111:13682-3
36. Lancaster MA, Knoblich JA. Organogenesis in a dish: modeling development and disease using organoid technologies. Science. 2014;345:10.1126 /science.1247125
37. Lee LP. Microphysiological Analytic Platforms (MAPs): Precision Organs on Chip. Adv Healthc Mater. 2018;7:10.1002 /adhm.201701488
38. Martin M. Cutadapt removes adapter sequences from high-throughput sequencing reads. EMBnetjournal Bioinformatics in Action. 2011;17:1-200
39. Dobin A. et al. STAR: ultrafast universal RNA-seq aligner. Bioinformatics. 2013;29:15-21
40. Love MI, Huber W, Anders S. Moderated estimation of fold change and dispersion for RNA-seq data with DESeq2. Genome Biol. 2014;15:550
Author contact
![]() Corresponding author: Boon Seng Soh, PhD. Institute of Molecular and Cell Biology, 61 Biopolis Drive Proteos #05-07, Singapore 138673. Tel: (65) 6586 9530 bssoha-star.edu.sg Huilin Shao, PhD. National University of Singapore MD6, 14 Medical Drive #14-01, Singapore 117599. Tel: (65) 6601 5885 huilin.shaoedu.sg
Corresponding author: Boon Seng Soh, PhD. Institute of Molecular and Cell Biology, 61 Biopolis Drive Proteos #05-07, Singapore 138673. Tel: (65) 6586 9530 bssoha-star.edu.sg Huilin Shao, PhD. National University of Singapore MD6, 14 Medical Drive #14-01, Singapore 117599. Tel: (65) 6601 5885 huilin.shaoedu.sg
Citation styles
APA
Lim, G.S., Hor, J.H., Ho, N.R.Y., Wong, C.Y., Ng, S.Y., Soh, B.S., Shao, H. (2019). Microhexagon gradient array directs spatial diversification of spinal motor neurons. Theranostics, 9(2), 311-323. https://doi.org/10.7150/thno.29755.
ACS
Lim, G.S.; Hor, J.H.; Ho, N.R.Y.; Wong, C.Y.; Ng, S.Y.; Soh, B.S.; Shao, H. Microhexagon gradient array directs spatial diversification of spinal motor neurons. Theranostics 2019, 9 (2), 311-323. DOI: 10.7150/thno.29755.
NLM
Lim GS, Hor JH, Ho NRY, Wong CY, Ng SY, Soh BS, Shao H. Microhexagon gradient array directs spatial diversification of spinal motor neurons. Theranostics 2019; 9(2):311-323. doi:10.7150/thno.29755. https://www.thno.org/v09p0311.htm
CSE
Lim GS, Hor JH, Ho NRY, Wong CY, Ng SY, Soh BS, Shao H. 2019. Microhexagon gradient array directs spatial diversification of spinal motor neurons. Theranostics. 9(2):311-323.
This is an open access article distributed under the terms of the Creative Commons Attribution (CC BY-NC) license (https://creativecommons.org/licenses/by-nc/4.0/). See http://ivyspring.com/terms for full terms and conditions.