Impact Factor
- Issue 13; 2026
- Issue 12; 2026
- Issue 11; 2026
- Issue 10; 2026
- Issue 9; 2026
- Volume 16; 2026
- Advance Articles
- Past Issues
- Cover Images
- Cover Suggestion
- Index & Coverage
- Special Issues
Introduction
Methods
Results
Discussion and conclusions
Abbreviations
Supplementary Material
Acknowledgements
References
International Journal of Biological Sciences
International Journal of Medical Sciences
 Global reach, higher impact

Theranostics 2019; 9(3):761-777. doi:10.7150/thno.29520 This issue Cite
Research Paper
Epigenetic Co-Deregulation of EZH2/TET1 is a Senescence-Countering, Actionable Vulnerability in Triple-Negative Breast Cancer
Yong Yu1*, Jingjing Qi2,3*, Jieyi Xiong1*, Liping Jiang3*, Di Cui3, Junlin He3,6, Ping Chen3,7, Lianjie Li1,3, Chenjie Wu3, Tonghui Ma3, Su Shao3,8, Jianjun Wang3,8, Dansong Yu3,9, Bing Zhou3,4, Dongsheng Huang3,5, Clemens A. Schmitt1,10,11 ![]() , Ran Tao3,5
, Ran Tao3,5 ![]()
1. Max-Delbrück-Center for Molecular Medicine in the Helmholtz Association, 13125 Berlin, Germany
2. Department of Medical Oncology, Sun Yat-Sen University Cancer Center, Collaborative Innovation Center for Cancer Medicine, 510060 Guangzhou, China
3. Center for Clinical Medical Research, Affiliated Zhejiang Provincial People's Hospital, Hangzhou Medical School, 310014 Hangzhou, China
4. Department of Cardiothoracic Surgery, Affiliated Zhejiang Provincial People's Hospital, Hangzhou Medical School, 310014 Hangzhou, China
5. Department of Hepatobiliary-Pancreatic Surgery, Affiliated Zhejiang Provincial People's Hospital, Hangzhou Medical School, 310014 Hangzhou, China
6. Department of Breast Surgery, Hangzhou Municipal Hospital of Traditional Chinese Medicine, 310007 Hangzhou, China
7. Department of Gynecology, Shaoxing 2nd People's Hospital, 312000 Shaoxing, China
8. Department of Surgery, Chun'an 1st People's Hospital, 311700 Hangzhou, China
9. Department of Surgery, Ningbo Li Hui Li Hospital, 315041 Ningbo, China
10. Charité - Universitätsmedizin Berlin, corporate member of Freie Universität Berlin, Humboldt-Universität zu Berlin, and Berlin Institute of Health; Medical Department of Hematology, Oncology and Tumor Immunology, Virchow Campus, and Molekulares Krebsforschungszentrum, 13353 Berlin, Germany
11. Deutsches Konsortium für Translationale Krebsforschung (German Cancer Consortium), Partner site Berlin, Germany
*These authors contributed equally to this work.
Received 2018-8-27; Accepted 2018-12-22; Published 2019-1-24
Abstract

Triple-negative breast cancer (TNBC) cells lack the expression of ER, PR and HER2. Thus, TNBC patients cannot benefit from hormone receptor-targeted therapy as non-TNBC patients, but can only receive chemotherapy as the systemic treatment and have a worse overall outcome. More effective therapeutic targets and combination therapy strategies are urgently needed to improve the treatment effectiveness.
Methods: We analyzed the expression levels of EZH2 and TET1 in TCGA and our own breast cancer patient cohort, and tested their correlation with patient survival. We used TNBC and non-TNBC cell lines and mouse xenograft tumor model to unveil novel EZH2 targets and investigated the effect of EZH2 inhibition or TET1 overexpression in cell proliferation and viability of TNBC cells.
Results: In TNBC cells, EZH2 decreases TET1 expression by H3K27me3 epigenetic regulation and subsequently suppresses anti-tumor p53 signaling pathway. Patients with high EZH2 and low TET1 presented the poorest survival outcome. Experimentally, targeting EZH2 in TNBC cells with specific inhibitor GSK343 or shRNA genetic approach could induce cell cycle arrest and senescence by elevating TET1 expression and p53 pathway activation. Using mouse xenograft model, we have tested a novel therapy strategy to combine GSK343 and chemotherapy drug Adriamycin and could show drastic and robust inhibition of TNBC tumor growth by synergistic induction of senescence and apoptosis.
Conclusions: We postulate that the well-controlled dynamic pathway EZH2-H3K27me3-TET1 is a novel epigenetic co-regulator module and provide evidence regarding how to exploit it as a novel therapeutic target via its pivotal role in senescence and apoptosis control. Of clinical and therapeutic significance, the present study opens a new avenue for TNBC treatment by targeting the EZH2-H3K27me3-TET1 pathway that can modulate the epigenetic landscape.
Keywords: cellular senescence, epigenetic co-deregulation, EZH2, TET1, TNBC
Introduction
Triple-negative breast cancer (TNBC) cells lack expression of the estrogen receptor, progesterone receptor, and human epidermal growth factor receptor 2 (HER2) [1, 2]. Compared with non-TNBC patients who may benefit from chemotherapy, endocrine therapy and the anti-HER2 antibody Trastuzumab, TNBC patients only qualify for chemotherapy as a systemic option and have an inferior overall outcome [3]. Most TNBC patients succumb to their disease due to drug resistance and relapse after intensive chemotherapy, underscoring the urgent medical need for more effective, molecularly informed treatments, most likely as combination therapies together with chemo-drugs. Given the triple-lack of classic breast cancer targets, we hypothesized enhanced expression of repressive epigenetic regulators might alternatively serve as actionable oncogenic principles in TNBC.
Epigenetic alterations, including deregulated histone modifications and altered DNA methylation, are frequently detectable in human breast cancers, e.g. suppressive chromatin modifications or DNA hypermethylation mediated transcriptional silencing of tumor suppressor genes, which promotes to propagation of breast cancer cells [4, 5]. One of the important changes is aberrant activity of the polycomb repressive complex 2 (PRC2) and deregulated expression of its target genes [6]. The genes silenced by PRC2 encode, among others, tumor suppressors such as apoptosis-related proteins or regulators of stem cell signaling [7, 8]. As the catalytic component of the PRC2 complex, EZH2 overexpression has been correlated with poor prognosis and inferior outcome in a variety of cancers [9-13]. Experimentally, overexpression of EZH2 reportedly promotes cell proliferation both in vitro [9, 11] and in vivo [14, 15]. EZH2 is essential for the epithelial-to-mesenchymal transition [16, 17], thus linking EZH2 overexpression to cell invasion and metastasis [18, 19]. Besides, EZH2 mitigates the oncogene-induced DNA damage response, thereby facilitating also tumor-promoting mutations [14]. Inhibition of EZH2 reduced the proliferation of cell lines derived from several types of malignancies [20], underscoring the potential benefits EZH2 inhibitors possess as cancer therapeutics.
Another epigenetic alteration frequently observed across cancer entities is DNA methylation, resulting in the silencing of bona fide tumor suppressor genes [5, 21]. Recent studies indicate that existing DNA methylation marks may be erased by a class of methylcytosine dioxygenases termed the ten-eleven translocation (TET) family proteins, which include TET1, TET2, and TET3 [22, 23]. TET proteins convert DNA methylation at the 5' position of the cytosine base (5mC) primarily to 5-hydroxymethylcytosine (5hmC) as well as 5-formylcytosine or 5-carboxylcytosine [22, 23]. Loss of TET1 expression and low 5hmC levels have recently been reported in a variety of solid tumors and cancer cell lines [24-27], thus, suggestive of a tumor-suppressive function.
Intriguingly, there is now emerging evidence implying the highly interrelated relationship between DNA methylation and histone modifications, particularly lysine methylation, in the vicinity of the same gene loci [28, 29]. For example, DNA methylation and H3K9 methylation cooperate in cis to shut down gene expression via CpG methylation accompanied by repressive histone modifications decorating this particular DNA region [30-32]. However, there is, to the best of our knowledge, little evidence that these two fundamental epigenetic regulator principles operate in trans with one epigenetic regulator controlling another epigenetic regulator to ultimately silence a tumor suppressor as the actual proto-oncogenic principle. By exploring cell-based models, tumor specimens and outcome data from human TNBC patients, we uncover here that EZH2 and TET1 operate in trans to more tightly control target gene activity in TNBC. Besides, we further provide demonstrations how to explore it as a novel therapeutic vulnerability for this otherwise particularly hard-to-treat breast cancer subentity.
Methods
Study approval
Animal subjects
All animal experiments were conducted in accordance with a protocol approved by the Institutional Animal Care and Use Committee of Zhejiang Provincial People's Hospital (NO.6/2017 from 11.07.2017) and conformed to the National Institutes of Health Guide for Care and Use of Laboratory Animals (Publication No. 85-23, revised 1996).
Human subjects
Use of breast tissue specimens for IHC and clinical data was based on informed patient consent, and was approved by the Institutional Review Board (IRB) of Zhejiang Provincial People's Hospital.
In vivo xenograft tumor treatment
1 x 10⁶ of MDA-MB-231, MDA-MB-436 or MCF7 breast cancer cells were suspended in 100 µl PBS and implanted subcutaneously into the left side of mouse armpit of 6-7 weeks old Crl:NU-Foxn1-nu/nu mice (Zhejiang Academy of Medical Sciences). When tumors reached a volume of about 50 mm3 (about 5 mm diameter), treatment was started by intraperitoneal administration inhibitors twice a week, i.e. GSK343 (5 mg/kg, Medchemexpress, HY-13500), Adriamycin (1 mg/kg, Medchemexpress, HY-15142), GSK343+Adriamycin combination or DMSO as a solvent control. Tumor diameter was measured every 3 days with a caliper ruler and tumor volume was calculated by the modified ellipsoidal formula (tumor volume = 0.5 x length x width2) [33].
Cell culture, plasmids and retroviral gene transfer
Breast cancer cell lines MDA-MB-231(TCHu227) and MCF7(TCHu74) were purchased from Cell lines Cell Bank of Chinese Academy of Sciences; MDA-MB-436, MDA-MB-453, BT474 and SKBR3 cell lines were kindly provided by Dr. Chuanbing Zang of Charité Universitätsmedizin Berlin; MDA-MB-361 was kindly provided by the laboratory of Dr. Walter Birchmeier of Max-delbrueck-center for Molecular Medicine. All cell lines were cultivated in DMEM supplemented with 10% FBS, 100 U/ml penicillin and 100 µg/ml streptomycin. FH-TET1-pEF (Addgene plasmid # 49792) containing full-length cDNA of human TET1 was a gift from Anjana Rao [23] and was subcloned into murine stem cell retrovirus (MSCV) backbones co-encoding puromycin antibiotic resistance gene. pSuper-retro system was used to stably knockdown EZH2, SUZ12 and TET1 gene expression. shRNA sequences are shEZH2-1 CGGCTCCTCTAACCATGTTTA; shEZH2-2 GCTGACCATTGGGACAGTAAA; shEZH2-3 CAACACAAGTCATCCCATTAA; shSUZ12 CGGAATCTCATAGCACCAATA; shTET1 ACACAACTTGCTTCGATAATT. Retroviral gene transfer and antibiotic selection of cell lines were previously described [34].
Assessment of cell proliferation, viability, apoptosis, and SA-β-gal staining
2 x 10⁴ or 1 x 10⁵ cells were plated in 24-well or 12-well plates, respectively, and counted at the indicated time points with or without treatment. EZH2 inhibitor GSK343 was used at 2 µM concentration throughout the manuscript unless otherwise indicated. 3-deazaneplanocin A (DZNeP) was purchased from Selleckchem (S7120). Cell numbers and viability were measured using Guava ViaCount assay on Guava easyCyte Flow Cytometer system (Millipore) and analyzed with the Guava CytoSoft software package. Cell-cycle was analyzed by BrdU/PI staining and detection of apoptotic cells in xenograft-derived tumor sections was analyzed by TUNEL staining [35]. SA-β-gal staining was used to detect senescent cells in vitro and in vivo. Both chromogenic and flow cytometry-based fluorescent assays were used in this work. Detailed protocol was reported previously [36].
Immunoblotting, immunohistochemistry, and immunofluorescence
Immunoblotting (IB), immunohistochemistry (IHC) staining of Ki67 in vitro and immunofluorescence staining (IF) were performed as previously described [35, 37]. For detailed information of antibodies, please see supplemental table 1. Patient material and xenograft-derived tumor IHC staining was performed on formaldehyde-fixed paraffin-embedded (FFPE) tissue blocks. Briefly, tissue slides were de-waxed in xylene, rehydrated, completed antigen retrieval in 0.01 M citrate buffer pH 6.0 at 95 °C for 5 min and treated with 0.3% H2O2 for 30 min to block endogenous peroxidase. The slides were then blocked with 5% BSA in PBS for 30 min and incubated with primary antibody overnight at 4 °C, followed by biotinylated secondary antibody. Diaminobenzidine (DAB) was used for chromogenic detection of horseradish peroxidase (HRP). IHC staining result of patient samples was scored by two experienced pathologists, who were blinded to the clinical characteristic and survival outcomes, using H-score method [38]. Both intensity and proportion of positive nuclei were assessed for H3K27me3, EZH2, KDM6A, KDM6B and TET1 IHC. Intensity values ranged as 0, 1, 2 and 3, with 0 being weak, and 3 strong. Proportion scores ranged between 0 and 100, representing percentage of positive nuclei. A score that ranged from 0 to 300 was calculated as the product of the intensity and proportion scores. Median value was used to cut off high and low expression level.
Chromatin immunoprecipitation (ChIP), quantitative RT-PCR (qRT-PCR)
ChIP assays were performed using the iDeal ChIP-seq Kit for Transcription Factors (Diagenode, C01010170) and antibodies against EZH2, H3K27me3 and TET1, respectively. Lysate of 5 x 10⁶ cells was used for each ChIP reaction. Precipitated DNA samples were analyzed by quantitative PCR with primer pairs specific for the promoters of TET1 and TP53 genes. For detailed PCR primer sequences, please see supplemental table 2. qRT-PCR was used to quantify gene expression as previously described [39]. Taqman probes were purchased from Applied Biosystems.
Bisulfite genomic sequencing
Genomic DNA was extracted from cells using TIANamp Genomic DNA Kit (Tiangen Biotech, DP304) and subjected to sodium bisulfite treatment using the EpiTect Bisulfite Kit (Qiagen, 59104). Treated samples were then amplified by PCR using primers designed with MethPrimer [40]: p53 forward: TTTTGTTAATAGGAGGTGGGAGTAG; p53 reverse: TCACCTAAACTAAAACACAATAACATAATC, purified and cloned into pMDTM19-T vector (Takara). 10 clones were randomly selected for sequencing.
Dot Blot
Genomic DNA was extracted from cells using TIANamp Genomic DNA Kit (Tiangen Biotech, DP304) and sonicated with Bioruptor Plus (Diagenode) for 15 cycles to obtain ~300 bp fragments. DNA was denatured with 0.1 M NaOH, incubated at 99 °C for 5 min and neutralized with 0.1 volume of 2M ammonium sulfate pH7.0. 5 μg DNA was then spotted onto Amersham Hybond-N+ membrane (GE Healthcare), air-dried and UV-crosslinked. The membrane was blocked in 10% milk in TBS containing 0.1% Tween 20 (TBST) overnight at 4 °C followed by primary 5hmC or 5mC antibody (diluted in 5% BSA in TBST) incubation for 1 hour at room temperature. After washing with TBST, membrane was incubated with HRP-conjugated secondary antibody for 1 h at room temperature and proceeded with ECL exposure and imaging. Dot intensity was quantified by ImageJ software.
TCGA data analysis
Clinical and Gene expression quantification data were downloaded from TCGA. TNBC and non-TNBC patients were separated by custom program. DESeq [41] was used to test different gene expression between TNBCs and non-TNBCs. GSEA is based on the ranks of log-transferred p-values with the signs defined by the change directions. PRC2 targets set (BENPORATH_PRC2_TARGETS) was from Molecular Signature Database (MSigDB) [42].
RNA-seq data processing
All fastq files were merged by samples and aligned to human genome (GRCh38) using STAR [43] with the tolerance of two mismatches. Uniquely mapped reads proportions are among 68.4%-77.6%. Gene read numbers were counted by HTSeq [44]. The values of fragment per kilobase of exon per million reads mapped (FPKM) were calculated by custom program. The gene different expression tests were performed both on shEHZ2 vs. Control and on GSK343 vs. Control, respectively, using DESeq in multi-factor design. P-values were adjusted by Benjamini and Hochberg method. Principal component analysis was performed by Julia package MultivariateStats (https://github.com/JuliaStats/MultivariateStats.jl) based on the log-transferred FPKM values. GSEA is based on the ranks of log-transferred DESeq p-values with the signs defined by the change directions.
Data availability
RNA sequencing data has been deposited in NCBI with the following IDs: GEO: GSE112378 and are available at: http://www.ncbi.nlm.nih.gov/geo/query/acc.cgi?acc=GSE112378.
Statistics
All experiments were conducted in triplicate unless otherwise stated. Statistical analyses were performed using Graphpad Prism 5.0 package. A significance level of p < 0.05 was used throughout the study. Differences between two experimental groups were analyzed using the unpaired two-tailed Student's t-test, growth curves were calculated using the two-way ANOVA. Kaplan-Meier curves representing survival were compared by the log-rank (Mantel-Cox) test.
Results
The PRC2 component EZH2 is highly expressed in TNBC samples and predicts poor survival of patients
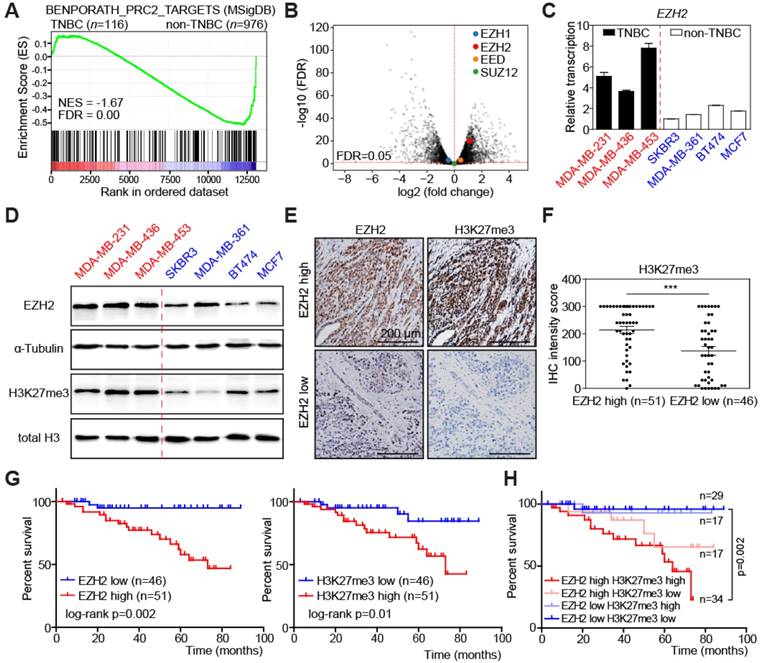
In order to find promising therapeutic targets specific for TNBC, we compared RNA sequencing data of 116 TNBC samples with 976 non-TNBC samples in the Cancer Genome Atlas (TCGA) breast cancer dataset. Gene Set Enrichment Analysis (GSEA) [42] showed that genes highly expressed in TNBC samples were significantly enriched for PRC2 target genes (Figure 1A). Therefore, we analyzed the relative abundance of the PRC2 components in TCGA dataset, including EZH1, EZH2, EED, and SUZ12. Interestingly, only EZH2 was highly upregulated in TNBC compared to non-TNBC samples, implying that EZH2 accounts for the enhanced PRC2 activity (Figure 1B, S1A). Considering the heterogeneity of TNBC, we then analyzed EZH2 expression in 6 different TNBC subtypes [45]. Despite their unique gene expression profiles, they have consistently higher EZH2 expression, except the mesenchymal- stem like (MSL) subtype (Figure S1B). We next examined 7 breast cancer cell lines, of which 3 were derived from TNBC patients (labelled in red), while the other 4 represent non-TNBC tumors (depicted in blue). Transcript levels of EZH2 were higher in the 3 TNBC cell lines (Figure 1C), while there was no difference on the other H3K27-targeting demethylase EZH1 (Figure S1C). The EZH2 expression pattern was also confirmed by immunoblot in these cell lines, with higher corresponding H3K27me3 levels underscoring the enhanced functional activity of EZH2 in the TNBC group [46] (Figure 1D). To determine whether levels of EZH2 and H3K27me3 are clinically relevant in an independent dataset, we performed immunohistochemistry (IHC) to examine their expression in 97 TNBC surgical specimens from Zhejiang Provincial People's Hospital (see Study approval in Methods section for details). According to their EZH2 expression, these patients can be categorized into EZH2-high and EZH2-low groups by median H-score (Figure 1E; see Materials and Methods for details). EZH2-high patients often exhibited high levels of H3K27me3, as predicted (Figure 1E-F), while other known H3K27me3-targeting enzymes, i.e. EZH1, KDM6A and KDM6B [47, 48] showed no tight correlation with H3K27me3 (Figure S1D). Besides, either high levels of EZH2 or H3K27me3 were correlated with shorter overall survival (Figure 1G). Moreover, the large subgroup of patients presenting with an overlap of both high levels of EZH2 and of H3K27me3 exhibited the poorest outcome (Figure 1H). Taken together, these data unveil that TNBC enrich for high expression of EZH2 and its target module H3K27me3, indicate that their particularly high expression predicts poor survival within the TNBC group, and further suggest that EZH2/ H3K27me3-repressed downstream targets might play a critical role in TNBC progression. In turn, we hypothesize the EZH2 cascade represent a critical vulnerability and a therapeutic target in TNBC.
High EZH2 and its target H3K27me3 expression in TNBC predicts poor overall survival of patients. (A) Gene Set Enrichment Analysis (GSEA) of polycomb repressive complex 2 (PRC2) target genes between TNBC and non-TNBC patients from TCGA-BRCA dataset comprising 1092 patients. Red colors denote a positive signal-to-noise ratio (SNR) between the two groups, blue colors indicate a negative SNR. NES: Normalized Enrichment Score. FDR: False Discovery Rate (Benjamini and Hochberg)-adjusted p value. (B) Volcano plot of RNA-seq data as in A, showing differential transcription of EZH1, EZH2, EED and SUZ12 between TNBC and non-TNBC. Genes above the horizontal red dashed line are those with significantly differential expression. (C) Relative transcription of EZH2 in indicated breast cancer cell lines by qRT-PCR analysis. Vertical red dashed line separates TNBC and non-TNBC cell lines. Scale bars indicate mean ± SD. (D) Immunoblot analysis of the indicated proteins in cell lysates from cell lines as in C. α-Tubulin and total H3 were used as loading controls. (E) Representative pictures of EZH2 and H3K27me3 immunohistochemical (IHC) staining in TNBC patient tumor samples. (F) IHC staining intensity of H3K27me3 in patient samples of EZH2 high vs. low groups. Scale bars indicate mean ± SEM. EZH2 expression level is defined by IHC staining intensity of tumor samples. Median value is used as cut-off to separate low and high groups. *** indicates p < 0.001. (G) Kaplan-Meier plot showing overall survival of TNBC patients with high vs. low EZH2 (left) or H3K27me3 (right) expression. (H) Kaplan-Meier plot showing overall survival of TNBC patients in indicated expression groups.
EZH2 is essential for cell cycle progression of TNBC cells
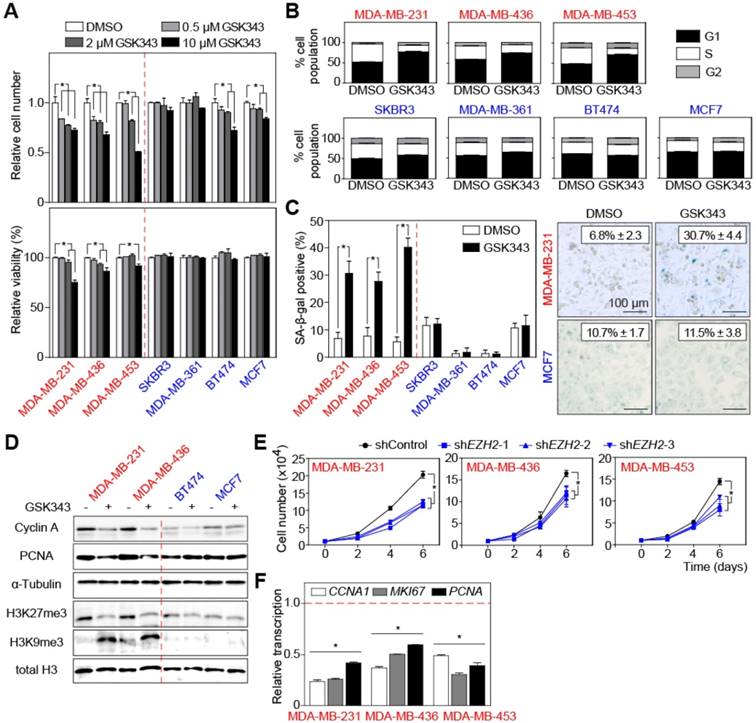
Therefore, we evaluated the effects of targeting EZH2 pharmacologically in TNBC. We tested GSK343, a small-molecule inhibitor with EZH2 specificity [49], at different concentrations on breast cancer cells. Lower concentrations of GSK343 (0.5 μM and 2 μM) consistently inhibited proliferation of all TNBC cell lines, while non-TNBC cell lines were much less sensitive to the treatment (Figure 2A, upper panel). Moreover, whereas viability of TNBC cells decreased under higher doses of GSK343 treatment, no increased cell death was observed in non-TNBC cells (Figure 2A, lower panels), suggesting that GSK343 exerts over a broader dose range anti-proliferative and cytotoxic effects selectively in TNBC cells. BrdU/PI staining showed that TNBC but not non-TNBC cells underwent G1 cell-cycle arrest under GSK343 treatment (Figure 2B, S2A). Since we noticed morphological changes reminiscent of cellular senescence (such as flattened and enlarged cell shape) in GSK343-treated cells, we examined senescence-associated β-galactosidase activity (SA-β-gal). Following GSK343 treatment, TNBC cell lines displayed a significant increase of SA-β-gal-positive cells, while the fraction of SA-β-gal-positive cells did not change in the non-TNBC group (Figure 2C). Cellular senescence is also characterized by the formation of heterochromatin foci [50]. Visualized by HP1γ immunofluorescence, around 35% of the GSK343-treated MDA-MB-231 cells indeed exhibited condensed heterochromatin foci (representative cell, marked by an arrow in Figure S2B), while virtually none (2%) of the non-TNBC MCF7 cells exhibited, if at all, much less HP1γ-dense chromatin (Figure S2B). We then examined global expression levels of the senescence marker H3K9me3 [50] by immunoblot, which unveiled a strong induction by GSK343 in TNBC cells, with no effect in non-TNBC cells (Figure 2D). Consistently, proliferation-related proteins Cyclin A and PCNA were found down-regulated in GSK343-treated TNBC cell lines by immunoblot analysis, while non-TNBC cell lines displayed only subtle difference (Figure 2D). H3K27me3 was detected at much lower, H3K9me3-reciprocal levels in GSK343-exposed TNBC cells, but remained unchanged in non-TNBC cells (Figure 2D). Similar results were obtained with another EZH2 inhibitor, DZNep (Figure S2C-D). To further understand the pivotal role of EZH2 in TNBC cells, we complemented the pharmacological inhibition by a genetic approach and knocked-down EZH2 expression by three small hairpins (i.e. shEZH2; Figure S2E). Comparable to GSK343 treatment, TNBC cells stably transduced with shEZH2 exhibited no changes in viability (Figure S2F), but had a significantly lower proliferation capacity, as further underscored by reduced transcript levels of the cell-cycle-related genes CCNA1, MKI67, and PCNA (Figure 2E-F). Taken together, EZH2 counters senescence and permits high-level proliferation of TNBC cells, while its inhibition uncovers a selective vulnerability of this highly aggressive breast cancer subentity.
Inhibition of EZH2 selectively suppresses proliferation of TNBC cell lines. (A) Relative cell number (top) and viability (bottom) of indicated cells treated with different concentrations of GSK343 for 2 days and compared with cells treated with solvent control DMSO. (B) Quantification of BrdU/PI cell-cycle analysis by flow cytometry showing G1, S, and G2 subpopulations of cells as in A treated with 2 µM GSK343. (C) Quantification (left) and representative pictures (right) of SA-β-gal staining of indicated cells treated with 2 µM GSK343 or DMSO for 5 days. (D) Immunoblot analyses of the indicated proteins of cell lysates from cells as in B. α-Tubulin and total H3 were used as loading controls. (E) Growth curve of cancer cells transduced with three different shEZH2 or shControl. (F) qRT-PCR analysis of the CCNA1, MKI67 and PCNA transcripts in cells expressing shEZH2-1. shEZH2-1 was used here and thereafter for RNA-seq analysis, and was referred as shEZH2 all through the manuscript. shControl-transduced cells were used as control. Data are shown as mean ± SD. * indicates p < 0.05.
TET1 mediates cell-cycle effects of EZH2 in TNBC cells
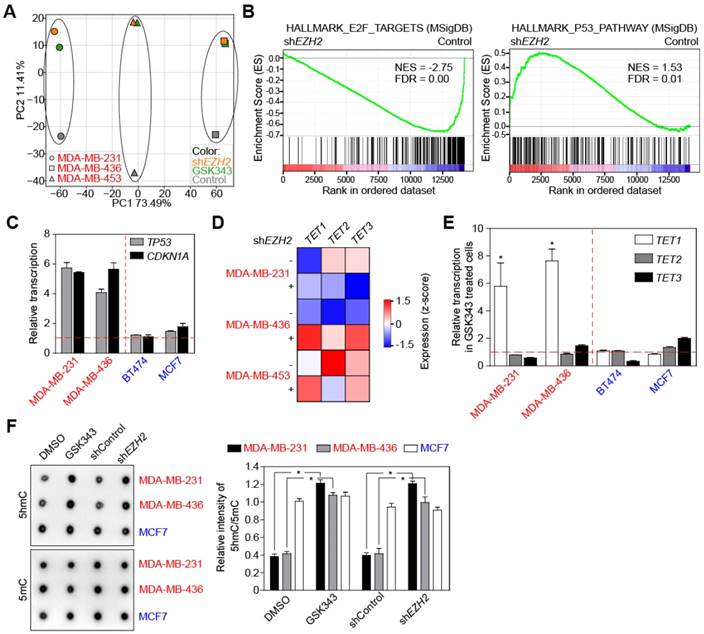
To further understand how EZH2 promotes cell-cycle progression of TNBC cells, we performed RNA sequencing analysis (RNA-seq) of 3 TNBC cell lines either treated with 2 μM GSK343, or stably transduced with shEHZ2, compared to appropriate controls. Principle component analyses (PCA) found similar transcriptional alterations in all three TNBC cell lines in response to GSK343 treatment or knock-down of EZH2 (Figure 3A). As expected, PRC2 target gene expression was elevated in shEZH2-expressing cell lines (Figure S3A). When screening important hallmark gene sets by GSEA, E2F target genes appeared down-regulated in line with slowed cell-cycle progression and senescence induction following EZH2 inhibition, and p53 pathway components were enriched in shEZH2-transduced cells (Figure 3B). We performed qRT-PCR analyses to confirm the upregulation of TP53 and its downstream target CDKN1A (encoding p21CIP1) in TNBC cell lines treated with 2 μM GSK343, while levels of these transcripts remained unchanged in non-TNBC cell lines (Figure 3C). Because we suspected the TP53 gene to be suppressed by PRC2, we performed chromosome immunoprecipitation (ChIP) to examine whether EZH2 directly binds to the TP53 promoter. To our surprise, the anti-EZH2 antibody failed to precipitate TP53 promoter sequences in both control and GSK343-treated conditions (Figure S3B). Since TP53 transcription has been reported to be regulated by promoter DNA methylation in breast cancer [51], we analyzed the DNA methylation status of the TP53 promoter by targeted bisulfite sequencing, and repetitively observed DNA demethylation at similar CpG sites upon GSK343 treatment in TNBC cells (Figure S3C). To elucidate the underlying mechanism, we focused on three candidate DNA-demethylating dioxygenases, TET1, TET2, and TET3, since TET1 was previously reported to be down-modulated by PRC2 in differentiated non-malignant cells [52]. Only TET1 exhibited a consistent upregulation in all three TNBC cell lines stably transduced with shEZH2 (Figure 3D). We also analyzed transcription of TET1, TET2, and TET3 in cell lines treated with the pharmacological EZH2 inhibitor GSK343. Again, TET1 but no other dioxygenases showed a dramatic enhancement in the two TNBC cell lines tested, while no profound changes were detectable for all three TET family members in non-TNBC cells (Figure 3E). Basal transcript levels of TET1, TET2, and TET3 in TNBC compared to non-TNBC cell lines appeared similar regarding TET2 and TET3, while mRNA and protein expression of TET1 was lower in the TNBC cell lines (Figure S3D-E), reciprocal to the EZH2 expression pattern (cf. Figure 1D). Considering that TET1 catalyzes the conversion of the modified genomic base 5-methylcytosine (5mC) into 5-hydroxymethylcytosine (5hmC), hence playing a key role in active DNA demethylation, we performed a genomic DNA dot blot analysis to examine the levels of 5hmC and 5mC. Consistent with their weak TET1 activity, TNBC cells exhibited low 5hmC levels, which increased upon GSK343 or shEZH2 treatment, while the non-TNBC representative and TET1-strong cell line MCF7 displayed higher basal levels of 5hmC that remained unchanged in response to pharmacological or genetic EZH2 inhibition (Figure 3F, left; quantification, right).
Inhibition of EZH2 elevates p53 and TET1 expression in TNBC. (A) Principal component analysis (PCA) of RNA-seq data comparing indicated cells expressing shEZH2 or treated with GSK343. (B) GSEA profiles of E2F targets and p53 pathway comparing cells with and without EZH2 knock-down. Gene expression profiles are combination of MDA-MB-231, MDA-MB-436 and MDA-MB-453 cells. See method section for details. (C) qRT-PCR analysis showing relative transcription of TP53 and CDKN1A genes in indicated cells treated with GSK343. Horizontal red dashed line indicates DMSO treated cells as control. (D) RNA-seq analysis of indicated cells with EZH2 knock-down showing relative expression of TET1, TET2 and TET3 DNA demethylases. (E) Relative transcription of TET1, TET2 and TET3 genes in indicated cells treated with GSK343 by qRT-PCR analysis. (F) Dot blot analysis (left) and quantification (right) of global 5hmC and 5mC level in indicated cells GSK343 treatment or EZH2 knock-down (DMSO or scrambled shRNA as control). 5 µg genomic DNA was loaded for detection. Data are shown as mean ± SD. * indicates p < 0.05.
TET1 is a direct suppression target of EZH2 and its downstream H3K27me3 decoration
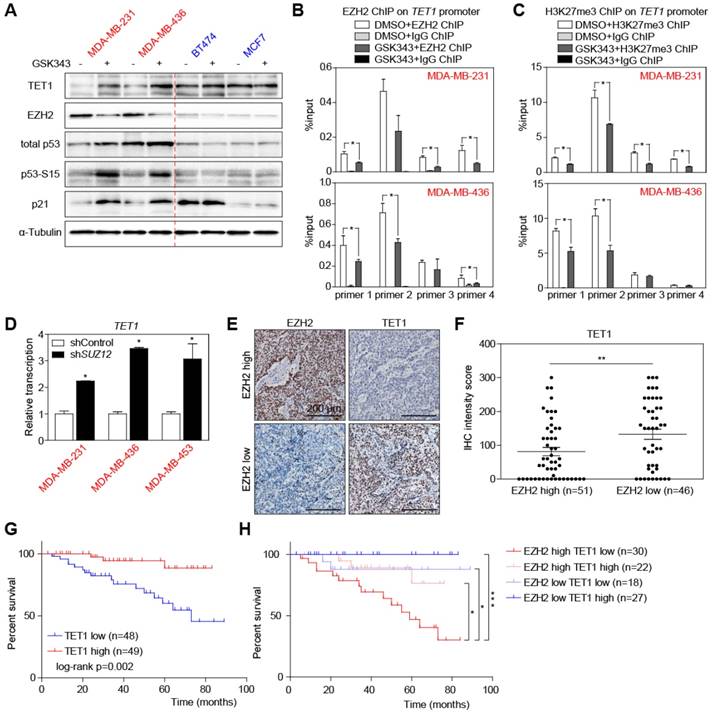
Immunoblotting and qRT-PCR also confirmed the upregulation of TET1 and downregulation of EZH2 proteins in TNBC cells treated with GSK343 in a dose dependent manner, which was accompanied by a profound activation of p53 signaling and downregulation of growth promoting protein E2F1 (Figure 4A, S4A-C). Interestingly, GSK343 did not only inhibit the catalytic activity of EZH2 but also downregulated EZH2 transcription and protein expression (Figure 4A, S4B-C). It could be explained by an indirect inhibition through E2F1 repression, which was reported to be a transcriptional activator of EZH2 [11]. We further hypothesized that TET1 might be a directly suppressed target of the EZH2-containing PRC2 complex. Therefore, we performed anti-EZH2 and anti-H3K27me3 ChIP, and found enrichment of the TET1 promoter in both MDA-MB-231 and MDA-MB-436 cells (Figure 4B-C). Moreover, the enrichment was significantly repressed by GSK343, suggesting that EZH2 suppresses TET1 transcription through modulation of its H3K27me3 decoration by PRC2 complex (Figure 4B-C). This was further supported by knocking down SUZ12, another key component of the PRC2 complex, whose downregulation resulted in TET1 induction (Figure 4D, S4D). Furthermore, by introducing the catalytic inactive mutant EZH2-F667I [53], we could verify that EZH2 catalytic activity is essential for TET1 suppression, whereas the inactive EZH2 could not inhibit TET1 expression (Figure S4E-F). We also analyzed TET1 in situ-expression in the same set of TNBC patient samples by immunohistochemistry, confirming a negative correlation between TET1 and EZH2 protein expression (Figure 4E-F), as well as a negative correlation between TET1 and H3K27me3 expression in TNBC tumor samples in situ (Figure S4G-H). Strikingly, Kaplan-Meier analysis found TNBC patients with high expression of TET1 to survive longer (Figure 4G). Moreover, patients exhibiting both high level of EZH2 and low level of TET1 expression presented with the poorest outcome (Figure 4H), underscoring the particular inferior impact the functional EZH2high/TET1low module but no sole EZH2 overexpression or reduced TET1 expression due to other modes of deregulation in TNBC [9, 54].
TET1 expression is regulated by PRC2 complex-mediated H3K27me3. (A) Immunoblot analysis of the indicated proteins in lysates from cells treated with 2 µM GSK343 for 2 days and compared with cells treated with DMSO. (B) ChIP-qPCR analysis of MDA-MB-231 and MDA-MB-436 cells treated with GSK343 or DMSO, using an anti-EZH2 antibody and PCR primers specific for TET1 promoter. Input (no immunoprecipitation) as internal control and anti-IgG as negative control. (C) ChIP-qPCR analysis of MDA-MB-231 and MDA-MB-436 cells treated with GSK343 or DMSO, using an anti-H3K27me3 antibody and PCR primers specific for TET1 promoter. (D) qRT-PCR analysis of TET1 expression in cells expressing shSUZ12. (E) Representative pictures of IHC staining of patient tumor samples showing EZH2 and TET1 expression. (F) TET1 IHC staining intensity of patient tumor samples in EZH2 high vs. low groups. Scale bars indicate mean ± SEM. (G) Kaplan-Meier plot showing overall survival of TNBC patients with high vs. low TET1 expression. (H) Kaplan-Meier plot showing overall survival of TNBC patient groups with indicated EZH2 and TET1 expression. Data are shown as mean ± SD, unless otherwise indicated. * indicates p < 0.05. ** indicates p < 0.01. *** indicates p < 0.001.
TP53 promoter is directly demethylated by TET1
To further study whether TET1 contributes to the effects EZH2 inhibition exerts in TNBC cells, we engineered two TNBC cell lines, MDA-MB-231 and MDA-MB-436, to stably express TET1 from retroviral alleles, i.e. independent of endogenous TET1 promoter regulation. Growth curve and colony formation assays found constitutively TET1-stabilized cells to expand more slowly than control cells (Figure 5A). Similar to our observations in shEZH2-transduced and low-concentration-GSK343-treated settings (cf. Figures 2A, S2F), viability remained unaffected by modulating TET1 expression (Figure S5A). The TET1-overexpressing samples, when compared to vector controls, presented with much higher fractions of SA-β-gal-positive and much lower percentages of Ki67-positive cells (Figure 5B). Consistent with a senescent phenotype, immunofluorescent HP1γ staining demonstrated condensed heterochromatin foci in TET1-overexpressing cells (Figure 5C).
TET1 elevates p53 expression and represses TNBC cell proliferation. (A) Growth curve (top) and colony formation (bottom) analyses of MDA-MB-231 and MDA-MB-436 cells expressing TET1 or vector as control. (B) SA-β-gal and Ki67 staining of cells as in A. (C) Representative pictures showing HP1γ immunofluorescent staining in cells expressing TET1 or vector. Scale bars = 10 µm. (D) Immunoblot analysis of the indicated proteins in lysates from cells as in A with α-Tubulin and total H3 as loading controls. (E) ChIP-qPCR analysis of MDA-MB-231 and MDA-MB-436 cells expressing TET1 or vector as control, using an anti-TET1 antibody and PCR primers specific for TP53 promoter. Input as internal control and anti-IgG as negative control. (F) Relative cell number of indicated cells expressing shTET1 or vector, 2 days after GSK343 or DMSO treatment. (G) SA-β-gal staining of cells expressing shTET1 or vector, treated with GSK343 or DMSO. (H) Immunoblot analysis of the indicated proteins in lysates from cells as in G with α-Tubulin as loading control. (I) ChIP-qPCR analysis of cells as in F, using an anti-TET1 antibody and PCR primers specific for TP53 promoter. Input as internal control and anti-IgG as negative control. Data are shown as mean ± SD. * indicates p < 0.05.
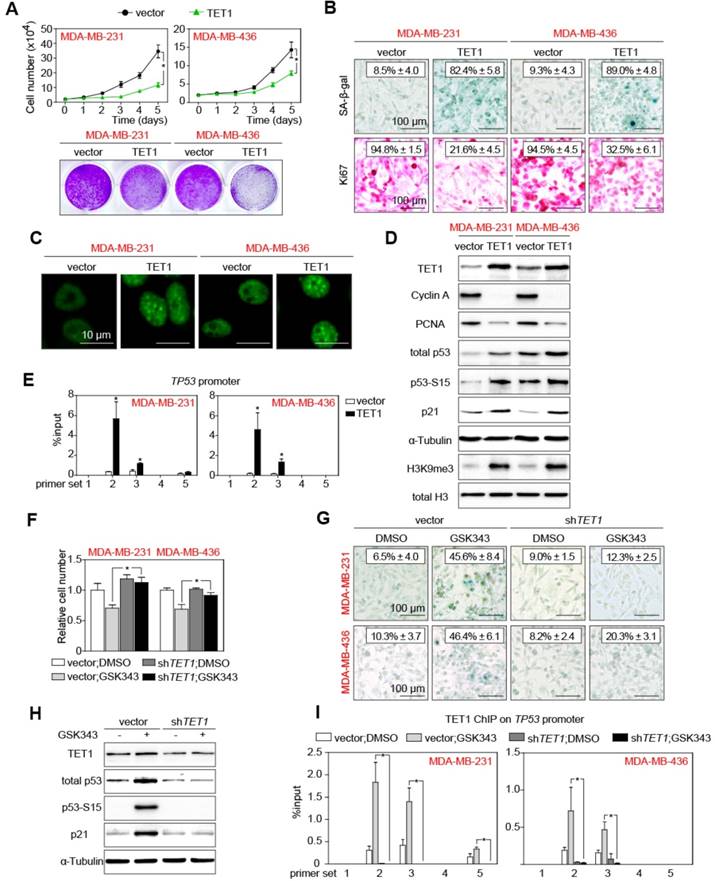
All these cellular characteristics were reminiscent of the above reported effects exerted by GSK343 treatment or EZH2 knock-down in TNBC cells. Immunoblotting analyses documented reduced expression levels of the cell-cycle progression markers Cyclin A and PCNA in the TET1-stabilized samples. Again, total p53, p53-S15 and p21CIP1 levels as well as the H3K9me3 mark, all consistent with senescence induction, were found elevated in TET1-transduced cells (Figure 5D). Since TET1 is a DNA-demethylating moiety, we further hypothesized that TET1 may reduce methylation at the TP53 promoter, leading to the enhanced transcription of TP53 in TET1-overexpressing cells. In fact, not only p53 protein levels, but also transcription of TP53 was upregulated in TET1-overexpressing cells (Figure S5B). We performed ChIP analyses with an anti-TET1 antibody, and found multiple sites of the TP53 promoter occupied by TET1 (Figure 5E). Targeted bisulfite sequencing indeed unveiled reduced methylation at the TP53 promoter in TET1-overexpressing cells compared with control cells (Figure S5C). To investigate whether TET1 accounts for the effects of EZH2 inhibition or knock-down, we generated shTET1-expressing TNBC cells (Figure S5D). In these cells with their already low basal TET1 expression levels, knocking-down TET1 led to even further reduced levels of 5hmC (Figure S5E). Importantly, TET1 depletion rescued the growth effects of GSK343 treatment in the TNBC cell lines (Figure 5F), while it had no impact on viability (Figure S5F), thereby indicating that EZH2 inhibition largely acts through restoration of TET1 in TNBC cells. Accordingly, shTET1 prevented senescence induction observed in TNBC cells upon exposure to GSK343 (Figure 5G; cf. Figure 2C). Immunoblotting also demonstrated that GSK343 treatment failed to reduce the expression of Cyclin A and PCNA, and to enhance the expression of the p53/p21CIP1 cascade as well as H3K9me3 in shTET1-stable cells (Figure 5H, S5G). Finally, anti-TET1-ChIP provided proof for strongly enhanced TET1 binding to the TP53 promoter following GSK343 treatment, which was completely abrogated in shTET1-stable cells (Figure 5I). Intriguingly, inhibition of p53 by siRNA could significantly, but not completely, rescue the growth effects of GSK343 treatment in the TNBC cell lines (Figure S5H). This indicated that there might be other tumor suppressive effects by inhibiting EZH2 besides the EZH2-TET1-p53 due to the broadly epigenetic regulatory capacity of both EZH2 and TET1. In essence, these data pinpoint TET1 as the essential negatively regulated downstream target of EZH2 whose suppression blocks senescence and licenses proliferation, thereby underscoring the strong rationale for therapeutic inhibition of EZH2 in TNBC.
Combined treatment with Adriamycin and GSK343 significantly reduces TNBC expansion in vitro and in vivo
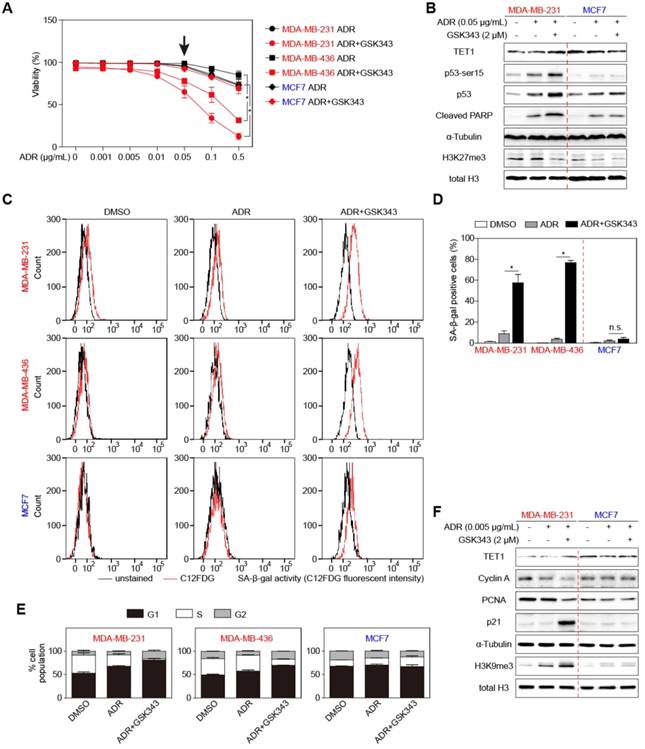
To test the pharmaceutical potential of GSK343 in the context of clinically-used standard chemotherapy, we set up combination-treatment experiments with the first-line breast cancer drug Adriamycin (ADR), a topoisomerase-poisoning anthracycline. Viability analyses showed that ADR alone was not very effective in killing TNBC cells (Figure 6A, data in black). However, combined treatment with 2 μM of GSK343, whose limited single-agent impact on cell survival we showed earlier in this study, resulted in near-total killing of MDA-MB-231 and MDA-MB-436 cells (Figure 6A, data in red). Immunoblot analyses confirmed particularly elevated TET1 and reduced H3K27me3 levels in response to the combination treatment selectively in the TNBC-representative cell lines, but not (or to a much lesser extent) in the non-TNBC comparator cell line. Notably, GSK343 drastically sensitized TNBC cells to ADR treatment by enhancing p53 expression and its downstream targets PUMA, BAX and BIM, which induced a much stronger apoptotic phenotype compared to ADR treatment alone (Figure 6A-B, S6A-B). With ultra-low concentrations of ADR, however, ADR/GSK343 combination therapy profoundly increased C12FDG-based fluorescent SA-β-gal reactivity in TNBC cells, while only evoking a marginal, insignificant signal shift in the non-TNBC cell line (Figure 6C, quantified in 6D). BrdU/PI-based cell-cycle analysis further underscored that TNBC cell lines treated with the ADR/GSK343 combination entered an almost complete arrest predominantly in the G1-phase with a dramatic reduction of the S-phase fraction, whereas very little changes were observed in non-TNBC cells (Figure 6E). Interestingly, the ultra-low ADR dose, probably a good approximation to tissue concentrations actually achieved due to heterogeneous drug distribution in the patient's tumor, evoked in combination with GSK343 a senescence-reminiscent marker pattern by immunoblot analysis in TNBC cells, while the same combination had virtually no impact on these markers in non-TNBC cells (Figure 6F).
GSK343-treated TNBC cells are sensitive to adriamycin treatment. (A) Viability of indicated cells treated with different concentrations of adriamycin alone or together with 2 µM GSK343. (B) Immunoblot analysis of the indicated proteins in lysates from MDA-MB-231 and MCF7 cells treated with 0.05 μg/ml adriamycin alone, or together with GSK343, or DMSO. α-Tubulin and total H3 were used as loading controls. (C and D) C12FDG fluorescent analysis by FACS (C) and quantification (D) showing SA-β-gal positivity of cells treated with 0.005 µg/ml adriamycin with or without 2 µM GSK343, or DMSO. (E) Quantification of G1, S and G2 subpopulations of BrdU/PI cell-cycle analysis of cells as in C. (F) Immunoblot analysis of the indicated proteins in lysates from MDA-MB-231 and MCF7 cells as in C. α-Tubulin and total H3 were used as loading controls. Data are shown as mean ± SD. * indicates p < 0.05.
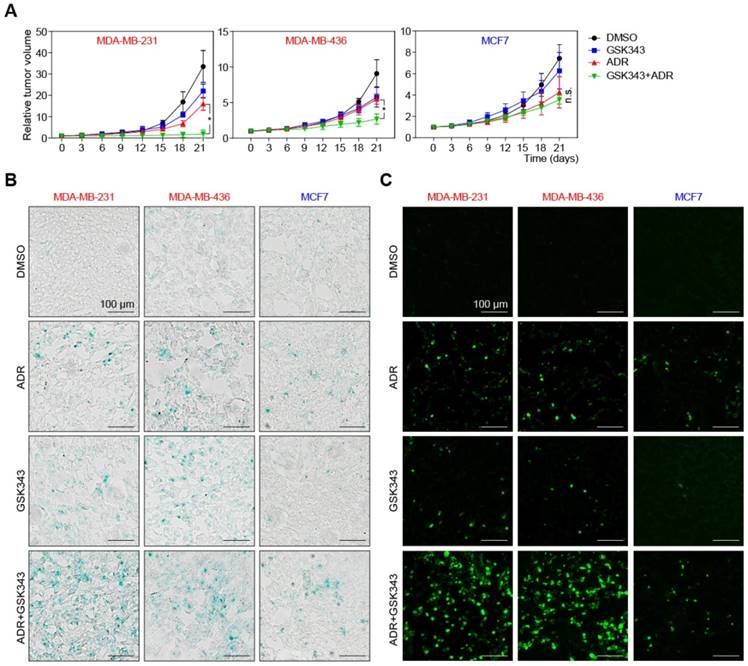
To test the therapeutic effects of GSK343, ADR, or their combination in vivo, we established xenograft mouse models by subcutaneous implanting TNBC and non-TNBC cell lines into nude mice. When tumors became palpable (about 50 mm3), we started treatment with DMSO (as a solvent control), GSK343, ADR, or an ADR/GSK343 combination (see Materials and Methods for details regarding dose/schedule). After 21 days of therapy, the tumors in the control group reached the predetermined endpoint. Strikingly, the ADR/GSK343 combination was much more effective when compared to any single-agent treatment regarding growth control of TNBC tumors, but was not superior to ADR alone in mice harboring non-TNBC tumors (Figure 7A). Moreover, the relative growth suppression by the combination therapy was by far stronger in the rapidly expanding TNBC tumors as compared to the slower progressing non-TNBC tumors. We isolated representative tumors (Figure S7A), and examined the fractions of senescent and apoptotic cells of these xenograft tumors in situ. The ADR/GSK343 combination most effectively activated TET1 and p53 expression (Figure S7C) and subsequently induced senescence, especially in TNBC tumors (Figure 7B), where it also achieved the highest rate of apoptotic cell death (Figure 7C, S6B). Taken together, these results underscore the in vitro-results of EZH2 targeting in TNBC cells, and its superior activity when administered in combination with ADR. Moreover, enhanced apoptosis and execution of cellular senescence reflect the critical effector mechanisms that particularly harness the highly aggressive growth behavior of TNBC, for which a conventional chemotherapy strategy is clinically - as experimentally reproduced in our hands (Figure 7A) - not sufficient.
Adriamycin and GSK343 combination treatment represses TNBC xenograft tumor progression. (A) Growth curves of xenografted MDA-MB-231, MDA-MB-436 and MCF7 cells in NSG mice subjected to GSK343, Adriamycin, GSK343+Adriamycin combination or DMSO. Data are shown as mean ± SD. * indicates p < 0.05. (B, C) Representative photos of isolated tumors as in A ex vivo and corresponding SA-β-gal (B) and TUNEL stainings (C) of tumor sections.
Discussion and conclusions
Intrigued by the hypothesis that cancers lacking overtly overexpressed key drivers of oncogenic signaling might possess aberrant pro-tumorigenic activities rather at the level of epigenetic regulators, we identified here overexpression of the PRC2 subunit EZH2 in conjunction with suppressed expression of TET1 as the prominent cancer-promoting principle in TNBC. Strikingly, we uncovered here a double epigenetic control of pro-senescent genes exerted via an EZH2-mediated repressive chromatin environment at the TET1 promoter, thus diminishing its DNA-demethylating activity at target genes, among them the pro-senescent and pro-apoptotic tumor suppressor p53. The histone methyltransferase EZH2 operates as a writer of repressive H3K27me3 histone marks, whereas the dioxygenase TET1 re-enables gene expression by erasing silencing methyl groups within the promoter DNA sequence. Unlike normal epigenetic expression control often reinforced by combining repressive histone methylation and silencing DNA methylation at the same target gene promoters, the double expression control reported here comes as an unusual, linear epigenetic-epigenetic co-deregulation. EZH2-mediated H3K27me3 marks shut down TET1 expression, which, in turn, can no longer demethylate its target genes, hence, resulting in the firm repression of genes controlled by the deregulated EZH2/ H3K27me3/TET1 axis. Patient cohort-wide correlative studies indicate that some TNBC tumor samples appear to be driven by either EZH2 overexpression or lowered TET1 expression, while the vast majority presents as both EZH2high and TET1low. Importantly, this writer/eraser liaison is distinctly different from the well-known and frequently detectable repressive chromatin marks (e.g. H3K9me3) co-decorating the very same target promoters that are simultaneously silenced by DNA methylation [55, 56]. Functional genetics employing TET1 knock-down position the DNA demethylase downstream of EZH2/H3K27me3 in a linear cascade, thereby uncovering double epigenetic control as a hitherto underreported oncogenic principle. It remains to be further elucidated whether such a mechanism, when compared to sole histone or DNA methylation or the combination thereof at the same promoter is a particularly robust, reinforcing way to shut down gene expression, or rather allows much better fine-tuning of the ultimate set of target genes. This is a particularly interesting question, since we identified as a prime target of the EZH2/H3K27me3/TET1 axis the p53 tumor suppressor gene, which is much better characterized regarding its posttranslational expression control via Mdm2-mediated proteasomal degradation, and to a much lesser extent as a subject of transcriptional control [57].
Apparently, breast cancer patients exhibiting EZH2high/TET1low co-deregulation experience the most detrimental outcome when compared to patient cohorts characterized by only one of the two marks. Hence, it is not only the overexpression of EZH2 that distinguishes TNBC from non-TNBC tumors, it is likewise the EZH2high/TET1low label that characterizes a particularly poor-outcome subcohort within the group of TNBC patients. Given the notoriously low responsiveness of TNBC patients to conventional chemotherapeutic agents in the clinic, as recapitulated in our experimental approaches, more effective, molecularly motivated treatment strategies are urgently needed for this poor-prognosis patient group. As a first approach, we pinpoint here the selective vulnerability of TNBC cells to genetic or pharmacological inhibition of EZH2 as the upstream master principle of EZH2/TET1 deregulation, and demonstrate its chemo-resensitizing effect presumeably mediated, at least in part, by restoration of the previously silenced expression of the pro-apoptotic and pro-senescent p53 gene. Future investigations will tell whether a therapeutic strategy mirroring the linear deregulation of both epigenetic players, namely an EZH2 inhibitor/TET1 activator combination, perhaps as a “chemo-free” regimen, might produce even superior tumor control. Further supporting this notion, we have previously shown that overexpression of TET1 profoundly suppressed tumor growth in a human gastric xenograft model [58]. Moreover, in the awareness of related dioxygenases, especially TET2, frequently presenting with inactivating mutations in AML and some lymphoma entities [59-61], alternative approaches to compensate the diminished DNA-demethylating capacity, e.g. via leukemia-approved DNA-hypomethylating agents such as Decitabine [62], applied in combination with an EZH2 inhibitor, may further exploit the TNBC-characteristic EZH2high/TET1low oncogenic principle.
We chose the GSK343 compound to inhibit EZH2 because of its high specificity [49]. To our surprise, GSK343 not only reduced the activity of EZH2, as indicated by down-regulated H3K27me3, but also inhibited expression of EZH2 itself, suggesting that EZH2 may promote its own stability or expression. In normal tissues, EZH2 expression is controlled by the E2F pathway and restricted to proliferating cells [11]. In our study, we show that inhibition of EZH2 by GSK343 leads to upregulation of H3K9me3 and suppression of E2F target genes, suggesting that a positive feedback loop is present between EZH2 and E2F signaling. Thus, EZH2 targeting might be particularly effective in cancer cells whose proliferation depends on high-level signaling activity of both the EZH2 histone methyltransferase and E2F transcription factors. Moreover, inhibition of EZH2 has been shown to upregulate the senescence-associated p16INK4A and p14ARF proteins [63], which might partially explain the senescent phenotype we observed in GSK343-treated cells. The role of senescence as a therapeutically exploitable but, likewise, potentially resistance-conferring inactivation principle is further underscored by the observation that TNBC patients are prone in the course of their disease to INK4A-ARF deletions. However, the patient specimens we examined here stained positive for p14ARF in 48.7% and for p16INK4a in 77.1% of the cases, thereby implying that a large proportion of TNBC patients can build on an intact INK4a/ARF functions for GSK343-evoked senescence induction.
At this stage, we can only speculate why TNBC tumors present with this prominent double-epigenetic deregulator principle, while lacking distinct lesions in typically cancer-associated signaling cascades. Previous reports indicate that overexpression of EZH2 may be due to gene amplification [64] or a gain-of-function mutation [65]. High levels of EZH2 seem to play a role in expanding cancer stem cells to initiate breast cancer as shown by EZH2 transgenic mice [66]. EZH2 also promotes TNBC invasion by cooperating with FoxM1 [67]. TET1 depletion was shown to facilitate cell invasion, tumor growth, and cancer metastasis in prostate xenograft models and correlates with poor survival of breast cancer patients [68, 69]. EZH2/TET1 co-deregulation, reflecting the critical role of epigenetic regulators in embryonic development, tissue formation and cell identity, might indeed instruct mammary epithelial cell plasticity towards a more stem-like program that equips these cells irrespective of activating mutations in classic oncogenes and inactivating defects of tumor suppressor genes with aberrant self-renewal capacity, and, likewise, intrinsic stem cell-reminiscent chemoresistance. Future investigations will clarify, whether therapeutic interrogation of TNBC-characteristic EZH2/TET1 deregulation not only exerts its efficacy via inducing apoptosis and senescence, but by ultimately targeting cancer stemness as the crucial underlying biological principle.
Abbreviations
TNBC: triple-negative breast cancer; HER2: human epidermal growth factor receptor 2; PRC2: polycomb repressive complex 2; 5mC: 5-methylcytosine; 5hmC: 5-hydroxymethylcytosine; FFPE: formaldehyde-fixed paraffin-embedded; BrdU: bromdesoxyuridin; DAB: diaminobenzidine; ChIP: chromatin immunoprecipitation; GSEA: gene set enrichment analysis; MSL: mesenchymal-stem like.
Supplementary Material
Supplementary figures and tables.
Acknowledgements
We thank Dr. Qionghua Zhu and Dr. Chuanbing Zang for cells, Dr. Qinian Wu and Dr. Xin Zhang for assistance on pathological analysis of tissue section IHC staining and members of Schmitt and Tao laboratories for discussions. This work was supported by National Natural Science Foundation of China (81001324 and 81373163) to R.T.; Natural Science Foundation of Zhejiang Province grant for “Outstanding Youth” (LR15H100001) to R.T.; an interim starting funding from ZJPPH to R.T.; the Deutsche Forschungsgemeinschaft (TRR 54) and the German Cancer Consortium (Deutsches Konsortium für Translationale Krebsforschung [DKTK]) to C.A.S.; National Natural Science Foundation of China (2018M643340) to J.Q.; Precision Oncology Research Program of Guangdong Province (GDACA001) to J.Q.; National Natural Science Foundation of China (81802624) to D.C.; the General Project Funds from the Health Department of Zhejiang Province (2019319046) to D.C.; Natural Science Foundation of Zhejiang Province grant (LY15H100003) to B.Z.; Hangzhou Science and Technology Bureau Grant (20140733Q35) to J.H.; and Ningbo Science and Technology Commission grant (2014A610243) to D.Y.
Author contributions
Y.Y., J.Q. designed the study, executed most of the experiments, analyzed the data and wrote the manuscript. J.X. performed analysis of TCGA and RNA-sequencing data. L.J. and T.M. initiated the study and performed bisulfite sequencing analysis. D. C., J.H., P.C., S.S., J.W., D.Y., and B.Z. collected patient specimens and performed IHC. L.L. and C.W. assisted in xenograft tumor histologic analyses. C.A.S. and R.T. conceived and supervised the study, and wrote the manuscript.
Competing Interests
The authors have declared that no competing interest exists.
References
1. Dent R, Trudeau M, Pritchard KI, Hanna WM, Kahn HK, Sawka CA. et al. Triple-negative breast cancer: clinical features and patterns of recurrence. Clin Cancer Res. 2007;13:4429-34
2. Bauer KR, Brown M, Cress RD, Parise CA, Caggiano V. Descriptive analysis of estrogen receptor (ER)-negative, progesterone receptor (PR)-negative, and HER2-negative invasive breast cancer, the so-called triple-negative phenotype: a population-based study from the California cancer Registry. Cancer. 2007;109:1721-8
3. Foulkes WD, Smith IE, Reis-Filho JS. Triple-negative breast cancer. N Engl J Med. 2010;363:1938-48
4. Hinshelwood RA, Clark SJ. Breast cancer epigenetics: normal human mammary epithelial cells as a model system. J Mol Med. 2008;86:1315-28
5. Jovanovic J, Ronneberg JA, Tost J, Kristensen V. The epigenetics of breast cancer. Mol Oncol. 2010;4:242-54
6. Ben-Porath I, Thomson MW, Carey VJ, Ge R, Bell GW, Regev A. et al. An embryonic stem cell-like gene expression signature in poorly differentiated aggressive human tumors. Nat Genet. 2008;40:499-507
7. Sparmann A, van Lohuizen M. Polycomb silencers control cell fate, development and cancer. Nat Rev Cancer. 2006;6:846-56
8. Sauvageau M, Sauvageau G. Polycomb group proteins: multi-faceted regulators of somatic stem cells and cancer. Cell Stem Cell. 2010;7:299-313
9. Kleer CG, Cao Q, Varambally S, Shen RL, Ota L, Tomlins SA. et al. EZH2 is a marker of aggressive breast cancer and promotes neoplastic transformation of breast epithelial cells. P Natl Acad Sci USA. 2003;100:11606-11
10. Varambally S, Dhanasekaran SM, Zhou M, Barrette TR, Kumar-Sinha C, Sanda MG. et al. The polycomb group protein EZH2 is involved in progression of prostate cancer. Nature. 2002;419:624-9
11. Bracken AP, Pasini D, Capra M, Prosperini E, Colli E, Helin K. EZH2 is downstream of the pRB-E2F pathway, essential for proliferation and amplified in cancer. EMBO J. 2003;22:5323-35
12. Takawa M, Masuda K, Kunizaki M, Daigo Y, Takagi K, Iwai Y. et al. Validation of the histone methyltransferase EZH2 as a therapeutic target for various types of human cancer and as a prognostic marker. Cancer Sci. 2011;102:1298-305
13. Bachmann IM, Halvorsen OJ, Collett K, Stefansson IM, Straume O, Haukaas SA. et al. EZH2 expression is associated with high proliferation rate and aggressive tumor subgroups in cutaneous melanoma and cancers of the endometrium, prostate, and breast. Journal of Clinical Oncology. 2006;24:268-73
14. Chang CJ, Yang JY, Xia WY, Chen CT, Xie XM, Chao CH. et al. EZH2 Promotes Expansion of Breast Tumor Initiating Cells through Activation of RAF1-beta-Catenin Signaling. Cancer Cell. 2011;19:86-100
15. Beguelin W, Popovic R, Teater M, Jiang YW, Bunting KL, Rosen M. et al. EZH2 Is Required for Germinal Center Formation and Somatic EZH2 Mutations Promote Lymphoid Transformation. Cancer Cell. 2013;23:677-92
16. Tiwari N, Tiwari VK, Waldmeier L, Balwierz PJ, Arnold P, Pachkov M. et al. Sox4 Is a Master Regulator of Epithelial-Mesenchymal Transition by Controlling Ezh2 Expression and Epigenetic Reprogramming. Cancer Cell. 2013;23:768-83
17. Zingg D, Debbache J, Schaefer SM, Tuncer E, Frommel SC, Cheng P. et al. The epigenetic modifier EZH2 controls melanoma growth and metastasis through silencing of distinct tumour suppressors. Nature Communications. 2015:6
18. Cao Q, Yu J, Dhanasekaran SM, Kim JH, Mani RS, Tomlins SA. et al. Repression of E-cadherin by the polycomb group protein EZH2 in cancer. Oncogene. 2008;27:7274-84
19. Min J, Zaslavsky A, Fedele G, McLaughlin SK, Reczek EE, De Raedt T. et al. An oncogene-tumor suppressor cascade drives metastatic prostate cancer by coordinately activating Ras and nuclear factor-kappa B. Nat Med. 2010;16:286-U82
20. Comet I, Riising EM, Leblanc B, Helin K. Maintaining cell identity: PRC2-mediated regulation of transcription and cancer. Nat Rev Cancer. 2016;16:803-10
21. Lo PK, Sukumar S. Epigenomics and breast cancer. Pharmacogenomics. 2008;9:1879-902
22. Ito S, D'Alessio AC, Taranova OV, Hong K, Sowers LC, Zhang Y. Role of Tet proteins in 5mC to 5hmC conversion, ES-cell self-renewal and inner cell mass specification. Nature. 2010;466:1129-33
23. Tahiliani M, Koh KP, Shen Y, Pastor WA, Bandukwala H, Brudno Y. et al. Conversion of 5-methylcytosine to 5-hydroxymethylcytosine in mammalian DNA by MLL partner TET1. Science. 2009;324:930-5
24. Haffner MC, Chaux A, Meeker AK, Esopi DM, Gerber J, Pellakuru LG. et al. Global 5-hydroxymethylcytosine content is significantly reduced in tissue stem/progenitor cell compartments and in human cancers. Oncotarget. 2011;2:627-37
25. Kudo Y, Tateishi K, Yamamoto K, Yamamoto S, Asaoka Y, Ijichi H. et al. Loss of 5-hydroxymethylcytosine is accompanied with malignant cellular transformation. Cancer Science. 2012;103:670-6
26. Yang H, Liu Y, Bai F, Zhang JY, Ma SH, Liu J. et al. Tumor development is associated with decrease of TET gene expression and 5-methylcytosine hydroxylation. Oncogene. 2013;32:663-9
27. Lian CG, Xu YF, Ceol C, Wu FZ, Larson A, Dresser K. et al. Loss of 5-Hydroxymethylcytosine Is an Epigenetic Hallmark of Melanoma. Cell. 2012;150:1135-46
28. Rose NR, Klose RJ. Understanding the relationship between DNA methylation and histone lysine methylation. Bba-Gene Regul Mech. 2014;1839:1362-72
29. Du JM, Johnson LM, Jacobsen SE, Patel DJ. DNA methylation pathways and their crosstalk with histone methylation. Nat Rev Mol Cell Bio. 2015;16:519-32
30. Lindroth AM, Shultis D, Jasencakova Z, Fuchs J, Johnson L, Schubert D. et al. Dual histone H3 methylation marks at lysines 9 and 27 required for interaction with CHROMOMETHYLASE3. Embo Journal. 2004;23:4146-55
31. Tamaru H, Zhang X, McMillen D, Singh PB, Nakayama J, Grewal SI. et al. Trimethylated lysine 9 of histone H3 is a mark for DNA methylation in Neurospora crassa. Nature Genetics. 2003;34:75-9
32. Jackson JP, Lindroth AM, Cao XF, Jacobsen SE. Control of CpNpG DNA methylation by the KRYPTONITE histone H3 methyltransferase. Nature. 2002;416:556-60
33. Euhus DM, Hudd C, LaRegina MC, Johnson FE. Tumor measurement in the nude mouse. J Surg Oncol. 1986;31:229-34
34. Schmitt CA, Fridman JS, Yang M, Baranov E, Hoffman RM, Lowe SW. Dissecting p53 tumor suppressor functions in vivo. Cancer Cell. 2002;1:289-98
35. Schmitt CA, McCurrach ME, de Stanchina E, Wallace-Brodeur RR, Lowe SW. INK4a/ARF mutations accelerate lymphomagenesis and promote chemoresistance by disabling p53. Genes Dev. 1999;13:2670-7
36. Debacq-Chainiaux F, Erusalimsky JD, Campisi J, Toussaint O. Protocols to detect senescence-associated beta-galactosidase (SA-betagal) activity, a biomarker of senescent cells in culture and in vivo. Nat Protoc. 2009;4:1798-806
37. Jing H, Kase J, Dorr JR, Milanovic M, Lenze D, Grau M. et al. Opposing roles of NF-kappaB in anti-cancer treatment outcome unveiled by cross-species investigations. Genes Dev. 2011;25:2137-46
38. Mccarty KS, Szabo E, Flowers JL, Cox EB, Leight GS, Miller L. et al. Use of a Monoclonal Antiestrogen Receptor Antibody in the Immunohistochemical Evaluation of Human-Tumors. Cancer Research. 1986;46:4244-8
39. Yu Y, Schleich K, Yue B, Ji S, Lohneis P, Kemper K. et al. Targeting the Senescence-Overriding Cooperative Activity of Structurally Unrelated H3K9 Demethylases in Melanoma. Cancer Cell. 2018;33:322-36 e8
40. Li LC, Dahiya R. MethPrimer: designing primers for methylation PCRs. Bioinformatics. 2002;18:1427-31
41. Anders S, Huber W. Differential expression analysis for sequence count data. Genome Biol. 2010;11:R106
42. Subramanian A, Tamayo P, Mootha VK, Mukherjee S, Ebert BL, Gillette MA. et al. Gene set enrichment analysis: a knowledge-based approach for interpreting genome-wide expression profiles. Proc Natl Acad Sci U S A. 2005;102:15545-50
43. Dobin A, Davis CA, Schlesinger F, Drenkow J, Zaleski C, Jha S. et al. STAR: ultrafast universal RNA-seq aligner. Bioinformatics. 2013;29:15-21
44. Anders S, Pyl PT, Huber W. HTSeq-a Python framework to work with high-throughput sequencing data. Bioinformatics. 2015;31:166-9
45. Lehmann BD, Bauer JA, Chen X, Sanders ME, Chakravarthy AB, Shyr Y. et al. Identification of human triple-negative breast cancer subtypes and preclinical models for selection of targeted therapies. J Clin Invest. 2011;121:2750-67
46. Cao R, Wang L, Wang H, Xia L, Erdjument-Bromage H, Tempst P. et al. Role of histone H3 lysine 27 methylation in Polycomb-group silencing. Science. 2002;298:1039-43
47. Agger K, Cloos PA, Christensen J, Pasini D, Rose S, Rappsilber J. et al. UTX and JMJD3 are histone H3K27 demethylases involved in HOX gene regulation and development. Nature. 2007;449:731-4
48. Margueron R, Li GH, Sarma K, Blais A, Zavadil J, Woodcock CL. et al. Ezh1 and Ezh2 Maintain Repressive Chromatin through Different Mechanisms. Molecular Cell. 2008;32:503-18
49. Verma SK, Tian X, LaFrance LV, Duquenne C, Suarez DP, Newlander KA. et al. Identification of Potent, Selective, Cell-Active Inhibitors of the Histone Lysine Methyltransferase EZH2. ACS Med Chem Lett. 2012;3:1091-6
50. Narita M, Nunez S, Heard E, Lin AW, Hearn SA, Spector DL. et al. Rb-mediated heterochromatin formation and silencing of E2F target genes during cellular senescence. Cell. 2003;113:703-16
51. Kang JH, Kim SJ, Noh DY, Park IA, Choe KJ, Yoo OJ. et al. Methylation in the p53 promoter is a supplementary route to breast carcinogenesis: Correlation between CpG methylation in the p53 promoter and the mutation of the p53 gene in the progression from ductal carcinoma in situ to invasive ductal carcinoma. Lab Invest. 2001;81:573-9
52. Neri F, Incarnato D, Krepelova A, Dettori D, Rapelli S, Maldotti M. et al. TET1 is controlled by pluripotency-associated factors in ESCs and downmodulated by PRC2 in differentiated cells and tissues. Nucleic Acids Res. 2015;43:6814-26
53. Wang L, Jin Q, Lee JE, Su IH, Ge K. Histone H3K27 methyltransferase Ezh2 represses Wnt genes to facilitate adipogenesis. Proc Natl Acad Sci U S A. 2010;107:7317-22
54. Tsai KW, Li GC, Chen CH, Yeh MH, Huang JS, Tseng HH. et al. Reduction of global 5-hydroxymethylcytosine is a poor prognostic factor in breast cancer patients, especially for an ER/PR-negative subtype. Breast Cancer Res Tr. 2015;153:219-34
55. Fuks F, Hurd PJ, Deplus R, Kouzarides T. The DNA methyltransferases associate with HP1 and the SUV39H1 histone methyltransferase. Nucleic Acids Res. 2003;31:2305-12
56. Lehnertz B, Ueda Y, Derijck AA, Braunschweig U, Perez-Burgos L, Kubicek S. et al. Suv39h-mediated histone H3 lysine 9 methylation directs DNA methylation to major satellite repeats at pericentric heterochromatin. Curr Biol. 2003;13:1192-200
57. Kastan MB, Onyekwere O, Sidransky D, Vogelstein B, Craig RW. Participation of p53 protein in the cellular response to DNA damage. Cancer Res. 1991;51:6304-11
58. Pei YF, Tao R, Li JF, Su LP, Yu BQ, Wu XY. et al. TET1 inhibits gastric cancer growth and metastasis by PTEN demethylation and re-expression. Oncotarget. 2016;7:31322-35
59. Delhommeau F, Dupont S, Della Valle V, James C, Trannoy S, Masse A. et al. Mutation in TET2 in myeloid cancers. N Engl J Med. 2009;360:2289-301
60. Couronne L, Bastard C, Bernard OA. TET2 and DNMT3A mutations in human T-cell lymphoma. N Engl J Med. 2012;366:95-6
61. Asmar F, Punj V, Christensen J, Pedersen MT, Pedersen A, Nielsen AB. et al. Genome-wide profiling identifies a DNA methylation signature that associates with TET2 mutations in diffuse large B-cell lymphoma. Haematologica. 2013;98:1912-20
62. Welch JS, Petti AA, Miller CA, Fronick CC, O'Laughlin M, Fulton RS. et al. TP53 and Decitabine in Acute Myeloid Leukemia and Myelodysplastic Syndromes. N Engl J Med. 2016;375:2023-36
63. Bracken AP, Kleine-Kohlbrecher D, Dietrich N, Pasini D, Gargiulo G, Beekman C. et al. The Polycomb group proteins bind throughout the INK4A-ARF locus and are disassociated in senescent cells. Genes Dev. 2007;21:525-30
64. Saramaki OR, Tammela TLJ, Martikainen PM, Vessella RL, Visakorpi T. The gene for polycomb group protein enhancer of zeste homolog 2 (EZH2) is amplified in late-stage prostate cancer. Gene Chromosome Canc. 2006;45:639-45
65. Yap DB, Chu J, Berg T, Schapira M, Cheng SWG, Moradian A. et al. Somatic mutations at EZH2 Y641 act dominantly through a mechanism of selectively altered PRC2 catalytic activity, to increase H3K27 trimethylation. Blood. 2011;117:2451-9
66. Gonzalez ME, Moore HM, Li X, Toy KA, Huang W, Sabel MS. et al. EZH2 expands breast stem cells through activation of NOTCH1 signaling. P Natl Acad Sci USA. 2014;111:3098-103
67. Mahara S, Lee PL, Feng M, Tergaonkar V, Chng WJ, Yu Q. HIFI-alpha activation underlies a functional switch in the paradoxical role of Ezh2/PRC2 in breast cancer. Proc Natl Acad Sci U S A. 2016;113:E3735-44
68. Hsu CH, Peng KL, Kang ML, Chen YR, Yang YC, Tsai CH. et al. TET1 suppresses cancer invasion by activating the tissue inhibitors of metalloproteinases. Cell Rep. 2012;2:568-79
69. Song SJ, Poliseno L, Song MS, Ala U, Webster K, Ng C. et al. MicroRNA-antagonism regulates breast cancer stemness and metastasis via TET-family-dependent chromatin remodeling. Cell. 2013;154:311-24
Author contact
![]() Corresponding authors: Clemens A. Schmitt, Charité - Universitätsmedizin Berlin, Virchow Campus, Augustenburger Platz 1, 13353 Berlin, Germany, Tel: +49-30-450553896, E-Mail: clemens.schmittde; and Ran Tao, Department of Hepatobiliary-Pancreatic Surgery, Affiliated Zhejiang Provincial People's Hospital, Hangzhou Medical School, 158 Shangtang Road, 310014 Hangzhou, China, Tel: +86-13301919116, Email: taohdac9com
Corresponding authors: Clemens A. Schmitt, Charité - Universitätsmedizin Berlin, Virchow Campus, Augustenburger Platz 1, 13353 Berlin, Germany, Tel: +49-30-450553896, E-Mail: clemens.schmittde; and Ran Tao, Department of Hepatobiliary-Pancreatic Surgery, Affiliated Zhejiang Provincial People's Hospital, Hangzhou Medical School, 158 Shangtang Road, 310014 Hangzhou, China, Tel: +86-13301919116, Email: taohdac9com