Theranostics
13.3
Impact Factor
- Current Issue
- Advance Articles
- Volume 16; 2026
- Volume 15; 2025
- Volume 14; 2024
- Volume 13; 2023
- Volume 12; 2022
- Archive
- Cover Images
- Cover Suggestion
- Special Issues
Top
Introduction
Materials and Methods
Results
Discussion
Conclusion
Abbreviations
Supplementary Material
Acknowledgements
References
Introduction
Materials and Methods
Results
Discussion
Conclusion
Abbreviations
Supplementary Material
Acknowledgements
References
International Journal of Biological Sciences
International Journal of Medical Sciences
 Global reach, higher impact

Theranostics 2019; 9(4):920-931. doi:10.7150/thno.30339 This issue Cite
Research Paper
Serum miR-626 and miR-5100 are Promising Prognosis Predictors for Oral Squamous Cell Carcinoma
Jianbo Shi*, Xin Bao*, Zengying Liu, Zhiyuan Zhang, Wantao Chen ![]() , Qin Xu
, Qin Xu ![]()
Department of Oral and Maxillofacial-Head Neck Oncology, Ninth People's Hospital, Shanghai Jiao Tong University School of Medicine, National Clinical Research Center for Oral Diseases, Shanghai Key Laboratory of Stomatology
*These authors contributed equally to this work.
Received 2018-10-1; Accepted 2019-1-2; Published 2019-1-25
Citation:
Shi J, Bao X, Liu Z, Zhang Z, Chen W, Xu Q. Serum miR-626 and miR-5100 are Promising Prognosis Predictors for Oral Squamous Cell Carcinoma. Theranostics 2019; 9(4):920-931. doi:10.7150/thno.30339. https://www.thno.org/v09p0920.htm
Other stylesAbstract

Although serum microRNAs (miRNAs) are currently being considered as promising noninvasive biomarkers for cancers, their role in the prognosis of oral squamous cell carcinoma (OSCC) has not been elucidated. Here we aimed to identify serum miRNA biomarkers that could be used as prognosis predictors of OSCC.
Methods: A cohort of 260 serum miRNA samples was assessed in a three-step approach that included a screening stage, a training stage, and a testing stage. The correlation between prognosis of OSCC and the miRNAs expression was comprehensively analyzed.
Results: A two-miRNA signature involving miR-626 and miR-5100 has been developed. Patients defined to be high-risk group by the two-miRNA signature had significantly shortened median survival time compared with the low-risk group. In multivariate analysis, this two-miRNA signature was independently predictive of survival, and achieved a superior predictive value compared with that of traditional clinicopathologic factors such as pathology grade as well as tumor and node metastasis (TNM) stage. An integrated prognostic model combining the TNM stage and miRNA signature displayed the highest prognostic performance (AUC value: 0.787, specificity: 0.884, sensitivity: 0.573) compared to the TNM stage-alone (AUC value: 0.630, specificity: 0.526, sensitivity: 0.733) or miRNA signature-alone model (AUC value: 0.771, specificity: 0.768, sensitivity: 0.773). In addition, we found that OSCC tumor cells not only expressed a high level of these two miRNAs, but also secreted certain miRNAs into the extracellular environment, suggesting these miRNAs may originate from tumor cells.
Conclusion: In our study, we established a two-miRNA signature that was strongly and independently associated with prognosis in OSCC, and may serve as a promising prognosis predictor.
Keywords: miRNA, serum, oral squamous cell carcinoma, prognosis
Introduction
Pharyngeal and oral cancers together rank the sixth most common malignancy worldwide [1]. OSCC is the major histopathological type of oral cancer. In spite of progress in diagnostic methods and therapies, OSCC continues to have a relatively unfavorable prognosis [2]. A significant challenge to personalized therapy for OSCC is to identify a reliable method for patient outcome assessment. Although traditional clinical staging and pathological grading are still important determinants of prognosis prediction, the prognostic value of these traditional clinicopathologic factors is plagued by inaccuracies [3]. New markers with higher accuracy are urgently needed to supplement classical prognostic parameters.
MiRNAs are small noncoding RNAs, which have been shown to have altered expression in various cancers [4]. Notably, miRNAs are extremely stable in the serum of patients, and associated with clinicopathologic variables and clinical outcomes [5, 6].
Although a few serum miRNAs were suggested as OSCC prognostic biomarkers, these studies had obvious limitations, such as studying too few miRNAs, using an inadequate inclusion or exclusion criteria, employing a small study population, or having no independent validation [7, 8].
In the present study, we analyzed serum specimens from a cohort of patients with OSCC and conducted an investigation to systematically identify serum miRNAs which could potentially serve for prognostic prediction of OSCC.
Materials and Methods
Participants and treatment regimen
In total, we collected 340 serum samples and 16 tissue specimens from 308 participants: 218 patients with OSCC and 90 healthy controls. 170 patients with histopathologically diagnosed of OSCC were prospectively enrolled at Ninth People's Hospital between 2010 and 2012 to develop the serum miRNA signatures. Disease-free survival (DFS) was considered to be the time from randomization to the first event of either death or recurrent disease. Overall survival (OS) was considered to be the time from randomization in the study to death from any cause. Tumor volume of each patient was estimated using the following formula: volume = (length × width × height)/2 based on initial diagnostic computed tomography (CT) scan data. Individuals with or without positive lymph nodes received a radical neck dissection or a supraomohyoid neck dissection, respectively. We also performed adjuvant chemoradiotherapy in individuals with pathological T4 tumors or lymph nodes positive. The source of serum miRNAs was subsequently investigated in another 48 patients. All participants were ethnic Han Chinese who were genetically unrelated. They were graded in line with the WHO 2017 grading system and staged using the UICC TNM staging criteria. Exclusion criteria included radiotherapy or chemotherapy before blood collection and self-reported previous cancer history.
We recruited healthy control individuals from the Medical Examination Center of Ninth People's Hospital. Each subject completed an investigator- administered questionnaire that covered details of ethnicity, drinking/smoking history and previous medical history. We used frequency-matching to balance controls to the OSCC patients by dividing ages into four age ranges: 31-45, 46-60, 61-75, and 76-90. Ninety controls were randomly assigned to each age group by frequency matching. Gender and drinking/smoking history frequency matching were achieved without further manipulation following age matching, because the gender distribution and drinking/smoking status among OSCC patients and control subjects were equal (Table 1).
Study design
Our study consisted of two parts (Figure 1). Part 1: Construction of a prognostic serum miRNA signature in OSCC using a three-step approach; i.e., a screening stage, training stage, and testing stage; Part 2: Identification of the source of these serum miRNAs.
The initial global miRNA screening included 25 patients and 15 healthy controls. Based on the microarray results, systematic evaluation of serum miRNAs was performed. To quantify miRNAs levels in the screening cohort, RT-qPCR was carried out. A predictive risk score was developed in an independent training cohort of 55 samples (40 patients and 15 healthy controls). Subsequently, in an additional independent testing cohort of 165 samples (105 patients and 60 healthy controls) and all-combined 260 individuals (Table 2), we assessed the performance of the candidate miRNAs.
Finally, in another independent set of 40 patients who underwent tumor resection, candidate miRNAs levels were examined in paired pre- and post-operative (day 5 post-surgery) serum samples. The secretory potential of miRNAs was examined using a new patient-derived-cell culture technology, conditionally reprogrammed cells (CRCs) [9], in 8 OSCC patients.
Our study was approved by the institutional review board of Shanghai Ninth People's Hospital. All participants gave written informed consent.
RNA extraction
Hemolysis of serum specimens was tested to remove samples that were potentially contaminated [10]. We routinely assessed the degree of overall RNA integrity to analyze RNA quality. Samples exhibiting a RNA integrity number (RIN) value greater than 7 were included in the analysis (Agilent 2100 Bioanalyzer). MiRNA was isolated from cultured cells, serum samples, and cultured media samples with a miRNeasy Mini Kit (Qiagen). A total of 200 μl of serum was used for each isolation. Due to no consensus on reference miRNAs for serum samples, a spiked-in synthetic ath-miR159a was added to samples as a reference control [11].
MiRNA microarray
An Exiqon's platform (version 19.0) was employed. GenePix Pro 6.0 software (Axon) was used to analyze array results. A median normalization procedure was applied to normalize the data. MiRNAs with low signal intensity; that is, less than 200 signal units, were excluded. The microarray data were deposited in the NCBI Gene Expression Omnibus database and can be accessed with the GEO Series accession number GSE113956.
Figure 1
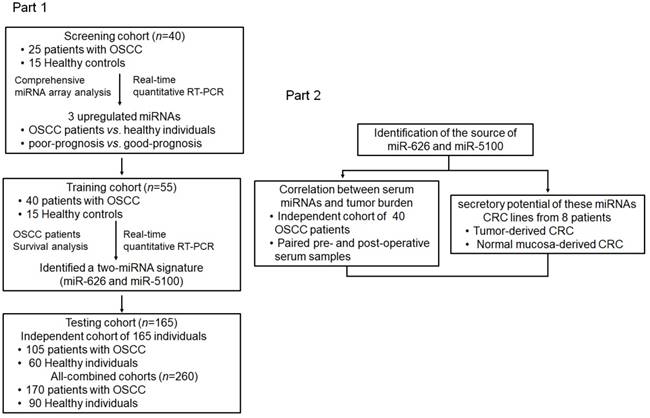
Schematic of study design.
Quantitative real-time PCR assay
Enriched small RNAs from serum, cultured cells and cultured media samples were reverse transcribed with a TaqMan MicroRNA Reverse Transcription Kit (Applied Biosystems). Expression of selected miRNAs, ath-miR159a (for normalization of serum and culture media samples), RNU6B (for normalization of cultured cells) was tested with TaqMan miRNA Assays (Applied Biosystems). The mean cycle threshold (CT) value for each sample was analyzed using the 2-∆∆CT method [6].
Patient-derived conditionally reprogrammed tumor cell and adjacent normal cell culture
Primary OSCC cells and paired adjacent normal epithelial cells were isolated from surgical specimens. CRC lines were established and co-cultured with irradiated 3T3 J2 fibroblasts as previously described [9].
Power calculations and statistical methods
G*Power 3 was used for power calculations that determined the necessary sample sizes in the testing cohort. The calculations were based on data from the training cohort [11]. Paired or unpaired Student's t tests were adopted to examine the statistical differences of miRNAs expression. A one-way ANOVA test was performed to assess differences in multiple comparison groups. A Fisher's exact test or Chi-squared test was used to compare clinical characteristics among groups. The correlation between miRNAs expression in tumor-derived CRC cells and matched culture medium, and the correlation between relatively reduced serum miRNA expression and tumor burden in patients with OSCC were assessed by Spearman's rank correlation test. Cluster 3.0 software (Stanford University) was used to perform hierarchical clustering. Kaplan-Meier (KM) method was employed to analyze patients' median survival time (MST), DFS and OS outcomes and the log-rank method was used to compare differences between groups. A risk-score was determined for each patient:
risk-score value
where  stands for the risk-score for miRNA y of patient x, and
 stands for the regression coefficient of miRNA y [12]. We utilized the median miRNA signature risk-score developed by DFS analysis from the training cohort as the cutoff point. Patients in both the independent testing and all-combined cohorts were also stratified into high-risk groups or low-risk groups using the same cutoff point. Prognosis prediction performance was evaluated by the area under the receiver operating characteristic (ROC) curve (AUC). The Youden's index was provided for the prognosis models [13]. Univariate and multivariate survival analysis were conducted with Cox regression model. An integrated prognostic model combining the TNM staging system and miRNA signature was constructed [14].
Statistical analysis was performed utilizing GraphPad Prism 6.0 software and SPSS 20.0 Statistics software. Results are displayed as the mean ± standard deviation (SD). P value < 0.05 was considered statistically significant.
Table 1
Clinicopathological features of all individuals involved in the development of miRNAs signature.
| All patients and Healthy controls (n=260) | |||||
|---|---|---|---|---|---|
| OSCC (n=170) | HC (n=90) | p-value* | |||
| Age (years) | |||||
| Mean ± SD | 61.81±11.71 | 59.42±10.82 | 0.110† | ||
| Gender | |||||
| Male | 99 (58.2%) | 50 (55.6%) | 0.678 | ||
| Female | 71 (41.8%) | 40 (44.4%) | |||
| Smoking | |||||
| Positive | 68 (40.0%) | 29 (32.2%) | 0.217 | ||
| Negative | 102 (60.0%) | 61 (67.8%) | |||
| Drinking | |||||
| Positive | 67 (39.4%) | 29 (32.2%) | 0.253 | ||
| Negative | 103 (60.6%) | 61 (67.8%) | |||
Mean ± standard deviation (SD) or n (%) were presented. †Student's t test. * Chi-squared test. HC: healthy controls; OSCC: oral squamous cell carcinoma.
Results
Serum miRNAs profiling and their associations with OSCC survival
Table 1 summarizes the clinicopathological features of all participants. In the screening stage, we compared serum miRNA profiling from OSCC (n= 25) and healthy individuals (n= 15) using microarray analysis. An expression heatmap showed that 202 serum miRNA (117 upregulated and 85 downregulated) levels were significantly different between patients and healthy individuals (fold change more than 3 times, P< 0.01), indicating a distinct serum miRNA profiling in OSCC patients (Figure S1). Because we were interested in the potential biomarkers in the clinical prognosis, we selected the 117 miRNAs that had increased expression in OSCC for further study. In an effort to define natural subgroups of OSCC, unsupervised clustering of the 117 miRNAs was conducted (Figure 2A). It was demonstrated that the samples were classified into two groups. This division did not simply reflect differences in age, gender, smoking/drinking habit, stage or grade since none of these clinical parameters was significantly related to the tumor groups (Figure 2 and Table 3). While, a significant difference in the survival rates was found between these two groups (79% in group 1, 17% in group 2, P = 0.0056), suggesting serum miRNA profiling could provide crucial prognostic information beyond that gathered by clinicopathological characteristics.
Table 2
Clinicopathological features of all patients with OSCC in three independent cohorts.
| Screening cohort | Training cohort | Testing cohort | P-value* | ||||
|---|---|---|---|---|---|---|---|
| (n=25) | (n=40) | (n=105) | |||||
| Age (years) | |||||||
| Mean ± SD | 63.28±10.20 | 63.10±9.63 | 60.96±12.74 | 0.492 † | |||
| Gender | |||||||
| Male | 13 (52.0%) | 22 (55.0%) | 64 (61.0%) | 0.641 | |||
| Female | 12 (48.0%) | 18 (45.0%) | 41 (39.0%) | ||||
| Smoking | |||||||
| Positive | 6 (24.0%) | 16 (40.0%) | 46 (43.8%) | 0.192 | |||
| Negative | 19 (76.0%) | 24 (60.0%) | 59 (56.2%) | ||||
| Drinking | |||||||
| Positive | 6 (24.0%) | 14 (35.0%) | 47 (44.8%) | 0.131 | |||
| Negative | 19 (76.0%) | 26 (65.0%) | 58 (55.2%) | ||||
| Pathological grade | |||||||
| pG1/pG2 | 17 (68.0%) | 26 (65.0%) | 61 (58.1%) | 0.561 | |||
| pG3 | 8 (32.0%) | 14 (35.0%) | 44 (41.9%) | ||||
| TNM stage | |||||||
| I | 5 (20.0%) | 4 (10.0%) | 16 (15.2%) | 0.919 | |||
| II | 6 (24.0%) | 10 (25.0%) | 30 (28.6%) | ||||
| III | 9 (36.0%) | 16 (40.0%) | 34 (32.4%) | ||||
| IV | 5 (20.0%) | 10 (25.0%) | 25 (23.8%) | ||||
| T stage | |||||||
| T1 | 7 (28.0%) | 11 (27.5%) | 22 (21.0%) | 0.796 | |||
| T2 | 8 (32.0%) | 16 (40.0%) | 39 (37.1%) | ||||
| T3 | 6 (24.0%) | 8 (20.0%) | 33 (31.4%) | ||||
| T4 | 4 (16.0%) | 5 (12.5%) | 11 (10.5%) | ||||
| N stage | |||||||
| N0 | 14 (56.0%) | 20 (50.0%) | 64 (61.0%) | 0.277 | |||
| N1 | 9 (36.0%) | 14 (35.0%) | 22 (21.0%) | ||||
| N2 | 2 (8.0%) | 6 (15.0%) | 19 (18.1%) | ||||
| Depth of invasion | |||||||
| DOI ≤ 5 mm | 7 (28.0%) | 20 (50.0%) | 56 (53.3%) | 0.157 | |||
| DOI > 5 and ≤10 mm | 10 (40.0%) | 13 (32.5%) | 34 (32.4%) | ||||
| DOI > 10 mm | 8 (32.0%) | 7 (17.5%) | 15 (14.3%) | ||||
| Extranodal extension | |||||||
| Positive | 7 (28.0%) | 11 (27.5%) | 27 (25.7%) | 0.960 | |||
| Negative | 18 (72.0%) | 29 (72.5%) | 78 (74.3%) | ||||
| Perineural invasion | |||||||
| Positive | 6 (24.0%) | 11 (27.5%) | 24 (22.9%) | 0.843 | |||
| Negative | 19 (76.0%) | 29 (72.5%) | 81 (77.1%) | ||||
| Vascular invasion | |||||||
| Positive | 6 (24.0%) | 9 (22.5%) | 23 (21.9%) | 0.974 | |||
| Negative | 19 (76.0%) | 31 (77.5%) | 82 (78.1%) | ||||
| Post-operative adjuvant treatment | |||||||
| Chemoradiotherapy | 13 (52.0%) | 22 (55.0%) | 45 (42.9%) | 0.368 | |||
| Negative | 12 (48.0%) | 18 (45.0%) | 60 (57.1%) | ||||
| Disease-free survival | |||||||
| Alive | 14 (56.0%) | 21 (52.5%) | 60 (57.1%) | 0.881 | |||
| Relapse or death | 11 (44.0%) | 19 (47.5%) | 45 (42.9%) | ||||
| Overall survival | |||||||
| Alive | 16 (64.0%) | 24 (60.0%) | 63 (60.0%) | 0.931 | |||
| Death | 9 (36.0%) | 16 (40.0%) | 42 (40.0%) | ||||
Mean ± standard deviation (SD) or n (%) were presented. † One Way ANOVA. * Chi-squared test. DOI: Depth of invasion; OSCC: oral squamous cell carcinoma.
Figure 2
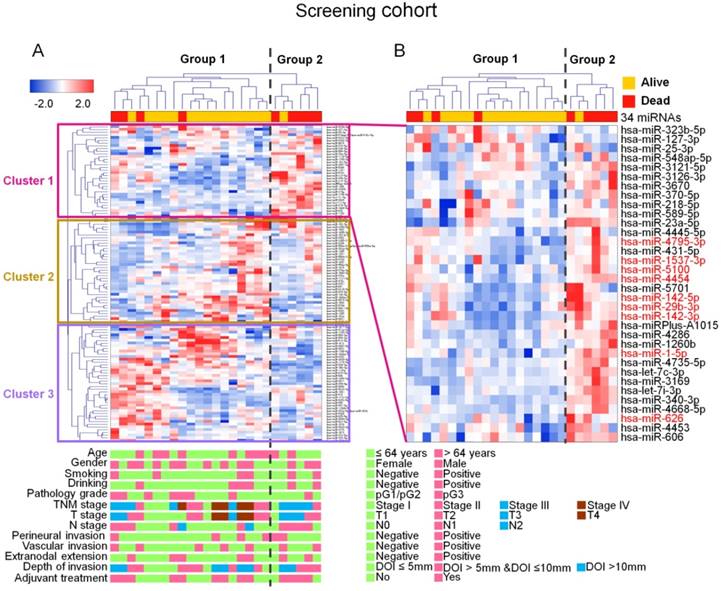
Identification of prognosis-related serum miRNAs in the screening cohort. (A), Unsupervised hierarchical cluster analysis identified two distinct groups in the screening cohort (OSCC patients, n= 25); rows stand for miRNAs, and columns stand for patients. Clinicopathological characteristics of each patient were indicated. Differences in survival rates were found between the two groups. Tree analysis revealed that segregation of these two subgroups was accompanied by the generation of three major miRNA clusters. (B), Serum levels of nine miRNAs (red color) were statistically higher in patients who died. (unpaired t test, P< 0.01). DOI: Depth of invasion.
Table 3
Clinicopathological features of patients in group 1 and group 2 in the screening stage.
| Screening set (n=25) | ||||
|---|---|---|---|---|
| Group 1 (n=19) | Group 2 (n=6) | P-value* | ||
| Age (years) | ||||
| Mean ± SD | 63.26±11.37 | 63.33±5.79 | 0.984 † | |
| Gender | ||||
| Male | 10 (52.6%) | 3 (50.0%) | 0.91 | |
| Female | 9 (47.4%) | 3 (50.0%) | ||
| Smoking | ||||
| Positive | 4 (21.1%) | 2 (33.3%) | 0.539 | |
| Negative | 15 (78.9%) | 4 (66.7%) | ||
| Drinking | ||||
| Positive | 4 (21.1%) | 2 (33.3%) | 0.539 | |
| Negative | 15 (78.9%) | 4 (66.7%) | ||
| Pathology grade | ||||
| pG1/pG2 | 12 (63.2%) | 5 (83.3%) | 0.356 | |
| pG3 | 7 (36.8%) | 1 (16.7%) | ||
| TNM | ||||
| I | 4 (21.1%) | 1 (16.7%) | 0.277 | |
| II | 5 (26.3%) | 1 (16.7%) | ||
| III | 5 (26.3%) | 4 (66.7%) | ||
| IV | 5 (26.3%) | 0 | ||
| T stage | ||||
| T1 | 6 (31.6%) | 1 (16.7%) | 0.278 | |
| T2 | 6 (31.6%) | 2 (33.3%) | ||
| T3 | 3 (15.7%) | 3 (50.0%) | ||
| T4 | 4 (21.1%) | 0 | ||
| N stage | ||||
| N0 | 12 (63.2%) | 2 (33.3%) | 0.181 | |
| N1 | 5 (26.3%) | 4 (66.7%) | ||
| N2 | 2 (10.5%) | 0 | ||
| Depth of invasion | ||||
| DOI ≤ 5 mm | 6 (31.6%) | 1 (16.7%) | 0.754 | |
| DOI > 5 and ≤10 mm | 7 (36.8%) | 3 (50.0%) | ||
| DOI > 10 mm | 6 (31.6%) | 2 (33.3%) | ||
| Extranodal extension | ||||
| Positive | 5 (26.3%) | 2 (33.3%) | 0.739 | |
| Negative | 14 (73.7%) | 4 (66.7%) | ||
| Perineural invasion | ||||
| Positive | 4 (21.1%) | 2 (33.3%) | 0.539 | |
| Negative | 15 (78.9%) | 4 (66.7%) | ||
| Vascular invasion | ||||
| Positive | 5 (26.3%) | 1 (16.7%) | 0.629 | |
| Negative | 14 (73.7%) | 5 (83.3%) | ||
| Post-operative adjuvant treatment | ||||
| Chemoradiotherapy | 9 (47.4%) | 4 (66.7%) | 0.409 | |
| Negative | 10 (52.6%) | 2 (33.3%) | ||
| Survival | ||||
| Alive | 15 (78.9%) | 1 (16.7%) | 0.0056 | |
| Dead | 4 (21.1%) | 5 (83.3%) | ||
Mean ± standard deviation (SD) or n (%) were presented. † Student's t test. * Chi-squared test. DOI: Depth of invasion.
Unsupervised hierarchical clustering showed the generation of three major miRNA clusters. Most of the miRNAs in clusters 2 and 3 were highly heterogeneous among patients, even within the same group. In contrast, a considerable number of miRNAs in cluster 1 (15 out of 34) were increased conformably in group 2, showing a possible negative correlation with the patient's prognosis. Furthermore, nine (miR-1-5p, miR-142-3p, miR-142-5p, miR-4454, miR-4795-3p, miR-29b-3p, miR-1537-3p, miR-626 and miR-5100) of the 15 miRNAs in cluster 1 significantly increased in the serum of patients who died during the follow-up period, compared with patients who survived (Figure 2B). RT-qPCR results further proved that, among the 9 miRNAs, miR-1537-3p, miR-626 and miR-5100 showed higher expression in patients who died compared to those who survived (Figure S2). Therefore, these three miRNAs were selected as potential prognostic biomarkers and were subjected to additional analysis.
Serum two-miRNA signature construction
The prognostic significance of the above mentioned 3 miRNAs was supported by RT-qPCR results in the training set containing 55 individuals (40 patients and 15 controls). The levels of the 3 tumor-specific serum miRNAs were all increased in patients than in healthy controls (Figure 3A and Figure S3A). Higher expression of miR-626 and miR-5100 was found in patients who died than in patients who survived, indicating that overexpression of these two miRNAs was mainly concentrated in patients with a poor prognosis (Figure 3B).
KM curves indicated that patients having elevated serum miR-626 and miR-5100 (above the median expression level), rather than miR-1537-3p, had significantly decreased DFS (miR-626, MST 37 months; miR-5100, MST 36 months) and OS (miR-626, MST 42 months; miR-5100, MST 42 months) compared with those with decreased levels (MST, not reached) (Figure 3C-D and Figure S3B). Therefore, miR-626 and miR-5100 were retained to construct the miRNA prognostic signature. In a combined analysis of these two miRNAs, we found that patients possessing high level of both miRNAs had remarkably decreased DFS (MST, 30 months) and OS (MST, 38 months) than patients carrying zero (MST, not reached) or only one high-risk miRNA (DFS: MST, 42 months; OS: MST, 49 months) (Figure 3E), indicating the two-miRNA signature exhibited greater prognostic performance than one-single-miRNA.
A univariate Cox regression analysis revealed that the expression of the two risk miRNAs was inversely related to DFS (Table 4). The regression coefficients were 0.258 and 0.269 for miR-626 and miR-5100, respectively. Risk-scores were calculated for patients in the training cohort. The median value (1.509) was served as the cutoff. Obvious shortened DFS time (MST, 30 months) and OS time (MST, 31 months) was observed in patients having higher risk-scores, comparing with those with lower risk-scores (MST, not reached) (Figure 3F). The two-miRNA signatures showed stronger survival prediction (AUC: 0.920, specificity: 0.810, sensitivity: 0.842) than individual miRNAs (Figure 3G).
Table 4
Univariate Cox regression analysis of the 3 candidate miRNAs expression related to DFS in the training cohort of 40 OSCC patients.
| microRNA | HR | 95% CI | Regression coefficient | P value |
|---|---|---|---|---|
| Serum miR-626 | 1.294 | 1.129 - 1.483 | 0.258 | 0.000211 |
| Serum miR-5100 | 1.308 | 1.136 - 1.506 | 0.269 | 0.000186 |
| Serum miR-1537-3p | 0.789 | 0.547 - 1.140 | -0.236 | 0.207 |
HR, hazard ratio; CI, confidence interval. DFS, disease free survival OSCC: oral squamous cell carcinoma. Significant associations are shown in bold (P < 0.05).
The prognostic performance of the signature was then validated in a testing set and in all-combined patients. Since the miR-5100 displayed the smallest effect size (d = 0.72) in the two candidate miRNAs, we performed a power calculation based on its data in the training cohort to determine the sample size needed for the testing cohort. A minimal size of 88 participants including 53 patients with good prognosis (above average survival time) and 35 patients with poor prognosis (below average survival time) was estimated to achieve 0.90 power. Finally, 105 patients (42 patients with poor prognosis, 63 patients with good prognosis) and 60 healthy controls were included.
Compared with patients who survived and healthy controls, serum miR-626 and miR-5100 were extremely elevated in patients who died, in both testing and all-combined cohorts (Figure S3C-D). High expression of these two serum miRNAs was significantly related to poor prognosis in both the testing (DFS: MST, miR-626, 24 months vs. not reached; miR-5100, 30 months vs. not reached; OS: MST, miR-626, 31 months vs. not reached; miR-5100, 35 months vs. not reached) and all-combined cohorts (DFS: MST, miR-626, 30 months vs. not reached; miR-5100, 30 months vs. not reached; OS: MST, miR-626, 38 months vs. not reached; miR-5100, 35 months vs. not reached), and two high-risk miRNAs showed greater performance than one-single-miRNA (Figure S4).
Figure 3
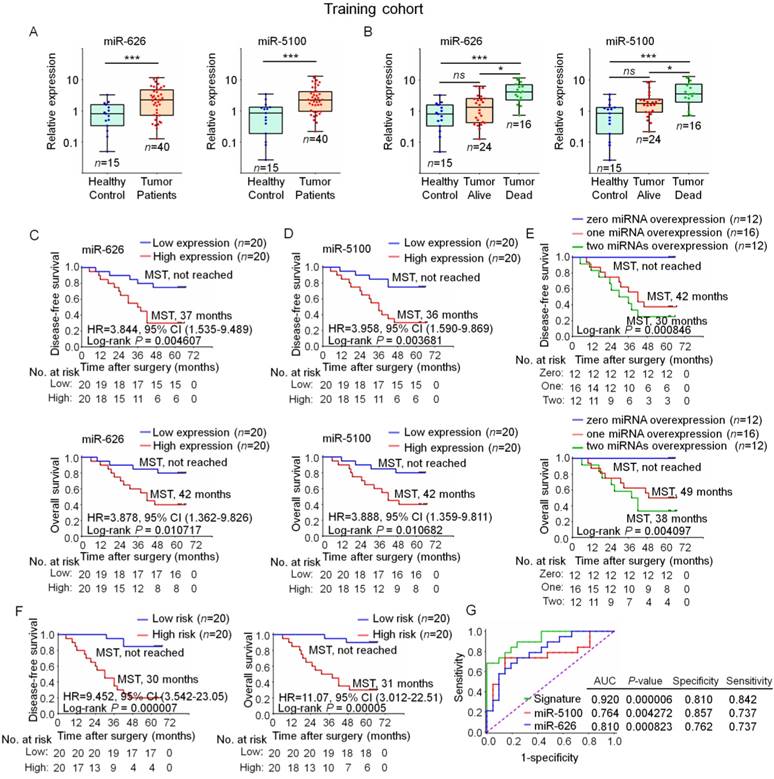
A two-miRNA signature developed in the training cohort. (A), A comparison of indicated serum miRNA levels in OSCC patients and healthy controls (unpaired t test, ns: not significant, ***P< 0.001). (B), A comparison of indicated serum miRNA levels in OSCC patients who died, OSCC patients who survived and healthy controls. (one-way ANOVA, *P< 0.05, ***P< 0.001) (OSCC patients, n= 40; healthy controls, n= 15). (C, D), Kaplan-Meier analysis of disease free survival (upper) and overall survival (below) indicated that patients having high expression of miR-626 (C) or miR-5100 (D) displayed significantly shortened MST. (E), Kaplan-Meier analysis of disease free survival (upper) and overall survival (below) showed that patients having high expression of both risk miRNAs displayed significantly decreased MST than those carrying zero or one risk miRNA. (disease free survival, P= 0.000846; overall survival, P= 0.004097). (F), Patients having higher risk-scores of the two-miRNA signature showed a shortened disease free survival (left) and overall survival (right). (disease free survival, P= 0.000007; overall survival, P= 0.00005). (G), The two-miRNA signature yielded better AUC value of 0.920 with 0.810 specificity and 0.842 sensitivity to predict survival of OSCC patient than one-single-miRNA. AUC: area under the receiver operating characteristic; CI: confidence interval; HR: hazard ratio; MST: median survival time; ns, no significant difference; OSCC, oral squamous cell carcinoma.
Risk scores were calculated, and the same cutoff derived from the training cohort was also used to define high-risk individuals (Figure 4A-C). As expected, a shortened survival time was observed in patients having higher risk-scores (DFS: testing cohort, MST 18 months, all-combined, MST 24 months; OS: testing cohort, MST 22 months; all-combined, MST 27 months) compared with those having lower risk-scores (DFS: MST all not reached; OS: MST all not reached) (Figure 4D-E). The two-miRNA signature yielded elevated AUC value (testing cohort, 0.802; all-combined, 0.847) in comparison to single miRNAs (miR-626: testing cohort, 0.731; all-combined, 0.757; miR-5100: testing cohort, 0.697; all-combined, 0.749), showing the best prognostic performance in all datasets (Figure 4F-G). The major cause of death in OSCC was recurrence. The close association between the miRNA signature and DFS prompts us to assess whether this miRNA signature could be useful to predict tumor recurrence. An increased recurrence rate was observed in high-risk patients (Table 5). Individually, miR-626 and miR-5100 showed good AUC scores (0.745 and 0.752, respectively). The two-miRNA signature showed better predictive value to discriminate patients with or without recurrence (AUC score, 0.841) (Figure 4H), indicating the miRNA signature has a good performance as a recurrence predictor. No significant difference in other clinicopathologic parameters was observed between high- or low-risk groups (Table 5).
Subsequently, a Cox regression analysis was executed in the all-combined group. By univariate Cox analysis, significant associations between DFS and pathology grade, serum miRNA signature, and TNM stage were observed. Multivariate analysis revealed that the association between this two-miRNA signature and survival was independent of other clinicopathologic variables (P < 0.001) (Table 6). Unsurprisingly, TNM staging was another independent prognostic factor, confirming this clinical feature as a well-recognized prognostic marker used in the clinic.
We next assessed whether integration of the miRNA signature with TNM stage could improve the prediction of outcomes. An integrated prognostic model combining the TNM stage and the two-miRNA signature was constructed. It was found that the prognosis prediction accuracy for the two-miRNA signature was superior to TNM stage, with a higher AUC value. The integrated model achieved the best prognostic performance (AUC value: 0.787, specificity: 0.884, sensitivity: 0.573), compared with the TNM stage alone model (AUC value: 0.630, specificity: 0.526, sensitivity: 0.733) or miRNA signature alone model (AUC value: 0.771, specificity: 0.768, sensitivity: 0.773) (Figure 4I). This suggested the two-miRNA signature might improve accuracy of classical prognostic parameters.
Figure 4
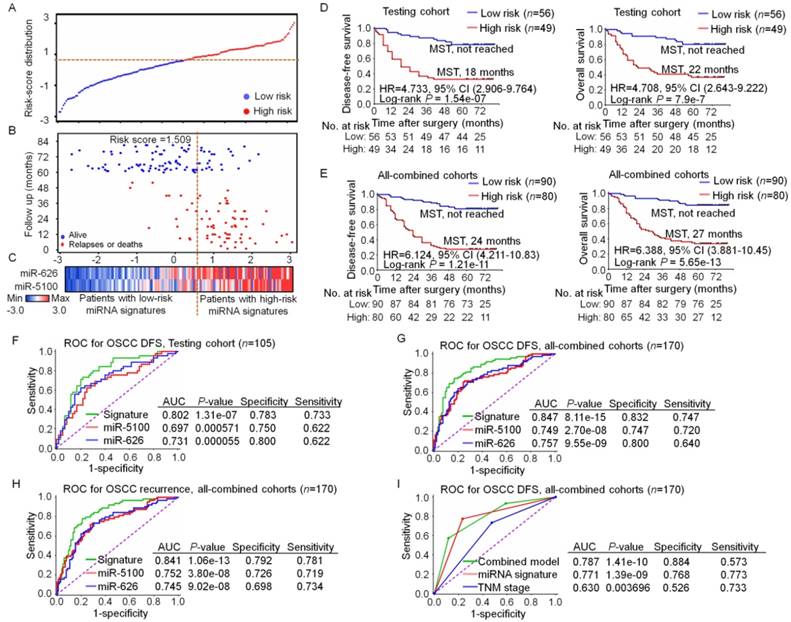
The two-miRNA signature was validated in independent cohorts. (A), Risk-scores distribution. The Y axis shows the index of risk scores. (B), Prognosis in patients. The dotted line refers to the median miRNA signature cutoff (1.509). (C), Color-gram of miRNA expression profiles; rows stand for miRNAs, and columns stand for patients. (D, E), Kaplan-Meier analysis indicated that high-risk patients in both the testing cohort (D) and all-combined cohorts (E) showed significantly shortened disease free survival (left) and overall survival (right). (P< 0.001). (F, G), Comparison of each single miRNA and the miRNA signature for DFS prediction in both the testing cohort (F) and all-combined cohorts (G). (H), Comparison of each single miRNA and the miRNA signature for recurrence prediction in all-combined cohorts. (I), Comparison of the miRNA signature alone, TNM staging system alone and an integrated model combining the TNM staging system and miRNA signature for DFS prediction. AUC: area under the receiver operating characteristic; CI: confidence interval; DFS: disease free survival; HR: hazard ratio; MST: median survival time; OSCC, oral squamous cell carcinoma; ROC: receiver operating characteristic.
Table 5
Clinical characteristics of low-risk and high-risk patients in the training, testing, and all-combined cohorts.
| Training cohort (n=40) | Testing cohort (n=105) | All-combined cohort (n=170) | ||||||||||||
|---|---|---|---|---|---|---|---|---|---|---|---|---|---|---|
| low-risk group | high-risk group | P-value* | low-risk group | high-risk group | P-value* | low-risk group | high-risk group | P-value* | ||||||
| (n=20) | (n=20) | (n=56) | (n=49) | (n=90) | (n=80) | |||||||||
| Age (years) | ||||||||||||||
| Mean ± SD | 62.15±8.98 | 64.05±10.39 | 0.54 † | 59.46±13.68 | 62.67±11.47 | 0.199 † | 60.68±12.31 | 63.08±10.95 | 0.184 † | |||||
| Gender | ||||||||||||||
| Male | 10 (50.0%) | 12 (60.0%) | 0.525 | 32 (57.1%) | 32 (65.3%) | 0.392 | 49 (54.4%) | 50 (62.5%) | 0.288 | |||||
| Female | 10 (50.0%) | 8 (40.0%) | 24 (42.9%) | 17 (34.7%) | 41 (45.6%) | 30 (37.5%) | ||||||||
| Smoking | ||||||||||||||
| Positive | 7 (35.0%) | 9 (45.0%) | 0.519 | 24 (42.9%) | 22 (44.9%) | 0.833 | 34 (37.8%) | 34 (42.5%) | 0.530 | |||||
| Negative | 13 (65.0%) | 11 (55.0%) | 32 (57.1%) | 27 (55.1%) | 56 (62.2%) | 46 (57.5%) | ||||||||
| Drinking | ||||||||||||||
| Positive | 6 (30.0%) | 8 (40.0%) | 0.507 | 24 (42.9%) | 23 (46.9%) | 0.675 | 34 (37.8%) | 33 (41.25%) | 0.644 | |||||
| Negative | 14 (70.0%) | 12 (60.0%) | 32 (57.1%) | 26 (53.1%) | 56 (62.2%) | 47 (58.75%) | ||||||||
| Pathological grade | ||||||||||||||
| pG1/pG2 | 15 (75.0%) | 11 (55.0%) | 0.185 | 35 (62.5%) | 26 (53.1%) | 0.328 | 60 (66.7%) | 44 (55.0%) | 0.119 | |||||
| pG3 | 5 (25.0%) | 9 (45.0%) | 21 (37.5%) | 23 (46.9%) | 30 (33.3%) | 36 (45.0%) | ||||||||
| TNM stage | ||||||||||||||
| I | 4 (20.0%) | 0 | 0.172 | 11 (19.6%) | 5 (10.2%) | 0.116 | 18 (20.0%) | 7 (8.75%) | 0.132 | |||||
| II | 5 (25.0%) | 5 (25.0%) | 19 (33.9%) | 11 (22.4%) | 26 (28.9%) | 20 (25.0%) | ||||||||
| III | 6 (30.0%) | 10 (50.0%) | 17 (30.4%) | 17 (34.7%) | 28 (31.1%) | 31 (38.75%) | ||||||||
| IV | 5 (25.0%) | 5 (25.0%) | 9 (16.1%) | 16 (32.7%) | 18 (20.0%) | 22 (27.5%) | ||||||||
| T stage | ||||||||||||||
| T1 | 8 (40.0%) | 3 (15.0%) | 0.193 | 14 (25.0%) | 8 (16.3%) | 0.121 | 26 (28.9%) | 14 (17.5%) | 0.215 | |||||
| T2 | 7 (35.0%) | 9 (45.0%) | 24 (42.9%) | 15 (30.6%) | 34 (37.8%) | 29 (36.25%) | ||||||||
| T3 | 2 (10.0%) | 6 (30.0%) | 15 (26.7%) | 18 (36.7%) | 20 (22.2%) | 27 (33.75%) | ||||||||
| T4 | 3 (15.0%) | 2 (10.0%) | 3 (5.4%) | 8 (16.3%) | 10 (11.1%) | 10 (12.5%) | ||||||||
| N stage | ||||||||||||||
| N0 | 11 (55.0%) | 9 (45.0%) | 0.784 | 38 (67.9%) | 26 (53.1%) | 0.102 | 57 (63.3%) | 41 (51.25%) | 0.144 | |||||
| N1 | 6 (30.0%) | 8 (40.0%) | 12 (21.4%) | 10 (20.4%) | 23 (25.6%) | 22 (27.5%) | ||||||||
| N2 | 3 (15.0%) | 3 (15.0%) | 6 (10.7%) | 13 (26.5%) | 10 (11.1%) | 17 (21.25%) | ||||||||
| Depth of invasion | ||||||||||||||
| DOI ≤ 5 mm | 13 (65.0%) | 7 (35.0%) | 0.145 | 32 (57.1%) | 24 (49.0%) | 0.689 | 49 (54.4%) | 34 (42.5%) | 0.209 | |||||
| DOI > 5 and ≤10 mm | 4 (20.0%) | 9 (45.0%) | 17 (30.4%) | 17 (34.7%) | 25 (27.8%) | 32 (40.0%) | ||||||||
| DOI > 10 mm | 3 (15.0%) | 4 (20.0%) | 7 (12.5%) | 8 (16.3%) | 16 (17.8%) | 14 (17.5%) | ||||||||
| Extranodal extension | ||||||||||||||
| Positive | 5 (25.0%) | 6 (30.0%) | 0.723 | 13 (23.2%) | 14 (28.6%) | 0.531 | 23 (25.6%) | 22 (27.5%) | 0.774 | |||||
| Negative | 15 (75.0%) | 14 (70.0%) | 43 (76.8%) | 35 (71.4%) | 67 (74.4%) | 58 (72.5%) | ||||||||
| Perineural invasion | ||||||||||||||
| Positive | 6 (30.0%) | 5 (25.0%) | 0.723 | 12 (21.4%) | 12 (24.5%) | 0.709 | 21 (23.3%) | 20 (25.0%) | 0.800 | |||||
| Negative | 14 (70.0%) | 15 (75.0%) | 44 (78.6%) | 37 (75.5%) | 69 (76.7%) | 60 (75.0%) | ||||||||
| Vascular invasion | ||||||||||||||
| Positive | 6 (30.0%) | 3 (15.0%) | 0.256 | 13 (23.2%) | 10 (20.4%) | 0.729 | 21 (23.3%) | 17 (21.25%) | 0.745 | |||||
| Negative | 14 (70.0%) | 17 (85.0%) | 43 (76.8%) | 39 (79.6%) | 69 (76.7%) | 63 (78.75%) | ||||||||
| Post-operative adjuvant treatment | ||||||||||||||
| Chemoradiotherapy | 10 (50.0%) | 12 (60.0%) | 0.525 | 20 (35.7%) | 25 (51.0%) | 0.158 | 38 (42.2%) | 42 (52.5%) | 0.180 | |||||
| Negative | 10 (50.0%) | 8 (40.0%) | 36 (64.3%) | 24 (49.0%) | 52 (57.8%) | 38 (47.5%) | ||||||||
| Disease-free survival | ||||||||||||||
| Relapses or deaths | 3 (15.0%) | 16 (80.0%) | 0.000039 | 12 (21.4%) | 33 (67.3%) | 0.000002 | 17 (18.9%) | 58 (72.5%) | 2.11e-12 | |||||
| Alive | 17 (85.0%) | 4 (20.0%) | 44 (78.6%) | 16 (32.7%) | 73 (81.1%) | 22 (27.5%) | ||||||||
| Overall survival | ||||||||||||||
| Deaths | 2 (10.0%) | 14 (70.0%) | 0.000108 | 11 (19.6%) | 31 (63.3%) | 0.000005 | 14 (15.6%) | 53 (66.25%) | 1.46e-11 | |||||
| Alive | 18 (90.0%) | 6 (30.0%) | 45 (80.4%) | 18 (36.7%) | 76 (84.4%) | 27 (33.75%) | ||||||||
| Post-operative recurrence | ||||||||||||||
| Positive | 3 (15.0%) | 13 (65.0%) | 0.001249 | 8 (14.3%) | 29 (59.2%) | 0.000002 | 13 (14.4%) | 51 (63.75%) | 3.52e-11 | |||||
| Negative | 17 (85.0%) | 7 (35.0%) | 48 (85.7%) | 20 (40.8%) | 77 ( 85.5%) | 29 (36.25%) | ||||||||
Mean ± standard deviation (SD) or n (%) were presented. †Student's t test. * Chi-squared test. HC: healthy controls; OSCC: oral squamous cell carcinoma. DOI: Depth of invasion.
Investigation of miR-626 and miR-5100 source in the serum
To determine whether these two risk serum miRNAs are of tumor origin, pre- and post-operative serum specimens were obtained from another 40 OSCC individuals. MiR-626 and miR-5100 expression was examined in these paired specimens. Both miRNAs were reduced in post-operative serum samples from the same individuals (Figure 5A). In addition, a positive correlation between the reduction of serum miRNA expression and tumor volume was observed (Figure 5B), suggesting these miRNAs may originate from tumor cells.
Next, we detected the miRNAs levels in matched normal and tumor cells and their culture media by employing CRC culture technology (Figure 5C). High levels of these two risk miRNAs were found in tumor-derived CRC lines and their culture media, compared with normal mucosa-derived CRC lines (n= 8) (Figure 5D). A positive correlation of the miRNAs level between tumor-derived CRC lines and their matched culture media samples was found (Figure 5E). Our results indicate that these risk miRNAs are overexpressed in tumor cells, and tumor cells can release endogenous miRNAs into the extracellular environment. Therefore, secretion by tumor cells might be the source of these tumor-associated serum miRNAs.
Discussion
Our study, for the first time, systematically demonstrated that a serum miRNA signature can serve to predict OSCC patient prognosis.
Several studies have shown that circulating miRNAs can remain stable under harsh conditions [15]. Moreover, accumulating evidence revealed the associations of certain circulating miRNAs with the clinical outcomes of cancer patients [16], indicating that serum miRNAs might be potential noninvasive biomarkers for cancers [17].
Table 6
Cox regression analysis for miRNA signature in all patients with OSCC.
| Regression coefficient | HR | 95%CI | P value | |
|---|---|---|---|---|
| Univariate analysis | ||||
| Age (> 64 vs. ≤ 64 years) | 0.316 | 1.372 | 0.871 - 2.160 | 0.172 |
| Gender (male vs. female) | 0.114 | 1.121 | 0.706 - 1.779 | 0.628 |
| Smoking (positive vs. negative) | 0.084 | 1.087 | 0.687 - 1.721 | 0.722 |
| Drinking (positive vs. negative) | 0.022 | 1.022 | 0.644 - 1.622 | 0.926 |
| Pathology grade (pG3 vs. pG1/pG2) | 0.569 | 1.767 | 1.123 - 2.780 | 0.014 |
| TNM stage (stage III-IV vs. stage I-II) | 0.865 | 2.375 | 1.422 - 3.968 | 0.00095 |
| Perineural invasion (positive vs. negative) | -0.076 | 0.927 | 0.540 - 1.592 | 0.784 |
| Vascular invasion (positive vs. negative) | 0.375 | 1.455 | 0.879 - 2.409 | 0.145 |
| Post-operative adjuvant treatment (Yes vs. No) | 0.298 | 1.348 | 0.856 - 2.120 | 0.197 |
| Serum miRNA signature (high- vs. low-risk) | 1.864 | 6.448 | 3.732 - 11.139 | 2.36e-11 |
| Multivariate analysis | ||||
| Pathology grade (pG3 vs. pG1/pG2) | 0.298 | 1.348 | 0.844 - 2.152 | 0.211 |
| TNM stage (stage III-IV vs. stage I-II) | 0.639 | 1.895 | 1.115 - 3.220 | 0.018 |
| Serum miRNA signature (high- vs. low-risk) | 1.791 | 5.996 | 3.458 - 10.396 | 1.80e-10 |
Multivariate analysis adjusted for age, gender, smoking, drinking, perineural invasion, vascular invasion, and post-operative adjuvant treatment. HR, hazard ratio; CI, confidence interval; OSCC: oral squamous cell carcinoma.
Figure 5
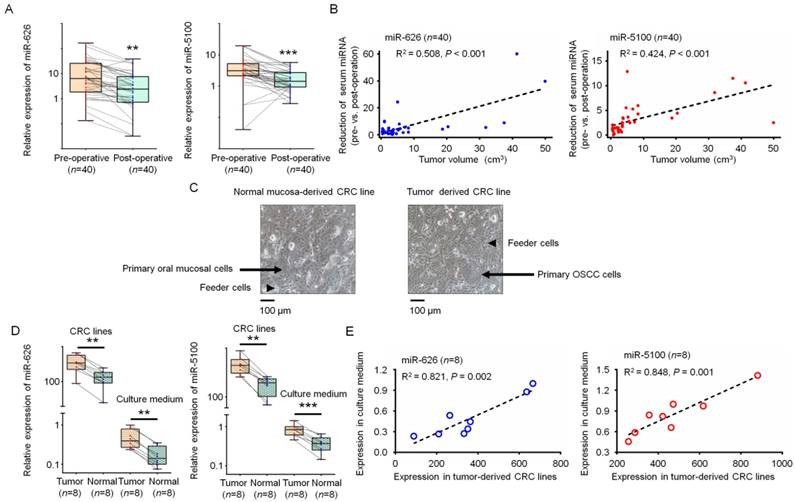
Identification of the source of these two-risk miRNAs. (A), Comparison of serum miR-626 (left) and miR-5100 (right) in paired pre-operative and post-operative samples (n= 40). (paired t test, **P< 0.01, ***P< 0.001). (B), Correlations between the reduction of serum miR-626 (left) and miR-5100 (right) expression and tumor volume. (Spearman's rank correlation test, n= 40, P< 0.001). (C), Morphology of primary oral mucosal epithelium cells (left) (indicated by arrow) and OSCC cells (right) (indicated by arrow) growing with irradiated 3T3 J2 fibroblasts (indicated by arrow head). Scale bar, 100 μm. (D), Comparison of the miR-626 (left) and miR-5100 (right) expression levels in tumor-derived CRC lines, normal mucosa-derived CRC lines and their culture media. (paired t test, n= 8, **P< 0.01, ***P< 0.001). (E), Correlation between miR-626 (left) (P= 0.002) and miR-5100 (right) (P= 0.001) levels in tumor-derived CRC lines and their matched culture media. (Spearman's rank correlation test, n= 8). CRC: conditionally reprogrammed cell; OSCC: oral squamous cell carcinoma.
Previous studies have reported that even one single specific circulating miRNA may assist to predict the clinical outcome of patients [18, 19], while profiles of a small number of miRNAs had greater performance to predict survival [6, 20, 21]. Some works has been done to develop the serum miRNAs-based biomarkers for OSCC diagnosis or prognosis. Unfortunately, those studies have had obvious limitations. For example, Xu and colleagues reported that serum miR-483-5p could be a prognostic marker for OSCC [7]. However, their conclusion was weakened by the small sample size. Summerer et al. showed that elevated plasma miR-142-3p, miR-186-5p and miR-195-5p, etc. were related to poor survival of head and neck carcinoma [22]. However, participants treated with radiochemotherapy were not excluded in that study, which may seriously interfere with miRNAs expression in serum. Therefore, the prognostic role of serum miRNAs in OSCC has not been convincingly demonstrated.
We recruited OSCC patients had never received radiochemotherapy and detected candidate miRNAs that could provide important information about unknown biological attributes and tumor characteristics. Clustering analysis and RT-qPCR evaluations confirmed that miR-626 and miR-5100 were extremely higher in serum from patients had died. A serum miRNA signature comprising these two miRNAs was constructed, followed by validation in independent cohorts. According to the miRNA signature, patients were stratified into high- or low-risk groups. A poorer survival and a higher likelihood of tumor relapse were found in high-risk patients. Our data clearly show that this two-miRNA signature can assist to predict prognosis in OSCC patients. As noted above, we used more stringent inclusion criteria than previous studies, which might be the reason that miRNAs we identified do not overlap with previously established miRNA signature in OSCC.
Recent evidence indicates that overexpression of miR-626 and miR-5100 contributes to human carcinogenesis in various cancers, including glioblastoma, hepatocellular carcinoma and lung cancer [23-26]. MiR-626 is significantly overexpressed in TCGA- HNSCC samples (Figure S5), and miR-5100 was reported to be a poor prognostic biomarker in both colon cancer and lung cancer [26, 27]. Further studies are required to fully illuminate their biological functions.
Our findings highlight that overexpression of these risk miRNAs in serum could be used as a prognostic marker for OSCC with a curative intent. Serum miRNAs can be measured constantly and noninvasively, providing a possibility for using our signature to guide individualized treatment. For example, in our study, adjuvant chemoradiotherapy showed no survival benefit. One plausible explanation for this finding may be the fact that, only 35% of high-risk patients received adjuvant treatments according to our model. Our data indirectly suggest that patients with high level of the two-miRNA signature are probably inadequately treated with the currently available adjuvant therapy. If confirmed by other studies, the two-miRNA signature can be applied to identify OSCC patients whose cancers should be treated more aggressively.
Currently, the origin of circulating miRNAs in cancer patients remains unclear [28]. Our study provided some interesting results that may help to determine the source of tumor-associated serum miRNAs. By comparing pre-operative and post-operative serum samples, a positive correlation between the reduction of serum miRNA expression and tumor burden was observed, implying that these serum miRNAs likely originated from cancer cells. To eliminate the interference of surgical trauma on the serum expression, CRC model was also applied to demonstrate whether tumor cells from OSCC patients can produce and secrete these risk miRNAs. We employed CRC because traditional established tumor cell lines are inadequate to mimic the true condition of patients' tumor cells. Although primary cultures of tumor cells can solve the above-mentioned problems, the success rate for establishment of primary cell lines is very low. Liu and colleagues recently reported CRC, a novel cell culture technology. By this way, patient-derived primary cells are easily established without genetic changes [9]. Compared with normal mucosa-derived CRC lines, both the miR-626 and miR-5100 expression levels were significantly elevated in tumor-derived CRC lines, indicating that tumor cells, but not normal cells, overexpressed these miRNAs. A positive correlation between the miRNAs expression in tumor-derived CRC lines and their culture media further shows that tumor cells could not only produce certain miRNAs but also secrete them into the extracellular environment. Our results, along with those from other groups [17, 29], support that the tumor-associated serum miRNAs might be dominantly derived from tumor cells.
Conclusion
Collectively, we carried out a systematic investigation to identify the potential prognostic role of serum miRNAs. A two-miRNA signature was found independently and strongly related to the prognosis for OSCC, which might act as a novel predictor of survival.
Abbreviations
AUC: area under the receiver operating characteristic; CI: confidence interval; CRC: conditionally reprogrammed cell; CT: cycle threshold; DFS: disease free survival; DOI: Depth of invasion; HC: healthy controls; HR: hazard ratio; KM: Kaplan-Meier; MST: median survival time; OS: overall survival; OSCC: oral squamous cell carcinoma; ROC: receiver operating characteristic; SD: standard deviation; TNM: tumor-node-metastasis; UICC: Union for International Cancer Control.
Supplementary Material
Supplementary figures.
Acknowledgements
This work was supported by project of Natural Science Foundation of China (Grant No. 81472518, 81772871), National Key R&D Program of China (2017YFC0840100, 2017YFC0840110, 2016YFC0902700). Interdisciplinary Program of Shanghai Jiao Tong University (YG2015MS05).
Competing Interests
The authors have declared that no competing interest exists.
References
1. Leemans CR, Braakhuis BJ, Brakenhoff RH. The molecular biology of head and neck cancer. Nat Rev Cancer. 2011;11:9-22
2. Yanamoto S, Yamada S, Takahashi H, Yoshitomi I, Kawasaki G, Ikeda H. et al. Clinicopathological risk factors for local recurrence in oral squamous cell carcinoma. Int J Oral Maxillofac Surg. 2012;41:1195-200
3. Dissanayaka WL, Pitiyage G, Kumarasiri PV, Liyanage RL, Dias KD, Tilakaratne WM. Clinical and histopathologic parameters in survival of oral squamous cell carcinoma. Oral Surg Oral Med Oral Pathol Oral Radiol. 2012;113:518-25
4. Hata A, Lieberman J. Dysregulation of microRNA biogenesis and gene silencing in cancer. Sci Signal. 2015;8:re3
5. Lin XJ, Chong Y, Guo ZW, Xie C, Yang XJ, Zhang Q. et al. A serum microRNA classifier for early detection of hepatocellular carcinoma: a multicentre, retrospective, longitudinal biomarker identification study with a nested case-control study. Lancet Oncol. 2015;16:804-15
6. Hu Z, Chen X, Zhao Y, Tian T, Jin G, Shu Y. et al. Serum microRNA signatures identified in a genome-wide serum microRNA expression profiling predict survival of non-small-cell lung cancer. J Clin Oncol. 2010;28:1721-6
7. Xu H, Yang Y, Zhao H, Yang X, Luo Y, Ren Y. et al. Serum miR-483-5p: a novel diagnostic and prognostic biomarker for patients with oral squamous cell carcinoma. Tumour Biol. 2016;37:447-53
8. Schneider A, Victoria B, Lopez YN. Tissue and serum microRNA profile of oral squamous cell carcinoma patients. Sci Rep. 2018;8:675
9. Liu X, Krawczyk E, Suprynowicz FA, Palechor-Ceron N, Yuan H, Dakic A. et al. Conditional reprogramming and long-term expansion of normal and tumor cells from human biospecimens. Nat Protoc. 2017;12:439-51
10. Sozzi G, Boeri M, Rossi M, Verri C, Suatoni P, Bravi F. et al. Clinical utility of a plasma-based miRNA signature classifier within computed tomography lung cancer screening: a correlative MILD trial study. J Clin Oncol. 2014;32:768-73
11. Yamada A, Horimatsu T, Okugawa Y, Nishida N, Honjo H, Ida H. et al. Serum miR-21, miR-29a, and miR-125b Are Promising Biomarkers for the Early Detection of Colorectal Neoplasia. Clin Cancer Res. 2015;21:4234-42
12. Kleivi Sahlberg K, Bottai G, Naume B, Burwinkel B, Calin GA, Borresen-Dale AL. et al. A serum microRNA signature predicts tumor relapse and survival in triple-negative breast cancer patients. Clin Cancer Res. 2015;21:1207-14
13. Boeri M, Verri C, Conte D, Roz L, Modena P, Facchinetti F. et al. MicroRNA signatures in tissues and plasma predict development and prognosis of computed tomography detected lung cancer. Proc Natl Acad Sci U S A. 2011;108:3713-8
14. Liu N, Chen NY, Cui RX, Li WF, Li Y, Wei RR. et al. Prognostic value of a microRNA signature in nasopharyngeal carcinoma: a microRNA expression analysis. Lancet Oncol. 2012;13:633-41
15. Turchinovich A, Weiz L, Langheinz A, Burwinkel B. Characterization of extracellular circulating microRNA. Nucleic Acids Res. 2011;39:7223-33
16. Lawrie CH, Gal S, Dunlop HM, Pushkaran B, Liggins AP, Pulford K. et al. Detection of elevated levels of tumour-associated microRNAs in serum of patients with diffuse large B-cell lymphoma. Br J Haematol. 2008;141:672-5
17. Schwarzenbach H, Nishida N, Calin GA, Pantel K. Clinical relevance of circulating cell-free microRNAs in cancer. Nat Rev Clin Oncol. 2014;11:145-56
18. Hur K, Toiyama Y, Schetter AJ, Okugawa Y, Harris CC, Boland CR. et al. Identification of a metastasis-specific MicroRNA signature in human colorectal cancer. J Natl Cancer Inst. 2015:107
19. Imaoka H, Toiyama Y, Fujikawa H, Hiro J, Saigusa S, Tanaka K. et al. Circulating microRNA-1290 as a novel diagnostic and prognostic biomarker in human colorectal cancer. Ann Oncol. 2016;27:1879-86
20. Torres A, Torres K, Pesci A, Ceccaroni M, Paszkowski T, Cassandrini P. et al. Diagnostic and prognostic significance of miRNA signatures in tissues and plasma of endometrioid endometrial carcinoma patients. Int J Cancer. 2013;132:1633-45
21. Berghmans T, Ameye L, Willems L, Paesmans M, Mascaux C, Lafitte JJ. et al. Identification of microRNA-based signatures for response and survival for non-small cell lung cancer treated with cisplatin-vinorelbine A ELCWP prospective study. Lung Cancer. 2013;82:340-5
22. Summerer I, Unger K, Braselmann H, Schuettrumpf L, Maihoefer C, Baumeister P. et al. Circulating microRNAs as prognostic therapy biomarkers in head and neck cancer patients. Br J Cancer. 2015;113:76-82
23. Dong L, Li Y, Han C, Wang X, She L, Zhang H. miRNA microarray reveals specific expression in the peripheral blood of glioblastoma patients. Int J Oncol. 2014;45:746-56
24. Sun X, Wang M, Liu H, Wang J. MicroRNA-423 enhances the invasiveness of hepatocellular carcinoma via regulation of BRMS1. Am J Transl Res. 2017;9:5576-84
25. Huang H, Jiang Y, Wang Y, Chen T, Yang L, He H. et al. miR-5100 promotes tumor growth in lung cancer by targeting Rab6. Cancer Lett. 2015;362:15-24
26. Wang T, Liu X, Tian Q, Liang T, Chang P. Increasing expression of miR-5100 in non-small-cell lung cancer and correlation with prognosis. Eur Rev Med Pharmacol Sci. 2017;21:3592-7
27. Jacob H, Stanisavljevic L, Storli KE, Hestetun KE, Dahl O, Myklebust MP. A four-microRNA classifier as a novel prognostic marker for tumor recurrence in stage II colon cancer. Sci Rep. 2018;8:6157
28. Ma R, Jiang T, Kang X. Circulating microRNAs in cancer: origin, function and application. J Exp Clin Cancer Res. 2012;31:38
29. Toiyama Y, Hur K, Tanaka K, Inoue Y, Kusunoki M, Boland CR. et al. Serum miR-200c is a novel prognostic and metastasis-predictive biomarker in patients with colorectal cancer. Ann Surg. 2014;259:735-43
Author contact
![]() Corresponding authors: Wantao Chen, Department of Oral and Maxillofacial-Head Neck Oncology, Ninth People's Hospital, Shanghai Jiao Tong University School of Medicine, Zhizaoju Road 639, Shanghai 200011, China. Tel: +86 21 23271699; E-mail: chenwantao2002com; Qin Xu, Department of Oral and Maxillofacial-Head Neck Oncology, Ninth People's Hospital, Shanghai Jiao Tong University School of Medicine, Zhizaoju Road 639, Shanghai 200011, China. Tel: +86 21 23271699; E-mail: xuqin_2004com
Corresponding authors: Wantao Chen, Department of Oral and Maxillofacial-Head Neck Oncology, Ninth People's Hospital, Shanghai Jiao Tong University School of Medicine, Zhizaoju Road 639, Shanghai 200011, China. Tel: +86 21 23271699; E-mail: chenwantao2002com; Qin Xu, Department of Oral and Maxillofacial-Head Neck Oncology, Ninth People's Hospital, Shanghai Jiao Tong University School of Medicine, Zhizaoju Road 639, Shanghai 200011, China. Tel: +86 21 23271699; E-mail: xuqin_2004com
Citation styles
APA
Shi, J., Bao, X., Liu, Z., Zhang, Z., Chen, W., Xu, Q. (2019). Serum miR-626 and miR-5100 are Promising Prognosis Predictors for Oral Squamous Cell Carcinoma. Theranostics, 9(4), 920-931. https://doi.org/10.7150/thno.30339.
ACS
Shi, J.; Bao, X.; Liu, Z.; Zhang, Z.; Chen, W.; Xu, Q. Serum miR-626 and miR-5100 are Promising Prognosis Predictors for Oral Squamous Cell Carcinoma. Theranostics 2019, 9 (4), 920-931. DOI: 10.7150/thno.30339.
NLM
Shi J, Bao X, Liu Z, Zhang Z, Chen W, Xu Q. Serum miR-626 and miR-5100 are Promising Prognosis Predictors for Oral Squamous Cell Carcinoma. Theranostics 2019; 9(4):920-931. doi:10.7150/thno.30339. https://www.thno.org/v09p0920.htm
CSE
Shi J, Bao X, Liu Z, Zhang Z, Chen W, Xu Q. 2019. Serum miR-626 and miR-5100 are Promising Prognosis Predictors for Oral Squamous Cell Carcinoma. Theranostics. 9(4):920-931.
This is an open access article distributed under the terms of the Creative Commons Attribution (CC BY-NC) license (https://creativecommons.org/licenses/by-nc/4.0/). See http://ivyspring.com/terms for full terms and conditions.