Theranostics
13.3
Impact Factor
- Current Issue
- Advance Articles
- Volume 16; 2026
- Volume 15; 2025
- Volume 14; 2024
- Volume 13; 2023
- Volume 12; 2022
- Archive
- Cover Images
- Cover Suggestion
- Special Issues
Top
Introduction
Materials and Methods
Results
Discussion
Conclusions
Acknowledgements
Supplementary Material
References
Introduction
Materials and Methods
Results
Discussion
Conclusions
Acknowledgements
Supplementary Material
References
International Journal of Biological Sciences
International Journal of Medical Sciences
 Global reach, higher impact

Theranostics 2019; 9(4):1096-1114. doi:10.7150/thno.29673 This issue Cite
Research Paper
Interaction between p53 and Ras signaling controls cisplatin resistance via HDAC4- and HIF-1α-mediated regulation of apoptosis and autophagy
Xiaofei Zhang1,2*, Zihao Qi1,2*, Huijing Yin1,2, Gong Yang1,2,3 ![]()
1. Cancer Institute, Fudan University Shanghai Cancer Center, Shanghai, 200032, China
2. Department of Oncology, Shanghai Medical College, Fudan University, Shanghai, 200032, China
3. Central Laboratory, the Fifth People's Hospital of Shanghai Fudan University, Shanghai, 200240, China
*These authors contributed equally to this work.
Received 2018-9-3; Accepted 2019-1-10; Published 2019-1-30
Citation:
Zhang X, Qi Z, Yin H, Yang G. Interaction between p53 and Ras signaling controls cisplatin resistance via HDAC4- and HIF-1α-mediated regulation of apoptosis and autophagy. Theranostics 2019; 9(4):1096-1114. doi:10.7150/thno.29673. https://www.thno.org/v09p1096.htm
Other stylesAbstract

The interplay between p53 and RAS signaling regulates cancer chemoresistance, but the detailed mechanism is unclear. In this study, we investigated the interactive effects of p53 and RAS on ovarian cancer cisplatin resistance to explore the potential therapeutic targets.
Methods: An inducible p53 and RAS mutants active in either MAPK/ERK (S35 and E38) or PI3K/AKT (C40) or both (V12) were sequentially introduced into a p53-null ovarian cancer cell line-SKOV3. Comparative microarray analysis was performed using Gene Chip Prime View Human Gene Expression arrays (Affymetrix). In vitro assays of autophagy and apoptosis and in vivo animal experiments were performed by p53 induction and/or cisplatin treatment using the established cell lines. The correlation between HDAC4 and HIF-1α or CREBZF and the association of HDAC4, HIF-1α, CREBZF, ERK, AKT, and p53 mRNA levels with patient survival in 523 serous ovarian cancer cases from TCGA was assessed.
Results: We show that p53 and RAS mutants differentially control cellular apoptosis and autophagy to inhibit or to promote chemoresistance through dysregulation of Bax, Bcl2, ATG3, and ATG12. ERK and AKT active RAS mutants are mutually suppressive to confer or to deprive cisplatin resistance. Further studies demonstrate that p53 induces HIF-1α degradation and HDAC4 cytoplasmic translocation and phosphorylation. S35, E38, and V12 but not C40 promote HDAC4 phosphorylation and its cytoplasmic translocation along with HIF-1α. Wild-type p53 expression in RAS mutant cells enhances HIF-1α turnover in ovarian and lung cancer cells. Autophagy and anti-apoptotic processes can be promoted by the overexpression and cytoplasmic translocation of HDAC4 and HIF1-α. Moreover, the phosphorylation and cytoplasmic translocation of HDAC4 activate the transcription factor CREBZF to promote ATG3 transcription. High HDAC4 or CREBZF expression predicted poor overall survival (OS) and/or progression-free survival (PFS) in ovarian cancer patients, whereas high HIF-1α expression was statistically correlated with poor or good OS depending on p53 status.
Conclusion: HIF-1α and HDAC4 may mediate the interaction between p53 and RAS signaling to actively control ovarian cancer cisplatin resistance through dysregulation of apoptosis and autophagy. Targeting HDAC4, HIF-1α and CREBZF may be considered in treatment of ovarian cancer with p53 and RAS mutations.
Keywords: p53, Ras, HDAC4, HIF-1α, CREBZF, Cisplatin resistance
Introduction
Ovarian cancer is the most lethal malignancy in gynecological oncology owing to the lack of early diagnosis and high chemoresistance [1]. Therefore, understanding the resistant mechanism to chemotherapeutic agents is an effective way to eventually improve ovarian cancer treatment efficacy. The tumor suppressor p53, which is a dominant force in promoting cell apoptosis, cell cycle arrest, DNA repair, and senescence in multiple cancer types, is typically mutated in serous ovarian cancer [2], and is associated with ovarian cancer chemoresistance [3]. Reles et al. reported that p53 alterations were significantly correlated with platinum-based chemoresistance [4]. Although p53 mutations may lead to either loss of the tumor suppression function or gain of a tumor promotion function, it remains challenging to properly define the exact tumor promoting role of a single mutation/mutant because each mutation may contribute differently to cancer initiation and/or development, while mutations leading to loss of tumor suppression function seem easy to be conducted. On the other hand, although a high frequency of p53 mutation is observed in ovarian cancer cases, the failure of early preclinical trials in which a wild-type p53 was introduced into ovarian cancer patients with p53 mutations indicates that other signaling molecules may be involved with the mutant p53 functions [5]. Thus, to precisely illustrate the role of mutant p53, we must coordinately consider other molecules, including oncogenic proteins, such as RAS.
The RAS family includes H-RAS, N-RAS, and K-RAS, which have all been implicated in multiple cancer types. RAS mutations in codons 12, 13, and 61 have been identified as the most activated forms inducing cell malignancy [6]. The major signaling pathways involved in RAS activation are the PI3K/AKT and MAPK signaling pathways [7, 8]. Although K-RAS mutations in human ovarian cancer are observed in less than 5% of cases, amplification and activation of RAS signaling molecules, including PI3K/AKT and/or MAPK, in ovarian cancer are commonly observed [9, 10] and are reported to mediate ovarian cancer chemoresistance [11, 12]. However, studies have shown that PI3K/AKT and MAPK signaling pathways can be either mutually suppressive [13], supportive [14] or independent [15]. Therefore, targeted therapies against both or either pathway may need to consider the specific signaling context, particularly the presence or absence of p53 mutation, and the interactive mechanism between p53 and MAPK or PI3K/AKT should be first clearly examined.
In the current study, we transfected p53-null ovarian cancer cells with an inducible p53 construct and different RAS mutants, including V12, S35, E38 and C40, with both or either activation of PK3K/AKT and/or MAPK, and found that p53 and RAS were mutually suppressed to modulate cell autophagy, apoptosis and resistance of cancer cells to cisplatin-induced apoptosis. Further assays demonstrated that HDAC4 and HIF-1α are two major molecules that might mediate p53 and RAS/MAPK signaling to promote cancer cell cisplatin resistance through modulation of autophagy and apoptosis.
Materials and Methods
Cell lines and cell culture
The ovarian cancer cell lines SKOV3 (p53Null/KRASWt), A2780 (p53Wt/KRASWt), and HEY-A8 (p53Wt/KRASG12D) [16] were either purchased from the American Type Culture Collection (ATCC) or maintained in our laboratory with Roswell Park Memorial Institute (RPMI) 1640 medium (Solarbio Life Sciences, Shanghai). The lung cancer cell lines A549 (p53Wt/KRASMt), H358(p53Null/KRASMt), H23 (p53Mt/KRASMt) and H1299 (p53Null/KRASWt) [17, 18]; the retroviral packaging cells (Phoenix amphotropic cells); and the lentiviral packaging cells (293 T cells) were also purchased from ATCC and were maintained in Dulbecco's modified Eagle's medium (DMEM; HyClone). All cell media were supplemented with 10% fetal bovine serum, 2 mM L-glutamine, penicillin (100 units/ml) and streptomycin (100 μg/ml), and cells were cultured in a humidified incubator at 37°C with 5% CO2.
Plasmid construction, cell transfection and viral infection
SKOV3-p53 tet on cells (SKOV3T) expressing the p53-tet on system were constructed following the Lenti-XTM Tet-On Advanced Inducible Expression System user manual (Clontech 632162). The resulting cells were selected with neomycin (500 μg/ml) and hygromycin (2 μg/ml) for 7-14 days. To establish SKOV3T cell lines expressing HRAS-V12, HRAS-S35, HRAS-E38, or HRAS-C40, various full-length RAS mutant cDNAs were amplified from previously established plasmids in our lab using the primers 5′- CGCggatccATGACCGAATACAAGCTTGTTG -3′ (forward; lower case letters represent the BamHI site) and 5′-TGATctcgagTCAatggtgatggtgatgatgGGAGAGCACACACTTGCAGCTCA-3′ (reverse; italic lower case letters represent the XhoI site; bold lower case letters indicate the His tag), digested with BamHI and XhoI, and inserted into the retrovirus vector pBabe-puromycin. The correct plasmids were confirmed by sequencing. Retroviruses were generated to infect target cells as described previously [19]. To overexpress HDAC4 and HIF-1α, full-length wide-type HDAC4 or HIF-1α was amplified from a cDNA library of SKOV3 cells using the primers 5′-GCACAtctagaATGAGCTCCCAAAGCCATCCAGATG-3′ (forward; lower case letters indicate the XbaI site) and 5′-GAATgaattcCTAagcgtaatctggaacatcgtatgggtaCAGGGGCGGCTCCTCTTCC-3′ (reverse; italic lower case letters represent the EcoRI site, and bold lower case letters indicate the HA tag) or 5′-ATATAtctagaATGGAGGGCGCCGGCGGCGCGAAC-3′ (forward; lower case letters show the XbaI site) and 5′-GCGCggattcTCA atggtgatggtgatgatgGTTAACTTGATCCAAAGC-3′ (reverse; italic lower case letters represent the BamHI site, and bold lower case letters indicate the His tag). The PCR products were digested with the appropriate restriction enzymes and then cloned into PCDH-CMV-MCS-EF1-ZEOCIN. The pCDH/Zeocin or pBabe-puromycin empty vector was used as a control vector. SKOV3T cells and RAS mutant C40 cells were infected with HDAC4 or HIF-1α cDNA viruses to generate SKOV3T/HDAC4, SKOV3T/C40/HDAC4 and SKOV3T/C40/HIF-1α cells as described previously [20]. The resulting cells were selected with puromycin (2 μg/ml) or zeocin (100 μg/ml) for 7-14 days.
The PLKO.1/Zeocin empty vector was constructed by replacing the puromycin resistance gene cDNA with the zeocin resistance gene cDNA using the following primers: 5′-catatggatccATGGCCAAGTTGACCAGTGCCG-3′ (forward) and 5′-cataatggtaccTCAGTCCTGCTCCTCGGCCACG-3′ (reverse). To silence HDAC4 and HIF-1α expression, DNA oligonucleotides were designed to generate shRNAs against the open reading frame of HDAC4 mRNA (5′-GAATCTGAACCACTGCATTTC-3′ at 216 nt, 5′-GCCAAAGATGACTTCCCTCTT-3′ at 352 nt, 5′-CGACTCATCTTGTAGCTTATT-3′ at 3,716 nt) and the open reading frame of HIF-1α mRNA (5′-CCGCTGGAGACACAATCATAT-3′ at 1,208 nt, 5′-GTGATGAAAGAATTACCGAAT-3′ at 764 nt, and 5′-TGCTCTTTGTGGTTGGATCTA-3′ at the 3′UTR). The shRNAs/DNA oligos were cloned into a pLKO.1 TRC Zeocin Cloning Vector (Addgene) according to the manufacturer's protocol. The PLKO.1/Zeocin scrambled shRNA vector was used as a control vector [19]. Cell transfection and viral infection were performed using the above methods. The resulting cells were selected with zeocin (100 μg/ml) for 7-14 days. The shRNA with the greatest gene-silencing effect was selected by western blotting analysis of the cell lines infected with the different shRNAs.
The constructed cell lines included SKOV3T, SKOV3T/V12, SKOV3T/ S35, SKOV3T/ E38, SKOV3T/ C40, SKOV3T/Vec, SKOV3T/HD, SKOV3T/Scr, SKOV3T/V12/Scr, SKOV3T/S35/Scr, SKOV3T/C40/Vec, SKOV3T/shHD, SKOV3T/V12/shHD, SKOV3T/S35/shHD, SKOV3T/C40/HD, SKOV3T/shHIF, SKOV3T/V12/shHIF, SKOV3T/S35-shHIF, and SKOV3T/C40-HIF.
SiRNAs for CREBZF and a negative control (NC) were purchased from GenePharma (Shanghai, China) and were used to transfect SKOV3T/V12 cells using Hieff TransTM Liposomal Transfection Reagent (YEASEN, Shanghai, China) according to the manufacturer's instructions.
SiRNAs for ERK1/2 (sc-29307/ sc-35335) and AKT1/2 (sc-43609) and a control siRNA (sc-37007) were purchased from Santa Cruz Biotech and transfected into SKOV3T/V12 cells according to the manufacturer's protocols.
Cell treatments
Doxycycline (DOX; Sangon Biotech) was prepared in PBS at a stock concentration of 10 mg/ml. Cells were incubated with 1 μg/ml DOX for 0, 6, 12, 24, and 48 hours, and then, the samples were collected for western blot (WB). To exclude the potential effects of DOX on cytotoxicity, DOX was used at the same concentration to treat parental SKOV3 and vector control SKOV3-Vec cells for 48 hours. All cells were harvested for different tests after treatment.
Cells treated with either the ERK inhibitor SCH772984 (2 μM Selleck) or AKT inhibitor GSK2110183 (10 nM; MedChem Express) for 8 hours were also used for western blot (WB). To inhibit the activation of HDAC4, the HDACs inhibitor Quisinostat (100nM, MedChem Express) was applied to cells for 24 hours. DMSO-treated cells were used as controls. Cells were treated with chloroquine (25 μM; Sangon Biotech) for 20 hours to compromise autophagic degradation. The IC50 values for cisplatin were determined with an MTT assay at concentrations ranging from 0.0256 μM-10,000 μM. To mimic a hypoxic environment, 100 μM cobalt dichloride (Sigma) was used to treat cells for 6 hours.
Colony formation assay
Five hundred cells were seeded in six-well plates at a single-cell density. A blank group and DOX groups treated with or without 1 μg/ml of DOX were prepared for each cell type. Fresh medium was added every 3 days to allow cell growth. Colonies were stained with gentian violet (Solarbio) at 2-3 weeks and colonies with more than 50 cells were counted in each well. The assays were repeated three times.
Western blot analysis
Approximately 30 μg of protein in cell lysates obtained using RIPA lysis buffer was analyzed using standard western blotting procedures [21].The information of the used primary antibodies was listed in Supplementary Table 1 (STable 1). The secondary antibodies against rabbit (#7074) or mouse IgG (#7076) conjugated with HRP were from Cell Signaling Technology (Massachusetts, USA).
Immunofluorescence and Apoptosis detection
Immunofluorescence (IF) staining was performed as described previously [22]. For double staining, the samples were incubated in a mixture of two primary and then secondary antibodies. The primary antibody information was listed in Supplementary Table 1. DAPI-Fluoromount-G was purchased from Southern Biotech. The secondary antibodies included Alexa Fluor 594 AffiniPure donkey anti-rabbit IgG (red), Alexa Fluor 488 AffiniPure donkey anti-goat IgG (green), Alexa Fluor 488 AffiniPure donkey anti-rabbit IgG (green), Alexa Fluor 594 AffiniPure donkey anti-mouse IgG (red) and Alexa Fluor 488 AffiniPure donkey anti-mouse IgG (green) (Jackson ImmunoResearch). All stained cells were examined and photographed using a Leica SP5 confocal fluorescence microscope.
Cell apoptosis was assessed as previously described [23].
MTT cytotoxicity assay
The in vitro cytotoxicity of cisplatin was examined using the standard MTT (Sigma Aldrich) assay procedure [24]. Briefly, 10,000 cells were seeded in 96-well plates, and each cell type was separated into blank and DOX groups that were treated with diluents or with 1 μg/ml DOX for 24 hours. The cells were then treated with different cisplatin concentrations for 48 hours. The medium containing cisplatin was replaced with MTT (0.5 mg/ml; 200 μl/well), followed by incubation for 4 hours. The medium was then discarded, and 150 μl of DMSO was added to each well. The absorbance value was detected with a microplate reader (BioTek) at a wavelength of 490 nm. The survival ratio was calculated using the following formula: Survival ratio = (ODcisplatin-ODblank)/(ODDMSO-ODblank). The IC50 was calculated using GraphPad Prism.
Real-time fluorescence quantitative polymerase chain reaction
Total RNA was isolated with TRIzol reagent (Invitrogen), and all RNAs were reversely transcribed into cDNA using an Exscript RT-PCR kit (TaKaRa) following the manufacturer's instructions. The oligonucleotide primer pairs were as follows: 5'-ACGACCTGACCGCCATTTG-3' (forward) and 5'-CATGGAACGGACAGCGTTTG-3' (reverse) for HDAC4; 5'-CTCATCAGTTGCCACTTCCACATA-3' (forward) and 5'-AGCAATTCATCTGTGCTTTCATGTC-3' (reverse) for HIF-1α. All amplifications and detections were performed using an Applied Biosystems Prism 7900 system (Applied Biosystems, Foster City, CA), an ExScriptSybr green QPCR kit (TaKaRa) and the following program: 1 cycle of 30 sec at 95°C followed by 40 cycles of 5 sec at 95°C and 20 sec at 60°C. Statistical analyses were performed using the 2-△△CT relative quantification method. The assay was repeated three times in triplicate.
Gene expression profiling, data processing, and further analyses
Comparative microarray analysis of cell mRNAs treated with diluents or DOX was performed using GeneChip®PrimeView™ Human Gene Expression arrays (Affymetrix) provided by Shanghai Biotechnology Corporation (Shanghai, China). Differential gene expression was determined using the limma statistical package (http://www.bioconductor.org). Genes were selected as differentially expressed based on the specific change call and fold change (FC) criteria. Changes with a P-value < 0.05 and FC limit > 1.5 or < 1.5 were calculated for the mean FC to select differentially expressed genes. Spearman correlation was used to analyze the relationship between HDAC4 and HIF-1α or CREBZF mRNA levels.
Co-immunoprecipitation and protein acetylation detection
The interaction of HDAC4 and HIF-1α was examined using the standard co-immunoprecipitation (co-IP) protocol [25]. Concisely, the cells were harvested with cell scrapers and pelleted by centrifugation at 1,500 × g for 5 minutes at 4°C. Ice-old lysis buffer was added to the cell pellet, followed by incubation for 30 minutes on ice with vigorous vortexing every 10 minutes. The samples were then centrifuged at 15,000 × g for 15 minutes at 4°C. The supernatant was transferred to a new tube and was added into 100 μl of protein A/G agarose (Santa Cruz Biotech) and then shaken gently for 10 minutes at 4°C. The samples were centrifuged at 3,000 × g for 15 minutes at 4°C. The IP antibody was added into the supernatant and then incubated overnight at 4°C on a tube rotator. The samples were centrifuged at 3,000 × g for 5 minutes at 4°C, and the supernatant was removed. The pelleted resin was resuspended in 1 ml of ice-old washing buffer and incubated for 20 minutes at 4°C on the tube rotator. The samples were centrifuged at 3,000 × g for 5 minutes at 4°C, and the supernatant was removed again. The washing steps were repeated 3 times. The resin-bound immune complexes were resuspended in 60 μl of 2 × Laemmli buffer and then boiled for 5 minutes. The samples were centrifuged at 3,000 × g for 5 minutes, and then, the supernatant was transferred to a new tube for immunoblotting analysis.
To detect acetylation of proteins, cell lysates were obtained and immunoprecipitated with acetylated-lysine antibody (cs-9681), followed by immunoblotting with antibodies against Atg3, Atg12 and CREBZF.
Nuclear and cytoplasmic protein extraction
To isolate nuclear proteins from the cytoplasm, the cell pellets were treated according to the instructions of a nuclear and cytoplasmic protein extraction kit (Beyotime Biotechnology). The extracted proteins were assessed by western blotting. GAPDH (Cell Signaling Inc.) and Histone-H3 (Proteintech) were used as loading controls for cytosolic and nuclear proteins, respectively.
Dual Luciferase Assays
The Atg3 promoter (-2000 to -1) was amplified using normal human DNA as a template and cloned into the pGL3-Basic (Promega, US) using the primers 5′-GGggtacc TGTTGATACAATATGACCGCACAA -3′ (forward; lower case letters represent the KpnI site) and 5′-GTActcgagGACTCTCCCGGCACGTGA-3′ (reverse; lower case letters represent the XhoI site). Cells (SKOV3T or SKOV3T/V12) were seeded in the 6-well plates and cultured for 24 hours, and treated by the HDACs inhibitor Quisinostat or DMSO for 24 hours. Then cells were transfected with Atg3 reporter plasmid and a pRL-TK internal control. At 48 h after transfection, the luciferase activity was measured using the Dual-Glo® Luciferase Assay System (Promega, USA) detected by a SynergyHT Multi-Mode Microplate Reader (BioTek, US). Site-specific mutagenesis assays were performed by Mut Express® II Fast Mutagenesis Kit (c212) (Vazyme, CHN). Mutated primers was designed by the guidance of kit as follows: PF 5′-ATCTGATTGACgtcCATTTCAT -3′ and PR 5′-TGATGAAATGgacGTCAATCAGAT -3′ (lower case letters represent the mutated sites).
Animal assays
All the animal experiments were approved by the Institutional Animal Care and Use Committee of Fudan University. Four- to five-week-old female BALB/c nude mice (Slac Shanghai Company) were housed in a specific pathogen-free facility at the Department of Laboratory Animals, Fudan University. The mice were subcutaneously injected bilaterally with 5×10⁶ cells of each cell line. The tumor volume was calculated using the following formula: tumor volume (mm3) = L×W2 ×0.52 [26], where L indicates the length, W indicates the width, and 0.52 is a constant to calculate the ellipsoid volume. When the average tumor volume reached 100 mm3, the mice were randomly divided into four groups. The DOX group was injected intratumorally with DOX (0.4 μg/mm3 tumor, 2μl), the DDP group was injected intraperitoneally with cisplatin (0.4 mg/kg, 10μl), and the DOX+DDP group was treated with both DOX (0.4 μg/mm3 intratumorally, 2μl) and DDP (0.4 mg/kg intraperitoneally, 10μl). At the same time, the control group was administered with PBS (intratumorally, 2μl) and saline (intraperitoneally, 10μl) as placebos. Animals were treated every four days for a total of four times. When the longest tumor length in each group reached 2 cm, all the mice in the same group were sacrificed, and the tumor nodules were removed and measured.
Dataset analysis
Microarray gene expression datasets for ovarian cancer were downloaded from The Cancer Genome Atlas (TCGA, http:tcga-data.nci.nih.gov). The HDAC4, HIF-1α and CREBZF mRNA expression in 523 serous ovarian cancer cases was assessed. The gene expression levels were provided as log2 ratios. Spearman's correlation analysis was performed using GraphPad Prism software. Kaplan-Meier analysis was performed for survival analysis using the online tool KM-plotter (http://kmplot.com/analysis). Auto select best cutoff was performed using online software.
Statistical analysis
The data were statistically analyzed using GraphPad Prism software and are expressed as the mean ± S.E. Comparisons between the control and experimental groups were analyzed using Student's t test. P < 0.05 was considered statistically significant (* refers to P < 0.05; ** refers to P < 0.01; *** refers to P < 0.001).
Results
Wild-type p53 and RAS inversely regulate apoptosis through AKT- and ERK-mediated signaling
SKOV3 is a human ovarian adenocarcinoma cell line whose genetic background is p53 null and RAS wild type [27]. To analyze the basic role of wild-type p53 in this cell line, we first delivered an inducible p53 cDNA with an HA-Tag into SKOV3 cells and generated the SKOV3T cell line, which expressed wild-type p53 protein in the presence of DOX. As shown in Figure 1A, treatment of cells with 1 μM DOX for 0, 6, 12, 24 and 48 hours resulted in a corresponding increase in p53, HA-Tag, and the p53 downstream proteins p21, E2F1, and Bax (a pro-apoptotic protein) in a time-dependent manner but led to decreased expression of the anti-apoptotic protein Bcl-2. To decipher the interplay between p53 and RAS signaling, RAS mutants, including V12, S35, E38 and C40 with His-tags were further introduced into SKOV3T cells. As shown in Figure 1B and 1C, p53 expression was markedly reduced in SKOV3T/V12, SKOV3T/S35 and SKOV3T/E38 cells but not in SKOV3T/C40 cells compared with that in SKOV3T cells following DOX treatment. RAS expression in SKOV3T/V12, SKOV3T/S35, SKOV3T/E38 and SKOV3T/C40 cells was detected using an antibody against the His-tag and was found to be gently affected by wild-type p53 induction. In RAS mutant-expressing cells treated with DOX, an increase in p21, E2F1, and BAX and a decrease in Bcl-2 were observed in a time-dependent manner.
Figure 1
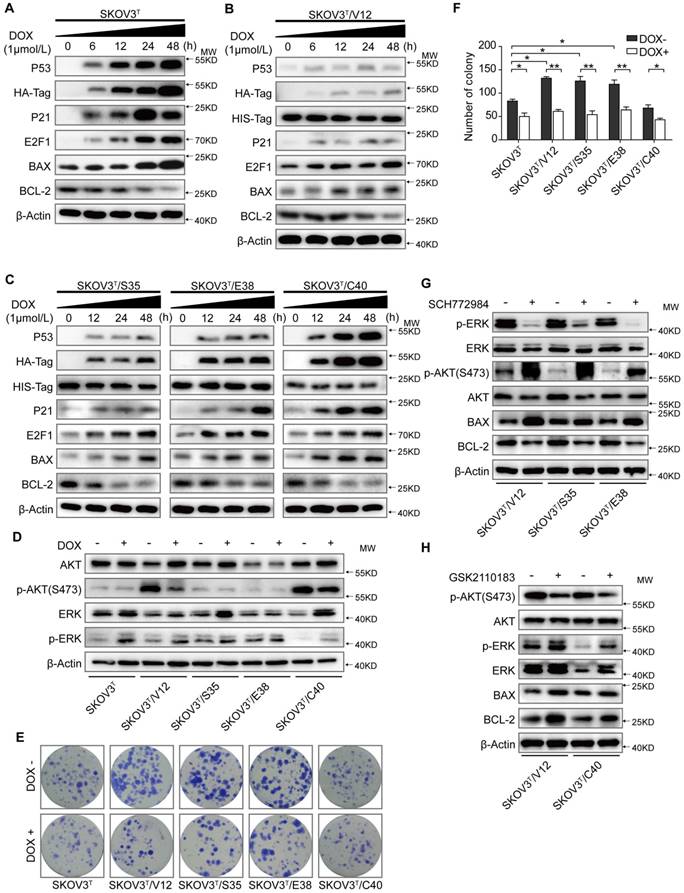
p53 collaborates with RAS signaling to modulate cell proliferation and apoptosis. A. Expression of p53 and apoptosis-related proteins in SKOV3T cells. B. H-RASV12, p53 and apoptosis-related proteins in SKOV3T /V12 cells. C. H-RASS35, H-RASE38, H-RASC40, p53 and apoptosis-related protein expression in SKOV3T /S35, SKOV3T /E38, and SKOV3T /C40 cells. D. Different RAS mutations stimulate disparate RAS signaling cascades. E-F. p53 and H-RAS synergistically modulate cell colony formation. Representative images (E) and quantitative analysis of colony formation (F). The values are expressed as the mean ± standard deviation (n = 3 wells). *: P < 0.05 vs. the control. **: P < 0.01 vs. the control. G-H. RAS signaling alterations induced by the ERK inhibitor SCH772984 (2 μM; 8 h) (G) and by the AKT inhibitor GSK2110183) (10 nM; 8 h) (H), showing that ERK and AKT signaling are mutually suppressive. Protein markers are properly labeled in relative panels.
RAS mutants activate different signaling pathways. As shown in Figure 1D, before p53 induction, activated V12, S35 and E38 stimulated ERK phosphorylation (p-ERK) but suppressed AKT phosphorylation (p-AKT), while C40 activated p-AKT but alleviated p-ERK, which are consistent with those of other reports [28]. Induction of wild-type p53 increased p-ERK (Thr202/Tyr204) but decreased p-AKT (S473), especially in V12- and C40-transfected cells. Colony formation assays showed that cells expressing V12, S35, and E38 but not C40 formed more and larger colonies than control cells before p53 was introduced. However, the number of colonies was significantly reduced after cells were treated with DOX (Fig. 1E-F). To exclude the artificial drug effects of DOX on cellular signaling, we treated the non-transfected and empty vector-transfected SKOV3 cells with DOX at the same concentration used for other cell lines, we did not find any significant changes of BAX, BCL-2, ERK, pERK, AKT and pAKT expression and cell proliferation compared with the diluent-treated cells (SFig. 1A-B). Because RAS may regulate tumor cell apoptosis and proliferation mainly through the MAPK/ERK and PI3K/AKT signaling cascades, we treated V12, S35 and E38 cells with the ERK inhibitor SCH772984 (2 μM for 8 h) and found that ERK inhibition highly activated pAKT-S473 and decreased Bax but increased Bcl-2, while treatment of V12 and C40 cells with the AKT inhibitor GSK2110183 (10 nM, 8 h) attenuated p-AKT and Bcl-2 but increased p-ERK levels (Fig.1G-H).
These results suggest that the wild-type p53 has a weak effect on RAS expression and that the RAS mutants V12, S35 and E38 activate the ERK cascade and weaken p53 activity to promote proliferation and apoptosis resistance, while C40 activates the AKT cascade and has little effect on p53 expression and thus inhibits anti-apoptotic processes and proliferation. Inhibition of ERK activity highly stimulates AKT activation and apoptosis, but AKT suppression moderately stimulates ERK activation and cell anti-apoptotic processes, indicating that the AKT and ERK pathways are mutually suppressive in RAS mutation signaling networks.
Wild type p53 and RAS mutants differentially induce autophagy through regulation of Atg3 and Atg12
Autophagy plays both antitumor and protumor roles to maintain homeostasis depending on the cellular context and the tumor microenvironment [29]. To investigate the roles of p53 and RAS mutants in autophagy, we tested the expression of autophagy-associated proteins. We found that the induction of p53 enhanced Atg3, Atg12, Atg16 and Beclin1 expression, increasing the number of autophagosomes, especially in cells without RAS mutation (Fig. 2A-C), and that V12, S35 and E38 but not C40 upregulated Atg3, Atg12, Atg16 and Beclin1 to increase the number of autophagosomes (Fig. 2A-C). These findings were validated by treatment of the cells with chloroquine, which inhibits the fusion of autophagosomes with lysosomes to alleviate autophagic degradation, resulting in further accumulation of LC3B (Fig. 2D-E) [30]. Because ERK and AKT differentially participate in RAS signaling cascades to potentially regulate autophagy, we treated cells with ERK and AKT inhibitors and found that treatment of ERK-activated cells with the ERK inhibitor SCH772984 reduced Atg3, Atg12, and LC3B expression (Fig. 2F) and that treatment of AKT-activated cells with the AKT inhibitor GSK2110183 rescued the suppression of Atg 3, Atg 12, and LC3B expression (Fig. 2G). The similar results were observed by silencing of ERK1/2 or AKT1/2 expression with their specific siRNAs (SFig. 1C). These data suggest that p53 and ERK active RAS mutants induce cellular autophagy possibly through upregulation of Atg3, Atg12, and LC3B expression, and that AKT active RAS mutant suppresses autophagy through downregulation of the same autophagy-associated proteins.
p53 and RAS inversely control cancer cell cisplatin resistance
To investigate whether p53 and RAS mutants really control cancer cell chemoresistance, we tested the sensitization of the above cell lines to cisplatin treatment. As shown in Figure 3A and 3B, before p53 induction, V12-, S35- and E38-expressing SKOV3T cells exhibited higher cisplatin IC50 values than empty vector- or C40-expressing SKOV3T cells, and the cisplatin IC50 values were significantly decreased after the induction of wild-type p53. Next, we assessed the level of apoptosis in each cell line treated with cisplatin. As shown in Figure 3C and 3D, introduction of wild-type p53 enhanced cisplatin-induced apoptosis. These in vitro results were also confirmed in xenograft tumor models (Fig. 3E, SFig. 1D) in which SKOV3T/S35 and SKOV3T/E38 cells formed solid tumors earlier with rapid growth, SKOV3T/V12 cells formed tumors slightly later but that grew faster than those formed by control cells, and SKOV3T/C40 cells did not postpone tumor formation but induced tumor growth much more slowly than control cells. Intratumoural injection of DOX to induce wild-type p53 expression after the average tumor sizes reached 100 mm3 not only slowed tumor growth but also significantly reduced the tumor volume and weight possibly due to the observed necrosis inside the tumors. Cisplatin treatment inhibited tumor growth, especially in SKOV3T/C40 cells but had a weak response in SKOV3T/V12, SKOV3T/S35, and SKOV3T/E38 cells compared with that in controls. These data demonstrate that p53 and RAS mutants essentially control the anticancer efficacy of cisplatin treatment, presumably through the altered regulation of autophagy and apoptosis.
Figure 2
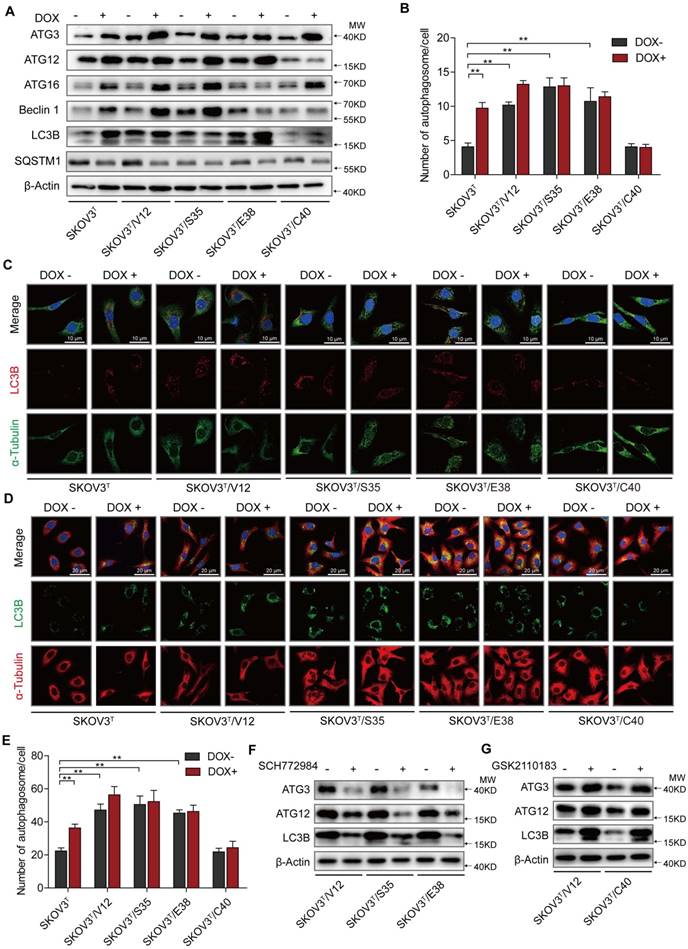
p53 and RAS participate in autophagy regulation. A. Expression of autophagy-associated proteins in cells transfected with p53 and various H-RAS mutants. B. Quantitative analysis of autophagosomes. The number of autophagosomes is indicated as the average number of autophagosomes per cell based on analysis of 100 cells. C. LC3B distribution detected by immunofluorescence. D. Examination of LC3B in cells treated with chloroquine. E. Quantitative analysis of autophagosomes in cells treated with chloroquine. F-G. Alterations in autophagy-related proteins induced by ERK inhibition (F) or AKT inhibition (G). The values are expressed as the mean ± standard deviation (n = 3). *: P < 0.05 vs. control. **: P < 0.01 vs. control. Protein markers are properly labeled in relative panels.
Figure 3
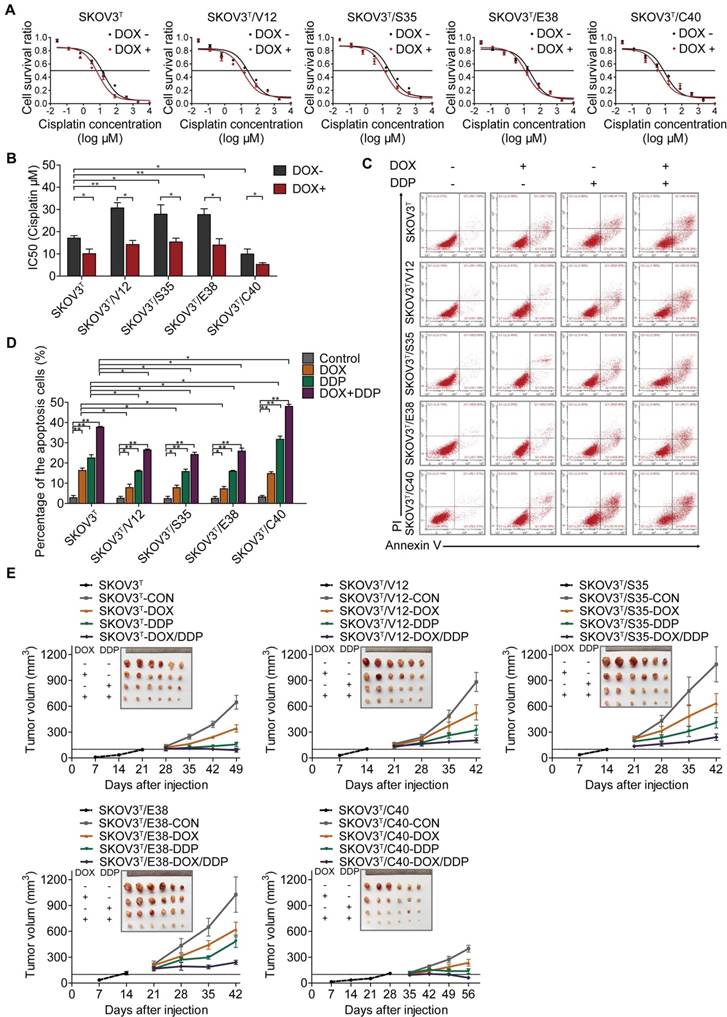
p53 and RAS regulate cell resistance to cisplatin. A-B. IC50 values of cells determined by treatment with different cisplatin concentrations for 48 hours. C. Apoptosis analysis via flow cytometry after treatment with DOX, cisplatin, or DOX+cisplatin. D. Quantitative analysis of the cell apoptosis percentage. E. Tumor growth following subcutaneous inoculation with SKOV3T, SKOV3T/V12, SKOV3T/S35, SKOV3T/E38, or SKOV3T/C40 cells, followed by administration of placebo, DOX, cisplatin, or DOX+cisplatin. The data are expressed as the mean ± SEM of three independent experiments. The bars represent the mean ± SEM; n = 3; * refers to P < 0.05; ** refers to P < 0.01.
Figure 4
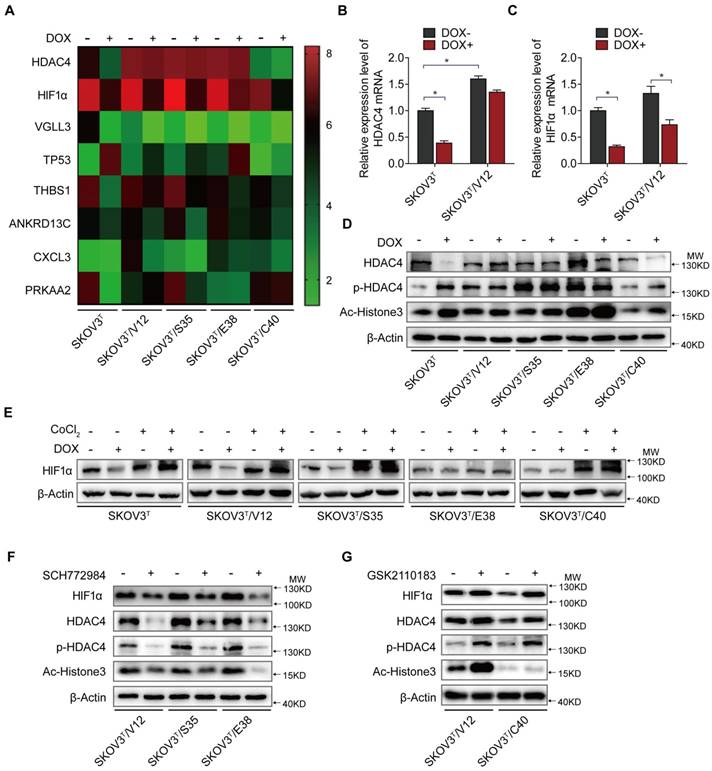
HDAC4 and HIF-1α are key molecules in p53 and RAS signaling networks. A. Gene expression profiles of p53 and RAS signaling cascades. Red and green represent upregulated and downregulated genes, respectively. B-C. HDAC4 (B) and HIF-1α (C) mRNA levels determined by q-PCR in SKOV3T and SKOV3T/V12 cells. D. Effects of p53 and RAS mutants on the expression and acetylation ability of HDAC4 and pHDAC4. E. Expression of HIF-1α under normoxia and hypoxia in the presence or absence of p53 and/or RAS mutants. F-G. Altered expression of HDAC4, pHDAC4 and HIF-1α induced by inhibition of ERK (F) and AKT (G). Protein markers are properly labeled in relative panels.
HDAC4 and HIF-1α mediate the interaction between p53 and RAS signaling
To uncover the molecular mechanism associated with cisplatin chemoresistantance in cells with or without p53 and RAS activation, we performed an Affymetrix Prime View human gene expression analysis and screened several genes that might participate in the p53 and RAS signaling interaction (Fig. 4A). HDAC4 and HIF-1α were selected for further study after mRNA analysis in SKOV3T and SKOV3T/V12 cells (Fig. 4B-C). Unexpectedly, induction of p53 decreased HDAC4 but enhanced p-HDAC4 levels in SKOV3T cells. p-HDAC4 was highly induced by V12, S35 and E38 but was inhibited by C40, while p53 induction had little effect on HDAC4 and p-HDAC4 in V12-, S35- and E38-expressing cells. The detection of decreased Ac-Histone3, an HDAC4 target, indicated that the nuclear acetylation ability of HDAC4 was reduced in V12, S35 and E38 RAS mutant cells but not in C40 cells (Fig. 4D). Using cobalt chloride (CoCl2, 100 μM, 6 hours) to mimic hypoxic conditions, we found a dramatic increase in HIF-1α under the hypoxic condition, but no differences were observed between the cell lines regardless of the p53 and RAS status. Under normoxic conditions, HIF-1α expression was decreased by p53 induction in SKOV3T cells and in V12- and S35-expressing SKOV3T cells, a finding consistent with that in a previous report [31] (Fig 4E). Based on the above results, we may conclude that the interaction of p53 with the RAS signaling molecules ERK and AKT differentially regulate HDAC4 phosphorylation and HIF-1α protein stability. Thus, we treated SKOV3T/V12, SKOV3T/S35 and SKOV3T/E38 cells with the ERK inhibitor SCH772984 and found that HDAC4, p-HDAC4 and HIF-1α proteins were dramatically downregulated and that the nuclear deacetylation function of HDAC4 was also suppressed, evidenced by the detection of Ac-Histone3 protein (Fig. 4F). However, treatment of SKOV3T/V12 and SKOV3T/C40 cells with the AKT inhibitor GSK2110183 upregulated HDAC4, p-HDAC4 and HIF-1α proteins because the AKT inhibitor activated the ERK signaling cascade as demonstrated above (Fig. 4G).
These data suggest that HDAC4 and HIF-1α are two key mediators that are inversely regulated by the ERK and AKT cascades in the p53 and RAS signaling networks. Additionally, both molecules may play important roles in autophagy and apoptosis regulation.
p53 and RAS control the cellular localization and activity of HDAC4 and HIF-1α
Because HDAC4 may shuttle between the nucleus and cytoplasm depending on upstream cell signaling, we detected the intracellular localization of HDAC4 using IF. As shown in Fig. 5A and SFig. 2A, HDAC4 was detected in the nucleus but appeared in the cytoplasm of SKOV3T cells after the wild-type p53 was introduced. HDAC4 translocated from the nucleus to the cytoplasm in SKOV3T/V12 and SKOV3T/S35 cells but remained in the nucleus of SKOV3T/C40 cells independent of the p53 status. HIF-1α was also mainly localized in the nucleus of SKOV3T and SKOV3T/C40 cells, and was localized in the cytoplasm of SKOV3T/V12 and SKOV3T/S35 cells but appeared undetectable after p53 induction (Fig. 5A, SFig. 2B). A study reported that the amino-terminal domain of HDAC4 is subject to reversible phosphorylation, which controls its nucleocytoplasmic distribution [32], and later detection via IF showed that p-HDAC4 predominantly accumulated in the cytoplasm in SKOV3T/V12 and SKOV3T/S35 cells but was undetectable in SKOV3T/C40 cells (Fig. 5B). The differential subcellular distributions of HDAC4 and HIF-1α were further confirmed by western blotting in SKOV3T cells using nuclear and cytoplasmic extracts. HDAC4 was detected in the nucleus before p53 induction but appeared in the cytoplasmic components once p53 was introduced. p-HDAC4 was mainly expressed in the cytoplasmic components, and the level of p-HDAC4 was increased by p53 induction. HIF-1α expression was detected mainly in the nucleus and was decreased dramatically with p53 induction (Fig. 5C). Further study using co-IP showed that HDAC4 might bind to HIF-1α and form a protein complex in SKOV3T and SKOV3T/V12 cells and that p-HDAC4 might also interact with HIF-1α in V12-expressing cells (Fig. 5D), indicating that HDAC4 and HIF-1α form a protein complex to regulate chemoresistance through protein phosphorylation, translocation and degradation. Moreover, HDAC4/p-HDAC4 and HIF-1α subcellular localization and expression were also confirmed in additional ovarian and lung cancer cell lines with or without p53 and/or RAS mutations (Fig. 5E, 5F, and SFig. 3A-H). These data strongly suggest that both p53 and ERK active RAS mutants (S35, V12, E38) induce autophagy through HDAC4 phosphorylation and cytoplamic translocation, but p53 simultaneously promotes HIF-1α degradation, whereas ERK active RAS mutants also promote HIF-1α cytoplasmic translocation, which leads to opposite effects on cisplatin resistance.
HDAC4 phosphorylation and translocation promotes autophagy through CREBZF-mediated transcription of ATG3
To further investigate how HDAC4 and HIF-1α regulate autophagy, we silenced or overexpressed HDAC4 and HIF-1α in SKOV3T cells. Overexpression of HDAC4 increased p-HDAC4 and HIF-1α (Fig. 6A upper panel, SFig. 4A-C), whereas the exogenous HDAC4 remained in the nucleus, but induction of p53 promoted HDAC4 translocation from the nucleus to the cytoplasm (SFig. 4A). Exogenous HDAC4 also deacetylated and stabilized HIF-1α, while HIF-1α knockdown in turn stimulated HDAC4 phosphorylation to facilitate translocation of HDAC4 to the cytoplasm (Fig. 6A lower panel; SFig. 4D). To evaluate the roles of HDAC4 and HIF-1α in p53 and RAS signaling networks, HDAC4 or HIF-1α was silenced in SKOV3T, SKOV3T/V12 and SKOV3T/S35 cells and was overexpressed in SKOV3T/C40 cells. As shown in Fig. 6B, p-HDAC4, HIF-1α, Ac-histone 3, Atg3, Atg12, LC3B, and Bcl-2 were downregulated or upregulated by silencing or overexpression of HDAC4, respectively, while Bax was negatively regulated by HDAC4, indicating that the autophagy and cell apoptosis alterations mediated by p53 and RAS are controlled at both the HDAC4 protein and phosphorylation levels. On the other hand, HIF-1α silencing promoted HDAC4, p-HDAC4, Atg3, LC3B and Bax but not Atg12 expression, while HIF-1α overexpression inhibited Atg12 and Bax but enhanced Bcl2, indicating that HDAC4 and HIF-1α inversely regulate autophagy but cooperatively control cell apoptosis (Fig. 6C).
Figure 5
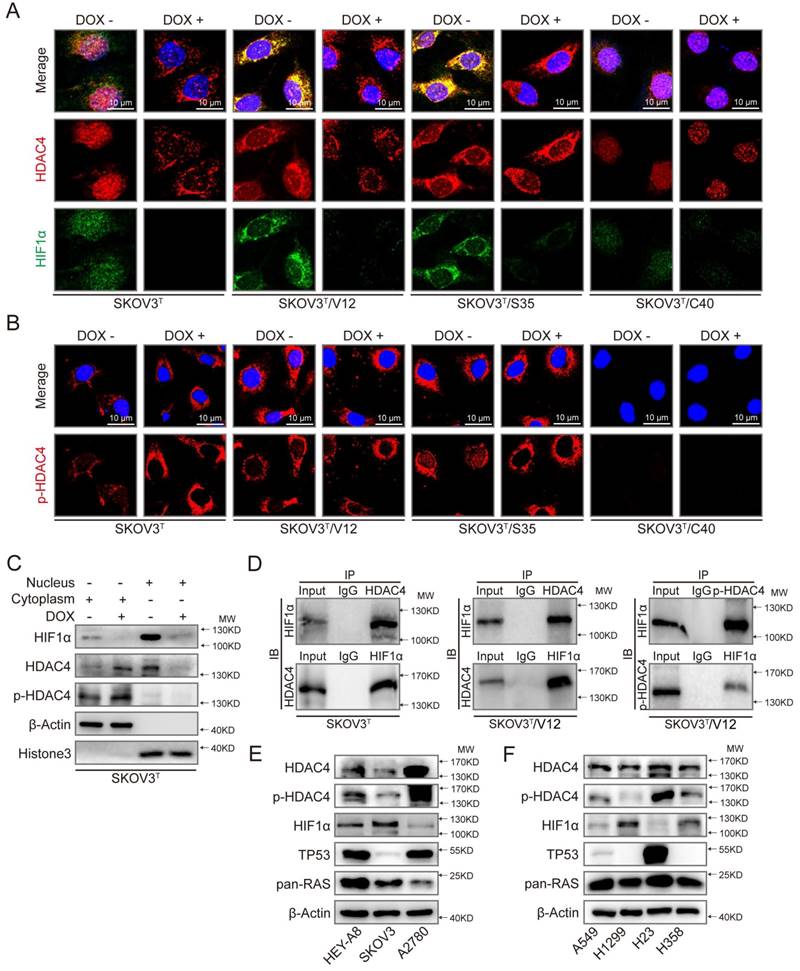
p53 and RAS mutants control the expression and intracellular localization of HDAC4 and HIF-1α. A. Selected images showing cellular co-localization of HDAC4 with HIF-1α. B. Selected images showing pHDAC4 was increased by p53 induction and ERK active RAS transfection. C. Detection of HIF-1α, HDAC4 and p-HDAC4 in the nucleus and cytoplasm of SKOV3T cells. β-Actin and histone 3 were used as loading controls for the cytoplasmic and nuclear extractions, respectively. D. Direct binding of HDAC4/p-HDAC4 with HIF-1α detected by co-immunoprecipitation in SKOV3T and SKOV3T/V12 cells. Rabbit or mouse IgG served as a negative control for the co-IP experiment. E-F. Detection of HDAC4, pHDAC4, HIF-1α, p53, RAS in additional ovarian cancer cell lines (E) and lung cancer cell lines (F) with either or both p53 or/and RAS mutations, showing that HDAC4, pHDAC4 and HIF-1α are regulated by p53 and RAS status. Protein markers are properly labeled in relative panels.
Figure 6
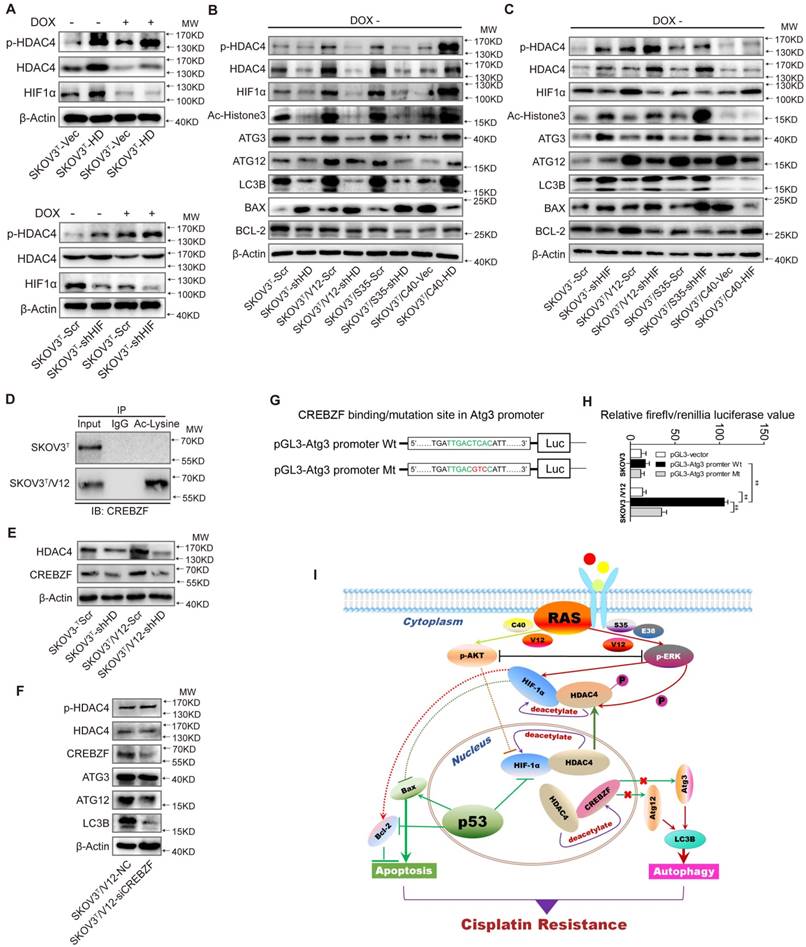
HDAC4 modulated by p53 and HIF-1α regulates autophagy by deacetylating CREBZF. A. HDAC4 overexpression leads to increased HIF-1α stability and HDAC4 phosphorylation (upper panel), whereas knockdown of HIF-1α stimulates HDAC4 phosphorylation. B. Association of HDAC4 with autophagy and apoptosis. C. Association of HIF-1α with autophagy and apoptosis. D. Acetylation of CREBZF in SKOV3T and SKOV3T/V12 cells. E. CREBZF expression with HDAC4 knockdown in SKOV3T and SKOV3T /V12 cells. F. Atg3, Atg12 and LC3B expression with CREBZF knockdown. G. Construction of ATG3 promoter luciferase plasmids with the CREBZF binding/mutation sites. H. SKOV3T and SKOV3T /V12 cells were transfected with the plasmids of the ATG3 promoter-driven luciferase for 48 h followed by a dual luciferase assay. A high luciferase activity was observed in SKOV3T/V12 cells transfected with the wild type of Atg3 promoter, whereas the transfection of the same cell line with the binding site mutation promoter highly reduced the luciferase acitivity. **, P < 0.01. I. A schematic diagram showing that HDAC4 and HIF-1α are key mediators between p53 and RAS signaling networks although ERK and AKT inversely regulate HDAC4 and HIF-1α through phosphorylation, translocation and protein degradation. HDAC4 and HIF-1α collaboratively inhibit cellular apoptosis, but inversely control autophagy, both confer ovarian cancer cisplatin resistance. Protein markers are properly labeled in relative panels.
A previous study found that Atg3 could be acetylated by Esa1 to promote autophagy [33]; thus, we examined Atg3 and Atg12 acetylation but found that the acetylation of the two proteins was very low (SFig. 4E). We also failed to detect the interaction between HDAC4 and Atg3/Atg12 (SFig. 4F-G). Therefore, we presumed that there might be some transcription factors activated by HDAC4 phosphorylation to promote Atg transcription. Analysis of gene expression profiles identified that the transcription factor CREBZF might be responsible for Atg overexpression (SFig. 4H) because CREBZF acetylation was enhanced in V12 cells compared with that in SKOV3T cells (Fig. 6D, lower panel) and CREBZF expression was attenuated after HDAC4 knockdown (Fig. 6E). Knockdown of CREBZF by specific siRNA in SKOV3T/V12 cells maintained the HDAC4 and p-HDAC4 levels but reduced the levels of Atg3, Atg12 and LC3B (Fig. 6F). Further analysis showed at least two potential motifs in ATG3 promoter region may bind to CREBZF (STable 2). So, we cloned the ATG3 promoter region (-2000 to -1nt) into pGL3 vector and performed luciferase assays (Fig. 6G), and found that the transfection of the wild type (WT)-promoter plasmid in SKVO3T cells did not show much increased luciferase activity because the activity of CREBZF was likely inhibited by HDAC4-mediated deacetylation, compared with in empty vector- or MT plasmid-transfected cells, however, the transfection of the wild type (WT) sequence plasmid in V12 expressing cells with high pHDAC4 and low deacetylated CREBZF appeared with higher luciferase activity, whereas the mutation (GTC) of the binding motif (TCA, -1765 to -1663) in the promoter displayed a highly reduced luciferase activity in these cells (Fig. 6H).
These data suggest that the intracellular localization of HDAC4 is p53 and ERK dependent and that HDAC4 acetylates and stabilizes HIF-1α. The non-phosphorylated HDAC4 is located in the nucleus and binds to HIF-1α in the absence of wild-type p53 or with loss of p53 function. Upon introduction of p53, the binding of p53 to HIF-1α promotes HIF-1α degradation and causes the disassociation of HIF-1α from HDAC4 to promote the translocation and phosphorylation of HDAC4 by ERK. These events lead to the decreased deacetylation and activation of the transcription factor CREBZF, which subsequently promotes ATG3 transcription by CREBZF to induce autophagy. Nevertheless, the cellular apoptosis and autophagy regulated through the direct or indirect interaction between p53 and HIF-1α or HDAC4 differentially control ovarian cancer cisplatin resistance (Fig. 6I).
HDAC4 and HIF-1α confer cisplatin resistance and are associated with cancer patient survival
Next, the role of HDAC4 and HIF-1α in cisplatin resistance was examined in the corresponding cells. Silencing or overexpression of HDAC4 and HIF-1α dramatically decreased or increased the cisplatin IC50s of cells (Fig. 7A, SFig. 5A). The IC50 values of cells were significantly reduced after p53 induction (Fig. 7B, SFig. 5B). In vivo animal assays showed that knockdown or overexpression of HDAC4 and HIF-1α inhibited or promoted tumor growth and sensitivity to cisplatin treatment (Fig. 7C-D, SFig. 6A, 6B). Analyses of serous ovarian carcinoma data from TCGA database showed that high f HDAC4 or CREBZF expression detected by most probes predicted a poor overall survival (OS) and/or progression-free survival (PFS) (Fig. 7E-H, STable 3). High HIF-1α expression with wild-type or mutant p53 was statistically correlated with a poor or good OS, respectively (Fig. 7I-J), but not with PFS (STable 3), and a correlation between HDAC4 and HIF-1α or CREBZF was also found (Fig. 7K-L). Regarding mutant p53, high HDAC4 expression detected by most of the probes was not statistically correlated with OS and PFS, while high CREBZF expression detected by approximately half of the probes was statistically correlated with PFS but not with OS (STable 3). However, high ERK or AKT levels detected by a few probes also predicted a poor OS or PFS, although ERK and AKT are known to be regulated at the protein phosphorylation level (SFig. 7A-H; STable 3). Although p53 is a tumor suppressor, high expression of wild-type p53 or mutant p53 predicted a good or poor PFS but not OS (STable 3).
Discussion
RAS mutations have long been considered a proper target for the treatment of various cancers; however, the development of specific inhibitors against different RAS mutants has been impeded until a series of studies recently reported that K-RASG12C could be properly targeted by a few inhibitors [18, 34]. However, in cancer cells, RAS mutations are frequently accompanied by mutations of tumor suppressors including p53, pTEN, and Rb. Thus, mutations of tumor suppressors must be coordinately considered during clinical trials with specific inhibitors against RAS mutants. p53 and RAS are two potent molecules that inversely control cell fate and therefore determine the direction of cancer development and treatment efficacy. RAS may suppress p53 through Raf/MEK/MAP kinase-mediated transactivation of MDM2 and induction of p19ARF in mouse cells [35], while loss of p53 may induce cell proliferation through RAS-independent activation of MEK/ERK signaling [36]. Even so, the dysfunction of p53 has seldom been considered in the treatment of tumors with activation of the P3IK/AKT and MAPK signaling pathways.
Figure 7
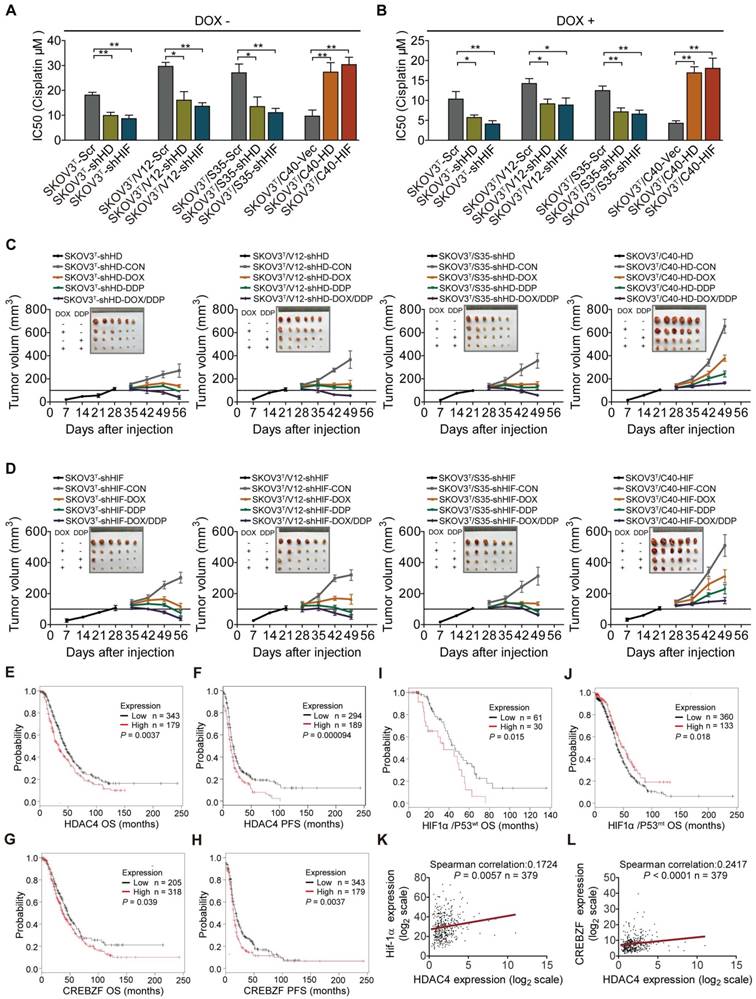
HDAC4 and HIF-1α promote cisplatin resistance, and predict patient survival. A. Quantitative analysis of cisplatin IC50 in response to HDAC4 or HIF-1α expression. B. Quantitative analysis of IC50 in cells with HDAC4 or HIF-1α silencing and DOX treatment. C-D. Growth of tumors derived from cells with different HDAC4 (C)and HIF-1α (D) expression levels, followed by treatment with placebo, DOX, cisplatin, or DOX+cisplatin. E-F. High HDAC4 expression was significantly correlated with a shorter overall survival (E) and progression-free survival (F) in the Kaplan-Meier plotter cohort. G-H. High CREBZF expression was significantly correlated with shorter overall survival (G) and progression-free survival. (H) I-J. High HIF-1α expression indicated poor or good OS with mutant p53 (I) or wild-type 53, respectively (J). K-L. HDAC4 was positively correlated with HIF-1α (K) and CREBZF (L) in TCGA database. The bars represent the mean ± SEM; n = 3; * refers to P < 0.05; ** refers to P < 0.01.
In our study, we found that induction of p53 in RAS wild-type cells promoted apoptosis, autophagy, and cell sensitivity to cisplatin treatment. Introduction of ERK active RAS mutants V12, S35 or E38 inhibited cell apoptosis but promoted autophagy and cisplatin resistance, while cells transfected with AKT active RAS mutant C40 displayed less autophagy and more apoptosis sensitivity to cisplatin treatment, which were confirmed by using both ERK/AKT inhibitors and siRNAs. These data are consistent with the reports in which AKT inhibitors may induce autophagy [37, 38], whereas ERK activation promotes autophagy [39, 40]. In vitro and in vivo treatment of cells or xenograft tumor-bearing animals with cisplatin and/or DOX (to induce p53 expression) showed that the induction of p53 along with cisplatin synergistically and significantly induced cell apoptosis and inhibited tumor growth. The ERK-active RAS mutants V12, S35 and E38 promoted cell and tumor resistance to cisplatin treatment, but the AKT-active RAS mutant C40 enhanced the sensitivity of cells and tumors to cisplatin treatment. Thus, activation of RAS/MAPK signaling confers ovarian cancer cell cisplatin resistance, whereas activation of p53 and RAS/AKT signaling inhibits cisplatin resistance.
Analysis of gene expression profiles revealed that histone deacetylase 4 (HDAC4) and hypoxia-inducible factor 1α (HIF-1α) are two major mediators that function downstream of the p53, RAS/PI3K/AKT and RAS/MAPK signaling pathways. Studies have shown that HDAC4 interacts with MAP kinase to regulate the muscle atrophy program [41]. A few studies have reported that HDAC4 may interact with RAS signaling molecules, including PI3K/AKT and MAP kinase [42, 43]. Although most studies have shown that HIF-1α is highly inducible under hypoxic conditions, some studies also proved that HIF-1α functions in cancer cells under normoxic conditions [44, 45]. HIF-1α induces autophagy [46], and confers cancer cell resistance to chemotherapeutic agents [47, 48]. However, the exact role of HIF-1α in association with the status of p53 and RAS is highly ambiguous, especially under normoxia. We show that p53 induction and/or cell transfection with RAS mutants V12, S35, E38 and C40 differentially affected the expression, cellular localization, and protein phosphorylation of HIF-1α and HDAC4, which ultimately regulated cellular apoptosis, autophagy, and cisplatin resistance.
Apoptosis and autophagy are two major pathways identified in the interaction between p53 and RAS in this study. Apoptosis is a well-known mechanism associated with chemoresistance. We previously reported that mutations of p53 and KRAS may confer chemoresistance through the NF-κB-activated dysregulation of cell cycle and inhibition of apoptosis in lung cancer cells [49]. In ovarian cancer cells, inhibition of apoptosis-associated proteins confers cisplatin resistance [50], whereas p53 and RAS signaling molecules are major drivers [11, 51, 52]. Although wild type p53 is well-recognized to induce apoptosis, which is also supported by our data, we found that apoptosis was suppressed by RAS/ERK, but promoted by RAS/AKT in the selected ovarian cancer cell model, which are inconsistent with previous reports [53, 54]. To unravel this point, we first found that treatment of cells with specific inhibitor of RAS/ERK upregulated both pAKT and BAX expression and inhibited Bcl2 expression, whereas inhibition of RAS/AKT with drug increased pERK and Bcl2 expression (Fig. 1G-H). These surprising results were later clarified by the identification of HIF-1α and HDAC4 that mediated the interaction between p53 and RAS signaling molecules. The transfection of ERK active RAS mutants V12, S35, E38 promoted the nucleus-to-cytoplasmic translocation of HIF-1α, whereas delivery of AKT active RAS mutant C40 did not stimulate the cytoplasmic translocation of HIF-1α, although the induction of p53 quite diminished the expression of HIF-1α (SFig. 2A-B). These results were also supported in more ovarian and lung cancer cell lines with or without p53 or/and RAS mutations (Fig. 5E-F; SFig. 3A-H). This is consistent with the literature that p53 and HIF-1α are mutually suppressive [55-57]. Thus, the reduced expression and nucleus localization of HIF-1α promotes cellular apoptosis and sensitivity to cisplatin treatment, whereas the high expression and cytoplasmic localization of HIF-1α stimulates anti-apoptotic processes and cisplatin resistance although HDAC4 may control apoptosis indirectly through HIF-1α, which is also supported by overexpression or silencing of HIF-1α and HDAC4 in our study (Fig. 6B-C; SFig. 4A-D).
Autophagy not only regulates the stress response but also maintains homeostasis of metabolites and cellular components in cells and organism, and is also associated with multiple diseases [58]. The findings in recent years have shown that autophagy is closed associated with cancer development and chemoresistance [59]. The results from most studies have suggested that autophagy promotes chemoresistance and targeting autophagy-associated molecules may increase cancer cell chemosensitivity [59, 60]. However, some studies also reported that autophagy promotes chemosensitivity. For instance, induction of autophagy by valproic acid enhances lymphoma cell chemosensitivity [61], and RAD001 induces autophagy to promote the therapeutic response to cytotoxic chemotherapy [62]. In our study, induction of p53 and transfection of ERK active RAS mutants but not AKT active RAS mutant in p53-null ovarian cancer cells promoted autophagy, although the autophagy induced by p53 or ERK active RAS mutants showed an opposite sensitivity to cisplatin treatment. Thus, the autophagy induced by tumor suppressors and oncogenic signaling molecules may result in adverse chemosensitivity of cancer cells. The early studies found that p53 induces autophagy [63] but the later reports suggested that nuclear (wild type) p53 induces autophagy, whereas cytoplasmic (mutant) p53 represses autophagy [64, 65]. On the other hand, we showed, in our study, that induction of p53 in ERK active RAS expressing cells did not further induce autophagy, but reversed the cisplatin resistance to sensitivity, indicating that the wild type p53 status determines the role of autophagy in ovarian cancer chemoresistance, which is consistent with a previous report [66].
One of our major findings is that AKT and ERK active RAS mutants are mutually suppressive and inversely regulate cell apoptosis and autophagy, which is also reported by different researchers [67-69]. In our study, we found that, without p53 induction, ERK active RAS mutants V12, S35, and E38 but not AKT active RAS mutant C40 promoted the cytoplasmic translocation and phosphorylation of HIF-1α and HDAC4, whereas induction of p53 in C40 cells did not induce autophagy potentially because HDAC4 was still localized in nucleus although HIF-1α was highly decreased (SFig. 2A-B). These results suggest that the occurrence and role of autophagy in ovarian cancer cisplatin resistance largely depend on cytoplasmic translocation and phosphorylation of HIF-1α and HDAC4 induced by p53 and RAS signaling molecules.
Last, we found that the activity of CREBZF is inhibited by HDAC4 most likely through protein deacetylation in nucleus, whereas CREBZF is responsible to the transcription regulation of ATG3 (and possibly ATG12), as indicated in Figure 6G-H. Therefore, the phosphorylation and cytoplasmic translocation of HDAC4 induced by p53 introduction, HIF-1α degradation or cytoplasmic translocatioin associated with ERK activation deprives the HDAC4-mediated inhibition of CREBZF in nucleus, which eventually induces the expression of ATG3 and autophagy. Although the results from a few studies in current literature suggest that CREBZF may be linked to p53, ERK, and autophagy [70, 71], the activation of CREBZF, and the trancriptional regulation of ATG3 by HDAC4 phosphorylation and cytoplasmic translocation are novel findings in our study.
Conclusions
Our study revealed that the interaction between p53 and RAS signaling networks controls ovarian cancer cisplatin resistance most likely through apoptosis and autophagy that are mainly regulated by the protein phosphorylation and nucleus-to-cytoplasm translocation of HIF-1α and HDAC4. For treatment of ovarian or other cancer types with p53 and RAS mutations, a therapeutic strategy against HDAC4, HIF-1α, and CREBZF may be considered in combination with p53 targeted therapy and cisplatin treatment.
Acknowledgements
This study was supported by grants from the National Natural Science Foundation of China (#81572553, 81772789, and 81372797, for G. Yang).
Supplementary Material
Supplementary figures and tables.
Competing Interests
The authors have declared that no competing interest exists.
References
1. Siegel RL, Miller KD, Jemal A. Cancer Statistics, 2017. CA: a cancer journal for clinicians. 2017;67:7-30
2. Brachova P, Thiel KW, Leslie KK. The consequence of oncomorphic TP53 mutations in ovarian cancer. International journal of molecular sciences. 2013;14:19257-75
3. Laframboise S, Chapman W, McLaughlin J, Andrulis IL. p53 mutations in epithelial ovarian cancers: possible role in predicting chemoresistance. Cancer journal. 2000;6:302-8
4. Reles A, Wen WH, Schmider A, Gee C, Runnebaum IB, Kilian U. et al. Correlation of p53 mutations with resistance to platinum-based chemotherapy and shortened survival in ovarian cancer. Clinical cancer research: an official journal of the American Association for Cancer Research. 2001;7:2984-97
5. Zeimet AG, Marth C. Why did p53 gene therapy fail in ovarian cancer? The Lancet Oncology. 2003;4:415-22
6. Pylayeva-Gupta Y, Grabocka E, Bar-Sagi D. RAS oncogenes: weaving a tumorigenic web. Nat Rev Cancer. 2011;11:761-74
7. Kennedy AL, Morton JP, Manoharan I, Nelson DM, Jamieson NB, Pawlikowski JS. et al. Activation of the PIK3CA/AKT pathway suppresses senescence induced by an activated RAS oncogene to promote tumorigenesis. Mol Cell. 2011;42:36-49
8. Ritt DA, Abreu-Blanco MT, Bindu L, Durrant DE, Zhou M, Specht SI. et al. Inhibition of Ras/Raf/MEK/ERK Pathway Signaling by a Stress-Induced Phospho-Regulatory Circuit. Mol Cell. 2016;64:875-87
9. Mabuchi S, Kuroda H, Takahashi R, Sasano T. The PI3K/AKT/mTOR pathway as a therapeutic target in ovarian cancer. Gynecol Oncol. 2015;137:173-9
10. Sheppard KE, Cullinane C, Hannan KM, Wall M, Chan J, Barber F. et al. Synergistic inhibition of ovarian cancer cell growth by combining selective PI3K/mTOR and RAS/ERK pathway inhibitors. Eur J Cancer. 2013;49:3936-44
11. Wang J, Zhou JY, Wu GS. ERK-dependent MKP-1-mediated cisplatin resistance in human ovarian cancer cells. Cancer Res. 2007;67:11933-41
12. Chao H, Wang L, Hao J, Ni J, Chang L, Graham PH. et al. Low dose histone deacetylase inhibitor, LBH589, potentiates anticancer effect of docetaxel in epithelial ovarian cancer via PI3K/Akt pathway in vitro. Cancer Lett. 2013;329:17-26
13. Menges CW, McCance DJ. Constitutive activation of the Raf-MAPK pathway causes negative feedback inhibition of Ras-PI3K-AKT and cellular arrest through the EphA2 receptor. Oncogene. 2008;27:2934-40
14. Kinkade CW, Castillo-Martin M, Puzio-Kuter A, Yan J, Foster TH, Gao H. et al. Targeting AKT/mTOR and ERK MAPK signaling inhibits hormone-refractory prostate cancer in a preclinical mouse model. J Clin Invest. 2008;118:3051-64
15. C VS, Babar SM, Song EJ, Oh E, Yoo YS. Kinetic analysis of the MAPK and PI3K/Akt signaling pathways. Mol Cells. 2008;25:397-406
16. Ince TA, Sousa AD, Jones MA, Harrell JC, Agoston ES, Krohn M. et al. Characterization of twenty-five ovarian tumour cell lines that phenocopy primary tumours. Nature communications. 2015;6:7419
17. Guntur VP, Waldrep JC, Guo JJ, Selting K, Dhand R. Increasing p53 protein sensitizes non-small cell lung cancer to paclitaxel and cisplatin in vitro. Anticancer research. 2010;30:3557-64
18. Ostrem JM, Peters U, Sos ML, Wells JA, Shokat KM. K-Ras(G12C) inhibitors allosterically control GTP affinity and effector interactions. Nature. 2013;503:548-51
19. Yang G, Mercado-Uribe I, Multani AS, Sen S, Shih Ie M, Wong KK. et al. RAS promotes tumorigenesis through genomic instability induced by imbalanced expression of Aurora-A and BRCA2 in midbody during cytokinesis. International journal of cancer. 2013;133:275-85
20. Yang F, Guo X, Yang G, Rosen DG, Liu J. AURKA and BRCA2 expression highly correlate with prognosis of endometrioid ovarian carcinoma. Modern pathology: an official journal of the United States and Canadian Academy of Pathology, Inc. 2011;24:836-45
21. Yang G, Rosen DG, Liu G, Yang F, Guo X, Xiao X. et al. CXCR2 promotes ovarian cancer growth through dysregulated cell cycle, diminished apoptosis, and enhanced angiogenesis. Clinical cancer research: an official journal of the American Association for Cancer Research. 2010;16:3875-86
22. Yang G, Rosen DG, Zhang Z, Bast RC Jr, Mills GB, Colacino JA. et al. The chemokine growth-regulated oncogene 1 (Gro-1) links RAS signaling to the senescence of stromal fibroblasts and ovarian tumorigenesis. Proceedings of the National Academy of Sciences of the United States of America. 2006;103:16472-7
23. Yang G, Chang B, Yang F, Guo X, Cai KQ, Xiao XS. et al. Aurora kinase A promotes ovarian tumorigenesis through dysregulation of the cell cycle and suppression of BRCA2. Clinical cancer research: an official journal of the American Association for Cancer Research. 2010;16:3171-81
24. van Meerloo J, Kaspers GJ, Cloos J. Cell sensitivity assays: the MTT assay. Methods in molecular biology (Clifton, NJ). 2011;731:237-45
25. Takahashi Y. Co-immunoprecipitation from transfected cells. Methods in molecular biology (Clifton, NJ). 2015;1278:381-9
26. Liu G, Yang G, Chang B, Mercado-Uribe I, Huang M, Zheng J. et al. Stanniocalcin 1 and ovarian tumorigenesis. Journal of the National Cancer Institute. 2010;102:812-27
27. Yang G, Xiao X, Rosen DG, Cheng X, Wu X, Chang B. et al. The biphasic role of NF-kappaB in progression and chemoresistance of ovarian cancer. Clinical cancer research: an official journal of the American Association for Cancer Research. 2011;17:2181-94
28. Rodriguez-Viciana P, Warne PH, Khwaja A, Marte BM, Pappin D, Das P. et al. Role of phosphoinositide 3-OH kinase in cell transformation and control of the actin cytoskeleton by Ras. Cell. 1997;89:457-67
29. White E, DiPaola RS. The double-edged sword of autophagy modulation in cancer. Clinical cancer research: an official journal of the American Association for Cancer Research. 2009;15:5308-16
30. Ouyang DY, Xu LH, He XH, Zhang YT, Zeng LH, Cai JY. et al. Autophagy is differentially induced in prostate cancer LNCaP, DU145 and PC-3 cells via distinct splicing profiles of ATG5. Autophagy. 2013;9:20-32
31. Imai T, Horiuchi A, Wang C, Oka K, Ohira S, Nikaido T. et al. Hypoxia attenuates the expression of E-cadherin via up-regulation of SNAIL in ovarian carcinoma cells. The American journal of pathology. 2003;163:1437-47
32. Parra M, Verdin E. Regulatory signal transduction pathways for class IIa histone deacetylases. Current opinion in pharmacology. 2010;10:454-60
33. Yi C, Ma M, Ran L, Zheng J, Tong J, Zhu J. et al. Function and molecular mechanism of acetylation in autophagy regulation. Science. 2012;336:474-7
34. Janes MR, Zhang J, Li LS, Hansen R, Peters U, Guo X. et al. Targeting KRAS Mutant Cancers with a Covalent G12C-Specific Inhibitor. Cell. 2018;172:578-89 e17
35. Ries S, Biederer C, Woods D, Shifman O, Shirasawa S, Sasazuki T. et al. Opposing effects of Ras on p53: transcriptional activation of mdm2 and induction of p19ARF. Cell. 2000;103:321-30
36. Drosten M, Sum EY, Lechuga CG, Simon-Carrasco L, Jacob HK, Garcia-Medina R. et al. Loss of p53 induces cell proliferation via Ras-independent activation of the Raf/Mek/Erk signaling pathway. Proceedings of the National Academy of Sciences of the United States of America. 2014;111:15155-60
37. Pi H, Li M, Zou L, Yang M, Deng P, Fan T. et al. AKT inhibition-mediated dephosphorylation of TFE3 promotes overactive autophagy independent of MTORC1 in cadmium-exposed bone mesenchymal stem cells. Autophagy. 2018:1-18
38. Sun Y, Huang YH, Huang FY, Mei WL, Liu Q, Wang CC. et al. 3'-epi-12beta-hydroxyfroside, a new cardenolide, induces cytoprotective autophagy via blocking the Hsp90/Akt/mTOR axis in lung cancer cells. Theranostics. 2018;8:2044-60
39. Ugland H, Naderi S, Brech A, Collas P, Blomhoff HK. cAMP induces autophagy via a novel pathway involving ERK, cyclin E and Beclin 1. Autophagy. 2011;7:1199-211
40. Park EJ, Umh HN, Kim SW, Cho MH, Kim JH, Kim Y. ERK pathway is activated in bare-FeNPs-induced autophagy. Archives of toxicology. 2014;88:323-36
41. Choi MC, Cohen TJ, Barrientos T, Wang B, Li M, Simmons BJ. et al. A direct HDAC4-MAP kinase crosstalk activates muscle atrophy program. Mol Cell. 2012;47:122-32
42. Zhou X, Richon VM, Wang AH, Yang XJ, Rifkind RA, Marks PA. Histone deacetylase 4 associates with extracellular signal-regulated kinases 1 and 2, and its cellular localization is regulated by oncogenic Ras. Proceedings of the National Academy of Sciences of the United States of America. 2000;97:14329-33
43. Di Giorgio E, Clocchiatti A, Piccinin S, Sgorbissa A, Viviani G, Peruzzo P. et al. MEF2 is a converging hub for histone deacetylase 4 and phosphatidylinositol 3-kinase/Akt-induced transformation. Mol Cell Biol. 2013;33:4473-91
44. Lee YH, Bae HC, Noh KH, Song KH, Ye SK, Mao CP. et al. Gain of HIF-1α under normoxia in cancer mediates immune adaptation through the AKT/ERK and VEGFA axes. Clinical cancer research: an official journal of the American Association for Cancer Research. 2015;21:1438-46
45. Karni R, Dor Y, Keshet E, Meyuhas O, Levitzki A. Activated pp60c-Src leads to elevated hypoxia-inducible factor (HIF)-1alpha expression under normoxia. The Journal of biological chemistry. 2002;277:42919-25
46. Lai HH, Li JN, Wang MY, Huang HY, Croce CM, Sun HL. et al. HIF-1α promotes autophagic proteolysis of Dicer and enhances tumor metastasis. J Clin Invest. 2018;128:625-43
47. Lin SC, Chien CW, Lee JC, Yeh YC, Hsu KF, Lai YY. et al. Suppression of dual-specificity phosphatase-2 by hypoxia increases chemoresistance and malignancy in human cancer cells. J Clin Invest. 2011;121:1905-16
48. Chen J, Kobayashi M, Darmanin S, Qiao Y, Gully C, Zhao R. et al. Pim-1 plays a pivotal role in hypoxia-induced chemoresistance. Oncogene. 2009;28:2581-92
49. Yang L, Zhou Y, Li Y, Zhou J, Wu Y, Cui Y. et al. Mutations of p53 and KRAS activate NF-kappaB to promote chemoresistance and tumorigenesis via dysregulation of cell cycle and suppression of apoptosis in lung cancer cells. Cancer Lett. 2015;357:520-6
50. Rada M, Nallanthighal S, Cha J, Ryan K, Sage J, Eldred C. et al. Inhibitor of apoptosis proteins (IAPs) mediate collagen type XI alpha 1-driven cisplatin resistance in ovarian cancer. Oncogene. 2018
51. Farrand L, Byun S, Kim JY, Im-Aram A, Lee J, Lim S. et al. Piceatannol enhances cisplatin sensitivity in ovarian cancer via modulation of p53, X-linked inhibitor of apoptosis protein (XIAP), and mitochondrial fission. The Journal of biological chemistry. 2013;288:23740-50
52. Yang X, Fraser M, Moll UM, Basak A, Tsang BK. Akt-mediated cisplatin resistance in ovarian cancer: modulation of p53 action on caspase-dependent mitochondrial death pathway. Cancer Res. 2006;66:3126-36
53. Fraser M, Bai T, Tsang BK. Akt promotes cisplatin resistance in human ovarian cancer cells through inhibition of p53 phosphorylation and nuclear function. International journal of cancer. 2008;122:534-46
54. Abedini MR, Muller EJ, Bergeron R, Gray DA, Tsang BK. Akt promotes chemoresistance in human ovarian cancer cells by modulating cisplatin-induced, p53-dependent ubiquitination of FLICE-like inhibitory protein. Oncogene. 2010;29:11-25
55. Sano M, Minamino T, Toko H, Miyauchi H, Orimo M, Qin Y. et al. p53-induced inhibition of Hif-1 causes cardiac dysfunction during pressure overload. Nature. 2007;446:444-8
56. Yamakuchi M, Lotterman CD, Bao C, Hruban RH, Karim B, Mendell JT. et al. P53-induced microRNA-107 inhibits HIF-1 and tumor angiogenesis. Proceedings of the National Academy of Sciences of the United States of America. 2010;107:6334-9
57. Sendoel A, Kohler I, Fellmann C, Lowe SW, Hengartner MO. HIF-1 antagonizes p53-mediated apoptosis through a secreted neuronal tyrosinase. Nature. 2010;465:577-83
58. Saha S, Panigrahi DP, Patil S, Bhutia SK. Autophagy in health and disease: A comprehensive review. Biomedicine & pharmacotherapy = Biomedecine & pharmacotherapie. 2018;104:485-95
59. Huang Z, Zhou L, Chen Z, Nice EC, Huang C. Stress management by autophagy: Implications for chemoresistance. International journal of cancer. 2016;139:23-32
60. Shteingauz A, Boyango I, Naroditsky I, Hammond E, Gruber M, Doweck I. et al. Heparanase Enhances Tumor Growth and Chemoresistance by Promoting Autophagy. Cancer Res. 2015;75:3946-57
61. Ji MM, Wang L, Zhan Q, Xue W, Zhao Y, Zhao X. et al. Induction of autophagy by valproic acid enhanced lymphoma cell chemosensitivity through HDAC-independent and IP3-mediated PRKAA activation. Autophagy. 2015;11:2160-71
62. Lin CI, Whang EE, Donner DB, Du J, Lorch J, He F. et al. Autophagy induction with RAD001 enhances chemosensitivity and radiosensitivity through Met inhibition in papillary thyroid cancer. Molecular cancer research: MCR. 2010;8:1217-26
63. Jin S. p53, Autophagy and tumor suppression. Autophagy. 2005;1:171-3
64. Tasdemir E, Chiara Maiuri M, Morselli E, Criollo A, D'Amelio M, Djavaheri-Mergny M. et al. A dual role of p53 in the control of autophagy. Autophagy. 2008;4:810-4
65. Tasdemir E, Maiuri MC, Galluzzi L, Vitale I, Djavaheri-Mergny M, D'Amelio M. et al. Regulation of autophagy by cytoplasmic p53. Nature cell biology. 2008;10:676-87
66. Rosenfeldt MT, O'Prey J, Morton JP, Nixon C, MacKay G, Mrowinska A. et al. p53 status determines the role of autophagy in pancreatic tumour development. Nature. 2013;504:296-300
67. Li B, Jia S, Yue T, Yang L, Huang C, Verkhratsky A. et al. Biphasic Regulation of Caveolin-1 Gene Expression by Fluoxetine in Astrocytes: Opposite Effects of PI3K/AKT and MAPK/ERK Signaling Pathways on c-fos. Frontiers in cellular neuroscience. 2017;11:335
68. Berra E, Diaz-Meco MT, Moscat J. The activation of p38 and apoptosis by the inhibition of Erk is antagonized by the phosphoinositide 3-kinase/Akt pathway. The Journal of biological chemistry. 1998;273:10792-7
69. Coward J, Ambrosini G, Musi E, Truman JP, Haimovitz-Friedman A, Allegood JC. et al. Safingol (L-threo-sphinganine) induces autophagy in solid tumor cells through inhibition of PKC and the PI3-kinase pathway. Autophagy. 2009;5:184-93
70. Bodnarchuk TW, Napper S, Rapin N, Misra V. Mechanism for the induction of cell death in ONS-76 medulloblastoma cells by Zhangfei/CREB-ZF. Journal of neuro-oncology. 2012;109:485-501
71. Zhang R, Misra V. Effects of cyclic AMP response element binding protein-Zhangfei (CREBZF) on the unfolded protein response and cell growth are exerted through the tumor suppressor p53. Cell Cycle. 2014;13:279-92
Author contact
![]() Corresponding author: Gong Yang. Cancer Institute, Fudan University Shanghai Cancer Center. 270 Dong'an Road, Shanghai, 200032, China. E-mail: yanggongedu.cn
Corresponding author: Gong Yang. Cancer Institute, Fudan University Shanghai Cancer Center. 270 Dong'an Road, Shanghai, 200032, China. E-mail: yanggongedu.cn
Citation styles
APA
Zhang, X., Qi, Z., Yin, H., Yang, G. (2019). Interaction between p53 and Ras signaling controls cisplatin resistance via HDAC4- and HIF-1α-mediated regulation of apoptosis and autophagy. Theranostics, 9(4), 1096-1114. https://doi.org/10.7150/thno.29673.
ACS
Zhang, X.; Qi, Z.; Yin, H.; Yang, G. Interaction between p53 and Ras signaling controls cisplatin resistance via HDAC4- and HIF-1α-mediated regulation of apoptosis and autophagy. Theranostics 2019, 9 (4), 1096-1114. DOI: 10.7150/thno.29673.
NLM
Zhang X, Qi Z, Yin H, Yang G. Interaction between p53 and Ras signaling controls cisplatin resistance via HDAC4- and HIF-1α-mediated regulation of apoptosis and autophagy. Theranostics 2019; 9(4):1096-1114. doi:10.7150/thno.29673. https://www.thno.org/v09p1096.htm
CSE
Zhang X, Qi Z, Yin H, Yang G. 2019. Interaction between p53 and Ras signaling controls cisplatin resistance via HDAC4- and HIF-1α-mediated regulation of apoptosis and autophagy. Theranostics. 9(4):1096-1114.
This is an open access article distributed under the terms of the Creative Commons Attribution (CC BY-NC) license (https://creativecommons.org/licenses/by-nc/4.0/). See http://ivyspring.com/terms for full terms and conditions.