Impact Factor
- Issue 14; 2026
- Issue 13; 2026
- Issue 12; 2026
- Issue 11; 2026
- Issue 10; 2026
- Volume 16; 2026
- Advance Articles
- Past Issues
- Cover Images
- Cover Suggestion
- Index & Coverage
- Special Issues
Introduction
Methods
Results
Discussion
Abbreviations
Supplementary Material
Acknowledgements
References
International Journal of Biological Sciences
International Journal of Medical Sciences
 Global reach, higher impact

Theranostics 2019; 9(4):1181-1199. doi:10.7150/thno.29093 This issue Cite
Research Paper
Resistance to lysosomotropic drugs used to treat kidney and breast cancers involves autophagy and inflammation and converges in inducing CXCL5
Sandy Giuliano1, Maeva Dufies1*, Papa Diogop Ndiaye2*, Julien Viotti3, Delphine Borchiellini4, Julien Parola2, Valérie Vial1, Yann Cormerais1, Mickaël Ohanna5, Véronique Imbert5, Emmanuel Chamorey3, Nathalie Rioux-Leclercq6, Ariel Savina7, Jean-Marc Ferrero4, Baharia Mograbi2, Gilles Pagès2 ![]()
1. Centre Scientifique de Monaco, Biomedical Department, 8 Quai Antoine Ier, MC-98000 Monaco, Principality of Monaco.
2. University Cote d'Azur (UCA), Institute for research on cancer and aging of Nice, CNRS UMR 7284; INSERM U1081, Centre Antoine Lacassagne, France.
3. Centre Antoine Lacassagne, Statistic department, Nice, France
4. Centre Antoine Lacassagne, Clinical research department, Nice, France
5. Centre Méditerranéen de Médecine Moléculaire, Nice, France
6. Department of Pathology, University Hospital, Rennes, France
7. Roche Institute
*These authors contributed equally
Received 2018-8-8; Accepted 2018-11-9; Published 2019-1-30
Abstract

Lysosomotropic agents such as sunitinib, lapatinib, and chloroquine belong to a drug family that is being used more frequently to treat advanced cancers. Sunitinib is standard care for metastatic renal cell carcinomas (mRCC) and lapatinib is used for trastuzumab/pertuzumab-refractory cancers. However, patients ineluctably relapse with a delay varying from a few months to a few years. To improve reactivity prior to relapse it is essential to identify the mechanisms leading to such variability. We showed previously that sunitinib became sequestered in lysosomes because of its basic pKa.
Methods: Modifications to gene expression in response to sunitinib and in sunitinib resistant cells were analyzed by transcriptomic and proteomic analysis. ROS production was evaluated by FACS. Nuclear Factor kappa B (NFkB)-dependent transcriptional regulation of inflammatory gene expression was evaluated with a reporter gene. Correlation of CXCL5 with survival was analyzed with an online available data base (TCGA) and using a cohort of patients enrolled in the SUVEGIL clinical trial (NCT00943839).
Results: We now show that sunitinib sequestration in lysosomes induced an incomplete autophagic process leading to activation of the NFkB inflammatory pathway. We defined a subset of inflammatory cytokines that were up-regulated by the drug either after an acute or chronic stimulus. One of the most up-regulated genes in sunitinib-resistant cells was the CXCL5 cytokine. CXCL5 was also induced in RCC by chloroquine and in a model of HER2 positive breast cancer cell lines after acute or chronic treatment with lapatinib. CXCL5 correlated to shorter survival in RCC and to the most aggressive forms of breast cancers. The levels of CXCL5 present in the plasma of patients treated with sunitinib were predictive of the efficacy of sunitinib but not of the VEGF-directed antibody bevacizumab.
Conclusion: This translational study identified CXCL5 as a biomarker of efficacy of lysosomotropic drugs, a potential asset for personalized medicine.
Introduction
In February 2018 a PubMed search using the keywords “autophagy and cancer” yielded 11,213 entries, which constitutes 30% of the 33,694 articles published on the topic “autophagy.” This massive amount of literature illustrates the interest shown in autophagy as an actor in promoting tumor growth or suppression [1]. However, the results of fifteen years of research have not answered the question as to whether cancer therapies can suppress or up-regulate autophagy, and whether up-regulation of autophagy can favor tumor cell survival or death. The exact involvement of autophagy in cancer is therefore complex and warrants a more extensive unifying model. Although critical to cancer development, the role of autophagy in cancer progression is poorly understood. Most of the studies carried out so far have focused on defects in genes related to autophagy (haplo-insufficiency of BECN1 or other ATGs in human tumors or in invalidated mouse models). We adopted a different strategy that addressed the role of autophagy in tumor progression subsequent to its inhibition by lysosomotropic drugs [2]. Indeed, the lysosomal sequestration of this type of drug and the subsequent inhibition of autophagy lead to therapeutic failure. Among the different mechanisms developed by tumor cells to escape treatment, the subcellular distribution of drugs is an essential parameter for consideration. For an optimal therapeutic effect, the intracellular localization of the target must correspond to that of the drug. Its physicochemical properties such as pKa (strength of an acid in solution) and logP (hydrophilic or hydrophobic distribution) influence their pharmacodynamics and pharmacokinetics. Lipophilic drugs (logP> 2) with ionizable amines (pKa> 6) [3] accumulate in the lysosomes passively (diffusion) and/or actively (efflux ABC pump) where they become protonated and sequestered. Although drugs defined as lysosomotropic include an increasing list of anti-cancer drugs (including the reference treatment for kidney cancer sunitinib, see below), anti-malaria drugs, β-adrenergic drugs and antidepressants [4]. Their lysosomotropic properties have not been sufficiently considered when exploring efficacy. Detecting the lysosomotropic potential and understanding the consequences of such a type of sequestration are two essential elements: i) to better understand the fundamental level of the role of autophagy in tumor resistance, and also ultimately, ii) to anticipate limited efficacy and iii) to propose personalized therapeutic solutions on relapse. This prompted us to study the role of autophagy in progression of clear cell Renal Cell Carcinoma (RCC) in response to the reference treatment sunitinib and to find specific characteristics that may be generalized to different cancers that are treated with lysosomotropic drugs. RCC is the most frequent form of kidney cancer [5-7]. However, the frequency has increased these last years. If diagnosed at a non-metastatic stage (M0) prognosis is favorable with a 95% survival rate at five years. However, when diagnosed at a metastatic stage (M1), the pathology becomes incurable. Metastatic RCC (mRCC) is generally refractory to chemo/radiotherapy. However, 80% of RCC are characterized by inactivation of the von Hippel-Lindau gene, which leads to stabilization of the Hypoxia-Inducible Factor 1 and 2α (HIF-1-2α) and subsequent stimulation of HIF target gene transcription [8]. One of the major HIF targets is the Vascular Endothelial Growth Factor (VEGF), so RCC is one of the most vascularized tumors. In the early 2000s, anti-angiogenic therapies (AAT) revolutionized the treatment mRCC. Two strategies have been used; 1) humanized anti-VEGF antibodies, bevacizumab/Avastin [9], 2) kinase inhibitors of receptors involved in tumor vascularization especially sunitinib [10], sorafenib [11] and more recently axitinib [12], pazopanib [13], cabozantinib [14] and lenvatinib [15]. The current challenge is to identify predictive markers of sunitinib efficacy while considering alternative treatments. These biomarkers may also constitute relevant therapeutic targets. When considering this challenge, we showed previously that old and new-generation AAT induced the production of VEGFC, one of the major drivers of lymphangiogenesis [16]. Sunitinib-dependent expression of VEGFC and development of lymphatics may explain the different outcomes of patients on AAT. We also identified specific cytokines of the ELR+CXCL family [17] that are relevant prognostic markers of mRCC aggressiveness [18], and one of them (CXCL7) is a new therapeutic target [19] and a predictive marker of relapse on sunitinib but not on bevacizumab [20]. However, a therapeutic decision based on only one marker is not optimal. This study therefore aimed to develop a coherent, high-throughput and non-discriminatory pipeline for the discovery of novel relevant clinical biomarkers of AAT efficacy that are linked to their lysosomotropic properties/autophagy deficiency [2]. We performed transcriptomic, mass spectrometry and proteomic analyses on sunitinib sensitive and resistant RCC cells with the aim to identify specific molecular signatures as acquired resistance to sunitinib develops; signatures that can be generalized to other cancer types and to lysosomotropic drugs. These analyses revealed specific genetic profiles associated with acute or chronic exposure to the drug. Our in vitro study revealed that the ELR+CXCL cytokine CXCL5, which belongs to the same cytokine family as CXCL7, was one of the most induced genes in sunitinib resistant cells. CXCL cytokines were also described as markers of poor prognosis in breast cancers [21]. CXCL5 expression was also induced by chloroquine (CHL) in RCC and HER2-positive model cell lines in response to lapatinib, a HER1/HER2 target drug that presents lysosomotropic characteristics [22]. These results strongly suggest that the mechanisms of resistance to sunitinib may be the same as for lapatinib, hence generalizing the concept of CXCL5-mediated lysosomotropic drug resistance. In a prospective clinical trial CXCL5 was demonstrated to be a marker of advanced disease and of relapse on sunitinib. Our work provides results showing the relevance of CXCL5 as a predictive marker of resistance to lysosomotropic drugs in different cancers. Its detection may serve as a companion test of lysosomotropic drug efficacy.
Methods
Reagents and antibodies
Sunitinib and lapatinib were samples of the drug given to patients (Centre Antoine Lacassagne, Nice, France). They were prepared as a 2.5 mmol/L stock solution in dimethyl sulfoxide (DMSO; Sigma-Aldrich) and stored at -20°C. SB203580 was purchased from Selleckchem (Houston, USA). AS602868 was a kind gift from Dr Véronique Imbert (C3M, Nice, France). Chloroquine (CHL) was purchased from Sigma (C6628). CellROX / Deep Red Reagent were from Life Technologies Corp (Carlsbad, CA). Anti-HSP60, anti-LAMP1 and anti-actin antibodies were purchased from Santa Cruz Biotechnology (Santa Cruz, CA, USA). Anti-p65 and anti-phospho-p65, anti-p38 and anti-phospho-p38 antibodies were from Cell Signaling Technology (Beverly, MA, USA). H2O2 was purchased from Sigma (H1009).
Cell culture
786-0 cells were purchased from the American Type Culture Collection and RCC10 were a kind gift from W.H. Kaelin (Dana-Farber Cancer Institute, Boston, MA). The latter have already been used. Resistant RCC cells were obtained by chronic exposure to increasing sunitinib concentrations up to 8 μmol/L. SKBR3 and BT474 cells were purchased from DSMZ. RCC and breast cancer cells were grown in DMEM supplemented with 7 or 10% FCS plus 1% of non-essential amino-acid (breast cancer cells) at 37°C in a humidified atmosphere containing 5% CO2.
Cell viability
Cells were seeded in twelve-well dishes and transiently treated with sunitinib the following day. Cell viability was assessed using the ADAM-MC apparatus (NanoEnTek) based on fluorescent propidium iodide staining performed according to the manufacturer's instructions.
Immuno-blotting
Cells treated with sunitinib were lysed in buffer containing 3% SDS, 10% glycerol, 0.825mM Na2HPO4. Protein samples (30 μg) were separated by 10% SDS-PAGE, transferred onto a PVDF membrane (Immobilon, Millipore, France) and then exposed to the appropriate antibodies: anti-phospho-p65, anti-p65, anti-phospho-p38, anti-p38 or anti-HSP60. Proteins were visualized with the ECL system using horseradish peroxidase-conjugated anti-rabbit or anti-mouse secondary antibodies.
Quantitative Real-Time PCR (qPCR) experiments
One microgram of total RNA was used for the reverse transcription, using the QuantiTect Reverse Transcription kit (QIAGEN, Hilden, Germany), with a mix of oligo (dT) and random primers to prime first-strand synthesis. The SYBR master mix plus (Eurogentec, Liege, Belgium) was used for qPCR. The mRNA level was normalized to 36B4 mRNA. For oligo sequences, see also supplemental material.
Measurement of cytokines
Supernatants of cells treated or not with sunitinib were recovered for the measurement of different interleukins and chemokines (IL6, IL8, CXCL2 and CXCL5) using the Human DuoSet ELISA kit (R&D Systems, MN, USA). Results were normalized to the cell count.
RNA sequencing
The 3′-end RNA sequencing was performed essentially as described for the digital gene expression protocol from Illumina. Duplicate RNA samples from control or sunitinib 48h-treated or resistant cells were prepared and a 3′-end tag from the polyA+-containing fraction was isolated after generation of double-stranded complementary DNA and digestion with DpnII. Fragments were sequenced on the Illumina GAII platform and annotation was performed with the Ensembl tag table software (http://research.stowers-institute.org/microarray/tag_tables/index.html). Data sets were normalized using the Bioconductor DEseq package (http://www.bioconductor.org/packages/2.6/bioc/html/DESeq.html).
Luciferase assays
Transient transfections were performed using 2 µl of lipofectamine (GIBCO BRL) and 0.5 µg of NFkB reporter according to the manufacturer's instructions. The renilla control plasmid was co-transfected with the test plasmids to control for the variability in transfection efficiency. The transfection medium was changed 4 hours later and when the indicated cells were treated with different inhibitors and/or sunitinib. 24 or 48 hours after transfection cell lysates were tested for firefly luciferase and renilla activity. All transfections were repeated 4 times.
ROS assay
Deep Red Reagent was used to assess the level of intracellular ROS. The CellROX /Deep Red reagent (which is initially non-fluorescent) freely enters the cells, where it is cleaved by endogenous esterases. After oxidization by ROS, the reagent becomes highly fluorescent with an absorption/emission maximal of 644/665 nm. Cells were treated with or without sunitinib at different time points and incubated at 37 °C with CellROX Deep Red reagent (0.01 μmol/L) for 2 h. The cells were then washed with PBS and analyzed using a fluorescence-activated cell sorter (BD healthcare FACSCALIBUR, analyzer, San Jose, CA, USA).
Gene set enrichment analysis
To identify the potential function of the hub genes, a Gene Set Enrichment Analysis (GSE was performed to search Kyoto Encyclopedia of Genes and Genomes (KEGG)/HALLMARKS and REACTOME pathways for the gene highly expressed.
The GSEA analysis was done using GSEA software version 2.2.2.0, which uses predefined gene sets from the Molecular Signatures Database (MSigDB v5.0). For the present study we used all the C collection sets for the GSEA analysis (i.e., C1-C7 collection in MsigDB) and ranked genes based on a score calculated as -log10 of P value multiplied by the fold-change. The minimum and maximum criteria for selection of gene sets from the collection were 10 and 500 genes, respectively.
Enriched transcription factors
The list of differentially expressed genes from cells treated with sunitinib compared with the non-treated cells was uploaded into the Enrichr (http://amp.pharm.mssm.edu/Enrichr/) classification system. Enrichr was used to identify over-representation of transcription factor (Transfac and Jaspar) terms in the gene list data. The most significantly enriched transcription factors were presented as graphical bars based on the list of up-factors.
Patients
Online data
Normalized RNA sequencing (RNA-Seq) data of The Cancer Genome Atlas (TCGA) were downloaded from cBiopotal (www.cbioportal.org, TCGA Provisional; RNA-Seq V2). Data were available for 534 ccRCC tumor samples. The results published here are in whole or in part based upon data generated by the TCGA Research Network: http://cancergenome.nih.gov/ [23, 24].
Independent cohort of RCC patients
Primary tumor samples of RCC patients were obtained from the Rennes University hospital [25]. DFS/PFS and OS were calculated from patient subgroups with CXCL5 mRNA levels that were less or greater than the median value (Table S5).
SUVEGIL trial (clinicaltrial.gov, NCT00943839)
The SUVEGIL trial was a multi-center prospective single-arm study. The goal of the trial was to determine whether a link exists between the effectiveness of therapy with sunitinib malate and the development of blood biomarkers in patients with kidney cancer. Patients received oral sunitinib (50 mg per day) once daily for 4 weeks (on days 1 to 28), followed by 2 weeks without treatment. Courses were repeated every 6 weeks in the absence of disease progression or unacceptable toxicity. This study was approved by the ethics committee at each participating center and run in agreement with the International Conference on Harmonization of Good Clinical Practice Guideline. Eligible patients were at least 18 years of age and had mRCC histologically confirmed, with the presence of measurable disease according to Response Evaluation Criteria in Solid Tumors v1.1. Patients had not received previous systemic therapy and were eligible for sunitinib in the first-line setting. Patients were ineligible if they had symptomatic or uncontrolled brain metastases, an estimated lifetime less than three months, uncontrolled hypertension or clinically significant cardiovascular events (heart failure, prolongation of the QT interval), history of another primary cancer (see Table S6 and S7 for patients' characteristics and responses to treatment). All patients gave written informed consent. Tumors were assessed at baseline and then every twelve weeks by thoracic, abdominal, pelvic and bone CT scans. Brain CT scans were performed in case of symptoms.
The TORAVA trial (clinicaltrial.gov, NCT00619268)
The TORAVA trial was a randomized prospective study. The patient characteristics and results have been described previously [26]. Briefly, patients aged 18 years or older with untreated mRCC were randomly assigned to receive the combination of bevacizumab (10 mg kg_1 iv every 2 weeks) and temsirolimus (25 mg iv weekly), or the combination of interferon alpha (9 mIU iv three times per week) and bevacizumab (10 mg kg_1 iv every 2 weeks). This study was approved by the ethics committee at each participating center and run in agreement with the International Conference on Harmonization of Good Clinical Practice Guidelines (see Table S6 and S7 for patients' characteristics and responses to treatment).
Efficacy and safety
Blood samples were collected during the inclusion visit (baseline) and at the end of the four weeks of sunitinib administration at each cycle for biochemical analysis. The plasma level of CXCL5 was evaluated in comparison with OS and PFS, which were defined respectively as the time from inclusion into the trial to death from all causes (for OS) and to progression, treatment cessation or death (for PFS), censored at the last follow-up for those still alive or who have not progressed.
Memorial Sloan-Kettering Cancer Centre (MSKCC/Motzer) score
The Memorial Sloan-Kettering Cancer Centre score predicts survival based on clinical and laboratory data in mRCC patients. It is a combination of: (1) the performance status (Karnofsky score)<80%, (2) the time from diagnosis to systemic treatment <12 months, (3) a hemoglobin level less than the lower limit of the normal, (4) the lactate dehydrogenase level >1.5 x above the normal limit (5) the corrected calcium level >10 mg dl-1 (2.5 mmol l-1).
Scores 0, 1-2 or ≥3 corresponding to respectively, Good, Intermediate/ Bad Risk Groups [27].
Biochemical analysis
Blood samples were centrifuged (10 000 g for 10 min) and the plasma was collected and conserved at -80°C. The CXCL5 plasma level (no dilution) was determined by ELISA using Peprotech kits (reference 900-K40).
Statistical analysis
Statistical significance and Pvalues were determined with the two-tailed t-test. The CXCL5 cut-off point (0.1 ng/ml) for PFS was determined with the spline curves analysis [20]. The Kaplan-Meier method was used to produce survival curves and analyses of censored data were performed using the log-rank test.
Results
Autophagy, lysosomes, reactive oxygen species and cytokine-dependent signaling pathways are activated in response to lysosomal sequestration of sunitinib
We first evaluated by RNA sequencing the consequences of acute exposure to sunitinib and of lysosomal sequestration of sensitive 786-O cells. We generated a list of genes with a minimal two-fold increase/decrease and evaluated with GSEA the enrichment of pathway clusters. GSEA analysis indicated significant enrichment in the KEGG terms “regulation of autophagy” (p=0.00000001) and “lysosome” (p<0.01) (Figure 1A-B). The complete list of corresponding genes altered in sunitinib sensitive cells is shown in Tables S1 and S2.
Sunitinib modified the gene expression profile of RCC cells. (A) Enrichment in the KEGG terms “Autophagy, Lysosome, ROS Pathway and Cytokine”; P values and the normalized enrichment scores (NES) are indicated. (B) Heatmaps of the most up-regulated pathways in untreated 786-O cells (C1, C2) or after incubation for 48 hours with sunitinib 2.5 μmol/L (S1, S2). (C) Determination of ROS production by cells treated with 2.5 μmol/L sunitinib for the indicated times. H2O2 served as a positive control of ROS production. (D) Heatmaps of the most up-regulated inflammatory cytokines (IL6, IL8/CXCL8, CXCL2, CXCL5) in untreated 786-O cells (C1, C2) or after incubation for 48 hours with sunitinib 2.5 μmol/L (S1, S2). (E) Comparison of the mRNA levels evaluated by qPCR of untreated cells or after treatment of cells for 48 hours with sunitinib 2.5 μmol/L or chloroquine 10 μmol/L (CHL). P values are indicated; * p < 0.05; ** p < 0.01; *** p < 0.001.
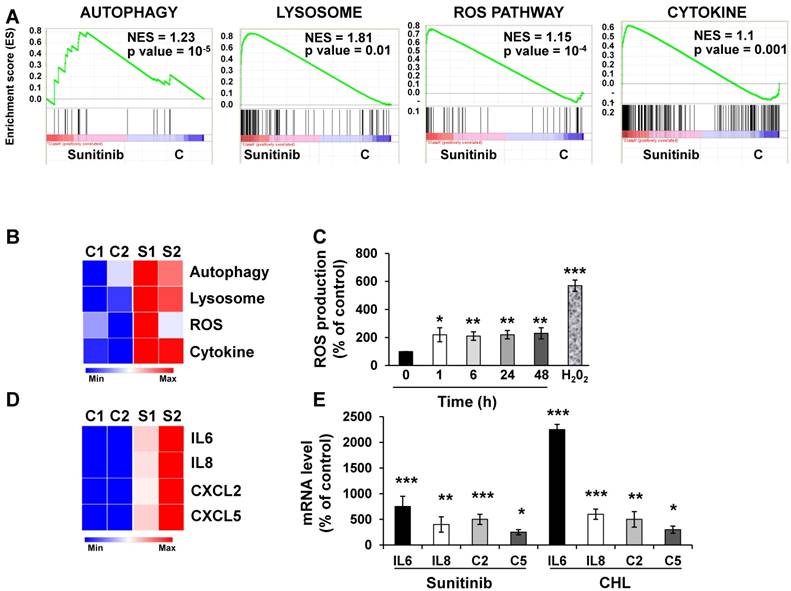
We then hypothesized that alterations in autophagy and in lysosomal function may lead to cellular stress. Moreover, inhibition of autophagy resulted in accumulation of mitochondria and subsequent Reactive Oxygen Species (ROS) production [28]. Highly significant enrichment was observed for the hallmark “ROS pathway” in the transcriptomic analysis (Figure 1A-B). Consistent with this, sunitinib increased ROS production, which was determined by flow cytometry (Figure 1C).
ROS may affect redox-sensitive molecules in cancer cells, which leads to stimulation of proliferation and/or differentiation, to alteration of the sensitivity to anti-cancer agents, to mutations, genetic instability and carcinogenesis [29]. Several studies identified a link between ROS production and the inflammatory response. Therefore, ROS are key signaling molecules that play an important role in different inflammatory diseases [30-32], and also cancer, aging, diabetes, obesity and neurodegeneration [33].
GSEA analysis identified enrichment in “cytokine signaling pathway” (Figure 1A-B). RNA sequencing analysis revealed an increase in interleukin 6 and 8 (IL6, IL8/CXCL8), CXCL2 and CXCL5 mRNA levels after sunitinib treatment (Figure 1D). These results were confirmed by RT-qPCR (Figure 1E). CHL, a lysosomotropic agent that inhibits lysosomal function, increased IL6, IL8/CXCL8, CXCL2 and CXCL5 mRNA levels, which were equivalent to that stimulated by sunitinib (Figure 1E). These results suggest that inhibition of the lysosomal activity leads to a deficiency in autophagy, which induced ROS production and a subsequent inflammatory response.
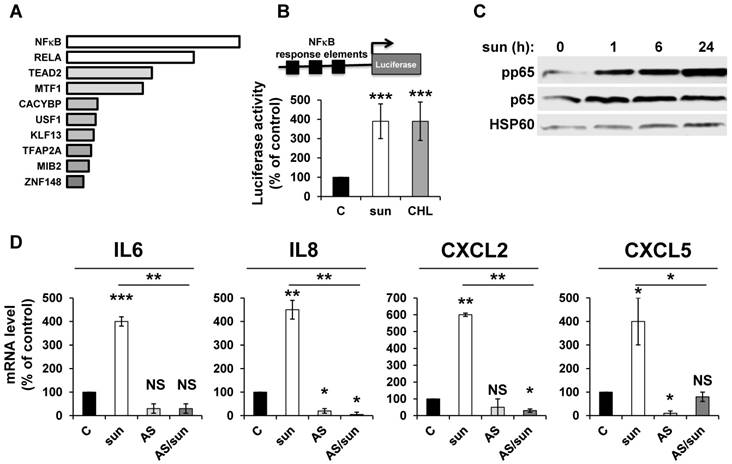
NFκB is activated by sunitinib and drives the up-regulation of inflammatory cytokines
ROS-induced cytokine production occurs either directly or following activation of NFκB in different systems [34]. We hypothesized that NFκB is required for sunitinib-dependent inflammatory modifications. A transcriptomic analysis showed a high level of enrichment for specific transcription factors, the two most enriched signatures were NFκB1 and the NFκB related gene RELA (Figure 2A). NFκB activation was confirmed by two independent methods: i) a cell-based assay using an artificial promoter containing NFκB response elements upstream of the luciferase reporter gene. Increased luciferase activity following sunitinib treatment is a read-out of the sunitinib-dependent activation of NFκB (Figure 2B); and ii) an increase in p65 phosphorylation following one hour of sunitinib treatment (Figure 2C). We further checked that CHL stimulated the 'NFκB' reporter gene to the same extent. This suggested that destabilization of lysosomes and the subsequent inhibition of autophagy are responsible for NFκB activation. The NFκB-dependent induction of the above-mentioned cytokines was assessed using a pharmacological inhibitor (AS602868) of the IκB kinase. Indeed, AS602868 (AS) prevented sunitinib-dependent induction of IL6, IL8/CXCL8, CXCL2 and CXCL5 mRNA (Figure 2D). Hence, following sunitinib treatment and subsequent autophagy/lysosomal deregulation, RCC cells exhibited an enhanced NFκB activity that shapes their secretome.
Adaptation to sunitinib depends on a genetic program involving the NFκB transcription factor. (A) NFκB and RELA were the most enriched transcription factors following sunitinib treatment (2.5 μmol/L for 48 hours). (B) A reporter gene containing three NFκB binding sites was transfected in untreated (C), sunitinib (sun, 2.5 μmol/L) or chloroquine-treated (CHL, 10 μmol/L) 786-O cells treated for 48 hours. The percentages or normalized luciferase counts are shown. (C) 786-O cells were incubated in the presence of sunitinib 2.5 μmol/L for the indicated times. The total (p65) and phosphorylated (pp65) forms of NFκB were detected by immuno-blotting; HSP60 is shown as a loading control. (D) 786-O cells were left untreated (C) or incubated for 48 hours in the presence of sunitinib (2.5 μmol/L) combined or not with AS602868 (AS, 2.5 μmol/L). The mRNA levels of IL6, IL8/CXCL8, CXCL2 and CXCL5 were evaluated by qPCR. P values are indicated; * p < 0.05; *** p < 0.001.
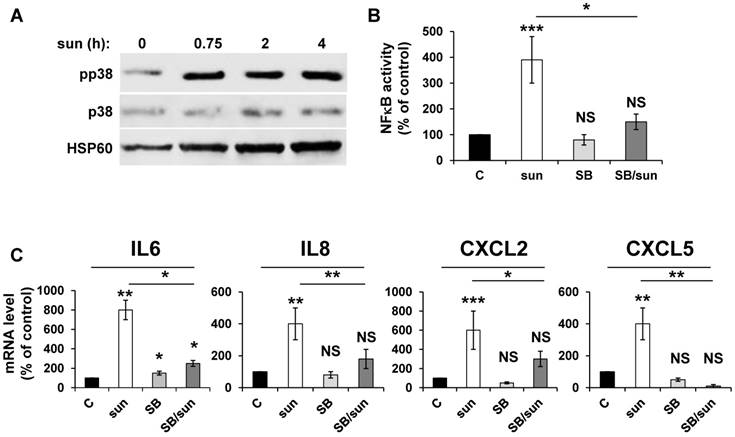
Inhibition of p38/MAP kinase prevents NFκB-dependent modification of the secretory phenotype in response to sunitinib
Any anti-cancer treatment is a stress for tumor cells. So, we examined stress kinase pathways [35]. We focused particularly on the p38/MAP kinase pathway because of its activation in response to ROS [36]. We observed that sunitinib induced rapid activation of p38/MAP kinase, as assessed by the presence of its phosphorylated form (pp38) (Figure 3A), which confirmed previous results [16]. CHL also stimulated p38/MAP kinase suggesting that the inhibition of autophagy resulted in the activation of stress kinase pathways (Figure S1). The p38/MAP kinase is indirectly linked to NFκB activation through the “Mitogen and Stress activated protein Kinase (MSK)” [37]. Therefore, we investigated the link between p38/MAP kinase and NFêB activation using the above-mentioned 'NFκB' luciferase reporter gene. Inhibition of p38/MAP kinase by SB203580 significantly decreased the NFκB-dependent transcriptional activity (Figure 3B). Subsequently, p38/MAP kinase inhibition by SB203580 prevented the sunitinib-dependent increase in IL6, IL8/CXCL8, CXCL2 and CXCL5 mRNA (Figure 3C). Hence, sunitinib induced ROS-dependent p38/MAP kinase activation leading to enhanced production of chemokines and interleukins through a genetic program orchestrated by NFκB.
Activation of the NFκB pathway in response to sunitinib relies on induction of the p38/MAP Kinase pathway. (A) 786-O cells were incubated in the presence of sunitinib (2.5 μmol/L) for the indicated times. The total (p38) and phosphorylated (pp38) forms of p38 MAP Kinase were detected by immuno-blotting; HSP60 is shown as a loading control. (B) A reporter gene containing three NFκB binding sites were transfected into 786-O cells either untreated (C), or treated with sunitinib (sun, 2.5 μmol/L) in the presence of the p38 MAP Kinase inhibitor SB203580 (10 μmol/L) for 48 hours. The percentages or normalized luciferase counts are shown. (C) 786-O cells were left untreated (C) or incubated for 48 hours in the presence of sunitinib (2.5 μmol/L) in combination or not with SB203580 (SB, 10 μmol/L). The mRNA levels of IL6, IL8/CXCL8, CXCL2 and CXCL5 were evaluated by qPCR. P values are indicated; * p < 0.05; ** p < 0.01; *** p < 0.001.
The ROS-dependent modification of the secretory landscape persists in sunitinib resistant cells
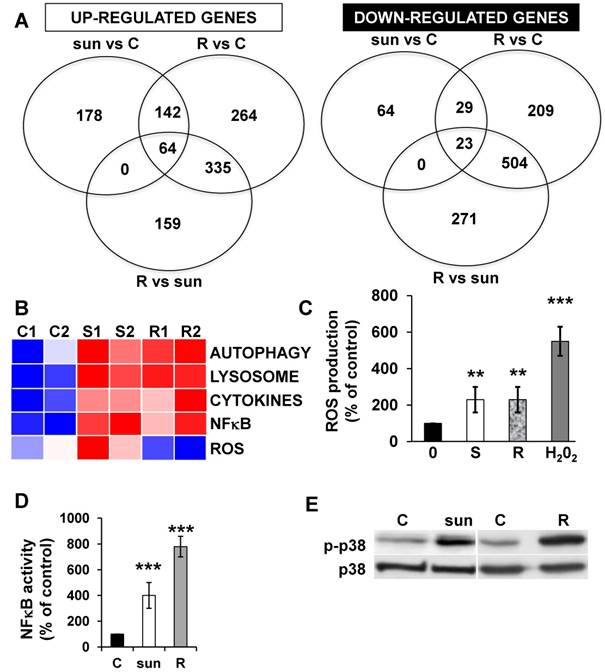
Adaptation to sunitinib may depend on an acute or chronic modification to gene expression. Therefore, we evaluated the transcriptomes and proteomes of cells exposed for 48 hours to sunitinib and to the already described cells that are resistant to chronic exposure to sunitinib [2]. The up- or down-regulated genes of resistant cells are listed in Tables S3 and S4.
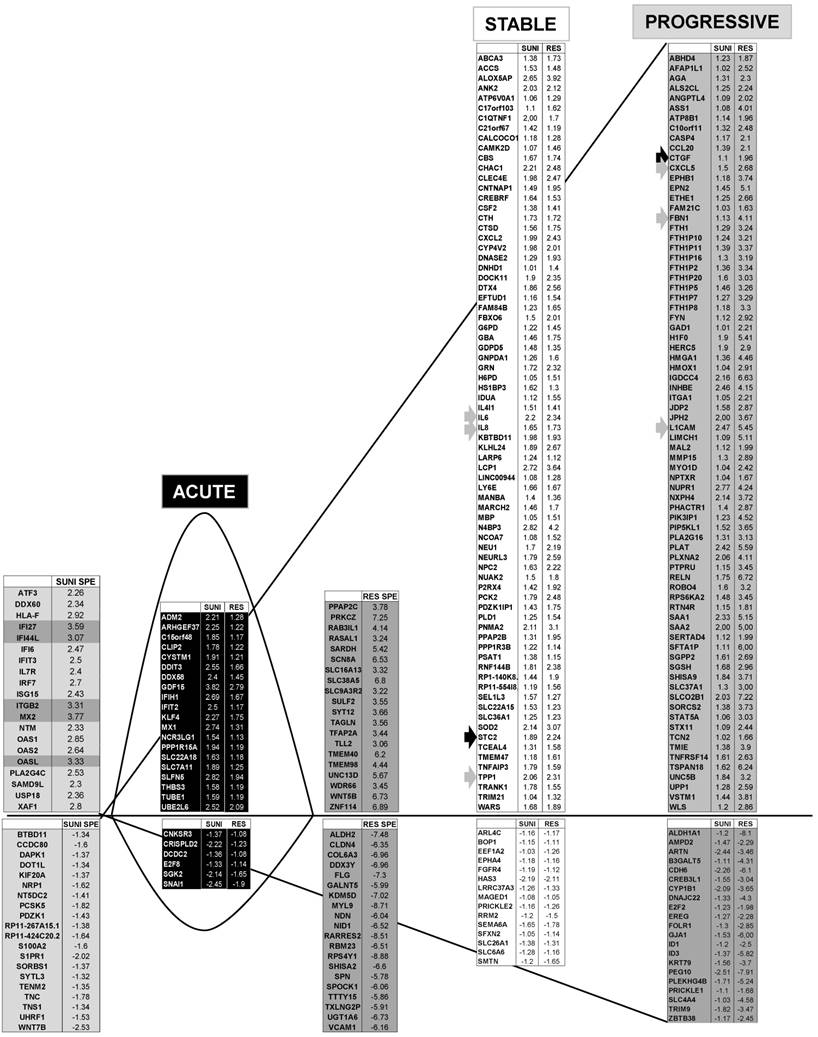
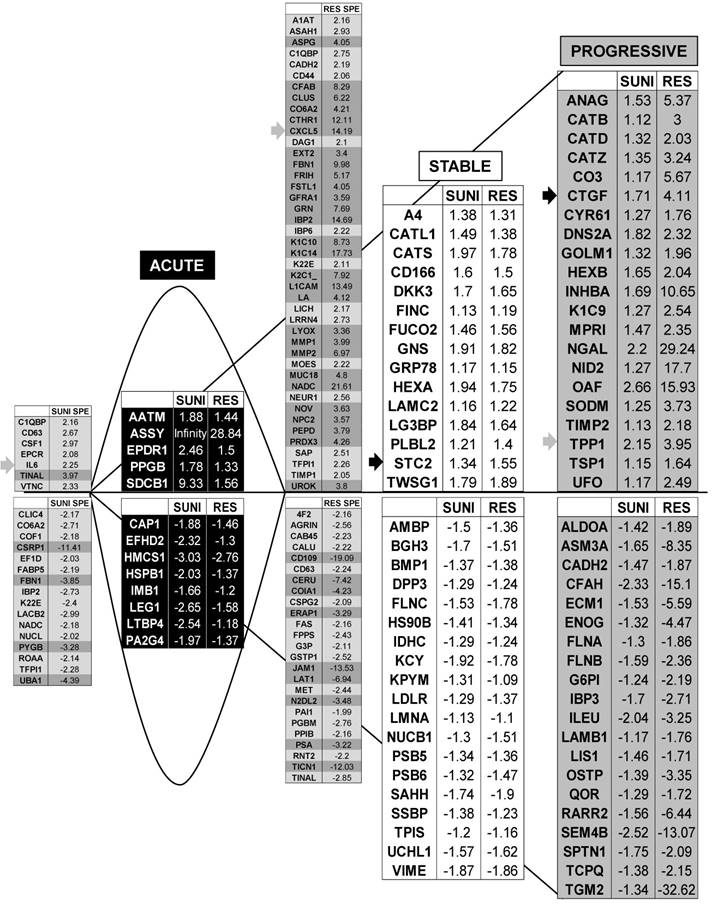
We identified 142 (52.6%) common up-regulated and 29 (1%) common down-regulated genes in cells transiently or chronically exposed to sunitinib (Figure 4A). Significant enrichment in the KEGG terms “regulation of autophagy” (p=0.00000001), “lysosome” (p<0.01), “cytokines” (p<0.01), “NFκB” (p<0.01) but not “ROS” (Figure 4B) was still present in transiently and chronically treated cells. Equivalent levels of production of ROS and of activation of NFκB and p38/MAP kinase were observed for both treatment types (Figure 4C-E) suggesting genetic adaptation to the chronic presence of ROS. To obtain further insight into the molecular mechanism associated with these modifications, we performed a proteomic analysis on the secretome of transiently or chronically-treated cells. By comparing the transcriptomic and proteomic analyses, we observed three independent responses to the drug: i) an acute phase with genes/proteins induced or repressed in response to sunitinib with a subsequent trend to return to initial values, ii) a stable phase with genes/proteins that are induced/repressed to an equivalent level after short or long exposure to sunitinib, iii) a progressive phase with genes that were induced/repressed by sunitinib and even further induced/repressed in resistant cells (Figure 5 and 6). Only three genes were consistently up-regulated at the mRNA and protein levels; stanniocalcin 2 (STC2, https://www.ncbi.nlm.nih.gov/gene/8614), a secreted, homodimeric glycoprotein, which promotes cell proliferation and cisplatin resistance in cervical cancer [38]; connective tissue growth factor (CTGF, https://www.ncbi.nlm.nih.gov/gene/1490), a mitogen related to platelet-derived growth factor that promotes the proliferation, migration and invasion of squamous cell carcinoma [39]; tripeptidyl peptidase 1 (TTP1, https://www.ncbi.nlm.nih.gov/gene?Cmd=DetailsSearch& Term=1200), a lysosomal serine protease shown to positively regulate Extracellular Signal Regulated Kinase (ERK)/MAP Kinase activity and therefore cell proliferation [40]. Whereas STC2 and CTGF belong to “Stable or Progressive” genes at the mRNA and protein levels, TPP1 belongs to “Stable” genes at the mRNA level but to “Progressive” genes at the protein level. Surprisingly, the genes corresponding to the inflammatory signature, especially IL6, IL8/CXCL8, CXCL2 and CXCL5 were not consistently induced acutely, stably or progressively at the mRNA and protein levels. IL6 was stably up-regulated at the mRNA level after short or long exposure to sunitinib but was up-regulated at the protein level only after a short sunitinib treatment. IL8/CXCL8 was stably induced by short and long exposure to sunitinib at the mRNA level but at the protein level (1.17-fold induction (log2) only after a chronic stimulus, which does not appear on the figure because the fold induction was < 2, see Tables S1 and S3). CXCL2 mRNA induction was stable after short or chronic stimulation with sunitinib but it was not stimulated at the protein level. CXCL5 appeared as a “Progressive” gene at the mRNA level but only as one of the most up-regulated genes (14.19-fold (log2)) in resistant cells at the protein level. Hence, CXCL5 represents a specific “signature” present in the secretome of resistant cells occurring in response to a lysosomotropic drug.
The p38/MAP Kinase and NFκB pathways are activated in sunitinib resistant cells. (A) A Venn diagram of genes up- or down-regulated in sensitive or resistant sunitinib cells. (B) Heatmaps of the most up-regulated pathways (Autophagy, Lysosome, Cytokines, NFκB and ROS) for untreated 786-O cells (C1, C2) or after incubation for 48 hours with sunitinib 2.5μmol/L (S1, S2) and in sunitinib resistant cells (R1, R2). (C) Determination of ROS production in cells treated with 2.5 μmol/L sunitinib for 48 hours in sunitinib sensitive (S) and resistant (R) cells. H2O2 serves as a positive control of ROS production. (D) A reporter gene containing three NFκB binding sites was transfected into either untreated (C) or sunitinib (sun, 2.5 μmol/L) treated 786-O cells and sunitinib resistant 786-O cells. The percentages or normalized luciferase counts were measured for 48 hours post transfection. (E) The total (p38) and phosphorylated (pp38) forms of p38 MAP Kinase were detected by immuno-blotting in naïve (C) or sunitinib treated for 24 hours (sun, 2.5 μmol/L) 786-O cells and sunitinib resistant (R) 786-O cells. HSP60 is shown as a loading control.
Transcriptomic analysis revealed common and specific genetic programs in sunitinib sensitive and resistant cells. Fold induction/repression (log2) is shown. We defined four different genetic responses: Acute; Genes induced/repressed by sunitinib in sensitive cells for which expression returns to basal levels but remains above/below basal levels in resistant cells; Stable; Genes induced/repressed equivalently in sunitinib sensitive and resistant cells; Progressive; Genes induced/repressed in sunitinib sensitive cells and further induced/repressed in sunitinib resistant cells; Specific; response of sunitinib sensitive and resistant cells; Genes that are specifically induced/repressed in sunitinib sensitive and resistant cells. The twenty most induced/repressed genes are indicated. Genes for which fold induction/repression was above/below 3/-3 are indicated in dark grey. The grey arrow indicates a gene which is in a different category (Acute, Stable Progressive) in transcriptomic and proteomic analyses; a black arrow indicates a gene which is in the same category in transcriptomic and proteomic analyses (see Figure 6).
The CXCL5 protein is induced in sunitinib resistant cells
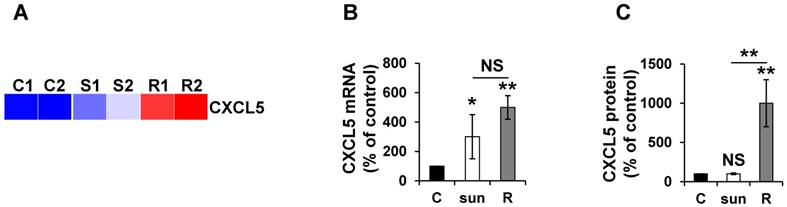
Given the absence of a strict correlation between the mRNA and protein expression, we more specifically analyzed CXCL5 expression in different mRCC cells sensitive or resistant to sunitinib. Omic analyses confirmed the differences observed and showed that the mRNA and protein levels did not correlate to short-term stimulation in the 786-O reference cell line and an independent mRCC cell line. Indeed, CXCL5 was induced at the mRNA level in 786-O cells after short- and long-exposure to sunitinib (qPCR, Figure 7A). However, CXCL5 protein levels were only up-regulated in resistant cells (ELISA, Figure 7B). Equivalent induction at the protein level was observed in RCC10 cells [2] but only after chronic exposure to the drug (Figure S2).
Proteomic analysis showed that genes from sunitinib sensitive and resistant cells can be classified in a manner equivalent to that described for the transcriptomic analysis. The four equivalent categories were defined; Acute, Stable, Progressive and Specific. The same colors for the background and the arrows were chosen.
CXCL5 expression is differently up-regulated at the mRNA and protein levels in sunitinib sensitive and resistant cells. (A) Heatmaps of CXCL5 for untreated 786-O cells (C1, C2) or after incubation for 48 hours with sunitinib 2.5 μmol/L (S1, S2) and for sunitinib resistant cells (R1, R2). (B) CXCL5 mRNA levels were evaluated by qPCR in control (C), 48-hour sunitinib (2.5 μmol/L) treated 786-O cells and sunitinib resistant 786-O cells. (C) CXCL5 protein levels were evaluated by ELISA in control (C), 48-hour sunitinib (2.5 μmol/L) treated cells and sunitinib resistant 786-O cells. P values are indicated; * p < 0.05; ** p < 0.01; NS, not significant.
CXCL5 induction is a common signature of HER2-positive breast cancer cells treated with lapatinib
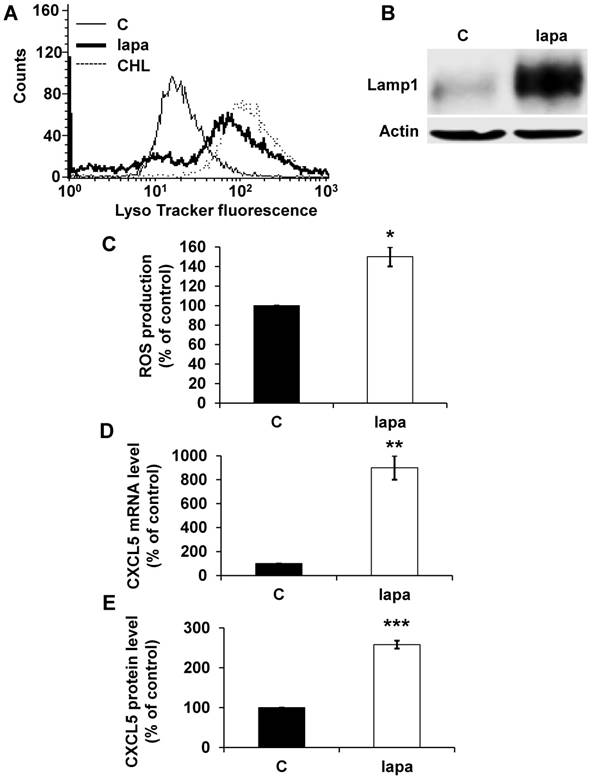
To confirm the general concept that lysosomotropic drugs tailor the secretome of tumor cells to induce resistance we tested the consequence of lapatinib treatment on HER2-positive breast cancer (SKBR3). Lapatinib has a pKa of 7.2 and a cLogP of 5.2 (https://www.drugbank.ca/drugs/), two characteristics of lysosomotropic drugs [4]. Lapatinib sequestration in lysosomes resulted in an increase in the lysosomal mass (Figure 8A), in an increase in expression of LAMP1 (Figure 8B) and up-regulation of ROS (Figure 8C). The same results were obtained for another HER2-positive cell line BT474 (Figure S3A, B). CXCL5 expression was up-regulated both at the mRNA (Figure 8D) and protein levels (Figure 8E) in SKBR3 cells and in BT474 cells (Figure S3C). These findings point to the important notion that induction of CXCL5 expression is as a common pro-inflammatory/pro-angiogenic response to lysosomotropic drug sequestration (sunitinib, CHL and lapatinib) in breast and kidney cancers.
The lysosomotropic drug lapatinib stimulated CXCL5 expression in breast cancer cells. The fluorescence of the lysosomal probe (LysoTracker Red DND-99, Lyso) was evaluated by FACS analysis after 72 hours of treatment (5 μmol/L). (B) Cell extracts from control (C) or lapatinib (lapa, 5 μmol/L) 48-hour treated SKBR3 cells were tested for LAMP1 expression by immuno-blotting. Actin is shown as a loading control. (C) Determination of ROS production in cells treated with 5 μmol/L lapatinib for 48 hours. (D) CXCL5 mRNA levels were evaluated by qPCR in control (C), lapatinib (5 μmol/L) 48-hour treated SKBR3 cells. (E) CXCL5 protein levels were evaluated by ELISA in control (C) and lapatinib (5 μmol/L) 48-hour treated SKBR3 cells. P values are indicated; ** p < 0.01; *** p < 0.001.
CXCL5 is a prognostic marker of tumor aggressiveness and a predictive marker of sunitinib efficacy
We then considered the possibility that CXCL5 can be a relevant prognostic marker of survival and also a predictive indicator of relapse to sunitinib.
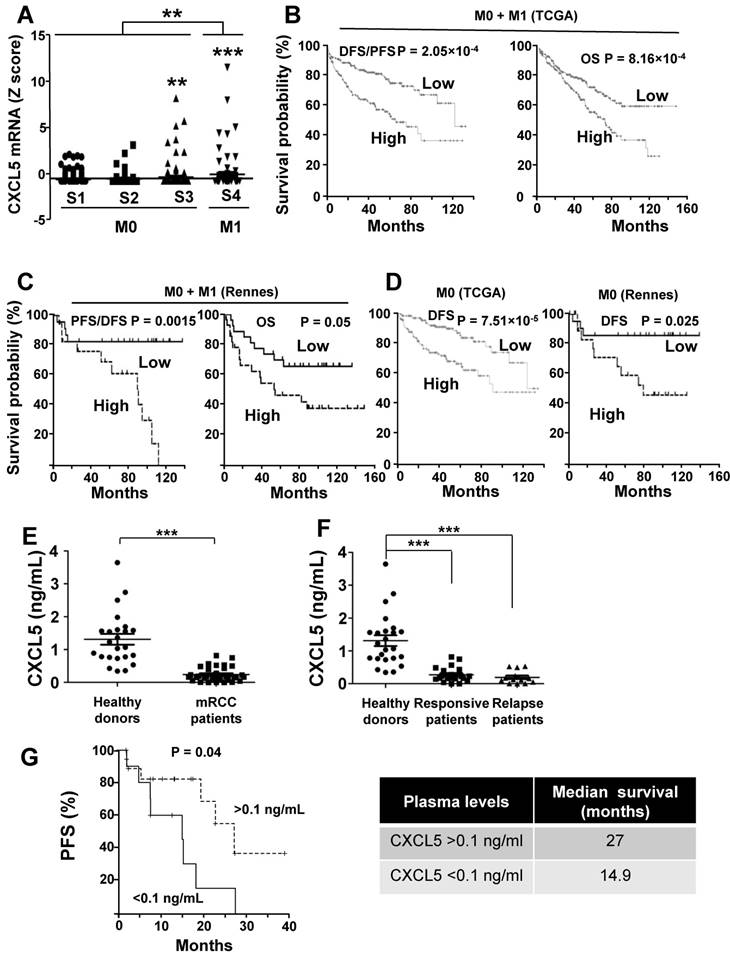
As a first approach, we analyzed the online cBioPortal/TCGA database of the 528 patients for the significance of CXCL5 as a prognostic marker of survival. 425 samples were from M0 and 103 from M1 patients. High CXCL5 mRNA levels correlated with tumor stage and the metastatic status (Figure 9A). When the complete cohort was considered (M0 + M1), the CXCL5 mRNA level, which was above the median value, correlated with disease free/progression free survival (DSF/PFS, median survival 67 versus 124 months) and overall survival (OS, 73 months versus not reached) (p = 2.05e-4 and p = 8.16e-4 respectively, Figure 9B). The same trend was observed for a cohort of patients from the Rennes Hospital (Table S5 gives the patients' characteristics). CXCL5 levels above the median value correlated with shorter DFS/PFS (median survival 90 months versus not reached, p = 0.015) and OS (54 months versus not reached, p = 0.05) (Figure 9C). Markers of progression towards a metastatic disease for M0 patients were missing. Therefore, we analyzed the relevance of CXCL5 as an indicator of relapse in the TCGA and Rennes cohort of patients. CXCL5 levels above the median value correlated with shorter DFS in these two independent cohorts (81 months versus not reached (TCGA), 78 months versus not reached (Rennes), p = 7.51e-5 and p = 0.025 respectively, Figure 9D). We also analyzed the prognostic significance of CXCL5 for breast cancers. A gradation in terms of aggressiveness exists for tumors that express hormone receptors (estrogen and progesterone) or HER2 (a receptor belonging to the EGF receptor family) or neither of these two, which is qualified as triple negative breast cancers (TNBC). We observed an increase in CXCL5 expression in the different subgroups of breast cancer from the least to the most aggressive (Figure S4A, p < 0.0001). CXCL5 levels above the median value were indicative of good prognosis for hormone receptor positive and HER2 positive patients (200 months with an early statistically significant difference p = 0.0062 and 75 months versus not reached, p = 0.018, respectively, Figure S4B-C) whereas the opposite situation was observed for node positive TNBC (20 months versus 65 months, p = 0.03, Figure S4D). Although intra-tumor levels of a specific marker may represent a first approach, a more reliable method is necessary to introduce its detection into clinical practice. Moreover, the method must be easily performed and non-invasive for the patients. A blood test meets these criteria. Hence, we compared CXCL5 levels in the plasma of 24 healthy donors and 37 mRCC patients (following surgical removal of the primary tumor) of a prospective cohort of patients treated with sunitinib (SUVEGIL, the characteristics of the patients and response to the treatment are given in Table S5 and S6). The plasma level of CXCL5 was lower in mRCC patients as compared to healthy patients [41] (Figure 9E). Patients that relapse on sunitinib had decreased plasmatic CXCL5 levels compared to responsive patients. Their CXCL5 plasmatic concentrations were significantly different as compared to healthy donors (Figure 9F). The above-mentioned results seemed discrepant (high tumor levels correlated with poor prognosis and high plasmatic levels correlated with good prognosis).
CXCL5 is a marker of poor prognosis and a predictive marker of sunitinib efficacy. (A) Analysis of cbioportal database highlighted the levels of CXCL5 mRNA in M0 stages 1, 2 or 3 or M1 stage 4 patients. (B) Kaplan-Meier analysis of DFS/PFS and OS of all patients (M0 + M1) from the cbioportal database. The PFS and OS were calculated from patient subgroups with mRNA levels of CXCL5 that were less or greater than the median value. (C) Kaplan-Meier analysis of DFS/PFS and OS of patients (M0 + M1) from a cohort generated by the Rennes University Hospital. DFS/PFS and OS were calculated from patient subgroups with mRNA levels of CXCL5 that were less or greater than the median value. (D) Kaplan-Meier analysis of DFS of M0 patients from the cbioportal database or from the Rennes cohort of patients. DFS were calculated from patient subgroups with mRNA levels of CXCL5 that were less or greater than the median value. (E, F) The plasma levels of CXCL5 of healthy donors or mRCC patients were determined by ELISA. (G) Kaplan-Meier analysis of PFS of patients with mRCC treated with sunitinib. PFS was calculated from patient subgroups with plasma levels of CXCL5 at diagnosis that were less or greater than a cut-off value of 0.1 ng ml_1, for SUVEGIL trial. Median survival for the two groups of patients is indicated. P values are also indicated; *** p < 0.001.
However, the intra-tumor CXCL5 mRNA amounts and the plasmatic CXCL5 levels were inversely correlated (correlation coefficient (CC) = -0.96, Figure S5A). CXCL5 stimulates angiogenesis and inflammation and is physiologically produced by monocytes [42] and platelets [43]. Our results suggest that both cell types are attracted to the tumor site, hence exhausting plasmatic levels of CXCL5, a situation that we already described for CXCL7 [20].
To precisely address the sequence of events observed in patients, we obtained xenografts of human RCC cells in nude mice as already described (Figure S5B) [20]. Mouse plasmatic CXCL5 levels were decreased in mice bearing “human tumors” (Figure S5C) a situation mimicking that observed for patients. Moreover, human CXCL5 was released into the plasma of mice with a tumor (Figure S5D) suggesting that the total CXCL5 plasmatic level comes from tumor cells and cells of the microenvironment (no cross reactivity between ELISA tests). An equivalent inverse correlation (CC = -0.81) between the plasmatic and intra-tumor CXCL5 levels was observed in experimental tumors suggesting strongly that plasmatic cells producing CXCL5 were attracted to the tumor (Figure S5E). We already showed that these experimental tumors were highly infiltrated by natural killers (NK), macrophages and neutrophils [20]. Therefore, we examined the CXCL5 level in their presence, which was estimated by analyzing specific genes by qPCR (primer corresponding to these different genes were already described [20]). A strong correlation was observed between mouse CXCL5 (M C5) and the presence of neutrophils (N, CC = 0.99, lipocaline 2 (LCN2) and ELANE mRNA). Mouse CXCL5 did not correlated with M1 macrophages (M1, inducible nitric oxide synthase (iNOS) and interleukin 1 beta (IL1®) mRNA) but was correlated with M2 macrophages (M2, CC = 0.91, arginase 1 (ARG1) and macrophage mannose receptor C type-1 (MRC1) mRNA), which is consistent with the correlation between N and M2 (CC = 0.9). Human CXCL5 was correlated with high levels of mouse CXCR2 (MCR2, CXCL5 receptor) (CC = 0.85) and mouse CXCL5 was correlated with high mouse CXCR1 (MCR1, the other CXCL5 receptor) (CC = 0.63) levels. CXCR1 and 2 are physiologically expressed on neutrophils and macrophages (correlation between CXCR1 and N, CC = 0.6 and correlation between CXCR1 and M2, CC = 0.58) (Figure S5F). These results suggest that immune cells producing CXCL5 in the plasma colonized the tumors and participated in tumor growth through inflammatory and proliferative signals.
The purpose of our study was then to correlate the CXCL5 level with survival for patients treated with sunitinib. Patients with CXCL5 plasma levels below 0.1 ng/ml (range 0-0.1 ng/ml) at diagnosis had a PFS of 14.9 months compared to 27 months for patients whose plasma levels were above 0.1 ng/ml (range: 0.1-0.82 ng/ml, p = 0.04, Figure 9G). Hence, although high levels of CXCL5 correlated with poor prognosis, they influenced the positive response to sunitinib. To confirm the predictive role of CXCL5 on sunitinib efficacy, we analyzed the response to another AAT, bevacizumab (BVZ) combined with interferon alpha/interferon alpha or temsirolimus in an independent prospective cohort of patients (TORAVA), taking into account the same threshold value for CXCL5 plasma levels (above or below 0.1 ng/ml, the characteristics of the patients and the response to the treatments are given in Tables S6 and S7). The CXCL5 levels did not influence PFS following bevacizumab/interferon alpha or bevacizumab/temsirolimus treatment confirming the specificity of the predictive role for sunitinib efficacy (Figure S6A-B, Table S6 and S7).
Discussion
Pharmacological inhibition of autophagy with lysosomotropic drugs has become a priority for new chemotherapies for advanced cancers. More than 500 patent applications have been filed so far. Approximately 1000 cancer clinical trials are underway or have been completed using this drug family (550 for sunitinib, 314 for lapatinib and 54 for CHL or hydroxychloroquine; http://www.clinicaltrial.gov). However, despite this massive investment, the side effects of autophagy inhibitors for metastatic disease and particularly the acquisitions of chemoresistance remain elusive and need to be investigated. In addition, the molecular mechanisms of autophagy in relation to inflammation have not been clearly identified. Several studies linked the loss of autophagy and production of inflammatory cytokines by macrophages and dendritic cells but whether this connection exists in cancer cells in still under debate [44]. Hence, detailed characterization of the tumor secretome and of underlying signaling pathways may increase the understanding of the role of a defect in autophagy in cancer progression/resistance and may improve current therapies. A high throughput transcriptomic and proteomic analysis clearly showed that inhibition of autophagy by three members of the lysosomotropic drug family (sunitinib, CHL, and lapatinib) lead to an inflammatory response with production of chemokines in cancer cells. Their release into the tumor microenvironment stimulated the proliferation of cancer cells, as well as epithelial to mesenchymal transition (EMT) and angiogenesis therefore resulting in accelerated dissemination of metastasis [45, 46]. Our results indicated that the production of ROS and activation of the p38/MAP kinase pathway are rapid events following inhibition of autophagy by sunitinib, CHL or lapatinib. Our results are consistent with earlier observations showing that CHL markedly stimulated the p38 MAP Kinase activity in different models (tumor cells, lymphocytes or yeast) [47-49].
We showed that p38/MAP kinase participated in NFκB activation but identification of the molecular intermediates between the two actors needs further investigation. MSK1 is a nuclear kinase that is activated downstream of p38/MAP kinase and extracellular signal-regulated kinases (ERK1/2). The link between MSK1 and NFκB has already been described [50]. Hence, MSKs may connect p38/MAP kinase activation to NFκB signaling in response to sunitinib. In addition, p38 MAPK has been characterized as a critical enhancer of the accessibility of NFκB binding sites to phosphorylation and phospho-acetylation of histone H3 [51]. However, activation of p38/MAP kinase is rapid and is probably a key factor during the initial positive response to sunitinib. The MEK/ERK signaling pathway is constitutively activated in experimental RCC and slightly inhibited by sunitinib. However, the MEK inhibitor PD-0325901 reverts resistance to sunitinib [52] suggesting that the p38 and ERK/MAP kinases pathways coordinate genetic programs leading to relapse when on sunitinib. Their specific inhibition may revert resistance to sunitinib through the down-regulation of CXCL5.
Proteins secreted by cancer cells into the tumor microenvironment subsequently enter body fluids such as blood and urine and can be exploited as disease biomarkers for diagnostic and prognostic purposes. We identified CXCL5 as a prognostic maker of tumor aggressiveness and as a predictive marker of therapy efficacy in mRCC, in response to the lysosomotropic drug sunitinib as already suggested by Diaz-Montero et al [52]. The situation is more complex for breast cancer since high CXCL5 levels correlated with good prognosis in hormone receptor and HER2 positive tumors but with poor prognosis in the most aggressive TNBC. Our results are consistent with the increased expression of CXCL5 in metastasis [21].
The promise of AAT treatment for kidney cancer has been dampened by the development of resistance. So, despite improvement in PFS and finally OS with second-, third- and even fourth-line therapies patients ineluctably relapse. Moreover, the usefulness of immune checkpoint inhibitors (ICPI) as first-line [53] and/or second-line treatment after relapse on AAT has created a breakthrough in the field [54]. Therefore, a dilemma exists for the first-line, knowing that two different strategies, either AAT or ICPI, exist. Although clinical parameters guide the choice of ICPI versus AAT, a more precise stratification of patients that relies on biological markers and is easy to introduce to the clinical practice is required. We and others have demonstrated that resistance to AAT is time-dependent with intrinsic and almost immediate adaptation of tumor cells through sequestration into lysosomes of the reference treatment sunitinib [2, 4, 55]. The identification of relevant predictive markers may help anticipate relapse and thus allows rapid administration of a second-line treatment with another AAT or ICPI before an increase in the size of initial metastases or apparition of new ones. We already demonstrated that the plasma levels of CXCL7 predicted sunitinib but not bevacizumab efficacy [20]. However, CXCL7 production by tumor cells depends on the secretion of interleukin 1® by cells of the microenvironment [56] and does not represent direct adaptation of tumor cells to the drug. Therefore, CXCL5 is involved in a more direct mechanism developed by mRCC or breast cancer cells to resist the selection pressure exerted by sunitinib or lapatinib, respectively. Considering this result, it seems evident that the intra-tumor expression of CXCL5 is a marker of poor prognosis in mRCC. Consistent with this observation, CXCL5 over-expression stimulates EMT and new metastases in several cancer types [57-62].
We observed that high intra-tumor amounts of CXCL5 mRNA correlated to short survival and this result is consistent with the prognostic value of CXCL5 in glioma, lung, colon and breast cancers [21, 63-65]. However, the CXCL5 level increases in the serum or plasma of patients with lung, gastric or nasopharingeal cancer [63, 66, 67] whereas it decreases in the plasma of mRCC (this study) and laryngeal squamous cell carcinoma patients [68]. This situation may reflect progressive depletion of immune cells producing CXCL5 from the plasma because of the presence of a growing tumor. Moreover, CXCL5 produced by tumor cells attract myeloid-derived suppressor cells that also express CXCL5 hence creating an immune tolerant environment in RCC [69]. The same CXCL5-dependent immune-tolerant environment was described for hepatocellular carcinoma and prostate cancer [70, 71]. In the present study, the prognostic significance of short survival reflected in high intra-tumor amounts of CXCL5 and the predictive significance of high plasma levels of CXCL5 for efficacy of sunitinib for a longer period of time are counterintuitive. Along this line, an equivalent situation is observed for HER2-positive breast cancers for which over-expression of HER2 is of poor prognosis but defines the sensitivity to the anti-HER2 antibodies trastuzumab and pertuzumab. Therefore, despite this ambivalent situation, the CXCL5 plasma level represents a highly relevant marker that could be easily detected in clinical practices. Induction of CXCL5 by lapatinib in HER2-positive breast cancer model cells suggests that CXCL5 may serve to identify responders to lapatinib. This hypothesis must be confirmed by prospective studies considering that the lapatinib efficacy is limited to third-line treatment at relapse on anti-HER2 antibodies. In this study and in most of the studies described above, CXCL5 was analyzed in tumors or plasma of metastatic patients. However, for patients with kidney cancer, the most frequent situation is non-metastatic disease.
The relevance of treating M0 patients with an AAT or an ICPI is being intensively debated. For AAT two international trials have addressed this important treatment option. The participants of the ASSURE study (NCT00326898) claimed that the DFS of M0 patients was not statistically prolonged by AAT [72]. However, the S-TRAC trial (NCT00375674) showed that depending on the clinical parameters M0 risk patients, when treated with sunitinib, have a DFS that was prolonged by one year [73]. According to these discrepant results, it is urgent to discover predictive markers of efficacy of AAT in an adjuvant setting. CXCL5 may represent such a marker.
Beyond its role as a prognostic or predictive marker of treatment efficacy, the role of CXCL5 as a therapeutic target should be considered with caution. This approach has already been addressed for liver cancer for which it was suggested to target CXCL5 alone or in combination with either radio- or chemo-therapy [74]. The decrease in the CXCL5 plasma level of mRCC patients suggested that the immune context was not equivalent. Different groups of mRCC with a different immunosuppressive microenvironment were described [75]. Hence, we propose that patients should be stratified according to their level of CXCL5 in their tumors and/or metastases before the administration of CXCL5 targeting therapies. However, this is an invasive procedure for patients. The same caution should be applied to treatment of breast cancer since the outcome with regard to CXCL5 levels is different depending on the tumor type.
Our study proposes different strategies for improving the outcome of patients with mRCC or breast cancers by simple determination of the amount of CXCL5 in their plasma. Improving reactivity through new biomarker stratification is probably the most important end-point considering available therapies. The future relevance of the determination of CXCL5 in fluids of M0 RCC patients, needs to be further studied.
Abbreviations
AAT: anti-angiogenic therapies; ARG1: arginase 1; CHL: chloroquine; CTGF: connective tissue growth factor; DFS: disease-free survival; EMT: epithelia to mesenchymal transition; ERK: Extracellular Signal Regulated Kinase; mRCC: metastatic renal cell carcinomas; M0: non-metastatic; M1: metastatic; MSK: Mitogen and Stress activated protein Kinase; NFκB: Nuclear Factor kappa B; BECN1: beclin1; HIF-1-2〈: Hypoxia-Inducible Factor 1 and 2α; IL1: interleukin 1 beta; iNOS: inducible nitrix oxide synthase; KEGG: Kyoto Encyclopedia of Genes and Genomes; LCN2: lipocaline 2; M0: non-metastatic; M1: metastatic; MRC1: mannose receptor C-type 1; OS: overall survival; PFS: progression-free survival; ROS: Reactive oxygen species; STC2: stanniocalcin 2; TNBC: triple negative breast cancer; TTP1: tripeptidyl peptidase 1; VEGF; Vascular Endothelial Growth Factor.
Supplementary Material
Supplementary figures and tables.
Acknowledgements
We thank Dr Patrick Brest for discussion and advice.
Grant support
This work was supported by the French Association for Cancer Research (ARC), the Fondation de France (SG and MD financial supports), the French National Institute for Cancer Research (INCA), The “Ligue Nationale contre le Cancer (Equipe Labellisée 2019)”, the “Conseil Général des Alpes Maritimes,” the association Monégasque “Cordons de Vie” (www.cordonsdevie.com), The Fondation François Xavier Mora (http://fondationfrancoisxaviermora.mc/) and Novartis (Prime award for SG). This work was performed using the microscopy (PICMI) and cytometry (CYTOMED) facilities of IRCAN. The materials of CytoMed were supported by the Conseil Général 06, the FEDER, the Ministère de l'Enseignement Supérieur, the Région Provence Alpes-Côte d'Azur and the INSERM.
Competing Interests
The authors have declared that no competing interest exists.
References
1. Belaid A, Ndiaye PD, Filippakis H, Roux J, Rottinger E, Graba Y. et al. Autophagy: Moving Benchside Promises to Patient Bedsides. Curr Cancer Drug Targets. 2015;15:684-702
2. Giuliano S, Cormerais Y, Dufies M, Grepin R, Colosetti P, Belaid A. et al. Resistance to sunitinib in renal clear cell carcinoma results from sequestration in lysosomes and inhibition of the autophagic flux. Autophagy. 2015;11:1891-904
3. Nadanaciva S, Lu S, Gebhard DF, Jessen BA, Pennie WD, Will Y. A high content screening assay for identifying lysosomotropic compounds. Toxicol In Vitro. 2011;25:715-23
4. Zhitomirsky B, Assaraf YG. Lysosomal sequestration of hydrophobic weak base chemotherapeutics triggers lysosomal biogenesis and lysosome-dependent cancer multidrug resistance. Oncotarget. 2015;6:1143-56
5. Bamias A, Escudier B, Sternberg CN, Zagouri F, Dellis A, Djavan B. et al. Current Clinical Practice Guidelines for the Treatment of Renal Cell Carcinoma: A Systematic Review and Critical Evaluation. Oncologist. 2017;22:667-79
6. Hsieh JJ, Purdue MP, Signoretti S, Swanton C, Albiges L, Schmidinger M. et al. Renal cell carcinoma. Nat Rev Dis Primers. 2017;3:17009
7. Ball MW, Singer EA, Srinivasan R. Renal cell carcinoma: molecular characterization and evolving treatment paradigms. Curr Opin Oncol. 2017
8. Shenoy N, Pagliaro L. Sequential pathogenesis of metastatic VHL mutant clear cell renal cell carcinoma: putting it together with a translational perspective. Ann Oncol. 2016;27:1685-95
9. Escudier B, Bellmunt J, Negrier S, Bajetta E, Melichar B, Bracarda S. et al. Phase III trial of bevacizumab plus interferon alfa-2a in patients with metastatic renal cell carcinoma (AVOREN): final analysis of overall survival. J Clin Oncol. 2010;28:2144-50
10. Motzer RJ, Hutson TE, Tomczak P, Michaelson MD, Bukowski RM, Oudard S. et al. Overall survival and updated results for sunitinib compared with interferon alfa in patients with metastatic renal cell carcinoma. J Clin Oncol. 2009;27:3584-90
11. Escudier B, Eisen T, Stadler WM, Szczylik C, Oudard S, Staehler M. et al. Sorafenib for treatment of renal cell carcinoma: Final efficacy and safety results of the phase III treatment approaches in renal cancer global evaluation trial. J Clin Oncol. 2009;27:3312-8
12. Hutson TE, Lesovoy V, Al-Shukri S, Stus VP, Lipatov ON, Bair AH. et al. Axitinib versus sorafenib as first-line therapy in patients with metastatic renal-cell carcinoma: a randomised open-label phase 3 trial. Lancet Oncol. 2013;14:1287-94
13. Escudier B, Porta C, Bono P, Powles T, Eisen T, Sternberg CN. et al. Randomized, controlled, double-blind, cross-over trial assessing treatment preference for pazopanib versus sunitinib in patients with metastatic renal cell carcinoma: PISCES Study. J Clin Oncol. 2014;32:1412-8
14. Choueiri TK, Escudier B, Powles T, Mainwaring PN, Rini BI, Donskov F. et al. Cabozantinib versus Everolimus in Advanced Renal-Cell Carcinoma. N Engl J Med. 2015;373:1814-23
15. Motzer RJ, Hutson TE, Glen H, Michaelson MD, Molina A, Eisen T. et al. Lenvatinib, everolimus, and the combination in patients with metastatic renal cell carcinoma: a randomised, phase 2, open-label, multicentre trial. Lancet Oncol. 2015;16:1473-82
16. Dufies M, Giuliano S, Ambrosetti D, Claren A, Ndiaye PD, Mastri M. et al. Sunitinib Stimulates Expression of VEGFC by Tumor Cells and Promotes Lymphangiogenesis in Clear Cell Renal Cell Carcinomas. Cancer Res. 2017;77:1212-26
17. Vandercappellen J, Van Damme J, Struyf S. The role of CXC chemokines and their receptors in cancer. Cancer Lett. 2008;267:226-44
18. Grepin R, Guyot M, Jacquin M, Durivault J, Chamorey E, Sudaka A. et al. Acceleration of clear cell renal cell carcinoma growth in mice following bevacizumab/Avastin treatment: the role of CXCL cytokines. Oncogene. 2012;31:1683-94
19. Grepin R, Guyot M, Giuliano S, Boncompagni M, Ambrosetti D, Chamorey E. et al. The CXCL7/CXCR1/2 axis is a key driver in the growth of clear cell renal cell carcinoma. Cancer Res. 2014;74:873-83
20. Dufies M, Giuliano S, Viotti J, Borchiellini D, Cooley LS, Ambrosetti D. et al. CXCL7 is a predictive marker of sunitinib efficacy in clear cell renal cell carcinomas. Br J Cancer. 2017;117:947-53
21. Bieche I, Chavey C, Andrieu C, Busson M, Vacher S, Le Corre L. et al. CXC chemokines located in the 4q21 region are up-regulated in breast cancer. Endocr Relat Cancer. 2007;14:1039-52
22. Petrelli F, Ghidini M, Lonati V, Tomasello G, Borgonovo K, Ghilardi M. et al. The efficacy of lapatinib and capecitabine in HER-2 positive breast cancer with brain metastases: A systematic review and pooled analysis. Eur J Cancer. 2017;84:141-8
23. Gao J, Aksoy BA, Dogrusoz U, Dresdner G, Gross B, Sumer SO. et al. Integrative analysis of complex cancer genomics and clinical profiles using the cBioPortal. Sci Signal. 2013;6:pl1
24. Cerami E, Gao J, Dogrusoz U, Gross BE, Sumer SO, Aksoy BA. et al. The cBio cancer genomics portal: an open platform for exploring multidimensional cancer genomics data. Cancer Discov. 2012;2:401-4
25. Kammerer-Jacquet SF, Brunot A, Pladys A, Bouzille G, Dagher J, Medane S. et al. Synchronous Metastatic Clear-Cell Renal Cell Carcinoma: A Distinct Morphologic, Immunohistochemical, and Molecular Phenotype. Clin Genitourin Cancer. 2017;15:e1-e7
26. Negrier S, Gravis G, Perol D, Chevreau C, Delva R, Bay JO. et al. Temsirolimus and bevacizumab, or sunitinib, or interferon alfa and bevacizumab for patients with advanced renal cell carcinoma (TORAVA): a randomised phase 2 trial. Lancet Oncol. 2011;12:673-80
27. Motzer RJ, Mazumdar M, Bacik J, Berg W, Amsterdam A, Ferrara J. Survival and prognostic stratification of 670 patients with advanced renal cell carcinoma. J Clin Oncol. 1999;17:2530-40
28. Panda PK, Mukhopadhyay S, Das DN, Sinha N, Naik PP, Bhutia SK. Mechanism of autophagic regulation in carcinogenesis and cancer therapeutics. Semin Cell Dev Biol. 2015;39:43-55
29. Trachootham D, Alexandre J, Huang P. Targeting cancer cells by ROS-mediated mechanisms: a radical therapeutic approach? Nat Rev Drug Discov. 2009;8:579-91
30. Burek CL, Rose NR. Autoimmune thyroiditis and ROS. Autoimmun Rev. 2008;7:530-7
31. Filippin LI, Vercelino R, Marroni NP, Xavier RM. Redox signalling and the inflammatory response in rheumatoid arthritis. Clin Exp Immunol. 2008;152:415-22
32. Gilgun-Sherki Y, Melamed E, Offen D. The role of oxidative stress in the pathogenesis of multiple sclerosis: the need for effective antioxidant therapy. J Neurol. 2004;251:261-8
33. Kang D, Hamasaki N. Alterations of mitochondrial DNA in common diseases and disease states: aging, neurodegeneration, heart failure, diabetes, and cancer. Curr Med Chem. 2005;12:429-41
34. Tafani M, Sansone L, Limana F, Arcangeli T, De Santis E, Polese M. et al. The Interplay of Reactive Oxygen Species, Hypoxia, Inflammation, and Sirtuins in Cancer Initiation and Progression. Oxid Med Cell Longev. 2016;2016:3907147
35. Sui X, Kong N, Ye L, Han W, Zhou J, Zhang Q. et al. p38 and JNK MAPK pathways control the balance of apoptosis and autophagy in response to chemotherapeutic agents. Cancer Lett. 2014;344:174-9
36. Tormos AM, Talens-Visconti R, Nebreda AR, Sastre J. p38 MAPK: a dual role in hepatocyte proliferation through reactive oxygen species. Free Radic Res. 2013;47:905-16
37. Arthur JS. MSK activation and physiological roles. Front Biosci. 2008;13:5866-79
38. Wang Y, Gao Y, Cheng H, Yang G, Tan W. Stanniocalcin 2 promotes cell proliferation and cisplatin resistance in cervical cancer. Biochem Biophys Res Commun. 2015;466:362-8
39. Wu YL, Li HY, Zhao XP, Jiao JY, Tang DX, Yan LJ. et al. Mesenchymal stem cell-derived CCN2 promotes the proliferation, migration and invasion of human tongue squamous cell carcinoma cells. Cancer Sci. 2017;108:897-909
40. Wiemhoefer A, Stargardt A, van der Linden WA, Renner MC, van Kesteren RE, Stap J. et al. Tripeptidyl Peptidase II Mediates Levels of Nuclear Phosphorylated ERK1 and ERK2. Mol Cell Proteomics. 2015;14:2177-93
41. Tacke F, Zimmermann HW, Trautwein C, Schnabl B. CXCL5 plasma levels decrease in patients with chronic liver disease. J Gastroenterol Hepatol. 2011;26:523-9
42. Walz A, Schmutz P, Mueller C, Schnyder-Candrian S. Regulation and function of the CXC chemokine ENA-78 in monocytes and its role in disease. J Leukoc Biol. 1997;62:604-11
43. Galliera E, Corsi MM, Banfi G. Platelet rich plasma therapy: inflammatory molecules involved in tissue healing. J Biol Regul Homeost Agents. 2012;26:35S-42S
44. Takahama M, Akira S, Saitoh T. Autophagy limits activation of the inflammasomes. Immunol Rev. 2018;281:62-73
45. Sun Y, Li C, Shu Y, Ju X, Zou Z, Wang H. et al. Inhibition of autophagy ameliorates acute lung injury caused by avian influenza A H5N1 infection. Sci Signal. 2012;5:ra16
46. Coppe JP, Patil CK, Rodier F, Sun Y, Munoz DP, Goldstein J. et al. Senescence-associated secretory phenotypes reveal cell-nonautonomous functions of oncogenic RAS and the p53 tumor suppressor. PLoS Biol. 2008;6:2853-68
47. Chen P, Luo X, Nie P, Wu B, Xu W, Shi X. et al. CQ synergistically sensitizes human colorectal cancer cells to SN-38/CPT-11 through lysosomal and mitochondrial apoptotic pathway via p53-ROS cross-talk. Free Radic Biol Med. 2017;104:280-97
48. Baranwal S, Azad GK, Singh V, Tomar RS. Signaling of chloroquine-induced stress in the yeast Saccharomyces cerevisiae requires the Hog1 and Slt2 mitogen-activated protein kinase pathways. Antimicrob Agents Chemother. 2014;58:5552-66
49. Said A, Bock S, Lajqi T, Muller G, Weindl G. Chloroquine promotes IL-17 production by CD4+ T cells via p38-dependent IL-23 release by monocyte-derived Langerhans-like cells. J Immunol. 2014;193:6135-43
50. Reber L, Vermeulen L, Haegeman G, Frossard N. Ser276 phosphorylation of NF-kB p65 by MSK1 controls SCF expression in inflammation. PLoS One. 2009;4:e4393
51. Saccani S, Pantano S, Natoli G. p38-Dependent marking of inflammatory genes for increased NF-kappa B recruitment. Nat Immunol. 2002;3:69-75
52. Diaz-Montero CM, Mao FJ, Barnard J, Parker Y, Zamanian-Daryoush M, Pink JJ. et al. MEK inhibition abrogates sunitinib resistance in a renal cell carcinoma patient-derived xenograft model. Br J Cancer. 2016;115:920-8
53. Powles T, Albiges L, Staehler M, Bensalah K, Dabestani S, Giles RH. et al. Updated European Association of Urology Guidelines Recommendations for the Treatment of First-line Metastatic Clear Cell Renal Cancer. Eur Urol. 2017;17:31001-1
54. Motzer RJ, Escudier B, McDermott DF, George S, Hammers HJ, Srinivas S. et al. Nivolumab versus Everolimus in Advanced Renal-Cell Carcinoma. N Engl J Med. 2015;373:1803-13
55. Gotink KJ, Broxterman HJ, Labots M, de Haas RR, Dekker H, Honeywell RJ. et al. Lysosomal sequestration of sunitinib: a novel mechanism of drug resistance. Clin Cancer Res. 2011;17:7337-46
56. Hsu YL, Hou MF, Kuo PL, Huang YF, Tsai EM. Breast tumor-associated osteoblast derived CXCL5 increases cancer progression by ERK/MSK1/Elk-1/snail signaling pathway. Oncogene. 2013;32:4436-47
57. Han N, Yuan X, Wu H, Xu H, Chu Q, Guo M. et al. DACH1 inhibits lung adenocarcinoma invasion and tumor growth by repressing CXCL5 signaling. Oncotarget. 2015;6:5877-88
58. Gao Y, Guan Z, Chen J, Xie H, Yang Z, Fan J. et al. CXCL5/CXCR2 axis promotes bladder cancer cell migration and invasion by activating PI3K/AKT-induced upregulation of MMP2/MMP9. Int J Oncol. 2015;47:690-700
59. Zhou SL, Zhou ZJ, Hu ZQ, Li X, Huang XW, Wang Z. et al. CXCR2/CXCL5 axis contributes to epithelial-mesenchymal transition of HCC cells through activating PI3K/Akt/GSK-3beta/Snail signaling. Cancer Lett. 2015;358:124-35
60. Zheng J, Zhu X, Zhang J. CXCL5 knockdown expression inhibits human bladder cancer T24 cells proliferation and migration. Biochem Biophys Res Commun. 2014;446:18-24
61. Zhou SL, Dai Z, Zhou ZJ, Chen Q, Wang Z, Xiao YS. et al. CXCL5 contributes to tumor metastasis and recurrence of intrahepatic cholangiocarcinoma by recruiting infiltrative intratumoral neutrophils. Carcinogenesis. 2014;35:597-605
62. Hsu YL, Hou MF, Kuo PL, Huang YF, Tsai EM. Breast tumor-associated osteoblast-derived CXCL5 increases cancer progression by ERK/MSK1/Elk-1/snail signaling pathway. Oncogene. 2013;32:4436-47
63. Wu K, Yu S, Liu Q, Bai X, Zheng X, Wu K. The clinical significance of CXCL5 in non-small cell lung cancer. Onco Targets Ther. 2017;10:5561-73
64. Zhao J, Ou B, Han D, Wang P, Zong Y, Zhu C. et al. Tumor-derived CXCL5 promotes human colorectal cancer metastasis through activation of the ERK/Elk-1/Snail and AKT/GSK3beta/beta-catenin pathways. Mol Cancer. 2017;16:70
65. Dai Z, Wu J, Chen F, Cheng Q, Zhang M, Wang Y. et al. CXCL5 promotes the proliferation and migration of glioma cells in autocrine- and paracrine-dependent manners. Oncol Rep. 2016;36:3303-10
66. Lim JB, Chung HW. Serum ENA78/CXCL5, SDF-1/CXCL12, and their combinations as potential biomarkers for prediction of the presence and distant metastasis of primary gastric cancer. Cytokine. 2015;73:16-22
67. Zhang H, Xia W, Lu X, Sun R, Wang L, Zheng L. et al. A novel statistical prognostic score model that includes serum CXCL5 levels and clinical classification predicts risk of disease progression and survival of nasopharyngeal carcinoma patients. PLoS One. 2013;8:e57830
68. Zhang D, Zhou J, Tang D, Zhou L, Chou L, Chou KY. et al. Neutrophil infiltration mediated by CXCL5 accumulation in the laryngeal squamous cell carcinoma microenvironment: A mechanism by which tumour cells escape immune surveillance. Clin Immunol. 2017;175:34-40
69. Najjar YG, Rayman P, Jia X, Pavicic PG Jr, Rini BI, Tannenbaum C. et al. Myeloid-Derived Suppressor Cell Subset Accumulation in Renal Cell Carcinoma Parenchyma Is Associated with Intratumoral Expression of IL1beta, IL8, CXCL5, and Mip-1alpha. Clin Cancer Res. 2017;23:2346-55
70. Zhou SL, Zhou ZJ, Hu ZQ, Huang XW, Wang Z, Chen EB. et al. Tumor-Associated Neutrophils Recruit Macrophages and T-Regulatory Cells to Promote Progression of Hepatocellular Carcinoma and Resistance to Sorafenib. Gastroenterology. 2016;150:1646-58 e17
71. Wang G, Lu X, Dey P, Deng P, Wu CC, Jiang S. et al. Targeting YAP-Dependent MDSC Infiltration Impairs Tumor Progression. Cancer Discov. 2016;6:80-95
72. Haas NB, Manola J, Uzzo RG, Flaherty KT, Wood CG, Kane C. et al. Adjuvant sunitinib or sorafenib for high-risk, non-metastatic renal-cell carcinoma (ECOG-ACRIN E2805): a double-blind, placebo-controlled, randomised, phase 3 trial. Lancet. 2016;387:2008-16
73. Ravaud A, Motzer RJ, Pandha HS, George DJ, Pantuck AJ, Patel A. et al. Adjuvant Sunitinib in High-Risk Renal-Cell Carcinoma after Nephrectomy. N Engl J Med. 2016;375:2246-54
74. Xia J, Xu X, Huang P, He M, Wang X. The potential of CXCL5 as a target for liver cancer - what do we know so far? Expert Opin Ther Targets. 2015;19:141-6
75. Dieu-Nosjean MC, Giraldo NA, Kaplon H, Germain C, Fridman WH, Sautes-Fridman C. Tertiary lymphoid structures, drivers of the anti-tumor responses in human cancers. Immunol Rev. 2016;271:260-75
Author contact
![]() Corresponding author: gpagesfr
Corresponding author: gpagesfr