Theranostics
13.3
Impact Factor
- Current Issue
- Advance Articles
- Volume 16; 2026
- Volume 15; 2025
- Volume 14; 2024
- Volume 13; 2023
- Volume 12; 2022
- Archive
- Cover Images
- Cover Suggestion
- Special Issues
Top
Introduction
Results and Discussion
Conclusion
Materials and Methods
Abbreviations
Acknowledgements
Supplementary Material
References
Introduction
Results and Discussion
Conclusion
Materials and Methods
Abbreviations
Acknowledgements
Supplementary Material
References
International Journal of Biological Sciences
International Journal of Medical Sciences
 Global reach, higher impact

Theranostics 2019; 9(5):1264-1279. doi:10.7150/thno.29101 This issue Cite
Research Paper
Theranostic Nanodots with Aggregation-Induced Emission Characteristic for Targeted and Image-Guided Photodynamic Therapy of Hepatocellular Carcinoma
Yang Gao1*, Qi Chang Zheng1*, Shidang Xu2*, Youyong Yuan2, Xiang Cheng1, Shuai Jiang1, Kenry2, Qihong Yu1, Zifang Song1, Bin Liu2 ![]() , Min Li1,3
, Min Li1,3 ![]()
1. Department of Hepatobiliary Surgery, Union Hospital, Tongji Medical College, Huazhong University of Science and Technology, Wuhan 430022, China
2. Department of Chemical and Biomolecular Engineering, National University of Singapore, Singapore, 117585
3. State Key Laboratory of Luminescent Materials and Devices, South China University of Technology, Guangzhou 510640, China
*These authors contributed equally to this work.
Received 2018-8-8; Accepted 2018-11-16; Published 2019-2-12
Citation:
Gao Y, Zheng QC, Xu S, Yuan Y, Cheng X, Jiang S, Kenry, Yu Q, Song Z, Liu B, Li M. Theranostic Nanodots with Aggregation-Induced Emission Characteristic for Targeted and Image-Guided Photodynamic Therapy of Hepatocellular Carcinoma. Theranostics 2019; 9(5):1264-1279. doi:10.7150/thno.29101. https://www.thno.org/v09p1264.htm
Other stylesAbstract

Photosensitizer (PS) serves as the central element of photodynamic therapy (PDT). The use of common nanoparticles (NPs) for PDT has typically been rendered less effective by the undesirable aggregation-caused quenching (ACQ) effect, resulting in quenched fluorescence and reduced reactive oxygen species (ROS) generation that diminish the imaging quality and PDT efficacy. To overcome the ACQ effect and to enhance the overall efficacy of PDT, herein, integrin ανβ3-targeted organic nanodots for image-guided PDT were designed and synthesized based on a red emissive aggregation-induced emission (AIE) PS.
Methods: The TPETS nanodots were prepared by nano-precipitation method and further conjugated with thiolated cRGD (cRGD-SH) through a click reaction to yield the targeted TPETS nanodots (T-TPETS nanodots). Nanodots were characterized for encapsulation efficiency, conjugation rate, particle size, absorption and emission spectra and ROS production. The targeted fluorescence imaging and antitumor efficacy of T-TPETS nanodot were evaluated both in vitro and in vivo. The mechanism of cell apoptosis induced by T-TPETS nanodot mediated-PDT was explored. The biocompatibility and toxicity of the nanodots was examined using cytotoxicity test, hemolysis assay, blood biochemistry test and histological staining.
Results: The obtained nanodots show bright red fluorescence and highly effective 1O2 generation in aggregate state. Both in vitro and in vivo experiments demonstrate that the nanodots exhibit excellent tumor-targeted imaging performance, which facilitates image-guided PDT for tumor ablation in a hepatocellular carcinoma model. Detailed analysis reveals that the nanodot-mediated PDT is able to induce time- and concentration-dependent cell death. The use of PDT at a high PDT intensity leads to direct cell necrosis, while cell apoptosis via the mitochondria-mediated pathway is achieved under low PDT intensity.
Conclusion: Our results suggest that well-designed AIE nanodots are promising for image-guided PDT applications.
Keywords: aggregation-induced emission (AIE), hepatocellular carcinoma, photodynamic therapy (PDT), integrin ανβ3, theranostics
Introduction
Liver cancer is one of the most common and deadliest cancers globally [1]. Of all types of liver cancer, hepatocellular carcinoma (HCC) is known to be the most frequent primary liver malignancy, with a high incidence in Asia and sub-Saharan Africa, and increasing morbidity in the United States [2, 3]. In general, liver cancer is treated with common methods, such as surgical resection, liver transplantation, transarterial chemoembolization, systemic chemotherapy, and molecularly targeted therapies [4]. In addition, methods based on local thermal ablations, such as radiofrequency and microwave ablation, have seen increasing use as alternative strategies for HCC treatment, which have shown satisfactory therapeutic outcomes in selected candidates [5-7]. However, the aggressive thermal effect of local ablations may cause some undesirable complications, such as hepatic decompensation, bile duct injury, and extrahepatic organ injuries, etc [8].
Photodynamic therapy (PDT) has emerged as an alternative attractive local cancer therapeutic technique in recent years [9, 10]. In principle, PDT utilizes a combination of non-toxic photosensitizer (PS) and light to convert molecular oxygen within the malignant tissues to a range of highly reactive oxygen species (ROS), notably singlet oxygen (1O2), to achieve its therapeutic effect [11, 12]. The resultant ROS can directly induce cell death, indirectly disrupt tumor vasculature, and stimulate the host immune system [13]. Recent progress in PDT has witnessed the development and increasing use of certain variants of PDT, notably, the image-guided PDT in cancer treatment. In fact, image-guided PDT is versatile and affords a multitude of functionalities, such as visualization of the location of PS in tumor cells, tracking of the biodistribution and accumulation of PS at the targeted tumor tissue, and assessment of the therapeutic outcome through real-time monitoring [14-17]. The imaging modality of image-guided PDT can provide both a preoperative early diagnosis of cancer due to its high sensitivity and spatio-temporal resolution [18, 19], as well as an intraoperative guidance on the surgical margin of tumor and satellite tumor foci [20]. On the other hand, the PDT effect can kill potential metastatic tumor cells in surgical resection margin after light irradiation, while the secondary immunostimulation of the PDT effect can enhance the anti-tumor effectiveness and improve the overall prognosis of patients [12, 21].
Experimental studies have shown that PDT can effectively kill hepatoma cells and shrink tumor tissues [22-24], and clinical investigations have also revealed that PDT can prolong the survival rate in patients with inoperable cancers to significantly improve their life quality [25-27]. As the use of PDT enables enhancement of chemotherapy, radiosensitivity [28, 29], and immunostimulatory effects [12, 30], with minimal intrinsic or acquired resistance mechanisms, PDT serves as a valuable therapeutic option for combination treatments.
As an indispensable element of PDT, PS plays a crucial role in ensuring the successful implementation of PDT. Because of this, the design and functionality of PS have been continuously improved for decades [31]. For example, some PSs have been integrated with nano delivery systems to increase their overall therapeutic efficacy and reduce systemic toxicity [32-35]. However, a common problem of PSs, especially the most widely used porphyrin derivatives, lies in their high hydrophobicity and rigid planar structures, which can collectively cause them to form aggregates in aqueous media through π-π stacking [36, 37]. The formation of aggregates results in quenched fluorescence and reduced ROS generation that diminish the imaging quality and PDT efficacy [38]. Furthermore, this issue may be aggravated when the PSs are encapsulated into nanocarriers [15]. Therefore, it is highly desirable to develop a new type of PS exhibiting bright fluorescence and high phototoxicity upon aggregation formation.
Fluorogens with aggregation-induced emission characteristic (AIEgens) have emerged as a potential and versatile tool for various biological applications [39-41]. In general, AIEgens are almost non-emissive when they are molecularly dissolved, but they could be induced to emit bright luminescence in aggregate state due to the restriction of intramolecular motions [42-46]. These attractive properties have rendered them particularly suitable for the development of light-up bioprobes and AIE dots for biological sensing and imaging [47-50]. Recently, several AIEgens with phototoxicity have also been designed for bacteria and cancer ablation [14, 16, 51-55], These AIEgen-based PSs with high brightness and efficient ROS generation in aggregated state may find potential applications in imaged-guided PDT. In our previous study [17], a red fluorogen tetraphenylene derivative with typical AIE characteristics (TPETS) was synthesized for bioorthogonal labeling on cancer cells. Unexpectedly, the ROS generation was detected upon visible light irradiation due to the radical group of TPETS. However, the targeted accumulation and PDT effect in tumor tissue are easy to be disturbed by the complex environment in vivo because of no high efficient delivery for TPETS into tumor cells.
In this contribution, we further integrate TPETS into organic dots to develop targeted theranostic AIE nanodots for image-guided PDT. TPETS nanodots were prepared by the nano-precipitation method using 2-Distearoyl-sn-glycero-3-phosphoethanolamine-N-[maleimide(polyethylene glycol)-2000] (DSPE- PEG-Mal) as the encapsulation matrix. These nanodots were then modified with a hydrophilic and targeted peptide (cRGD) for easy uptake by integrin ανβ3 overexpressed cancer cells via receptor-mediated endocytosis [56]. Scheme 1 illustrates the overall treatment strategy using the targeted theranostic AIE nanodots in human HCC cell xenograft tumor model. Our nanodot design offers an excellent platform for image-guided PDT with great potentials for practical applications.
Scheme 1
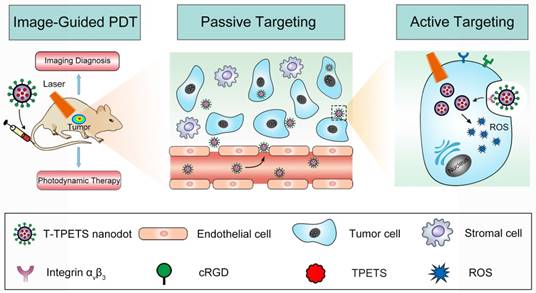
The schematic illustration of image-guided PDT mediated by cRGD-modified TPETS (T-TPETS) nanodots in xenograft tumor model. The T-TPETS nanodots are administered systemically. After a period of systemic distribution, the nanodots selectively accumulate into the tumor via both passive targeting (enhanced permeability and retention effect) and active targeting (receptor-mediated endocytosis). Upon light irradiation, the fluorescence depicts the tumor outline. Further irradiation activates the nanodots and trigger a photochemical reaction to result in the production of ROS. Irreparable damage induces tumor cell death via an apoptotic and/or necrotic pathway.
Results and Discussion
Fabrication and Characterization of T-TPETS Nanodots
The TPETS was synthesized according to our previous report [17]. The TPETS nanodots were prepared by nano-precipitation method using DSPE-PEG-Mal as the encapsulation matrix. The encapsulation efficiency was calculated to be 92%. The obtained TPETS nanodots were further conjugated with thiolated cRGD (cRGD-SH) through a click reaction between maleimide and -SH, to yield the targeted TPETS nanodots (T-TPETS nanodots), which can specifically recognize cancer cells with overexpressed integrin αvβ3 (Figure 1A). The conjugation rate of cRGD to the nanodots was calculated to be 86%. The hydrodynamic size of T-TPETS nanodots was evaluated using dynamic light scattering (DLS), which shows an average diameter of 68 nm. The diameters of T-TPETS nanodots in PBS or DMEM remain unchanged even after 7 days incubation at 37°C, indicating good stability of the synthesized nanodots at physiological conditions (Figure S1). The nanodots have a spherical morphology as imaged using transmission electron microscopy (TEM) (Figure 1B). The UV-Vis and photoluminescence (PL) spectra of T-TPETS nanodots are shown in Figure 1C, which have an absorption peak centres at 450 nm and an emission maximum peaks at 645 nm. The PLQY of as-synthesized T-TPETS nanodots was determined to be 0.18 using DCM as the standard. The ROS generation of T-TPETS nanodots was studied by measuring the absorbance decrease of 9,10- anthracenediyl-bis(methylene)dimalonic acid (ABDA) upon white light irradiation. As shown in Figure 1D, the decomposition of ABDA by T-TPETS nanodots is faster than that achieved by the widely used chlorin e6 (Ce6) PS, indicating that the T-TPETS nanodots could generate more ROS than Ce6 nanodots under the same light illumination condition.
Expression of Integrin ανβ3 in HCC
Restricting the expression of tumor-specific biomarkers for the selective delivery of therapeutic agents to tumor cells is required for cancer-targeted imaging and therapy, as well as reduction of systemic toxicity and undesired side effects [57]. Previous studies have reported the significant up-regulation of integrin ανβ3 in many solid tumors and endothelial cells of tumor vasculature, while this integrin upregulation is undetectable in most of the normal organs [58-60]. In addition, several surface-modified NPs targeting integrin ανβ3 have demonstrated satisfactory targeting effect [61-63]. These findings have revealed the potential of integrin ανβ3 as a promising target site for cancer diagnostic, imaging and therapy. To validate the overexpression of integrin ανβ3 in tumor tissues of HCC patients and tumor-derived cell lines, immunofluorescence and RT-qPCR were performed respectively. A significant up-regulation of αν and β3 mRNA was detected in HepG2 cells, while a low integrin ανβ3 expression was observed in the two control cell lines, i.e., MCF-7 cancer cells and L-O2 normal cells (Figure S2). Interestingly, the immunofluorescence results are in good accordance with the gene levels of the cells. Specifically, a strong integrin ανβ3 expression (green fluorescence) was detected from HepG2 cells, whereas the expression was low for both MCF-7 and L-O2 cells (Figure S3). Furthermore, immunofluorescence was used to test 20 pairs of human HCC and peripheral non-tumor tissues. The results clearly demonstrated that integrin ανβ3 was indeed highly expressed in 17 cases (85%) of randomly selected patient samples (Figure S4). Thus, the overexpression of integrin ανβ3 in HCC serves as a promising biomarker for the development of integrin ανβ3-targeted agents for potential theranostic applications.
Figure 1
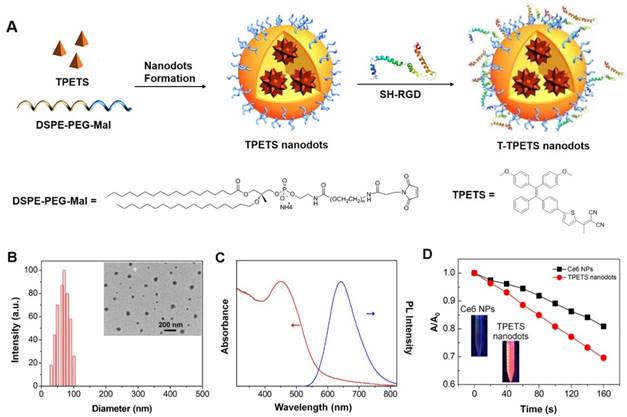
Fabrication and characterization of T-TPETS nanodots. (A) Schematic illustration of T-TPETS nanodot formation and surface modification with the target moiety of cRGD. (B) Hydrodynamic size distribution and morphology of T-TPETS nanodots as detected by DLS and TEM, respectively. (C) UV-vis absorption (red) and emission (blue, λex = 430 nm) spectra of T-TPETS nanodots. (D) The decomposition of ABDA by T-TPETS nanodots and Ce6 NPs; A0 and A are the absorbance of ABDA in the presence of T-TPETS nanodots or Ce6 NPs at 378 nm before and after irradiation at the power density of 50 mW cm-2, respectively.
Targeted Imaging and Subcellular Localization in Vitro
To demonstrate the targeted imaging of specific cancer cells overexpressing integrin ανβ3, HepG2, MCF-7 and L-O2 cells were first treated with T-TPETS nanodots. After incubation with the nanodots (5 μg/mL) for 4 h, the cells were imaged using a confocal laser scanning microscopy (CLSM) with an excitation at 450 nm and a collection of fluorescent signals above 600 nm. As shown in Figure 2A, the red fluorescence emitted by the nanodots in HepG2 cells was much stronger than that in MCF-7 and L-O2 cells under identical conditions. Competitive binding assay was also performed to evaluate the specificity of T-TPETS nanodots towards HepG2 cells. As anticipated, HepG2 cells pretreated with integrin ανβ3 inhibitor (cilengitide) prior to nanodot incubation exhibited a dramatically reduced red fluorescence. This specificity was further evaluated based on the quantitative analysis of fluorescence intensity using flow cytometry, and the results are in well accordance with the previously obtained confocal images (Figure 2B, C). The higher accumulation of the nanodots in HepG2 cells (non-blocking) could be due to their higher integrin ανβ3 expression than that of normal cells, resulting in more nanodots uptake through the receptor-mediated endocytosis. To confirm the speculation that the cellular uptake of the nanodots can be attributed to endocytosis, LysoTracker Green, which is an acidophilic dye commonly used to localize lysosomes and endosomes, was added to the cells after they were treated with the nanodots. The overlay fluorescent signals from nanodots (red) and LysoTracker (green) reveals the endosome-gained entry of the nanodots into the cells (Figure 2D).
Hemocompatibility, Tumor Imaging, Biodistribution and Pharmacokinetics in Vivo
Prior to in vivo applications, hemocompatibility assays were performed to evaluate the biocompatibility of T-TPETS nanodots. As shown in Figure 3A, no observable hemolysis occurs in both PBS (negative control) and nanodot solution under the studied concentration range and time. On the other hand, obvious hemolysis occurred in distilled water (positive control). To further study the impact of nanodots on red blood cells (RBCs), solution in each tube was used to make the cell smear to observe the morphological changes of erythrocyte. Similarly, no morphological change of erythrocyte was observed in the nanodot groups while erythrocytolysis occurred in the positive control as shown in Figure S5. This suggests that the nanodots are hemocompatible and can be administered intravenously for in vivo applications.
To demonstrate that the nanodots could achieve targeted tumor imaging in vivo, we established a HepG2 tumor-bearing mice model in order to examine both the biodistribution of the nanodots and their tumor imaging capability, using a non-invasive fluorescence imaging system. It was found that the nanodots tended to accumulate in tumor tissue as time elapsed, and reached a maximum signal-to-background ratio at 24 h post-injection. Although the fluorescence signal decreased with time due to metabolism, it was still observable even at 48 h post-injection (Figure 3B). Next, the tumor-targeting specificity of the nanodots in vivo was confirmed through a blocking study. As shown in Figure 3C, the uptake of the nanodots by tumor at 8 h post-injection was significantly inhibited by the pre-injection of integrin ανβ3 inhibitor (cilengitide, 100 μg). Meanwhile, in order to assess the fluorescence intensity of the tumor and other organs, the mice in both blocking and non-blocking groups were sacrificed and various organs and tissues were isolated at 8 h post-injection. The average fluorescence intensity of each harvested organ was measured for a semi-quantitative biodistribution analysis. As shown in Figures 3D, E, the biodistribution of the nanodots in normal organs is similar for mice in both the blocking and non-blocking groups. It is noteworthy that the average fluorescence intensity of the tumor tissues obtained from the mice without blocking is ~2-fold higher than that acquired from the cilengitide pre-treated mice. Next, to investigate the intratumoral microdistribution of the nanodots in mice with and without integrin ανβ3 receptor blocking, the nanodots were first intravenously administrated and the tumors were then harvested at 12 h post-injection. The nanodots were subsequently visualized in the tumor sections using a fluorescence microscopy. It was observed that the nanodots in the non-blocking tumor tissue were distributed throughout the tumor tissue and they were often concentrated in the perinuclear region of the cytoplasm (Figure S6A). This is consistent with the targeted imaging and subcellular localization in vitro (Figures 2D). In contrast, the blocking tumor tissue showed a more uneven nanodot distribution, with a high focal accumulation within the tumor stroma but a low accumulation within the tumor cells. To provide a quantitative assessment of this targeting effect, the uptake of the nanodots by tumor cells was measured by ex vivo flow cytometry. Following nanodot administration, the tumors of the mice with and without cilengitide pretreatment were disaggregated and suspended. The extent of in vivo nanodot uptake was then determined by flow cytometric quantification of the fluorescence intensity of the nanodots in tumor cells. As shown in Figure S6B, the uptake of the nanodots in non-blocking tumor cells is ~2-fold higher as compared to that in the blocking tumor, indicating a more effective endocytosis occurring in the non-blocking cancer cells. Together, these results demonstrate that both EPR effect (passive targeting) and receptor-mediated endocytosis (active targeting) contribute to the selective accumulation of the nanodots in tumor tissue, and active targeting significantly enhances the specific targeting of tumor in vivo.
It has been well documented that a longer blood circulation of NPs in bloodstream can provide a greater opportunity for them to accumulate in tumor tissues through EPR effect [64]. On this basis, pharmacokinetic study was performed to verify the prolonged retention of the nanodots in circulation. As shown in Figure 3F, the elimination half-life (t1/2) of the nanodots in circulation was calculated to be ~13.6 h, which provides sufficient time for the nanodots to accumulate in tumor tissue. This relatively long circulation time is attributed to the PEG grafting on the surface of the nanodots, through which non-specific protein adsorption in blood can be minimized and clearance by the mononuclear phagocyte system can be retarded [65, 66].
Phototoxicity in vitro
We next investigated the ability of nanodots in ROS production upon light irradiation after cellular uptake. A commercial indicator, 2',7'-dichlorofluorescin diacetate (DCFH-DA), was employed as an indicator of ROS generation, which can be rapidly oxidized to highly fluorescent dichlorofluorescein (DCF) in the presence of ROS. After 4-h incubation with T-TPETS nanodots, DCFH-DA was loaded into the cells and followed by laser (450 nm, 250 mW/cm2) irradiation for 3 min. After 4 h incubation with T-TPETS nanodots (5 μg/mL), Strong green fluorescence was clearly observed inside HepG2 cells upon laser irradiation (450 nm, 250 mW/cm2) for 3 min while no obvious ROS was detected in cells without incubation or irradiation (Figure 4A).
Low cytotoxicity in dark conditions but high cytotoxicity upon exposure to light irradiation is essential for phototherapy. Quantitative evaluation of the cytotoxicity of the nanodot-mediated PDT on HepG2 cells was next studied using CCK8 assay. The cytotoxicity of the nanodots with different concentrations upon incubation with cells in dark condition and upon light irradiation but without nanodot incubation were first evaluated. After a 24 h incubation, it was observed that neither light irradiation, nor nanodot incubation alone induced significant cytotoxicity on HepG2, MCF-7 and L-O2 cells (Figure S7). However, when used in combination, cell viability decreased more quickly with increasing concentration of the nanodots or time of irradiation, indicating that the generation of ROS was concentration- and irradiation time-dependent (Figures 4B, C). These results show that the therapeutic efficiency can be regulated by controlling the laser irradiation time or the concentration of the nanodots. To better demonstrate the cytotoxic effect of PDT on HepG2 cells, calcein-AM/ propidium iodide (PI) staining post-exposure to PDT was performed to distinguish live and dead cells. As shown in Figure S8, an increase in cell death in time- and concentration-dependent manners was evident from the presence of red-stained cells, which indicates cell membrane damage. Quantitative analysis of selected microscopic fields at 12 h after PDT, in terms of cell counts expressed as percentage of live and dead cells, shows similar time- and concentration- dependent cytotoxicity in Figures 4D, E.
PDT can induce cell death through both apoptosis and necrosis [67]. To further investigate the association between cell death modality and PDT treatment conditions, in terms of nanodot dosage and laser irradiation time, flow cytometry was used to compare the proportion of apoptosis and necrosis. A decreased number of apoptotic cells (Annexin V-FITC positive, PI negative) but an increased number of necrotic cells (Aannexin V-FITC positive, PI positive) was observed with an elevation of the nanodot concentration and irradiation time, demonstrating a cell death transition from apoptosis to necrosis (Figure 4F). Morphological changes of cells were also observed at 12 h after PDT. More specifically, the occurrence of cell shrinkage, which is a hallmark of apoptosis, decreased while that of cell swelling, which is a hallmark of necrosis, increased with an elevation of either nanodot concentration or irradiation time (Figure S9). This is in good agreement with the results obtained from flow cytometry. These results indicate that the dominant cell death modality changes with variations in laser exposure time and nanodot dosage.
The Mechanism of Cell Apoptosis Induced by T-TPETS Nanodot Mediated-PDT
As nanodot-mediated PDT has been regarded as an effective modality to induce cancer cell death, there have been increasing interests in elucidating the underlying mechanisms of induced cell death, especially the mechanism of apoptosis. Many lysosomal targeting PSs have been reported to induce cell apoptosis through the mitochondria-mediated pathway (or intrinsic pathway). Considering that T-TPETS nanodots are also lysosomal targeting, we thus examined the involvement of mitochondrial apoptotic pathway in the HCC cell death induced by the nanodot-mediated PDT.
Figure 2
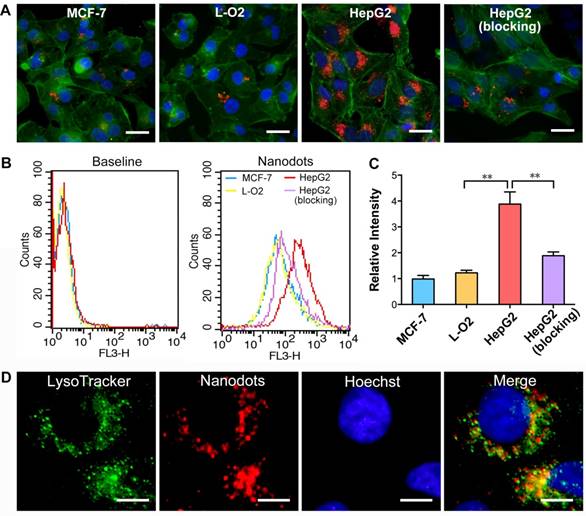
Targeted imaging and subcellular localization of T-TPETS nanodots in vitro. (A) Confocal images of MCF-7, L-O2, and HepG2 cells after incubation with the nanodots (5 μg/mL) for 4 h. Red fluorescence is emitted by the nanodots. Blue fluorescence labels the nuclei, and green fluorescence labels the cytoskeleton. Scale bar: 20 μm. (B, C) Quantitative analysis of the fluorescence intensity of MCF-7, L-O2, and HepG2 cells using flow cytometry after they were incubated with the nanodots (5 μg/mL) for 4 h. **P < 0.01. (D) Co-localization of the nanodots with lysosomes. Scale bar: 10 μm.
Figure 3
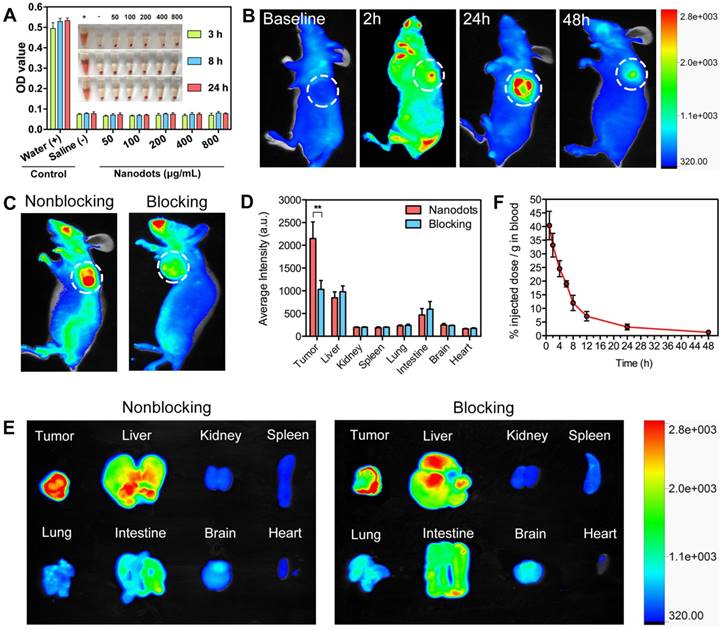
Hemocompatibility, tumor imaging, biodistribution and pharmacokinetics of T-TPETS nanodots in vivo. (A) Hemolysis of red blood cells in the presence of nanodots with various concentrations at preset time. PBS and distilled water were used as negative and positive controls, respectively. Inset: Optical photograph showing the extent of hemolysis after the sample centrifugation. (B) Non-invasive fluorescent images of the tumor-bearing mice after intravenous injection of the nanodots (30 mg/kg) at different time points. The white circles indicate tumor sites. (C) Non-invasive fluorescent images of the tumor-bearing mice at 8 h after intravenous injection of the nanodots (30 mg/kg) without and with receptor blocking. (D) Semi-quantitative biodistribution of the nanodots in mice with and without blocking the receptors with cilengitide. Error bars are based on 3 mice per group. **P < 0.01. (E) Ex vivo fluorescence imaging of the mice tumors and various organs at 8 h post-injection of the nanodots (30 mg/kg) without or with receptor blocking. (F) Pharmacokinetics of the nanodots in the bloodstream at different time points post-injection. Data are expressed as mean ± SD (n = 3).
ROS generation and lysosome disruption, resulting in a leakage of lysosomal protease, serve as the first events inducing apoptosis. As shown in Figure 5A, a low intensity of PDT (5 μg/mL for incubation, 30 J/cm2 for irradiation) could induce rapid generation of ROS (upper row), through which the integrity of HCC cell lysosomes was disrupted, as observed from a decreased lysosome fluorescence (lower row). On the other hand, an exposure of HCC cells to light or nanodots alone did not affect the integrity of lysosome, while the addition of N-acetyl-L-cysteine (NAC, 5 mM), a ROS scavenger, could inhibit this process. These results suggest that the ROS induced by nanodot-based PDT could trigger a rapid destruction of lysosomes. The loss of integrity and release of cytochrome-c from mitochondria is the second event characterizing the mitochondrial apoptotic pathway. JC-1, a commercial fluorescence probe, was used to monitor the mitochondrial membrane potential, ΔΨm, of HCC cells. In fact, ΔΨm was noted to decrease dramatically after the PDT process, while an exposure of the cells to light or nanodots alone did not change ΔΨm (Figure 5B). Western blot results showed that an exposure to nanodots or light alone did not trigger the release of cytochrome-c from mitochondria. However, PDT caused the cytochrome-c release from mitochondria to cytosol in a PDT dose-dependent manner, while the addition of NAC could inhibit this process (Figure 5C). The activation of initiator caspase-9, which then cleaves and activates downstream effector caspase-3, is the third event leading to the mitochondrial apoptosis. To determine whether caspases were activated, we measured changes in caspase-9 and caspase-3 activities in response to nanodot-mediated PDT using western blot analysis. As shown in Figure 5D, neither irradiation nor exposure to nanodot alone activated procaspase-9 or procaspase-3, whereas PDT resulted in the cleavage of procaspase-9 and procaspase-3, generating the activated fragment. All these results verify our hypothesis that the nanodot-based PDT induces apoptosis via a mitochondria-mediated pathway. Briefly, upon light irradiation, the preloaded lysosomal PS causes lysomal disruption, dispersion of lysosomal proteases throughout cytosol, mitochondrial membrane potential damage, release of cytochrome-c, and activation of downstream caspases (caspase-9 and caspase-3), which eventually results in an apoptotic morphotype [68].
Figure 4
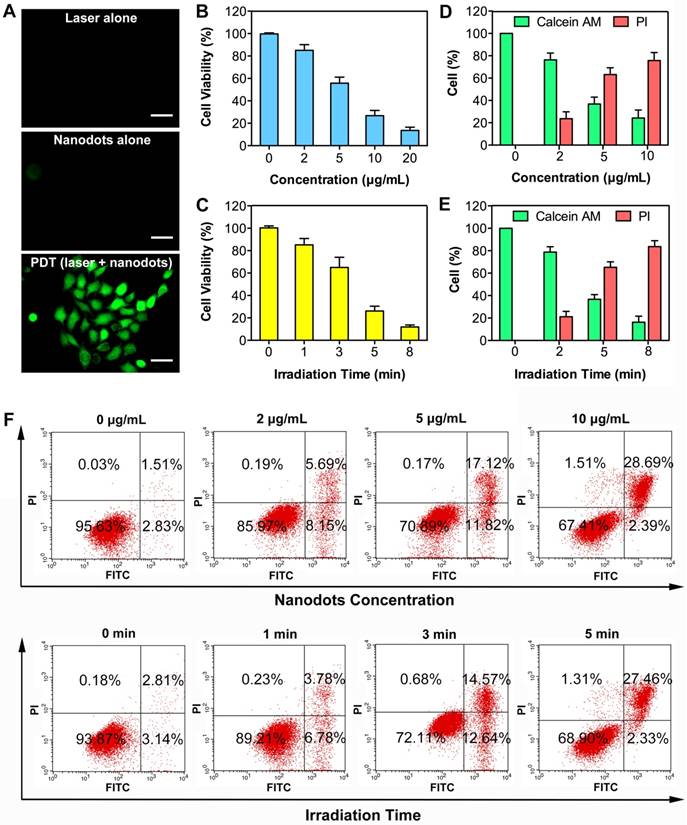
Phototoxicity effect of T-TPETS nanodot-mediated PDT in vitro. (A) Detection of the intracellular ROS production after the nanodot-mediated PDT in HepG2 cells. Cells were incubated with 5 μg/mL T-TPETS nanodots for 4 h and followed by light irradiation (450 nm, 250 mW/cm2) for 3 min. Scale bar: 50 μm. (B) The viability of HepG2 cells pretreated with different concentrations of the nanodots, followed by a 3-min irradiation (450 nm, 250 mW/cm2). (C) The viability of HepG2 cells incubated with 5 μg/mL of the nanodots, which were then subjected to different irradiation time. Data represent mean ± SD, n = 3. (D, E) Semi-quantitative analysis of selected microscopic fields by calcein-AM/PI staining after a 12-h exposure to PDT. Data are presented as percentage of live and dead cells. (F) Flow cytometry analysis of the effect of increasing nanodot concentration or irradiation time on two different cell death modalities (apoptosis and necrosis) in HepG2 cells. The right lower area (Annexin V-FITC- positive, PI-negative cells) indicates apoptotic cells. The right upper area (Annexin V-FITC-positive, PI-positive cells) indicates necrotic cells.
Figure 5
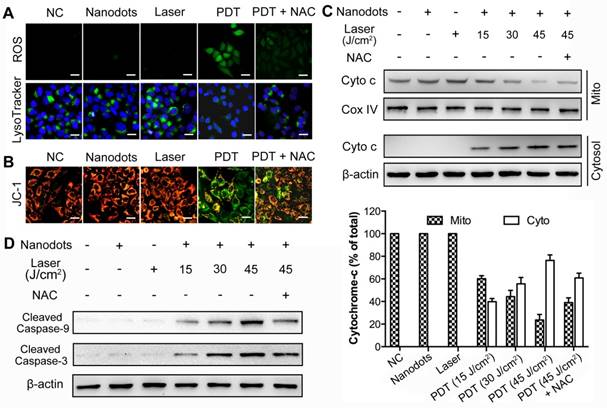
ROS generation, lysosome disruption, cytochrome-c release, as well as caspase-9 and caspase-3 activation, following PDT based on T-TPETS nanodots (NDs) on HepG2 cells. (A) Detection of ROS generation and lysosome integrity in response to low intensity nanodot-mediated PDT. Cells were incubated with nanodots at 5 μg/mL, followed by laser irradiation (450 nm) at 250 mW/cm2 for 2 min (equal to 30 J/cm2). Scale bar: 20 μm. (B) Effects of low intensity nanodot-mediated PDT on mitochondrial membrane potential (ΔΨm). Cells were incubated with nanodots at 5 μg/mL, followed by laser irradiation (450 nm) at 250 mW/cm2 for 2 min (equal to 30 J/cm2). Scale bar: 20 μm. (C) Western blot analysis of cytochrome c release (left) and three separate blots used for quantitative analysis (right). Cells were incubated with 5 μg/mL nanodots for 4 h, followed by varying irradiated durations (450 nm, 250 mW/cm2). (D) Western blot analysis of caspase-9 and caspase-3 activation after various treatments.
Figure 6
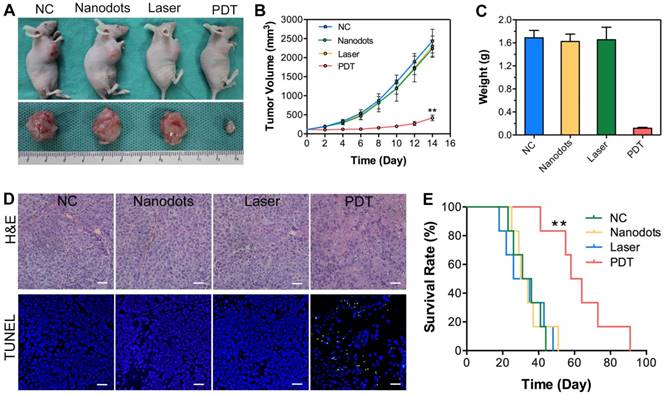
Antitumor efficacy of T-TPETS nanodots in vivo. (A) Representative photographs of xenografted and dissected tumors after different treatments. (B) Tumor volume at different time points post-treatment in 4 groups (n = 3 per group). Data represent mean ± SD. (C) Average tumor weight after 14 days of treatment. Data represent mean ± SD. (D) H&E staining for pathological changes in tumor sections (upper row). TUNEL staining (green) for apoptotic level in tumor sections (lower row). Scale bar: 50 μm. (E) Survival curves of tumor-bearing mice in 4 groups with different treatments (n = 6 per group). **P < 0.01.
PDT Study in Vivo
To confirm the antitumor efficacy of T-TPETS nanodot-PDT in vivo, tumor-bearing mice with similar tumor size of 60 mm3 were divided into four groups: (1) Negative control (PBS, 125 μL); (2) nanodots only (125 μL, 5 mg/mL); (3) laser only (450 nm, 250 mW/cm2, 10 min); (4) nanodots plus laser (450 nm, 250 mW/cm2, 10 min). As shown in Figures 6A, B, the injection of nanodots or laser irradiation alone could not inhibit tumor growth, which was similar to the result noted in PBS group. In contrast, PDT could significantly ablate tumors and retard tumor growth. Upon the completion of treatments, tumor tissues were collected and weighed, and the representative tumor tissues were imaged. As anticipated, significant difference was observed between the PDT group and other groups based on the tumor images and weight (Figure 6C). To further verify the antitumor effect of the nanodot-mediated PDT, histological changes and apoptosis levels of tumors were analyzed using both hematoxylin and eosin (H&E) staining and TUNEL assay, respectively, at 72 h after various treatments. As shown in Figure 6D, tumor cells in both the nanodot alone and laser alone groups were dense, which are similar to the ones in the PBS group. On the contrary, tumor cells in the PDT group displayed the greatest nuclei absence, suggesting that most tumor cells were destroyed during the PDT process. The apoptosis levels in tumors as revealed by TUNEL assay followed the same trend (Figure 6D). In addition, the mice in the PDT group had a significant extension of survival (P < 0.01), as shown in Figure 6E. All these results suggest that the T-TPETS nanodot-mediated PDT serves as a powerful strategy for tumor ablation in vivo.
Systemic Toxicity Evaluation in Vivo
To assess the potential systemic toxicity of T-TPETS nanodots, 250 μL of the nanodots (5 mg/mL), which is the double dose of that used for PDT, was intravenously injected into healthy mice. No noticeable body weight loss was observed in the nanodots group as compared to the ones in the PBS group (Figure S10). For the blood biochemistry test, we focused on the hepatic and kidney function indicators, in terms of albumin (ALB), alanine transaminase (ALT), blood urea nitrogen (BUN), and serum creatinine (Cr). As displayed in Figure S11, no significant difference is observed from the levels of these markers between the two groups, indicating good hepatic and kidney safety profiles of the nanodots. To further evaluate their toxicity, especially the potential tissue damage, inflammation, or lesions caused by the nanodots, H&E staining examination was conducted. No pathological change was observed 7 days after the nanodot injection (Figure S12). Taken together, these results indicate that the nanodots are highly biocompatible in live mice, which is crucial for in vivo biomedical applications.
Conclusion
In summary, we successfully developed smart organic nanodots based on a red emissive AIE PS for targeted image-guided PDT of HCC. This synthetic process was simple, straightforward, and effective. The nanodots exhibited high brightness and excellent ROS generation, as well as good biocompatibility and negligible dark toxicity. In vitro and in vivo experimental results revealed the excellent tumor-targeted imaging performance of the nanodots and their advantages in facilitating the image-guided PDT for robust tumor ablation. Detailed study on the apoptotic mechanism suggested that the nanodot-based PDT induced cell apoptosis through the mitochondria-mediated pathway. Overall, the studies comprehensively demonstrated the significant potential applications of these smart nanodots for image-guided PDT of HCC.
Materials and Methods
Materials
1,2-Distearoyl-sn-glycero-3-phosphoethanolamine-N-[maleimide(polyethylene glycol)-2000] (DSPE-PEG2000-Mal) was purchased from Avanti Polar Lipids, Inc. (Alabaster, AL, USA). The photosensitizer (TPETS) was synthesized according to our previous report [17]. Thiolated cyclic (Arg-Gly-Asp-D-Phe-Lys(mpa)) peptide (c(RGDfK)) was customized from GL Biochem Ltd (Shanghai, China). Dulbecco's Modified Eagle's Medium (DMEM), fetal bovine serum (FBS), collagenase type IV and JC-1 were purchased from Thermo Fisher Scientific (Waltham, MA, USA). Trizol reagent was purchased from Life Technologies (Grand Island, NY, USA). PrimeScript RT Master Mix and SYBR Green PCR Kit were purchased from Takara Bio, Inc. (Kusatsu, Shiga, Japan). Primers were designed by Sangon Biotech (Shanghai, China). Monoclonal anti-integrin αvβ3 antibody was purchased from Merck Millipore (Temecula, CA, USA). Antibodies to cleaved caspase-9, cleaved caspase-3, cytochrome-c, Cox-IV and β-actin antibodies were obtained from Cell Signaling Technology (Danvers, MA, USA). RIPA, ECL substrate, FITC-labeled anti-mouse secondary antibody, BCA protein assay kit, as well as mitochondria and nuclear protein extraction kit were purchased from Boster, Inc. (Wuhan, China). 9,10-anthracenediyl-bis(methylene) dimalonic acid (ABDA), 2',7'-dichlorofluorescin diacetate (DCFH-DA), FITC-Phalloidin, proteinase K were purchased from Sigma-Aldrich (St Louis, MO, USA). Cilengitide was purchased from Selleck Chemicals, Inc. (Houston, TX, USA). Cell Counting Kit-8 (CCK8) was purchased from Dojindo Molecular Technologies, Inc. (Mashikimachi, Japan). Annexin V-FITC/PI apoptosis detection kit and TUNEL apoptosis assay kit was purchased from Beyotime Biotechnology (Jiangsu, China). Calcein-AM/PI dual staining kit was purchased from Qcbio Science & Technologies (Shanghai, China).
Preparation and Encapsulation Efficiency of TPETS-loaded Nanodots (TPETS Nanodots)
A THF solution (1 mL) containing DSPE-PEG- Mal (1.0 mg) and TPETS (0.5 mg) was poured into water (10 mL). This was followed by sonicating the mixture for 2 min at 12 W output using a microtip probe sonicator (XL2000, Misonix Incorporated, NY). The mixture was then stirred at room temperature overnight to evaporate the organic solvent. The nanodot suspension was further filtered with a 0.2 μm syringe filter to obtain TPETS nanodots. TPETS encapsulated in the nanodots was calculated by measuring the absorbance at 450 nm and comparing it with a standard curve. The encapsulation efficiency (%) was calculated as follows: encapsulation efficiency = [amount of TPETS in the nanodots]/[total amount of TPETS used] × 100.
Conjugation of cRGD to TPETS Nanodots (T-TPETS Nanodots)
Thiolated cRGD was conjugated to the surface of TPETS nanodots (denoted as T-TPETS nanodots) according to the following procedure. First, TPETS nanodots were suspended in HEPES buffer (0.2 mg/mL) and incubated with excess thiolated cRGD at room temperature for 6 h. The cRGD-functionalized nanodots were then washed with Milli-Q water (3 mL × 3 times) by ultrafiltration (20,000 MWCO, Amicon, Millipore Corporation, Bedford, USA). The filtrate was next recycled to measure the conjugation rate of cRGD.
Determination of the Conjugation Rate of cRGD
The cRGD concentration in the filtrate was determined using the HPLC system (Agilent 1200, USA). The mobile phase was a mixture of solvent A (0.1% trifluoroacetic acid in water) and solvent B (0.1% trifluoroacetic acid in acetonitrile) at a flow rate of 1.0 mL/min. The sample injection volume was 0.1 mL, and the detector wavelength was 214 nm. The conjugation rate was calculated using the formula: Conjugation rate = (cRGDTotal - cRGDFiltrate)/ cRGDTotal × 100%.
Detection of ROS in Solution
ROS generation was studied using ABDA as a ROS indicator, as the absorbance of ABDA decreases upon reaction with ROS. For ROS detection, the stock solution of ABDA in DMSO was mixed with T-TPETS nanodots (1 μg/mL) and exposed to white light irradiation (250 mW/cm2). The decomposition of ABDA was monitored through variations in absorbance.
Cell Culture
MCF-7 human breast cancer cells and HepG2 human hepatocarcinoma cells were supplied by American Type Culture Collection. L-O2 human normal liver cells were purchased from the Cell Bank of the Chinese Academy of Sciences (Shanghai, China). The cells were cultured in DMEM containing 10% FBS and 1% penicillin streptomycin at 37 °C in a humidified environment containing 5% CO2.
Quantitative Real-Time PCR
Cellular total RNA was extracted using Trizol, and quantified using NanoDrop ND-1000 spectrophotometer (NanoDrop Technologies, Thermo). The first strand cDNA was synthesized by reverse transcription from 0.5 μg total RNA with PrimeScript RT Master Mix. Quantitative real-time PCR was performed using a quantitative TAKARA SYBR Green PCR Kit. Each sample was set up in triplicate wells. The mRNA levels of the targeted genes were expressed with the 2-ΔΔCTmethod and normalized to GAPDH. Primer sequences are listed as follows: integrin alpha v forward primer: 5′-ATCTGTGAGGTCGAAACAGGA-3′, reverse primer: 5′- TGGAGCATACTCAACAGTCTTTG-3′; integrin beta 3 forward primer: 5′- GTGACCTGAAGGAGAATCTGC-3′, reverse primer: 5′-CCGGAGTGCAATCCTCTGG-3′; GAPDH forward primer: 5′-GGAGCGAGATCCCTCCAAAAT-3′, reverse primer: 5′- GGCTGTTGTCATACTTCTCATGG -3′.
Immunofluorescence Analysis
Twenty pairs of human hepatocarcinoma and normal liver tissues (3 cm away from tumor) were collected from patients in Union Hospital, Tongji Medical College, HUST (Wuhan, China). The study protocol was approved by the Medical Ethics Committee of the Tongji Medical College (IORG number: IORG0003571) and the study was performed in accordance with the declaration of Helsinki. Written consents were obtained from all individuals before surgery. Specimens were placed in liquid nitrogen and sectioned to 3 μm for assay. All specimen slices were incubated in 0.5% bovine serum albumin for 30 min to block non-specific antibody binding. The slices were stained using monoclonal anti-integrin αvβ3 antibody (1:100) at 4 °C overnight. Slices were incubated with FITC-labeled anti-mouse antibody (1:200) in the dark for 1 h. DAPI (1:1000) was used to localize nuclei of cells.
Confocal Imaging
Cells were seeded and cultured in slide chambers overnight for adhesion and then incubated with nanodots (5 μg/mL) for 4 h. Cells were washed three times with PBS and fixed with 4% paraformaldehyde for 10 min. After permeabilization with 0.2% Triton X-100 for 5 min, cells were stained with 10 μg/mL of FITC-Phalloidin at 37 °C in the dark for 1 h. Nuclei were stained with Hoechst 33342 for 5 min. After washing three times with PBS, cells were subjected to imaging analysis directly using a laser confocal microscope (Nikon, Japan).
Quantitative Analysis of Nanodots Uptake by Flow Cytometry
For in vitro experiments, approximately 1 × 10⁵ cells were seeded and cultured in slide chambers overnight for adhesion. After carefully washing with PBS three times, the cells were treated with nanodots (5 μg/mL) for 4 h. After incubation, the cells were washed three times with PBS and harvested after digestion with trypsin. The fluorescence intensity of the cells was determined by a flow cytometry (BD, CA, USA). For in vivo experiments, tumors were excised from mice with and without receptor blocking. Tumors from the non-treated animals served as controls. Tumors were mechanically fragmented, and treated sequentially with three portions of disaggregation solution (0.1% collagenase type IV, 0.01% hyaluronidase, and 0.003% DNase I in Hank's buffered salt solution) for 20 min at 37 °C with slow agitation. Following centrifugation at 4 °C, cell pellets were gently resuspended in cold PBS and centrifuged again. After three washes, cells were resuspended in PBS and strained through a 40 μm mesh (BD Falcon, CA USA). The cellular uptake analysis was performed directly using flow cytometry.
Co-localization between Nanodots and Lysosomes
The cells were seeded in a 35-mm confocal dish and cultured in DMEM supplemented with 10% FBS overnight for attachment. Cells were incubated with nanodots for 4 h and stained with 1 mM Lysotracker Green. Hoechst 33342 was used to localize cell nuclei. Cells were washed and imaged by the above-mentioned confocal microscopy.
Hemolysis Assay
Blood samples (1 mL) obtained from BALB/c mice by heart puncture were diluted with 2 mL PBS. Red blood cells (RBCs) were separated from the serum by centrifugation at 2000 rpm for 10 min. After being washed for three times, the RBCs were then diluted with 10 mL of PBS. A suspension of RBCs (30 μL) was mixed with 120 μL of PBS (negative control), distilled water (positive control), and nanodots at different concentrations (50~800 μg/mL). After incubating at 37 °C for 1 h, 2 h and 3 h, the mixtures were centrifuged at 12000 rpm for 10 min. The hemolysis images were collected and then the supernatants (100 μL) of each tube were added to a 96-well plate, and their absorbance at 570 nm was measured using a Multiskan GO Microplate Spectrophotometer (Thermo Scientific, USA).
Animal Tumor Model
All animal experiments were performed in compliance with the guidelines of the Animal Care Committee at Tongji Medical College, HUST (Wuhan, China). To establish tumor models, 1 × 10⁷ HepG2 cells were inoculated subcutaneously into the right front flanks of BALB/c nude mice. Tumor growth was measured using a caliper, and tumor volume was calculated using the formula: volume = ((tumor length) × (tumor width)2)/2.
In Vivo Fluorescence Imaging and Biodistribution Analysis
The tumor-bearing mice were established as described above. When the tumor volume reached 60 mm3, 125 μL of nanodots (5 mg/mL) were intravenously injected via the tail vein. For the blocking experiment, mice were injected with cilengitide (100 μg) 30 min before administration of the nanodots. Real-time fluorescence imaging was performed using an In-Vivo FX PRO (BRUKER, Germany) for preset times. Subsequently, the mice from the receptor blocking and non-blocking groups were sacrificed, and major organs (liver, kidney, spleen, heart, lung, brain, and intestine) and tumors were then collected. Fluorescence intensity of various organs and tumors of both groups (n = 3 in each group) were measured.
Intratumoral Microdistribution of Nanodots within Tumor Tissue
The tumor-bearing mice models were established as described above. The non-blocking mice were intravenously injected with 30 mg/kg nanodots while the blocking mice were preinjected with cilengitide (100 μg) 30 min before the administration of nanodots. Tumors were excised from the mice and frozen by placing them in liquid nitrogen. Frozen tumors were cut into 3 μm sections for fluorescent assays. Before observing with a fluorescence microscope, sections were fixed with 4% paraformaldehyde for 10 min and nuclei were stained with DAPI for 5 min.
Pharmacokinetics Study of Nanodots
For pharmacokinetics study, about 100 μL blood samples of the mice were obtained at 1, 2, 4, 6, 8, 12, 24 and 48 h after intravenous injection of nanodots. The blood samples were then solubilized with lysis buffer (RIPA), and subjected to ultrasound for 5 min. The fluorescence intensity of the solution at 645 nm was recorded using a microplate reader (EnSpire™, Perkin Elmer, USA). Thereafter, the data for the relevant pharmacokinetic parameters were analyzed using a non-compartment elimination model. The half-life of the nanodot was calculated by the WinNonlin v.5.1 software (Pharsight Inc., Mountain View, CA, USA).
Intracellular ROS Detection
Intracellular ROS production was assessed by commonly used probe DCFH-DA according to the manufacturer's instructions. After incubation in the presence and absence of the nanodots for 4 h, cells were incubated with 1 μM DCFH-DA at 37 °C for 30 min in the dark. Cells were washed twice with PBS and then exposed to laser irradiation at the power density of 250 mW/cm2. Fluorescence from DCF was observed using fluorescence microscope (IX71, Olympus, Japan) after irradiation.
Cytotoxicity Study
Cell viability after different treatments was evaluated using CCK8 assays. Cells were first incubated in the presence or absence of nanodots for 4 h in the dark, then subjected to CCK8 assay to yield dark toxicity results, or exposed to light irradiation to assess the phototoxicity. All cells were first incubated in a 96-well plate, then washed with PBS buffer twice before light irradiation at a power density of 250 mW/cm2. After incubation for another 24 h, 10 μL of CCK8 was added into each well, and the incubation continued for 3 h. The absorbance of solution at 450 nm was detected using a Multiskan GO Microplate Spectrophotometer (Thermo Scientific, USA).
Calcein-AM/propidium iodide (PI) Dual Fluorescence Stain
Calcein-AM/PI dual fluorescent assay was used to differentiate the live and dead cells according to the protocol. After different treatments, the mixture of calcein-AM (2 μM) and PI (5 μM) was added to the cells and further incubated for 20 min at 37 °C. Fluorescent images were visualized under fluorescence microscope (IX71, Olympus, Japan). Randomized microscopic fields were selected to count the percentage of the live (calcein-positive) and dead (PI-positive) cells.
Flow Cytometry Analysis of Apoptosis and Necrosis
The proportion of apoptotic and necrotic cells were quantified using Annexin V-fluorescein isothiocyanate (FITC)/propidium iodide (PI) dual staining. Briefly, HepG2 cells were exposed to increasing concentrations of nanodots or increasing time of irradiation and further incubated for 12 h. The cells were then washed twice with PBS and harvested after digestion with trypsin. The cells were centrifuged and resuspended in 100 μL of binding buffer. They were then stained with 5 μL Annexin V-FITC and 10 μL PI for 15 min in the dark at room temperature, then analyzed using flow cytometry (BD, CA, USA) within 1 h.
Mitochondrial Membrane Potential (ΔΨm) Measurement
The ΔΨm of cells was detected by JC-1 mitochondrial membrane potential probe in accordance with the manufacturer's protocol. Briefly, after different treatments, cells were incubated with 2 μg/mL of JC-1 for 20 min at 37 °C. After washing twice with PBS, the cells were observed using fluorescence microscopy.
Immunoblot Analysis
The total protein was extracted using a RIPA lysis buffer. The cytosolic protein and mitochondrial protein were extracted using a mitochondria and nuclear protein extraction kit, respectively, according to the manufacturer's protocol. The concentration of each sample was determined using a BCA protein assay kit. Briefly, equivalent amounts of protein were loaded for SDS-PAGE and transferred onto PVDF membranes (Millipore, Bedford, USA), which were then blocked with 5% non-fat milk for 1 h. Primary antibodies were incubated overnight at 4 °C. Subsequent to incubation with HRP-conjugated secondary antibodies, immunoreactivity was detected using ECL substrate and recorded using ChemiDoc imaging system (Bio-Rad, Hercules, USA).
In vivo PDT Efficacy of T-TPETS Nanodots
When the tumor size reached ~60 mm3, HepG2 tumor-bearing mice were divided into 4 groups (n = 9, in each group): (1) PBS (125 μL); (2) nanodots only (125 μL, 30 mg/kg); (3) laser only (450 nm, 250 mW/cm2, 10 min); (4) nanodots plus laser (450 nm, 250 mW/cm2, 10 min). The nanodots were administrated for only a single time, and laser irradiation was performed 12 h after injection. Three days after different treatments, 3 mice from each group were sacrificed, and the tumors were excised for further study. Tumor sizes were measured for 14 days after treatment and the survival time of the rest of the mice in each group (n = 6) treated with the same method were recorded every week.
Hematoxylin and Eosin (H&E) Staining
Tumors and major organs were fixed using 10% formalin for at least 24 h. Samples were then paraffin-embedded, and slices were stained with hematoxylin-eosin (H&E). Histopathological changes were observed using optical microscopy (Olympus, Japan).
TUNEL Assay
Apoptosis of mice tumor tissues at 72 h after treatments were assessed using a one-step TUNEL apoptosis assay kit. The paraffin-embedded sections of the tumors were deparaffinized and treated with 20 μg/mL of proteinase K at 37 °C for 10 min. After rinsing, sections were incubated with TUNEL reaction mixture for 1 h at 37 °C in the dark. DAPI was used to stain for the nuclei of cells. Fluorescence images were acquired using fluorescence microscope.
In Vivo Biosafety Analysis
Healthy male Balb/c mice were divided into 2 groups (n = 4, in each group). One group of mice was intravenously injected with 250 μL nanodots (5 mg/mL) and the other group treated with PBS was used as control. At 7 days after administration, the mice were anaesthetized and their blood samples were collected for blood chemistry tests. Subsequently, the main organs of the mice (heart, liver, spleen, lung, kidney, brain, muscle, and intestine) were harvested and stained using H&E for histological observations.
Statistical analysis
SPSS 23.0 software (SPSS Inc., Chicago) was used for statistical analysis. Quantitative data were expressed as mean ± SD. ANOVA analysis and Student's t test were utilized for statistical contrast. P < 0.05 was considered statistically significant. Survival curves were compared using log rank analyses.
Abbreviations
HCC: hepatocellular carcinoma; PS: photosensitizer; PDT: photodynamic therapy; ACQ: aggregation caused quenching; ROS: reactive oxygen species; AIE: aggregation-induced emission; EPR: enhanced permeability and retention; DSPE-PEG2000-Mal: 1,2-Distearoyl-sn-glycero-3-phosphoethanolamine-N-[maleimide(polyethylene glycol)-2000]; ABDA: 9,10-anthracenediyl-bis(methylene)dimalonic acid; ALB: albumin; ALT: alanine transaminase; BUN: blood urea nitrogen; Cr: creatinine; DLS: dynamic light scattering; TEM: transmission electron microscopy; CLSM: confocal laser scanning microscopy; Ce6: chlorin e6.
Acknowledgements
This work was supported by the Open Fund of the State Key Laboratory of Luminescent Materials and Devices (South China University of Technology, No. 2017-skllmd-02), the National Science Foundation of China (No.81874231, No.81874208, No.81372668, No.81502527), Natural Science Foundation of Hubei Province, China (No.2015CFB527) and Fundamental Research Funds for the Central Universities, China (No.2014QN064). B.L. is grateful to the Singapore National Research Foundation (R279-000-483-281, R279-000-444-281) and National University of Singapore (R279-000-482-133) for financial support. M.L. thanks the support from the Research Grant of Union Hospital, Tongji Medical College, HUST (No.02.03.2015-74).
Supplementary Material
Supplementary figures and tables.
Competing Interests
The authors have declared that no competing interest exists.
References
1. Maluccio M, Covey A. Recent progress in understanding, diagnosing, and treating hepatocellular carcinoma. CA Cancer J Clin. 2012;62:394-9
2. Zhu RX, Seto WK, Lai CL, Yuen MF. Epidemiology of Hepatocellular Carcinoma in the Asia-Pacific Region. Gut Liver. 2016;10:332-9
3. Choo SP, Tan WL, Goh BK, Tai WM, Zhu AX. Comparison of hepatocellular carcinoma in Eastern versus Western populations. Cancer. 2016
4. Forner A, Llovet JM, Bruix J. Hepatocellular carcinoma. Lancet. 2012;379:1245-55
5. Verslype C, Rosmorduc O, Rougier P, Group EGW. Hepatocellular carcinoma: ESMO-ESDO Clinical Practice Guidelines for diagnosis, treatment and follow-up. Ann Oncol. 2012;23(Suppl 7):vii41-8
6. Bruix J, Sherman M, American Association for the Study of Liver D. Management of hepatocellular carcinoma: an update. Hepatology. 2011;53:1020-2
7. Bureau of Medical Administration NHaFPCotP. Standardization of diagnosis and treatment for hepatocellular carcinoma. Chin J Dig Surg. 2017;16:635-47
8. Koda M, Murawaki Y, Hirooka Y, Kitamoto M, Ono M, Sakaeda H. et al. Complications of radiofrequency ablation for hepatocellular carcinoma in a multicenter study: An analysis of 16 346 treated nodules in 13 283 patients. Hepatol Res. 2012;42:1058-64
9. Brown SB, Brown EA, Walker I. The present and future role of photodynamic therapy in cancer treatment. Lancet Oncol. 2004;5:497-508
10. Oniszczuk A, Wojtunik-Kulesza KA, Oniszczuk T, Kasprzak K. The potential of photodynamic therapy (PDT)-Experimental investigations and clinical use. Biomed Pharmacother. 2016;83:912-29
11. Cao B, Yang M, Zhu Y, Qu X, Mao C. Stem cells loaded with nanoparticles as a drug carrier for in vivo breast cancer therapy. Adv Mater. 2014;26:4627-31
12. Castano AP, Mroz P, Hamblin MR. Photodynamic therapy and anti-tumour immunity. Nat rev Cancer. 2006;6:535-45
13. Duan X, Chan C, Guo N, Han W, Weichselbaum RR, Lin W. Photodynamic Therapy Mediated by Nontoxic Core-Shell Nanoparticles Synergizes with Immune Checkpoint Blockade To Elicit Antitumor Immunity and Antimetastatic Effect on Breast Cancer. J Am Chem Soc. 2016;138:16686-95
14. Li M, Gao Y, Yuan Y, Wu Y, Song Z, Tang BZ. et al. One-Step Formulation of Targeted Aggregation-Induced Emission Dots for Image-Guided Photodynamic Therapy of Cholangiocarcinoma. ACS Nano. 2017;11:3922-32
15. Yuan Y, Feng G, Qin W, Tang BZ, Liu B. Targeted and image-guided photodynamic cancer therapy based on organic nanoparticles with aggregation-induced emission characteristics. Chem Commun. 2014;50:8757
16. Zhang R, Feng G, Zhang CJ, Cai X, Cheng X, Liu B. Real-Time Specific Light-Up Sensing of Transferrin Receptor: Image-Guided Photodynamic Ablation of Cancer Cells through Controlled Cytomembrane Disintegration. Anal Chem. 2016;88:4841-8
17. Yuan Y, Xu S, Cheng X, Cai X, Liu B. Bioorthogonal Turn-On Probe Based on Aggregation-Induced Emission Characteristics for Cancer Cell Imaging and Ablation. Angew Chem Int Ed Engl. 2016;55:6457-61
18. Terreno E, Uggeri F, Aime S. Image guided therapy: the advent of theranostic agents. J Control Release. 2012;161:328-37
19. Hu D, Chen L, Qu Y, Peng J, Chu B, Shi K. et al. Oxygen-generating Hybrid Polymeric Nanoparticles with Encapsulated Doxorubicin and Chlorin e6 for Trimodal Imaging-Guided Combined Chemo-Photodynamic Therapy. Theranostics. 2018;8:1558-74
20. Vahrmeijer AL, Hutteman M, van der Vorst JR, van de Velde CJ, Frangioni JV. Image-guided cancer surgery using near-infrared fluorescence. Nat Rev Clin Oncol. 2013;10:507-18
21. Mroz P, Hashmi JT, Huang YY, Lange N, Hamblin MR. Stimulation of anti-tumor immunity by photodynamic therapy. Expert Rev Clin Immunol. 2011;7:75-91
22. Mirzaei H, Djavid GE, Hadizadeh M, Jahanshiri-Moghadam M, Hajian P. The efficacy of Radachlorin-mediated photodynamic therapy in human hepatocellular carcinoma cells. J Photochem Photobiol B. 2015;142:86-91
23. Shao J, Xue J, Dai Y, Liu H, Chen N, Jia L. et al. Inhibition of human hepatocellular carcinoma HepG2 by phthalocyanine photosensitiser PHOTOCYANINE: ROS production, apoptosis, cell cycle arrest. Eur J Cancer. 2012;48:2086-96
24. Egger NG, Schoenecker JA Jr, Gourley WK, Motamedi M, Anderson KE, Weinman SA. Photosensitization of experimental hepatocellular carcinoma with protoporphyrin synthesized from administered delta-aminolevulinic acid: studies with cultured cells and implanted tumors. J Hepatol. 1997;26:913-20
25. van Duijnhoven FH, Rovers JP, Engelmann K, Krajina Z, Purkiss SF, Zoetmulder FA. et al. Photodynamic therapy with 5,10,15,20-tetrakis(m-hydroxyphenyl) bacteriochlorin for colorectal liver metastases is safe and feasible: results from a phase I study. Ann Surg Oncol. 2005;12:808-16
26. Shaohong Shang SW, Haiping Zhang, Chaoying Zeng. Effect of Photodynamic Therapy on Primary Liver Cancer and its Clinical Significance. J Fujian Med Univ. 2004;38(4):419-21
27. Gillams AR. Liver ablation therapy. Br J Radiol. 2004;77:713-23
28. Yu CY, Xu H, Ji S, Kwok RT, Lam JW, Li X. et al. Mitochondrion-Anchoring Photosensitizer with Aggregation-Induced Emission Characteristics Synergistically Boosts the Radiosensitivity of Cancer Cells to Ionizing Radiation. Adv Mater. 2017:29
29. Chen C, Song Z, Zheng X, He Z, Liu B, Huang X. et al. AIEgen-based theranostic system: targeted imaging of cancer cells and adjuvant amplification of antitumor efficacy of paclitaxel. Chem Sci. 2017;8:2191-8
30. Gao L, Zhang C, Gao D, Liu H, Yu X, Lai J. et al. Enhanced Anti-Tumor Efficacy through a Combination of Integrin alphavbeta6-Targeted Photodynamic Therapy and Immune Checkpoint Inhibition. Theranostics. 2016;6:627-37
31. Longo JPF, Muehlmann LA, Miranda-Vilela AL, Portilho FA, de Souza LR, Silva JR. et al. Prevention of Distant Lung Metastasis After Photodynamic Therapy Application in a Breast Cancer Tumor Model. J Biomed Nanotechnol. 2016;12:689-99
32. van Nostrum CF. Polymeric micelles to deliver photosensitizers for photodynamic therapy. Adv Drug Deliv Rev. 2004;56:9-16
33. Konan YN, Gurny R, Allemann E. State of the art in the delivery of photosensitizers for photodynamic therapy. J Photochem Photobiol B. 2002;66:89-106
34. Zhang K, Yang Z, Meng X, Cao Y, Zhang Y, Dai W. et al. Peroxidase-like Fe3O4 Nanocomposite for Activatable Reactive Oxygen Species Generation and Cancer Theranostics. Mater Chem Front. 2018;6:1184-94
35. Yoshioka E, Chelakkot VS, Licursi M, Rutihinda SG, Som J, Derwish L. et al. Enhancement of Cancer-Specific Protoporphyrin IX Fluorescence by Targeting Oncogenic Ras/MEK Pathway. Theranostics. 2018;8:2134-46
36. Liu K, Liu Y, Yao Y, Yuan H, Wang S, Wang Z. et al. Supramolecular photosensitizers with enhanced antibacterial efficiency. Angew Chem Int Ed Engl. 2013;52:8285-9
37. Kim S, Ohulchanskyy TY, Pudavar HE, Pandey RK, Prasad PN. Organically modified silica nanoparticles co-encapsulating photosensitizing drug and aggregation-enhanced two-photon absorbing fluorescent dye aggregates for two-photon photodynamic therapy. J Am Chem Soc. 2007;129:2669-75
38. Sekkat N, van den Bergh H, Nyokong T, Lange N. Like a bolt from the blue: phthalocyanines in biomedical optics. Molecules. 2011;17:98-144
39. Mei J, Leung NL, Kwok RT, Lam JW, Tang BZ. Aggregation-Induced Emission: Together We Shine, United We Soar!. Chem Rev. 2015;115:11718-940
40. Gan S, Zhou J, Smith TA, Su H, Luo W, Hong Y. et al. New AIEgens with delayed fluorescence for fluorescence imaging and fluorescence lifetime imaging of living cells. Mater Chem Front. 2017;1:2554-8
41. Feng Q, Li Y, Wang L, Li C, Wang J, Liu Y. et al. Multiple-color aggregation-induced emission (AIE) molecules as chemodosimeters for pH sensing. Chem Commun (Camb). 2016;52:3123-6
42. Chen Y, Li M, Hong Y, Lam JW, Zheng Q, Tang BZ. Dual-modal MRI contrast agent with aggregation-induced emission characteristic for liver specific imaging with long circulation lifetime. ACS Appl Mater Interfaces. 2014;6:10783-91
43. Li M, Hong Y, Wang Z, Chen S, Gao M, Kwok RT. et al. Fabrication of chitosan nanoparticles with aggregation-induced emission characteristics and their applications in long-term live cell imaging. Macromol Rapid Commun. 2013;34:767-71
44. Zhang X, Zhang X, Tao L, Chi Z, Xu J, Wei Y. Aggregation induced emission-based fluorescent nanoparticles: fabrication methodologies and biomedical applications. J Mater Chem B. 2014;2:4398
45. Leung NL, Xie N, Yuan W, Liu Y, Wu Q, Peng Q. et al. Restriction of intramolecular motions: the general mechanism behind aggregation-induced emission. Chemistry. 2014;20:15349-53
46. Li K, Liu Y, Li Y, Feng Q, Hou H, Tang BZ. 2,5-bis(4-alkoxycarbonylphenyl)-1,4-diaryl-1,4-dihydropyrrolo[3,2-b]pyrrole (AAPP) AIEgens: tunable RIR and TICT characteristics and their multifunctional applications. Chem Sci. 2017;8:7258-67
47. Liang J, Tang BZ, Liu B. Specific light-up bioprobes based on AIEgen conjugates. Chem Soc Rev. 2015;44:2798-811
48. Yi X, Li J, Zhu Z, Liu Q, Xue Q, Ding D. In vivo cancer research using aggregation-induced emission organic nanoparticles. Drug Discov Today. 2017
49. Gao M, Tang BZ. Aggregation-induced emission probes for cancer theranostics. Drug Discov Today. 2017
50. Yan L, Zhang Y, Xu B, Tian W. Fluorescent nanoparticles based on AIE fluorogens for bioimaging. Nanoscale. 2016;8:2471-87
51. Yuan Y, Zhang C-J, Kwok RTK, Xu S, Zhang R, Wu J. et al. Light-Up Probe for Targeted and Activatable Photodynamic Therapy with Real-Time In Situ Reporting of Sensitizer Activation and Therapeutic Responses. Adv Funct Mater. 2015;25:6586-95
52. Xu S, Yuan Y, Cai X, Zhang C-J, Hu F, Liang J. et al. Tuning the singlet-triplet energy gap: a unique approach to efficient photosensitizers with aggregation-induced emission (AIE) characteristics. Chem Sci. 2015;6:5824-30
53. Wu W, Mao D, Hu F, Xu S, Chen C, Zhang CJ. et al. A Highly Efficient and Photostable Photosensitizer with Near-Infrared Aggregation-Induced Emission for Image-Guided Photodynamic Anticancer Therapy. Adv Mater. 2017
54. Alifu N, Dong X, Li D, Sun X, Zebibula A, Zhang D. et al. Aggregation-induced emission nanoparticles as photosensitizer for two-photon photodynamic therapy. Mater Chem Front. 2017;1:1746-53
55. Qi J, Chen C, Zhang X, Hu X, Ji S, Kwok RTK. et al. Light-driven transformable optical agent with adaptive functions for boosting cancer surgery outcomes. Nat Commun. 2018;9:1848
56. Li M, Zhang W, Wang B, Gao Y, Song Z, Zheng QC. Ligand-based targeted therapy: a novel strategy for hepatocellular carcinoma. Int J Nanomedicine. 2016;11:5645-69
57. Conde J, Oliva N, Zhang Y, Artzi N. Local triple-combination therapy results in tumour regression and prevents recurrence in a colon cancer model. Nat Mater. 2016;15:1128-38
58. Huveneers S, Truong H, Danen HJ. Integrins: signaling, disease, and therapy. Int J Radiat Biol. 2007;83:743-51
59. Hosotani R, Kawaguchi M, Masui T, Koshiba T, Ida J, Fujimoto K. et al. Expression of integrin alphaVbeta3 in pancreatic carcinoma: relation to MMP-2 activation and lymph node metastasis. Pancreas. 2002;25:e30-5
60. Gvozdenovic A, Boro A, Meier D, Bode-Lesniewska B, Born W, Muff R. et al. Targeting alphavbeta3 and alphavbeta5 integrins inhibits pulmonary metastasis in an intratibial xenograft osteosarcoma mouse model. Oncotarget. 2016;7:55141-54
61. Zhang MZ, Li C, Fang BY, Yao MH, Ren QQ, Zhang L. et al. High transfection efficiency of quantum dot-antisense oligonucleotide nanoparticles in cancer cells through dual-receptor synergistic targeting. Nanotechnology. 2014;25:255102
62. Zhang R, Pan D, Cai X, Yang X, Senpan A, Allen JS. et al. alphaVbeta3-targeted copper nanoparticles incorporating an Sn 2 lipase-labile fumagillin prodrug for photoacoustic neovascular imaging and treatment. Theranostics. 2015;5:124-33
63. Winter PM, Caruthers SD, Allen JS, Cai K, Williams TA, Lanza GM. et al. Molecular imaging of angiogenic therapy in peripheral vascular disease with alphanubeta3-integrin-targeted nanoparticles. Magn Reson Med. 2010;64:369-76
64. Shi J, Kantoff PW, Wooster R, Farokhzad OC. Cancer nanomedicine: progress, challenges and opportunities. Nat rev Cancer. 2017;17:20-37
65. Knop K, Hoogenboom R, Fischer D, Schubert US. Poly(ethylene glycol) in drug delivery: pros and cons as well as potential alternatives. Angew Chem Int Ed Engl. 2010;49:6288-308
66. Schottler S, Becker G, Winzen S, Steinbach T, Mohr K, Landfester K. et al. Protein adsorption is required for stealth effect of poly(ethylene glycol)- and poly(phosphoester)-coated nanocarriers. Nat Nanotechnol. 2016;11:372-7
67. Miki Y, Akimoto J, Hiranuma M, Fujiwara Y. Effect of talaporfin sodium-mediated photodynamic therapy on cell death modalities in human glioblastoma T98G cells. J Toxicol Sci. 2014;39:821-7
68. Morgan J, Oseroff AR. Mitochondria-based photodynamic anti-cancer therapy. Adv Drug Deliv Rev. 2001;49:71-86
Author contact
![]() Corresponding authors: M. Li, E-mail: liminmededu.cn; Address: Department of Hepatobiliary Surgery, Union Hospital, Tongji Medical College, Huazhong University of Science and Technology, 1277 JieFang Avenue, Wuhan 430022, China and B. Liu, E-mail: cheliubedu.sg; Address: Department of Chemical and Biomolecular Engineering, National University of Singapore, 4 Engineering Drive 4, 117585, Singapore
Corresponding authors: M. Li, E-mail: liminmededu.cn; Address: Department of Hepatobiliary Surgery, Union Hospital, Tongji Medical College, Huazhong University of Science and Technology, 1277 JieFang Avenue, Wuhan 430022, China and B. Liu, E-mail: cheliubedu.sg; Address: Department of Chemical and Biomolecular Engineering, National University of Singapore, 4 Engineering Drive 4, 117585, Singapore
Citation styles
APA
Gao, Y., Zheng, Q.C., Xu, S., Yuan, Y., Cheng, X., Jiang, S., Kenry, Yu, Q., Song, Z., Liu, B., Li, M. (2019). Theranostic Nanodots with Aggregation-Induced Emission Characteristic for Targeted and Image-Guided Photodynamic Therapy of Hepatocellular Carcinoma. Theranostics, 9(5), 1264-1279. https://doi.org/10.7150/thno.29101.
ACS
Gao, Y.; Zheng, Q.C.; Xu, S.; Yuan, Y.; Cheng, X.; Jiang, S.; Kenry; Yu, Q.; Song, Z.; Liu, B.; Li, M. Theranostic Nanodots with Aggregation-Induced Emission Characteristic for Targeted and Image-Guided Photodynamic Therapy of Hepatocellular Carcinoma. Theranostics 2019, 9 (5), 1264-1279. DOI: 10.7150/thno.29101.
NLM
Gao Y, Zheng QC, Xu S, Yuan Y, Cheng X, Jiang S, Kenry, Yu Q, Song Z, Liu B, Li M. Theranostic Nanodots with Aggregation-Induced Emission Characteristic for Targeted and Image-Guided Photodynamic Therapy of Hepatocellular Carcinoma. Theranostics 2019; 9(5):1264-1279. doi:10.7150/thno.29101. https://www.thno.org/v09p1264.htm
CSE
Gao Y, Zheng QC, Xu S, Yuan Y, Cheng X, Jiang S, Kenry, Yu Q, Song Z, Liu B, Li M. 2019. Theranostic Nanodots with Aggregation-Induced Emission Characteristic for Targeted and Image-Guided Photodynamic Therapy of Hepatocellular Carcinoma. Theranostics. 9(5):1264-1279.
This is an open access article distributed under the terms of the Creative Commons Attribution (CC BY-NC) license (https://creativecommons.org/licenses/by-nc/4.0/). See http://ivyspring.com/terms for full terms and conditions.