Impact Factor
- Issue 14; 2026
- Issue 13; 2026
- Issue 12; 2026
- Issue 11; 2026
- Issue 10; 2026
- Volume 16; 2026
- Advance Articles
- Past Issues
- Cover Images
- Cover Suggestion
- Index & Coverage
- Special Issues
Introduction
Materials and Methods
Results
Discussion
Conclusions
Abbreviations
Supplementary Material
Acknowledgements
References
International Journal of Biological Sciences
International Journal of Medical Sciences
 Global reach, higher impact

Theranostics 2019; 9(6):1538-1549. doi:10.7150/thno.30353 This issue Cite
Research Paper
Anti-tumor effects and potential therapeutic response biomarkers in α-emitting meta-211At-astato-benzylguanidine therapy for malignant pheochromocytoma explored by RNA-sequencing
Yasuhiro Ohshima1*, Nobuaki Kono2*, Yuichiro Yokota1*, Shigeki Watanabe1, Ichiro Sasaki1, Noriko S. Ishioka1, Tetsuya Sakashita1 ![]() , Kazuharu Arakawa2,3
, Kazuharu Arakawa2,3 ![]()
1. Department of Radiation-Applied Biology Research, Quantum Beam Science Research Directorate, National Institutes for Quantum and Radiological Science and Technology, 1233 Watanuki, Takasaki, Gunma 370-1292, Japan.
2. Institute for Advanced Biosciences, Keio University, 246-2 Mizukami, Kakuganji, Tsuruoka, Yamagata, 997-0052, Japan
3. Faculty of Environment and Information Studies, Keio University, 5322 Endo, Fujisawa, Kanagawa, 252-0882, Japan
*Co-first authors
Received 2018-10-1; Accepted 2019-1-4; Published 2019-2-27
Abstract

Targeted α-particle therapy is a promising option for patients with malignant pheochromocytoma. Recent observations regarding meta-211At-astato-benzylguanidine (211At-MABG) in a pheochromocytoma mouse model showed a strong anti-tumor effect, though the molecular mechanism remains elusive. Here, we present the first comprehensive RNA-sequencing (RNA-seq) data for pheochromocytoma cells based on in vitro 211At-MABG administration experiments. Key genes and pathways in the tumor α-particle radiation response are also examined to obtain potential response biomarkers.
Methods: We evaluated genome-wide transcriptional alterations in the rat pheochromocytoma cell line PC12 at 3, 6, and 12 h after 211At-MABG treatment; a control experiment using 60Co γ-ray irradiation was carried out to highlight 211At-MABG-specific gene expression. For comparisons, 10% and 80% iso-survival doses (0.8 and 0.1 kBq/mL for 211At-MABG and 10 and 1 Gy for 60Co γ-rays) were used.
Results: Enrichment analysis of differentially expressed genes (DEGs) and analysis of the gene expression profiles of cell cycle checkpoints revealed similar modes of cell death via the p53-p21 signaling pathway after 211At-MABG treatment and γ-ray irradiation. The top list of ranked DEGs demonstrated the expression of key genes on the decrease in the survival following 211At-MABG exposure, and four potential genes (Mien1, Otub1, Vdac1 and Vegfa genes) of 211At-MABG therapy. Western blot analysis indicated increased expression of TSPO in 211At-MABG-treated cells, suggesting its potential as a PET imaging probe.
Conclusion: Comprehensive RNA-seq revealed contrasting cellular responses to γ-ray and α-particle therapy, leading to the identification of four potential candidate genes that may serve as molecular imaging and 211At-MABG therapy targets.
Keywords: α-particle, meta-211At-astato-benzylguanidine, RNA-sequencing, pheochromocytoma, PET imaging, radionuclide therapy
Introduction
Pheochromocytomas (PCCs) are rare neuroendocrine tumors with malignant progression that account for approximately 30% of extra-adrenal PCCs [1]. Some malignant PCCs exhibit systemic metastasis, and clinical improvement with β-emitting meta-131I- iodo-benzylguanidine (131I-MIBG) constitutes a stage of partial remission in metastatic PCC [2]. Recently, we reported strong anti-tumor effects of α-emitting meta-211At-astato-benzylguanidine (211At-MABG) in a PCC mouse model, suggesting a potential option for targeted α therapy (TAT) for patients with malignant PCC [3]. Nonetheless, very little is known about the molecular mechanism of the therapeutic effects of 211At-MABG compared with photon-radiation therapy [4]. To avoid unintended consequences, a better understanding of the molecular basis of such therapeutic effects is necessary for the clinical implementation of 211At-MABG therapy in malignant PCC.
Theranostics, which combines specific targeted therapy and specific targeted diagnosis, is important for TAT, especially with regard to diagnosis. In vivo localization is one of main components of theranostic diagnosis, which includes Cherenkov luminescence imaging of 225Ac-labeled compounds [5] and a Compton camera for 211At-labeled compounds [6]. Another main component is the real-time dynamic imaging proposed by Paulmurugan et al. [7]. Overall, understanding or assessing therapeutic tumor responses, e.g., through inflammation biomarkers, is crucial [8]; although both components are required for TAT, few studies have focused on the latter. Accordingly, in this study, we explored therapeutic response biomarkers.
Post-genome sequencing technologies have rapidly developed in the last ten years, and next-generation sequencing (NGS) is a powerful tool for unraveling the molecular basis of rare genetic diseases [9]. Furthermore, RNA-sequencing (RNA- seq) using NGS provides a more precise transcription profile compared to other methods [10], and this approach may contribute to the search of TAT- response biomarkers.
Prior to the advent of RNA-seq, some in vitro TAT studies utilized microarray technology to measure gene expression and identify differentially expressed genes (DEGs) participating in DNA repair, cell cycle checkpoints, and apoptosis [11, 12, 13], as shown by photon radiation therapy [4]. For example, Seidl et al. reported novel gene regulation of TAT with high significance, identifying COL4A2, NEDD9, and C3 genes as being continuously upregulated; however, their specific functions in the response to high linear-energy-transfer ionizing radiation (IR) remain unknown [11]. Comprehensive RNA-seq analysis can now provide a wide dynamic range and great statistical precision with an increasing number of time points and biological replicates, thus allowing precise identification of key genes of TAT [14].
In this study, we examined gene expression profiles via RNA-seq in rat PCC cells to elucidate the molecular mechanism of 211At-MABG therapeutic effects compared with those of photon (γ-ray) irradiation under the expected conditions in line with TAT and the conventional radiotherapy. We further explored key genes in the tumor response to radiation as well as potential molecular therapeutic biomarkers for malignant PCC.
Materials and Methods
Cell culture
PC12, a rat pheochromocytoma cell line, is a representative cell line for malignant PCC [15] with long history of being the model for nuclear medicine studies, including the contribution to the preclinical study of MIBG therapy [16]. PC12 was purchased from Japanese Collection of Research Bioresources (IFO50278, Osaka, Japan), and cultured as previously reported [3] (Supplementary materials and methods).
211At-MABG treatment, γ-ray irradiation and dose estimation
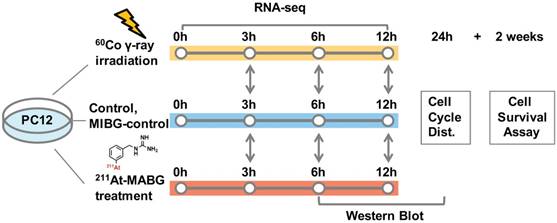
211At-MABG was synthesized as previously described [3]. The radioactivity of 211At (T1/2 = 7.2 h) was measured from γ-rays emitted in 211At decay using a high-purity germanium detector. We estimated the absorbed dose of 211At-MABG-treated cells using a published method [17], with some modifications (Supplementary materials and methods), as based on cellular uptake and release experiments, a parameter of energy per decay for 211At [18] and a real-coded genetic algorithm to estimate parameters [19]. Stable-iodine labeled MIBG was used for the nonradioactive experiments of 211At-MABG (MIBG-control; Supplementary materials and methods). The 60Co source at the Takasaki food irradiation facility was used for γ-ray irradiation, and the dose-rate distribution was routinely monitored using polymer-alanine dosimeters (Hitachi Cable, Ltd., Tokyo, Japan). The absorbed dose of γ-ray irradiated cells, assumed to be a water equivalent, was interpolated from routine monitoring data. PC12 cells were exposed to 211At-MABG at concentrations of 0, 0.2, 0.6, 2.0 and 6.0 kBq/mL for 1 day or were irradiated with 60Co γ-rays at doses of 0, 0.1, 0.3, 1, 3 and 10 Gy for 12 min time periods. Figure 1 shows the experimental design for 211At-MABG treatment and 60Co γ-rays irradiation. Cell survival assays were carried out as previously reported (Supplementary materials and methods).
Experimental design for 211At-MABG treatment and 60Co γ-rays irradiation. Comparative RNA-seq analysis between control, γ-ray-irradiated and 211At-MABG-treated samples was performed at 3, 6 and 12 h. MIBG-control additional experiment was also carried out in the same time course. Cell cycle distribution was measured at 24 h, and a cell survival assay was performed after 2 weeks of incubation.
RNA extraction and sequencing
A sample of 106 harvested cells was resuspended in TRIzol (Thermo Fisher Scientific, Waltham, MA, USA), and RNA was extracted using the Direct-zol RNA kit (Zymo Research Corp, Orange, CA, USA) according to the manufacturer's protocol. A sequencing library was prepared using the NEBNext, Ultra RNA Library Prep Kit (New England Biolabs, Ipswich, MA). Multiplex sequencing was performed with the High Output Mode regents of the NextSeq 500 instrument (Illumina Inc., San Diego, CA) using 75 cycles for control and γ-ray-irradiated samples and 300 cycles for 211At-MABG treated samples. These sequencing data sets were deposited (and are available) at the DNA Data Bank of Japan (DDBJ: http://www.ddbj.nig.ac.jp/) Sequence Read Archive under Accession number DRA007102 and DRA007735.
Differential expression analysis
Sequencing reads were aligned to the rat Ensembl Rnor 6.0 reference genome obtained from Ensembl using TopHat2 v2.0.14 with a default setting [20]. The aligned reads were assembled using Cufflinks v2.2.1 [21] with an annotation file (Rnor 6.0.83), along with estimation of the abundance of each transcript. Expression levels were calculated as fragments per kilobase of exon per million fragments mapped (FPKM). Assemblies of three replicates were combined using Cuffmerge v1.0.0. Differential expression analysis of each combination was performed using Cuffdiff v2.2.1 [22].
For pathway enrichment analysis, reference genes were first matched to KEGG (Kyoto Encyclopedia of Genes and Genomes) orthology using the KEGG KAAS web service [23], and enrichment of pathways for each time point was assessed using a custom Perl script in the G-language Genome Analysis Environment [24], utilizing Fisher's exact test of the R package (https://www.r-project.org) with Bonferroni correction of p-values for multiple testing. For both differential gene expression and pathway enrichment analysis, a false discovery rate (FDR) threshold of 0.05 was used. Disease-related pathways with a pathway map ID greater than 5000 were omitted.
Configuration of the gene regulatory network and representative DEGs
A gene regulatory network was obtained from the KEGG pathway map [23]. Genes involved in the regulatory network were screened according to the following conditions: 1. at least twofold highly expressed genes in the treatment; 2. at least FPKM > 1 for all conditions; 3. overrepresentation in at least one of twelve conditions (γ-ray irradiation, 211At-MABG treatment, two survival rates, and three time points) compared with the corresponding controls; 4. presence of the canonical gene name.
Using similar conditions, except for the 3rd, representative genes with significant changes in expression were screened between the γ-ray and 211At-MABG treatments. The 3rd condition was modified with a comparison of combination treatments: e.g., for representative DEGs of 211At-MABG treated cells between 80% and 10% survival doses at each time point, we used the condition of DEGs overrepresented in at least one of the two conditions (including the two survival rates).
Flow cytometry and western blot analysis
Cell cycle distributions among cells treated with 211At-MABG (0.6 kBq/mL) for 24 h and 24 h post-irradiated with γ-ray (10 Gy) were analyzed using flow cytometry. Cells were collected and fixed in 70% ethanol overnight, treated with RNase for 20 min before the addition of 5 μg/mL of propidium iodide and analyzed by flow cytometry (EC-800, Sony, Tokyo, Japan). Western blot analysis of cells treated with 211At-MABG (0.8 kBq/mL) for 6, 12 and 24 h was performed as previously described (Supplementary materials and methods) [25].
Statistical analysis
The computer program (ORIGIN, MicroCal Software, Inc., MA, USA) was used for non-linear curve fitting.
Results
Iso-survival dose and experimental design for 211At-MABG treatment and 60Co γ-ray irradiation
To compare the biological effects of two types of radiation, we first evaluated the 10% and 80% iso-survival doses of 60Co γ-ray irradiation and 211At-MABG treatment for PC12 cells. For this study, we used the acute irradiation for 60Co γ-rays to imitate conventional radiation therapy.
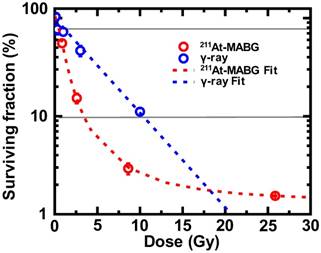
Cells irradiated with γ-rays exhibited a log- linear relationship between the surviving fraction (SF) and the absorbed dose (Figure 2), with 10% and 80% iso-survival doses of γ 10 Gy (SF = 10.8%) and 1 Gy (SF = 80.1%), respectively. The absorbed dose of 211At- MABG by treated cells was estimated using a published method [19], with some modifications (Supplementary materials and methods). When cells were exposed to 211At-MABG at the initial concentration of 1.0 kBq/mL, the absorbed dose was estimated to be 4.31 Gy. Using this estimation, the relationship between the SFs of 0, 0.2, 0.6, 2.0 and 6.0 kBq/mL and the absorbed dose displayed a sigmoidal curve (Figure 2). The 10% and 80% iso-survival doses of 211At- MABG were set to 0.8 kBq/mL (3.5 Gy; SF = 9.8%) and 0.1 kBq/mL (0.4 Gy; SF = 82%), respectiveely, and we designed the time-course of RNA-seq analysis accordingly (Figure 1). In general, IR- induced DNA damage causes an increase or decrease in gene expression several hours post-irradiation. Indeed, 60Co γ-rays and α-particles emitted from 211At induced significant alterations in gene expression several hours after treatment [14]. Thus, we used three time points for RNA-seq analysis at 3, 6 and 12 h after 60Co γ-ray irradiation and the start of 211At-MABG exposure.
Iso-survival dose for 211At-MABG treatment and 60Co γ-rays irradiation. Surviving fraction (SF) after 211At-MABG treatment and 60Co γ-rays irradiation in PC12 cells. The SF of 211At-MABG treatment demonstrated a sigmoidal curve (211At-MABG Fit)—that is, SF (%) = 1.3 + (100.0 - 1.3) / (1.0 + (Dose (Gy) / 0.97)1.9) (the correlation coefficient square, R2 = 1.00). The SF of 60Co γ-ray irradiation showed a log-linear relationship (γFit)—that is, SF (%) = 100.0 exp ( -0.22 * Dose (Gy) ) (R2 = 0.98). Thin lines indicate 10% and 80% survival.
Comprehensive RNA-seq analysis of 211At-MABG-treated and 60Co γ-ray-irradiated PC12 cells
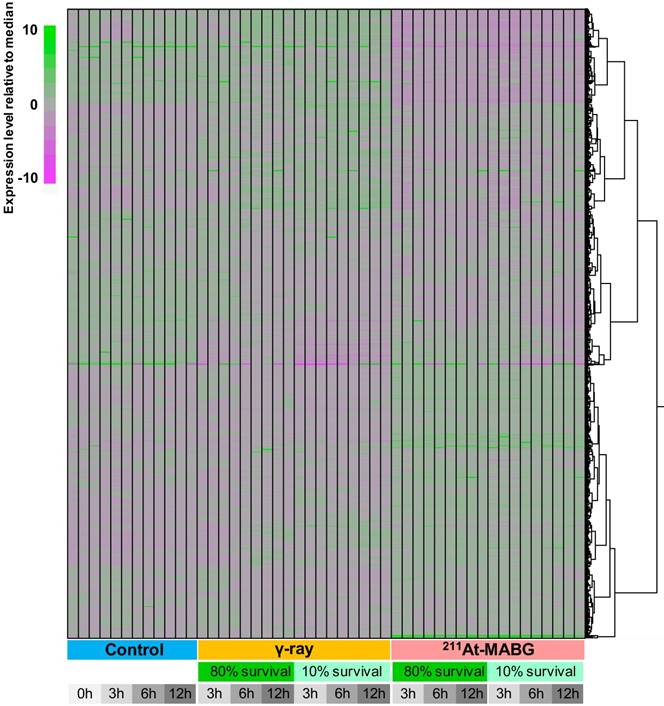
We employed a transcriptomic approach to observe changes in gene expression in PC12 cells at iso-survival doses of 10% and 80%, and a minimum of 7 million reads were sequenced for each condition in three replicates (Figure 3). Overall transcriptome profiles were consistent among the replicates and strikingly distinct among the three treatment conditions (control, γ-ray irradiation, 211At-MABG treatment), essentially regardless of the survival rate or time point. Although γ-ray-irradiated samples shared a proportion of gene clusters showing similar expression levels as the control, 211At-MABG treatment resulted in vastly different profiles, with the early (3 h) response to weak irradiation (80% survival) exhibiting a very weak correlation (approximately 0.2 in Pearson correlation) with the 3-h control conditions (Figure S3). These differential expression patterns were further supported by the number of DEGs, as summarized in Figure S4. The numbers of DEGs were highly consistent among the different time points, with the number of DEGs at 80% survival after 211At-MABG treatment (5,881, 5,198 and 5,304 genes at 3, 6 and 12 h, respectively) all surpassing those of 10% survival after γ-ray irradiation (4,438, 3,812 and 4,414 genes at 3, 6 and 12 h, respectively). MIBG-control experiments did not show the same transcriptome profiles treated with 211At-MABG and 60Co γ-rays (Figure S5), and showed very limited number of DEGs, where the maximum number of DEGs exceeding fold change > 2 being 70 (Figure S6). Significant changes in gene expression at 80% survival after γ-ray irradiation (1,974, 1,731 and 2,590 genes at 3, 6 and 12 h, respectively) were largely fewer than half under all other conditions. Therefore, the intracellular response to these two conditions appears to be contrasting, presumably providing an explanation for the different tumor responses to X/γ-ray and TAT therapies. We thus focus on the difference in responses, in other words, the more than 5,000 DEGs between the two irradiation conditions.
Heatmap clustering of all RNA-seq data used in this analysis. The expression level of all genes with TPM (Transcript Per Million) > 5 in any condition is normalized relative to the median expression level for each gene. The expression level was calculated using kallisto software (v.0.42.4). Regardless of the time point or survival rate, the three conditions (control, γ-ray irradiation, 211At-MABG treatment) showed distinct expression patterns, with 211At-MABG treatment showing greater variability.
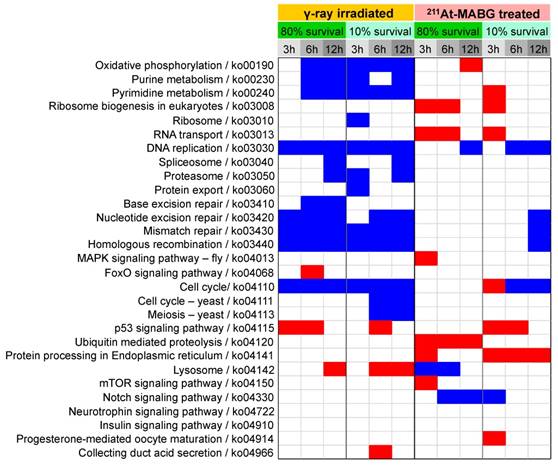
Enrichment in biological processes in DEGs was next examined using KEGG pathway enrichment analysis (Figure 4). γ-Ray irradiation predominantly resulted in under-representation of DNA damage repair (base excision repair, nucleotide excision repair, mismatch repair, and homologous recombination) and cell cycle-related (DNA replication, cell cycle) pathways, suggesting cell cycle arrest and stalling of DNA replication. In contrast, 211At-MABG treatment did not result in these under- representations, except for 6 or 12 h of 10% survival; however, over-representation of protein turnover (ribosome biogenesis, RNA transport, ubiquitin mediated proteolysis, and protein processing in endoplasmic reticulum) was observed. Only the p53 signaling pathway was over-represented in cells treated with both γ-ray irradiation and 211At-MABG.
Enrichment of KEGG pathways in DEGs at each condition. KEGG (Kyoto Encyclopedia of Genes and Genomes) enrichment for differentially expressed genes (DEGs) was computed using Fisher's exact test with Bonferroni correction of p-values, where the corrected p-value < 0.05 is shown. KEGG pathways for human diseases are omitted. Red and blue squares represent positive and negative enrichment, respectively. γ-Ray-irradiated and 211At-MABG-treated samples show contrasting enrichment of KEGG pathways.
Cell cycle checkpoints and the p53-p21 pathway
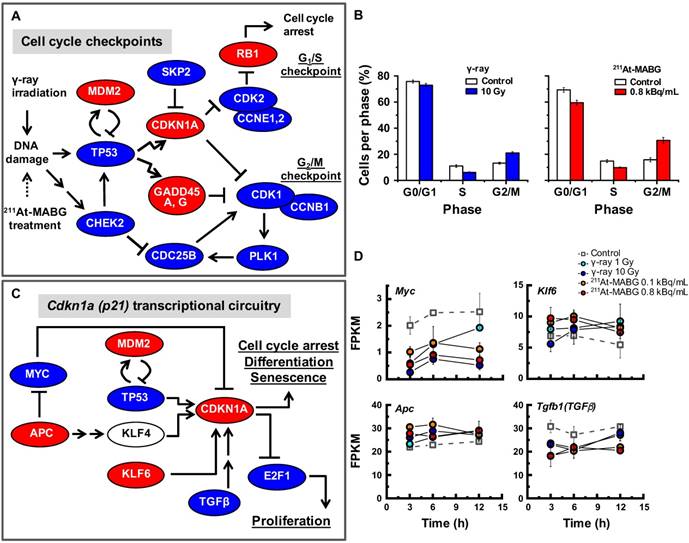
The pathway enrichment analysis indicated cell cycle arrest, stalling of DNA replication and activation of p53 signaling. To understand how γ-ray irradiation and 211At-MABG treatment regulate the cell cycle, we screened well-known genes that participate in DNA damage-dependent G1/S and G2/M checkpoints using the present configuration (see a description in the Materials and methods). The relationships among Tp53, Mdm2, Chek2, Cdkn1a, Skp2, Cdk2, Ccne1,2, Rb1, Gadd45a,g, Cdc25b, Plk1, Cdk1 and Ccnb1 transcripts are illustrated in Figure 5A. Despite differences in the gene expression pattern for the early response and delayed induction between both treatments (Figure S7), an overview of the selected gene expression levels resulted in a similar expression profile (Figure 5A). The expression levels of Mdm2, Cdkn1a, Gadd45a,g and Rb1 genes increased, whereas those of the other genes decreased (Figure 5A), suggesting activation of G1/S and G2/M checkpoints via the p53 pathway. Flow cytometry analysis supported the transcriptomic results, demonstrating a decrease and increase in the ratio of S- and G2/M-phase cells, respectively (Figure 5B). These results show that the p53 pathway is an important cell cycle regulator in γ-ray irradiation and 211At-MABG treatment. Nonetheless, transcriptional activation of the Cdkn1a gene is also regulated via p53-independent pathways [26] (Figure 5C). In addition, we found reduced expression of suppressor APC-MYC pathway components and increased Klf6 expression to be associated with transcriptional regulation of CDKN1A (Figure 5C-D). Taken together, our data suggest that the p53 signaling pathway via DNA damage and associated signals regulate the PC12 cell cycle after γ-ray irradiation and 211At-MABG treatment.
Cell cycle checkpoints, cell cycle distribution and the p53-p21 pathway. (A) The gene regulatory network for cell cycle checkpoints was configured with reference to the KEGG pathway map [17]. Red and blue ellipses represent the increase or decrease in gene expression (vs. control) after both 60Co γ-ray irradiation and 211At-MABG treatment, respectively. Both treatments showed similar gene expression profiles. (B) Cells per phase in % of 10% iso-survival experiments (left and right panels for γ-ray irradiation and 211At-MABG treatment, respectively). The error bars indicate the standard error of mean. (C) Cdkn1a transcriptional circuitry [19]. Red and blue ellipses represent the increase or decrease in gene expression (vs. control), respectively. (D) Gene expression over time of Myc, Apc, Klf6 and Tgfb1 genes. The error bars represent standard deviation.
Representative DEGs of 211At-MABG-treated cells between 80% and 10% survival doses
Analysis of cell cycle checkpoints demonstrated a similar response to γ-ray irradiation and 211At-MABG treatment, yet the DEGs associated with 211At-MABG therapeutic effects were unclear. Therefore, we investigated representative DEGs that contribute to a decrease in survival after 211At-MABG treatment.
The number of representative DEGs between 80% and 10% survival increased in a time-dependent manner (11 genes at 3 h post-treatment to 60 genes at 12 h). Table 1 classifies the representative DEGs into 5 categories at each time point. The top-ranking genes were Nudt6 (7.9-fold increase), Eda2r (5.3-fold increase) and Inmt (5.3-fold increase) at 3, 6 and 12 h post-211At-MABG treatment, respectively. Nudt6 is suggested to play a role in cell proliferation [27], and Eda2r is reported to induce apoptosis and prevent cell adhesion through the p53-regulated anoikis pathway [28]. Inmt codes for an indolethylamine-N-methyltransferase (INMT), which produces N,N-dimethyltryptamine (DMT) [29]; although the role of endogenous DMT has not yet been established, exogenous DMT acts as an inhibitor of peripheral monoamine oxidase [30]. Representative DEGs found at all time points included Gdf15, Fam212b, Cdkn1a, Enc1 and Tp53inp1 (Table 2), all of which are target genes of activated p53 [31]. These DEGs provide a straightforward description of the state of PC12 cells incorporating 211At-MABG, i.e., cell cycle regulation and cell death induction.
211At-MABG induces a time-dependent shift in representative DEGs between 80% and 10% survival experiments.
| 3 h post-treatment (11 genes)*1 | 6 h post-treatment (52 genes)*1 | 12 h post-treatment (60 genes)*1 | |||||||
|---|---|---|---|---|---|---|---|---|---|
| Gene name | LogFC*2 | Function | Gene name | LogFC*2 | Function | Gene name | LogFC*2 | Function | |
| Cell cycle | Nudt6 | +2.976 (1) | Cell proliferation | Ptprv | +1.889 (6) | G1/S checkpoint | Ptprv | +2.022 (5) | G1/S checkpoint |
| Ccng1 | +1.412 (12) | G2/M checkpoint | Ccng1 | +1.412 (25) | G2/M checkpoint | ||||
| Plk2 | +1.055 (44) | Spindle checkpoint | Plk2 | +1.182 (43) | Spindle checkpoint | ||||
| Cell death | Eda2r | +2.403 (1) | Apoptosis and prevent ion of cell adhesion | Eda2r | +2.006 (6) | Apoptosis and prevention of cell adhesion | |||
| Aen | +1.354 (16) | Apoptosis | Atg9b | +1.991 (7) | Autophagy | ||||
| Btg2 | +1.351 (18) | Apoptosis | Gsdmd | +1.669 (13) | Programmed cell death | ||||
| DNA repair | Aplf | +1.381 (5) | DNA repair | Ier5 | +1.201 (28) | DNA repair | Mgmt | +1.290 (31) | DNA repair |
| Fam175a | +1.018 (11) | DNA repair with BRCA1 | Rnf169 | +1.028 (48) | Homologous recombination | Xrcc1 | +1.044 (54) | Base excision repair | |
| Metastasis | Adam8 | +1.882 (7) | Invasion | Adam8 | +2.164 (3) | Invasion | |||
| Jam3 | +1.177 (30) | Adhesion | Mmp2 | +1.851 (8) | Metastasis | ||||
| Others | Inmt | +1.631 (9) | Methyltransferase | Inmt | +2.403 (1) | Methyltransferase | |||
| Trim7 | +1.315 (21) | Proliferation, Apoptosis | Lrrc25 | +1.682 (11) | Inflammation, Autophagy | ||||
*1 Number of DEGs. *2 The number in parentheses indicates the rank
211At-MABG induced representative DEGs for decreased survival at all time points.
| All time points (5 genes)*1 | |||
|---|---|---|---|
| Gene name | LogFC*2, *3 | Function | |
| Cell cycle | Cdkn1a | +1.680 (3) | G1/G2 checkpoint |
| Cell death | Enc1 | +1.657 (4) | Negatively regulates autophagy, redox homeostasis |
| Tp53inp1 | +1.320 (5) | Apoptosis, Autophagy | |
| Metastasis | Gdf15 | +1.782 (1) | Epithelial mesenchymal transition |
| Others | Fam212b | +1.503 (2) | Unknown |
*1 Number of DEGs. *2 The number in parentheses indicates the rank. *3 Value at 12 h post-treatment.
Furthermore, representative DEGs in PC12 cells at each time point exhibited varying gene expression profiles. At 3 h post-treatment, Aplf and Fam175a genes were observed, with Fam175a suggesting the involvement of homologous recombination (HR). DNA-repair related genes were continuously expressed after 3 h post-treatment (Ier5, Rnf169, Mgmt and Xrcc1of Table 1); various genes were represented at 6 and 12 h post-treatment. In the cell cycle category, Ptprv for the G1/S checkpoint, Ccng1 for the G2/M checkpoint and Plk2 for the spindle checkpoint were highly represented, in agreement with the results shown in Figure 5A-B. Regarding the category of cell death, apoptosis-related genes (Aen, Btg2 and Trim7) were expressed from 6 h post-treatment, whereas autophagy- and other-related genes (Atg9b, Gsdmd and Lrrc25) ranked in the top 30 at 12 h post-treatment. Moreover, 211At-MABG treatment induced metastasis-related gene expression (Adam8, Jam3 and Mmp2). Therefore, representative DEGs of 211At-MABG-treated cells between 80% and 10% survival doses effectively highlight the expression of key genes associated with 211At-MABG therapeutic and anti-therapeutic effects.
Potential therapeutic response biomarkers of 211At-MABG
To investigate the different molecular mechanisms of 211At-MABG treatment compared with photon (γ-ray) irradiation, we further screened for representative genes displaying changes in expression between γ-ray and 211At-MABG treatments. Representative DEG analysis revealed in 161 genes (Table S1), among which 26 showed a log fold change greater than 2 and 87 were highly abundant, with a maximum FPKM > 100. Thus, only 20 genes satisfied both conditions, with 10 annotated in KEGG pathways. We selected four of these genes, Mien1, Otub1, Vdac1 and Vegfa, based on their possible contribution to the 211At-MABG treatment response. Overall, their maximum log fold-changes in gene expression (15.5, 8.4, 9.5 and 6.9 vs. γ-ray irradiation; Figure 6A) and continuous high level of expression demonstrate the 211At-MABG-specific response.
Potential molecular biomarkers for 211At-MABG-therapy. (A) Gene expression according to the FPKM of Mien1, Otub1, Vdac1 and Vegfa genes. Upregulated genes have a log fold change over two and a maximum FPKM above 100. (B) VDAC1-related molecules and gene expression. TSPO, VDAC1 and ANT in the mitochondrial membrane form a complex (left panel) and control the intracellular level of reactive oxygen species. Expression levels of upregulated Tspo and Ant genes (right panel). (C) Western blot analysis for TSPO was performed using PC12 cells collected at 6, 12 and 24 h post-211At-MABG treatment. TSPO was detected at 18-19 kDa, and its expression was increased in a time-dependent manner. In A and B, error bars represent the standard deviation among the three replicates, and the symbols indicate the median value.
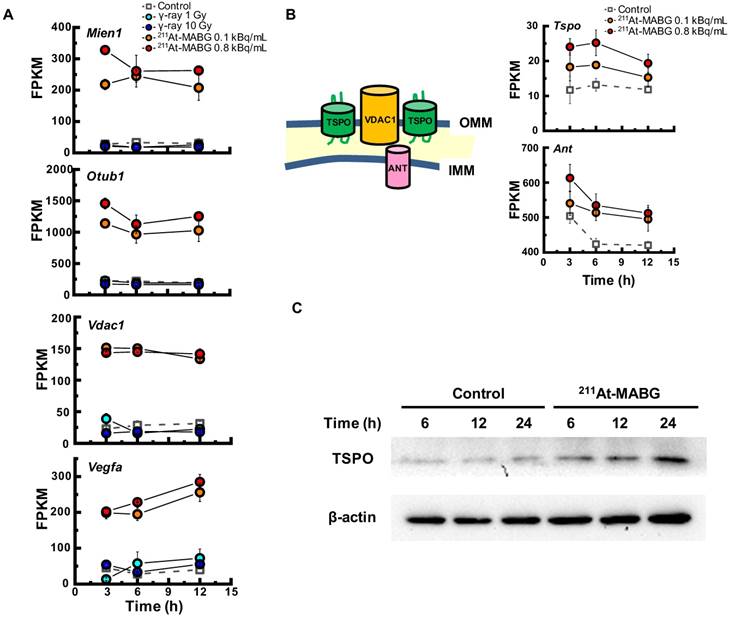
Mien1 encodes migration and invasion enhancer 1 (MIEN1), a factor regulating cytoskeletal-focal adhesion dynamics [32]. Ovarian tumor domain- containing ubiquitin aldehyde-binding protein 1 (OTUB1), which is encoded by Otub1, has a bilateral character, both inhibiting and promoting tumor growth [33, 34]. Mien1 and Otub1 genes may be important targets for better estimating prognosis of 211At-MABG therapy. Vdac1 and Vegfa are linked to feasibility analysis for imaging: a mitochondrial 18-kDa translocator protein (TSPO), which forms a complex with 32-kDa voltage-dependent anion channel 1 (VDAC1) [35], is a well-studied drug target for PET imaging [25] and we measured the large increases in gene and protein expressions (Figure 6B-6C). Vascular endothelial growth factor A (VEGFA) is also a reported target for PET imaging [34]. The features of these 4 potential 211At-MABG- specific molecular biomarkers may help doctors in diagnosis and in predicting prognosis with 211At- MABG therapy.
Discussion
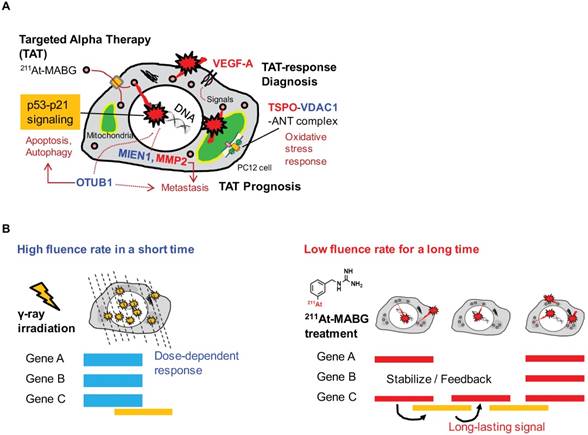
In this work, we applied RNA-seq and showed contrasting gene expression patterns between 211At- MABG treatment and γ-ray irradiation. Moreover, analysis of representative DEGs uncovered key gene expression associated with 211At-MABG therapeutic effects and novel biomarkers for response to 211At-MABG therapy (Figure 7A).
Potential biomarkers of 211At-MABG-therapy and low fluence α-particle irradiation. (A) The present RNA-seq analysis suggests that 211At-MABG therapeutic effects are associated with p53-p21 signaling and inhibition of ubiquitination by OTUB1. Furthermore, our analysis demonstrated novel targets for 211At-MABG-therapy. OTUB1 and MIEN1 may be of importance for therapy and VDAC1 (TSPO) and VEGF-A for imaging. (B) Different irradiation modes of 60Co γ-rays and α-particles emitted from 211At-MABG. Photon radiation therapy uses high fluence-rate irradiation conducted in a short time and causes a biological response in a dose-dependent manner. In contrast, 211At-MABG treatment is a mode of low fluence α-particle irradiation. The fluence rate was “one α-particle emission in one hour on average” for the 10% iso-survival experiment. Representative DEG analysis showed long-lasting p53-p21 signaling post-211At-MABG treatment.
Potential biomarkers for imaging in 211At-MABG therapy
CT or MRI and 123I-MIBG are typically used to identify metastatic PCC [1, 2], and PET with 18F-fluorodopamine, 18F-fluorodopa, 18F-fluorodeoxyglucose and 11C-hydroxyephedrine can be used as alternatives to 123I-MIBG or 131I-MIBG [1, 2]. These imaging procedures can be applied to diagnosis—e.g., localization of metastatic PCC—in 211At-MABG therapy. However, there is no target to date for measuring the α-particle-induced tumor response, that is, a TAT-response biomarker. In this study, we found three potential genes, Vdac1, Vegfa and Mmp2, that may shed light on this issue.
Vegfa specifically responds to MABG (Figure 6A) and is well known as a key imaging biomarker for tumor angiogenesis, i.e. tumor biomarker [36, 37]. We found that it was also potential response biomarker for 211At-MABG therapy. HIF-1 [38] and MYC [39] activate Vegfa gene transcription. Myc gene may be not associated with tumor angiogenesis of MABG- treated PC12 cells, because of under-regulation of Myc gene expression (Figure 5D). There are many inhibitors of VEGF signaling; for example, sorafenib inhibits RAS/RAF/MEk/ERK effects on VEGFA [37]. Thus, inhibitor use and monitoring of VEGFA may be important for assessing tumor angiogenesis after 211At-MABG therapy.
Overexpression of matrix metalloproteinases, e.g., MMP2 or MMP9, aids in prognosis for breast cancer patients [40], and in our study, the Mmp2 gene was found to be representative at 12 h post-treatment (Table 1). Accordingly, evaluation of MMP2 response may be also important for prognosis after 211At-MABG therapy.
Here, we propose Tspo as a potential imaging biomarker because it is related to VDAC1 [33]; TSPO is a well-known drug target for PET [25]. TSPO, VDAC1 and inner membrane adenine nucleotide transporter (ANT) form a complex at the mitochondrial membrane (Figure 6B) that functions as a REDOX regulator of cell mitophagy, inducing various oxidative stress responses, including apoptosis [35]. Levels of Tspo, Vdac1 and Ant gene expression were significantly increased (Figure 6A-6B), and that of Tspo was initiated in the early phase after 211At-MABG treatment and maintained over three time points in a dose-dependent manner (Figure 6A-6B). We also carried out western blot analysis, and levels of TSPO, detected at 18-19 kDa, increased over time in the 10% survival experiment (Figure 6C). 18F-N-fluoroacetyl- N-(2,5-dimethoxybenzyl)-2-phenoxyaniline was reported to be a candidate probe for quantitative assessment of TSPO expression [25]. As PET signals from metastatic PCC can likely be detected in vivo, our results suggest that the PET imaging approach of assessing TSPO expression may detect the 211At- MABG-induced tumor response and can provide indirect evidence of 211At-MABG localization.
Biomarkers for better prognosis after 211At-MABG therapy
Metastasis-related gene expression is important for prognosis. The present study showed metastasis- related genes, not only Adam8, Jam3, Mmp2 and Gdf15 listed in Table 1 but also Mien1 and Otub1, with high-level induction. ADAM8 promotes invasiveness and reduces patient survival in pancreatic cancer [41]. The peptide blocker BK-1361 may reduce the cellular activity of Adam8 [42]. In addition, inhibitors of MMP2 and GDF15 have been reported [43, 44], and a therapeutic target of MIEN1, microRNA miR-136, has been proposed [45]. Inhibitory drug and therapeutic targets of JAM3 and OTUB1 are not still understood, and in particular, the therapeutic effects of OTUB1 remain controversial.
OTUB1 is a deubiquitinating enzyme that stabilizes p53 by inhibiting the ubiquitin-conjugating enzyme (E2)-dependent ubiquitination involved in cell death and growth inhibition [33]. Despite a recent report that OTUB1 stabilizes MDMX and induces apoptosis [46], OTUB1 stabilizes proteins linked to cancer progression such as RAS and FOXM1 via deubiquitination and promotes tumor growth and invasion [34,47]. Indeed, high expression of OTUB1 is clinically associated with tumor invasion, metastasis, poor prognosis, and low patient survival [34]. These previous reports indicate that OTUB1 has dual functions that promote or suppress cancer. As expression of OTUB1 was dramatically enhanced by 211At-MABG treatment (Figure 6A), OTUB1 is possibly a key enzyme in the tumor response to 211At-MABG therapy in PCC.
Radiobiological insights and therapeutic mechanism of 211At-MABG therapy
We should note that according to the half-life of 7.2 h, the cellular irradiation of α-particles lasted longer than 12 minutes for 60Co γ-ray irradiation (Figure 7B). The “low fluence rate” of α-particles in 211At-MABG treatment was approximately “one α-particle emission in one hour on average” for the 10% iso-survival experiment (Figure S2D; Supplementary result). The low fluence rate may be linked to the avoidance of cell death because HR and non-homologous end-joining contributed to DSB repair in TAT [48]; our results also suggest the contribution of HR, Fam175a and Rnf169 (Table 1). These findings raise the question regarding how anti-tumor therapeutic effects are induced at a low fluence rate, and the answer may be the p53 gene. Despite the low α-particle fluence rate, the p53 signaling pathway was overexpressed based on enrichment analysis (Figure 4), and p53 target genes related to cell cycle checkpoints and cell death— Cdkn1a, Enc1, Tp53inp1, Ccng1, Plk2, Eda2r, Aen and Btg2—were ranked among the representative DEGs (Table 1-2). In particular, gene expression for most of the p53-targeted genes—e.g., Cdkn1a in Figure S7—persisted and gradually increased over 3 time points. Possible causes may be due to p53-Mdm2 feedback [49] and OTUB1 [33, 47], both of which stabilize and sustain p53 signaling. Long-lasting p53-induced signaling may break the wall of the “low fluence rate” in PC12 tumor cell death to exert anti-tumor effects.
Study limitations
In this work, we have used PC12 as a representative cell-line for targeted radionuclide therapy, because PC12 is an important model cell-line for malignant pheochromocytoma study [15]. There is also a long history of nuclear medicine studies. In fact, the sufficient results of PC12 have contributed to the preclinical study of MIBG therapy, e.g. the report of Rutgers et al. [16]. On the other hand, human pheochromocytoma cell lines recently established such as KAT45 and hPhe01 may also be useful future target for this kind of study, as well as studies in vivo with Rat models to further validate the candidate response biomarkers.
The present study was mainly based on RNA-seq analysis. Therefore, post-translational modifications (PTMs) such as glycosylation and phosphorylation were not examined. Further studies will be needed to address PTMs. In addition, we did not detect significant mutations in the p53 gene in PC12 cells, though mutations in p53 frequently occur in many cancers. The therapeutic molecular mechanism of p53-mutated tumor cells in TAT may be different from the present results, according to the type of mutation.
Conclusions
Our analysis demonstrated that 211At-MABG therapeutic effects are associated with a molecular mechanism that occurs via the p53-p21 pathway, the Otub1 gene related to ubiquitin-mediated proteolysis and other representative highly ranked DEGs. Additionally, we found 4 potential molecular biomarkers that can be used in molecular imaging and as therapeutic targets of 211At-MABG-therapy.
Abbreviations
131I-MIBG: meta-131I-iodo-benzylguanidine; 211At- MABG: meta-211At-astato-benzylguanidine; DEGs: differentially expressed genes; FDR: false discovery rate; FPKM: fragments per kilobase of exon per million fragments mapped; IR: ionizing radiation; KEGG: Kyoto Encyclopedia of Genes and Genomes; NGS: next-generation sequencing; PCC: pheochromocytoma; RNA-seq: RNA-sequencing; SF: surviving fraction; TAT: targeted α therapy.
Supplementary Material
Supplementary figures and tables.
Acknowledgements
This work was supported, in part, by research funds from the Yamagata Prefectural Government and Tsuruoka City, Japan. The authors thank Yuki Takai for technical assistance in sequencing, the staff of Takasaki ion accelerators for advanced radiation application and food irradiation facilities of QST for their operation.
Competing Interests
The authors have declared that no competing interest exists.
References
1. Lenders JW, Eisenhofer G, Mannelli M, Pacak K. Phaeochromocytoma. Lancet. 2005;366(9486):665-75
2. Carrasquillo JA, Pandit-Taskar N, Chen CC. I-131 Metaiodobenzylguanidine Therapy of Pheochromocytoma and Paraganglioma. Semin Nucl Med. 2016;46(3):203-14
3. Ohshima Y, Sudo H, Watanabe S, Nagatsu K, Tsuji AB, Sakashita T. et al. Antitumor effects of radionuclide treatment using α-emitting meta-211At- astato-benzylguanidine in a PC12 pheochromocytoma model. Eur J Nucl Med Mol Imaging. 2018;45(6):999-1010
4. Maier P, Hartmann L, Wenz F, Herskind C. Cellular Pathways in Response to Ionizing Radiation and Their Targetability for Tumor Radiosensitization. Int J Mol Sci. 2016:17 (1). pii: E102
5. Pandya DN, Hantgan R, Budzevich MM, Kock ND, Morse DL, Batista I. et al. Preliminary Therapy Evaluation of 225Ac-DOTA-c(RGDyK) Demonstrates that Cerenkov Radiation Derived from 225Ac Daughter Decay Can Be Detected by Optical Imaging for In Vivo Tumor Visualization. Theranostics. 2016;6(5):698-709
6. Nagao Y, Yamaguchi M, Watanabe S, Ishioka NS, Kawachi N, Watabe H. Astatine-211 imaging by a Compton camera for targeted radiotherapy. Appl Radiat Isot. 2018;139:238-243
7. Paulmurugan R, Oronsky B, Brouse CF, Reid T, Knox S, Scicinski J. Real time dynamic imaging and current targeted therapies in the war on cancer: a new paradigm. Theranostics. 2013;3(6):437-47
8. Wu C, Li F, Niu G, Chen X. PET imaging of inflammation biomarkers. Theranostics. 2013;3(7):448-66
9. Koboldt DC, Steinberg KM, Larson DE, Wilson RK, Mardis ER. The next-generation sequencing revolution and its impact on genomics. Cell. 2013;155(1):27-38
10. Wang Z, Gerstein M, Snyder M. RNA-Seq: a revolutionary tool for transcriptomics. Nat Rev Genet. 2009;10(1):57-63
11. Seidl C, Port M, Apostolidis C, Bruchertseifer F, Schwaiger M, Senekowitsch- Schmidtke R. et al. Differential gene expression triggered by highly cytotoxic alpha-emitter-immunoconjugates in gastric cancer cells. Invest New Drugs. 2010;28(1):49-60
12. Danielsson A, Claesson K, Parris TZ, Helou K, Nemes S, Elmroth K. et al. Differential gene expression in human fibroblasts after alpha-particle emitter 211At compared with 60Co irradiation. Int J Radiat Biol. 2013;89(4):250-8
13. Yong KJ, Milenic DE, Baidoo KE, Brechbiel MW. Impact of α-targeted radiation therapy on gene expression in a pre-clinical model for disseminated peritoneal disease when combined with paclitaxel. PLoS One. 2014;9(9):e108511
14. Liu Y, Zhou J, White KP. RNA-seq differential expression studies: more sequence or more replication? Bioinformatics. 2014;30(3):301-4
15. Eisenhofer G, Bornstein SR, Brouwers FM, Cheung NK, Dahia PL. et al. Malignant pheochromocytoma: current status and initiatives for future progress. Endocr Relat Cancer. 2004;11(3):423-36
16. Rutgers M, Buitenhuis CK, van der Valk MA, Hoefnagel CA, Voûte PA. et al. [131I] and [125I] metaiodobenzylguanidine therapy in macroscopic and microscopic tumors: a comparative study in SK-N-SH human neuroblastoma and PC12 rat pheochromocytoma xenografts. Int J Cancer. 2000;90(6):312-25
17. Shinohara A, Hanaoka H, Sakashita T, Sato T, Yamaguchi A, Ishioka NS. et al. Rational evaluation of the therapeutic effect and dosimetry of auger electrons for radionuclide therapy in a cell culture model. Ann Nucl Med. 2018;32(2):114-122
18. Spetz J, Rudqvist N, Forssell-Aronsson E. Biodistribution and dosimetry of free 211At, 125I- and 131I- in rats. Cancer Biother Radiopharm. 2013;28(9):657-64
19. Herrera F, Lozano M, Verdegay JL. Tackling real-coded genetic algorithms: operators and tools for behavioural analysis. Artif Intell Rev. 1998;12(4):265-319
20. Kim D, Pertea G, Trapnell C, Pimentel H, Kelley R, Salzberg SL. TopHat2: accurate alignment of transcriptomes in the presence of insertions, deletions and gene fusions. Genome Biol. 2013;14(4):R36
21. Trapnell C, Williams BA, Pertea G, Mortazavi A, Kwan G, van Baren MJ. et al. Transcript assembly and quantification by RNA-Seq reveals unannotated transcripts and isoform switching during cell differentiation. Nat Biotechnol. 2010;28(5):511-5
22. Trapnell C, Hendrickson DG, Sauvageau M, Goff L, Rinn JL, Pachter L. Differential analysis of gene regulation at transcript resolution with RNA-seq. Nat Biotechnol. 2013;31:46-53
23. Moriya Y, Itoh M, Okuda S, Yoshizawa AC, Kanehisa M. KAAS: an automatic genome annotation and pathway reconstruction server. Nucleic Acids Res. 2007;35(Web Server issue):W182-5
24. Arakawa K, Mori K, Ikeda K, Matsuzaki T, Kobayashi Y, Tomita M. G-language Genome Analysis Environment: a workbench for nucleotide sequence data mining. Bioinformatics. 2003;19(2):305-6
25. Buck JR, McKinley ET, Hight MR, Fu A, Tang D, Smith RA. et al. Quantitative, preclinical PET of translocator protein expression in glioma using 18F-N-fluoroacetyl-N-(2,5-dimethoxybenzyl)-2-phenoxyaniline. J Nucl Med. 2011;52(1):107-14
26. Abbas T, Dutta A. p21 in cancer: intricate networks and multiple activities. Nat Rev Cancer. 2009;9(6):400-14
27. Sukhthankar M, Choi CK, English A, Kim JS, Baek SJ. A potential proliferative gene, NUDT6, is down-regulated by green tea catechins at the posttranscriptional level. J Nutr Biochem. 2010;21(2):98-106
28. Tanikawa C, Furukawa Y, Yoshida N, Arakawa H, Nakamura Y, Matsuda K. XEDAR as a putative colorectal tumor suppressor that mediates p53-regulated anoikis pathway. Oncogene. 2009;28(34):3081-92
29. Uyen B. Chu, Sevahn K. Vorperian, Kenneth Satyshur, Kelsey Eickstaedt, Nicholas V. Cozzi, Timur Mavlyutov, et al. Noncompetitive Inhibition of Indolethylamine-N-methyltransferase by N,N-Dimethyltryptamine and N,N-Dimethylaminopropyltryptamine. Biochemistry. 2014;53(18):2956-2965
30. Carbonaro TM, Gatch MB. Neuropharmacology of N,N-dimethyltryptamine. Brain Res Bull. 2016;126(Pt 1):74-88
31. Fischer M. Census and evaluation of p53 target genes. Oncogene. 2017;36(28):3943-3956
32. Kpetemey M, Chaudhary P, Van Treuren T, Vishwanatha JK. MIEN1 drives breast tumor cell migration by regulating cytoskeletal-focal adhesion dynamics. Oncotarget. 2016;7(34):54913-54924
33. Sun XX, Dai MS. Deubiquitinating enzyme regulation of the p53 pathway: A lesson from Otub1. World J Biol Chem. 2014;5(2):75-84
34. Baietti MF, Simicek M, Abbasi Asbagh L, Radaelli E, Lievens S, Crowther J. et al. OTUB1 triggers lung cancer development by inhibiting RAS monoubiquitination. EMBO Mol Med. 2016;8(3):288-303
35. Gatliff J, Campanella M. TSPO is a REDOX regulator of cell mitophagy. Biochem Soc Trans. 2015;43(4):543-52
36. Gaykema SB, Brouwers AH, Lub-de Hooge MN, Pleijhuis RG, Timmer-Bosscha H, Pot L. et al. 89Zr-bevacizumab PET imaging in primary breast cancer. J Nucl Med. 2013;54(7):1014-8
37. Backer MV, Backer JM. Imaging key biomarkers of tumor angiogenesis. Theranostics. 2012;2(5):502-15
38. Forsythe JA, Jiang BH, Iyer NV, Agani F, Leung SW, Koos RD. et al. Activation of vascular endothelial growth factor gene transcription by hypoxia-inducible factor 1. Mol Cell Biol. 1996;16(9):4604-13
39. Mezquita P, Parghi SS, Brandvold KA, Ruddell A. Myc regulates VEGF production in B cells by stimulating initiation of VEGF mRNA translation. Oncogene. 2005;24(5):889-901
40. Ren F, Tang R, Zhang X, Madushi WM, Luo D, Dang Y. et al. Overexpression of MMP Family Members Functions as Prognostic Biomarker for Breast Cancer Patients: A Systematic Review and Meta-Analysis. PLoS One. 2015;10(8):e0135544
41. Valkovskaya N, Kayed H, Felix K, Hartmann D, Giese NA, Osinsky SP. et al. ADAM8 expression is associated with increased invasiveness and reduced patient survival in pancreatic cancer. J Cell Mol Med. 2007;11(5):1162-74
42. Chen J, Deng L, Dreymüller D, Jiang X, Long J, Duan Y. et al. A novel peptide ADAM8 inhibitor attenuates bronchial hyperresponsiveness and Th2 cytokine mediated inflammation of murine asthmatic models. Sci Rep. 2016;6:30451
43. Ende C, Gebhardt R. Inhibition of matrix metalloproteinase-2 and -9 activities by selected flavonoids. Planta Med. 2004;70(10):1006-8
44. Xu Q, Xu HX, Li JP, Wang S, Fu Z, Jia J. et al. Growth differentiation factor 15 induces growth and metastasis of human liver cancer stem-like cells via AKT/GSK-3β/β-catenin signaling. Oncotarget. 2017;8(10):16972-16987
45. Haipeng Ren, Yuanling Qi, Xiaoyan Yin, Jianfeng Gao. miR-136 targets MIEN1 and involves the metastasis of colon cancer by suppressing epithelial-to-mesenchymal transition. Onco Targets Ther. 2018;11:67-74
46. Chen Y, Wang YG, Li Y, Sun XX, Dai MS. Otub1 stabilizes MDMX and promotes its proapoptotic function at the mitochondria. Oncotarget. 2017;8(7):11053-11062
47. Wang Y, Zhou X, Xu M, Weng W, Zhang Q, Yang Y. et al. OTUB1-catalyzed deubiquitination of FOXM1 facilitates tumor progression and predicts a poor prognosis in ovarian cancer. Oncotarget. 2016;7(24):36681-36697
48. Song H, Hedayati M, Hobbs RF, Shao C, Bruchertseifer F, Morgenstern A. et al. Targeting aberrant DNA double-strand break repair in triple-negative breast cancer with alpha-particle emitter radiolabeled anti-EGFR antibody. Mol Cancer Ther. 2013;12(10):2043-54
49. Moll UM, Petrenko O. The MDM2-p53 interaction. Mol Cancer Res. 2003;1(14):1001-8
Author contact
![]() Corresponding authors: Kazuharu Arakawa, Ph.D., E-mail: gaoukeio.ac.jp; Phone: +81-235-29-0571. Tetsuya Sakashita, Ph.D., E-mail: sakashita.tetsuyago.jp; Phone: +81-27-346-9460.
Corresponding authors: Kazuharu Arakawa, Ph.D., E-mail: gaoukeio.ac.jp; Phone: +81-235-29-0571. Tetsuya Sakashita, Ph.D., E-mail: sakashita.tetsuyago.jp; Phone: +81-27-346-9460.