Theranostics
13.3
Impact Factor
- Current Issue
- Advance Articles
- Volume 16; 2026
- Volume 15; 2025
- Volume 14; 2024
- Volume 13; 2023
- Volume 12; 2022
- Archive
- Cover Images
- Cover Suggestion
- Special Issues
Top
Introduction
Methods
Results
Discussion
Abbreviations
Supplementary Material
Acknowledgements
References
Introduction
Methods
Results
Discussion
Abbreviations
Supplementary Material
Acknowledgements
References
International Journal of Biological Sciences
International Journal of Medical Sciences
 Global reach, higher impact

Theranostics 2019; 9(9):2541-2554. doi:10.7150/thno.32655 This issue Cite
Research Paper
Rapid histology of laryngeal squamous cell carcinoma with deep-learning based stimulated Raman scattering microscopy
Lili Zhang1,2#, Yongzheng Wu1#, Bin Zheng3# ![]() , Lizhong Su3, Yuan Chen4, Shuang Ma4, Qinqin Hu4, Xiang Zou5, Lie Yao5, Yinlong Yang6, Liang Chen5, Ying Mao5, Yan Chen1
, Lizhong Su3, Yuan Chen4, Shuang Ma4, Qinqin Hu4, Xiang Zou5, Lie Yao5, Yinlong Yang6, Liang Chen5, Ying Mao5, Yan Chen1 ![]() , Minbiao Ji1,2
, Minbiao Ji1,2 ![]()
1. State Key Laboratory of Surface Physics and Department of Physics, Fudan University, Shanghai 200433, China
2. Human Phenome Institute, Multiscale Research Institute of Complex Systems, Key Laboratory of Micro and Nano Photonic Structures (Ministry of Education), Fudan University, Shanghai 200433, China
3. Department of Otolaryngology, Zhejiang Provincial People's Hospital, People's Hospital of Hangzhou Medical College, Hangzhou 310014, China
4. Department of Pathology, Zhejiang Provincial People's Hospital, People's Hospital of Hangzhou Medical College, Hangzhou 310014, China
5. Department of Neurosurgery, Department of Pancreatic Surgery, Huashan Hospital, Fudan University, Shanghai 200040, China
6. Department of Breast Surgery, Fudan University Shanghai Cancer Center; Department of Oncology, Shanghai Medical College; Fudan University, Shanghai 200040, China
# These authors contributed equally.
Received 2018-12-29; Accepted 2019-3-25; Published 2019-4-13
Citation:
Zhang L, Wu Y, Zheng B, Su L, Chen Y, Ma S, Hu Q, Zou X, Yao L, Yang Y, Chen L, Mao Y, Chen Y, Ji M. Rapid histology of laryngeal squamous cell carcinoma with deep-learning based stimulated Raman scattering microscopy. Theranostics 2019; 9(9):2541-2554. doi:10.7150/thno.32655. https://www.thno.org/v09p2541.htm
Other stylesAbstract

Maximal resection of tumor while preserving the adjacent healthy tissue is particularly important for larynx surgery, hence precise and rapid intraoperative histology of laryngeal tissue is crucial for providing optimal surgical outcomes. We hypothesized that deep-learning based stimulated Raman scattering (SRS) microscopy could provide automated and accurate diagnosis of laryngeal squamous cell carcinoma on fresh, unprocessed surgical specimens without fixation, sectioning or staining.
Methods: We first compared 80 pairs of adjacent frozen sections imaged with SRS and standard hematoxylin and eosin histology to evaluate their concordance. We then applied SRS imaging on fresh surgical tissues from 45 patients to reveal key diagnostic features, based on which we have constructed a deep learning based model to generate automated histologic results. 18,750 SRS fields of views were used to train and cross-validate our 34-layered residual convolutional neural network, which was used to classify 33 untrained fresh larynx surgical samples into normal and neoplasia. Furthermore, we simulated intraoperative evaluation of resection margins on totally removed larynxes.
Results: We demonstrated near-perfect diagnostic concordance (Cohen's kappa, κ > 0.90) between SRS and standard histology as evaluated by three pathologists. And deep-learning based SRS correctly classified 33 independent surgical specimens with 100% accuracy. We also demonstrated that our method could identify tissue neoplasia at the simulated resection margins that appear grossly normal with naked eyes.
Conclusion: Our results indicated that SRS histology integrated with deep learning algorithm provides potential for delivering rapid intraoperative diagnosis that could aid the surgical management of laryngeal cancer.
Keywords: label-free imaging, stimulated Raman scattering, intraoperative histology, laryngeal cancer, head and neck
Introduction
Laryngeal cancer is one of the most common tumors of the respiratory tract, and squamous cell carcinoma (SCC) is the most common malignancy of the larynx [1,2]. Surgery remains an essential component in the treatment of laryngeal cancer, which aims at the dual goals of cure and preservation of organs, because larynx supports the fundamental physiological functions of breathing, speech, and swallowing [2-4]. Patients with early stage tumors have been proven to benefit from organ preservation-based surgical approaches [5], which requires the maximal removal of tumors while sparing the adjacent normal tissues. However, securing resection margin is challenging because of the complex anatomical structures of the larynx [6], and decisions regarding the extent of resection are crucial during operations. Although the histological differences between healthy and SCC tissues are clear, they are usually difficult to distinguish by naked eyes, even with visual aids such as narrow-band imaging [7], especially at the tumor boundaries. The current standard intraoperative histology with hematoxylin and eosin (H&E) staining suffers from a series of time-consuming procedures, such as freezing, sectioning and staining [8]. In addition, skilled pathologists are required for intraoperative diagnosis, which complicates the surgical workflow and generates discrepancies of subjective results among different pathologists. Therefore, imaging tools that provide rapid and accurate delineation of normal and neoplastic tissues are critically important.
Stimulated Raman Scattering (SRS) microscopy is a novel chemical imaging technique that has shown promise in label-free histology, without the need of the aforementioned tissue processing as in H&E [8-13]. SRS amplifies the weak Raman signal via stimulated emission by orders of magnitude to enable fast imaging with molecular specificity inherited from spontaneous Raman spectroscopy [14-16]. As a result, SRS microscopy is becoming an emerging tool for many biomedical researches, including lipid metabolism and quantification [17-19], drug delivery [20], tissue imaging [9,10,21,22], protein misfolding [23], etc., based on the endogenous contrasts from lipids, proteins and nucleic acids with subcellular resolution [24,25]. In particular, SRS microscopy has shown success in rapid histopathology for brain tumors in both xenograft models and human surgical specimens, demonstrating diagnosis in near-perfect agreement with conventional H&E [8-10,22]. Clinical SRS histology has recently stepped forward to the operating room with a fiber-laser based portable system, generating reliable intraoperative histological results on unprocessed surgical brain tissues [26,27]. Despite previous efforts on coherent Raman scattering histopathology on a few types of tissues and diseases [8-13,26,28-33], the potential for SRS to diagnose larynx tissues has never been rigorous investigated.
Moreover, as machine learning (ML) algorithms evolve rapidly, intelligent and precise diagnoses becomes possible with image-based deep learning [34,35]. Several ML models including multilayer perceptron (MLP) and random forests have been applied in brain tumor diagnosis with SRS microscopy [11,26]. Convolutional neural network (CNN) is an advanced neural network that has superior capability in recognizing two-dimensional data. For instance, CNNs have shown potentials in differentiating diagnostic features of H&E images, including mitotic counting in breast cancer, glands counting and epithelial/stromal segmenting in colon cancer, classification and mutation prediction in small cell lung cancer, as well as tumor grading in brain gliomas [36-40]. Recently, a well-known CNN model - GoogLeNet has shown success in recognizing and classifying clinical photos of diabetic retinopathy and skin cancer [41,42]. As a subtype of CNN, residual convolutional neural network (ResNet) has the further advantage of reduced error rate for both training and test data, especially when the dataset gets larger and the neural network gets deeper [43]. With the advancing techniques in SRS fast imaging and increasing size of SRS image datasets [21,44], applying deep learning algorithm tailored for SRS histology is highly demanded for improving classification accuracy, as well as accomplishing more complex classification tasks.
In this study, we systematically evaluated the capability of SRS microscopy in providing rapid and diagnostic histologic images for human larynx tissues. Combining two-color SRS with second harmonic generation (SHG) microscopy [45,46], we were able to acquire three-color images representing the distributions of lipids, proteins and collagen fibers. We first utilized the multi-color SRS system to image frozen tissue sections of both normal and neoplastic surgical tissues, yielding clear cytologic and histoarchitectural features for diagnosis. By correlating with H&E staining results of the adjacent sister sections and assessed by three pathologists, our results demonstrated that SRS reached high diagnostic concordance (κ>0.90). We further demonstrated that SRS microscopy is capable of imaging fresh tissues without any freezing or sectioning artifacts, capturing the fundamental diagnostic hallmarks for the classification of larynx tissues. More importantly, we developed a 34-layered ResNet (ResNet34) model trained with laryngeal SRS images, which accurately differentiate between diagnostic normal and neoplasia from 33 untrained surgical specimens. Furthermore, we simulated the process of ResNet34-SRS aiding intraoperative evaluation of resection margins on totally removed larynxes by imaging at various distances from the tumor margin. Our approach of deep learning assisted SRS microscopy holds promise in providing rapid and automated histopathologic method that may improve the surgical care of laryngeal squamous cell carcinoma.
Methods
Tissue collection and preparation
All tissue samples were collected from patients in Zhejiang Provincial People's Hospital, and approved by the Ethics Committee with informed written consent (KY2015260). Surgical tissues were removed following standard operative procedures. Laryngeal squamous cell carcinoma tissues were from clinical diagnosed biopsies, and normal tissues were largely taken from vocal cord polypus. To prepare frozen sections, surgical specimens were snap frozen in liquid nitrogen and stored at -80 0C until sectioned with freezing microtome (CM 1950, Leica). Thin sections of 20 µm thicknesses were used for SRS imaging, and adjacent 5 µm thick sections were sent for H&E staining. All fresh samples and thin sections were maintained at low temperature with dry ice and delivered to Fudan University within 7 hours through express transportation. Fresh tissues were sliced manually with a razor blade and then sealed between two coverslips and a perforated glass slide (0.5 mm thick) for direct SRS imaging. Thin frozen tissue sections were simply covered with coverslips, and imaged without further processing. Totally removed larynxes were taken from patients of advanced laryngeal SCC for simulated surgeries and evaluations of resection margins.
In total, 78 patient cases were involved in the database for imaging, model training and testing, more detailed information of all the cases are shown in Table S1. For fresh tissues, 45 out of the 78 cases (21 normal and 24 cancerous) were used for model training and validation, whereas the residual 33 cases were kept untouched until the final testing. For frozen section analysis, 15 out of the 78 cases (marked in Table S1) were used to generate 80 pairs of adjacent sections for SRS and H&E imaging. For all these cases, standard H&E based histopathology were done on paraffin embedded sections and served as the “ground truth”.
Microscope setup
The apparatus of our SRS based microscope is illustrated in Figure S1. A commercial femtosecond (fs) optical parametric oscillator (OPO, Insight DS+, Newport) with dual outputs were used as the light source. The fundamental 1040 nm beam (~200 fs) was used as the Stokes, and the wavelength tunable output (690-1300 nm, ~ 150 fs) was used as the pump. Both beams were linearly chirped to several picoseconds (pump: ~ 3.8 ps, Stokes: ~ 1.8 ps) through highly dispersive SF57 glass rods to work in the “spectral focusing SRS” mode [17,44], where the target Raman frequency could be adjusted by scanning the time delay between pump and Stokes pulses, instead of changing the wavelengths (Figure S1). The Stokes beam was intensity modulated by an electro optical modulator (EOM) at 10 MHz, and collinearly combined with the pump beam through a dichroic mirror (DMSP1000, Thorlabs). The combined beam was delivered to the laser scanning microscope (FV1200, Olympus) and focused onto the samples with an objective (UPLSAPO 60XWIR, NA 1.2 water, Olympus). The transmitted stimulated Raman loss (SRL) signal of the pump beam was filtered with a band-pass filter (CARS ET890/220, Chroma), detected with a home-built back-biased photodiode and demodulated with a lock-in amplifier (HF2LI, Zurich Instruments) to generate pixel data for the microscope to form SRS images. In this study, we fixed the pump beam at 802 nm center wavelength, and imaged at two time delays which correspond to two Raman frequencies of 2845 cm-1 and 2930 cm-1 for lipid/protein decomposition. The SHG signal excited by the pump beam was simultaneously detected with a narrow band-pass filter (FF01-405/10-25, Semrock) and a photomultiplier (PMT) in the epi mode, generating images of collagen fiber distributions.
The optical power of the pump and Stokes beams at the samples were kept at around 30 mW and 40 mW, respectively. Each field of view (FOV) was imaged with a size of 512 × 512 pixels and 2 µs pixel dwell time. Automated mosaic imaging method was applied to scan across large sample areas and all FOVs were stitched to form the full-sized images with custom written Matlab program. A typical 1 cm2 tissue costs ~ 8 minutes to image under strip mosaicing mode [21].
H&E staining
H&E staining was performed following the standard procedure. First, the tissue section was immersed in 100% methanol for 30 s and then stained in hematoxylin solution (Harris modified) for 1 minute. Sample was washed in deionized water for 10 seconds after each step. Next, we perform counterstain in 0.5% eosin solution for 60 s after dipping in bluing reagent [0.1% (v/v) ammonia water solution] for 1 s and washing in deionized water for 1 second. At last, we dipped the sample in xylene for 10 s twice after washing and dehydrating in 80%, 95% and 100% ethanol for 2 s, respectively. Dried Sections were sealed with neutral gum and a coverslip. All reagents used were purchased from Sigma-Aldrich. The final H&E slides were imaged on a home-built automated system, composed of a bright field microscope (IX73, Olympus), a CCD camera (MG 320 C Speed, Moogee) and a motorized XY stage (Tango, Marzhauser Wetzlar GmbH & Co.). Mosaic imaging and stitching were realized with custom softwares written in VB.net and Matlab.
Image processing
Raw SRS images taken at 2845 cm-1 and 2930 cm-1 need to be decomposed into lipids and proteins distributions. Because SRS signal is linearly proportional to chemical concentrations, we apply a simple linear algorithm for the decomposition with measured SRS spectra of standard lipid (oleic acid - OA) and protein (bovine serum albumin - BSA) as shown in Figure S1 and previous works [9,26]. We extracted protein (blue) signal by subtracting SRS signal at 2845 cm-1 from that of 2930 cm-1, and the lipid (green) signal was directly taken from SRS signal at 2845 cm-1. SHG data (red) was used without further processing. Because of the aberrations from object lens, signal intensity of each image FOV is not evenly distributed, usually brighter in the center. We used the intensity profile measured from a spatially homogeneous sample to correct/flatten each FOV, followed by our stitching program to merge all FOVs together.
Survey and statistical analysis
We collected survey results using a web-based survey tool (LimeSurvey), consisting of 80 pairs of SRS and H&E images from adjacent sister sections, which were mixed and shown in random order. Three blinded pathologists were briefly educated with the principle and image contrasts of SRS, then read the 160 images and categorized each image as “normal” or “neoplasia” based on the diagnostic features of either cytology or histoarchitecture. The rating results were based on the “ground truth” of standard histopathology on paraffin embedded sections. For each pathologist, survey responses were used to calculate Cohen's kappa statistic for normal versus neoplasia to determine concordance between SRS and H&E with statistical product and service solutions (SPSS) software [47]. We calculated the accuracies of the three pathologists using the ratio between the number of correct and total FOVs.
Deep-learning model
We constructed a ResNet34 model in Pytorch platform (https://pytorch.org/). The model is a tensor and dynamic neural network written in python. In addition to 34 layers of plain convolutional neural network, ResNet34 contains identity mappings that allow the information of the input or gradient to pass through many layers. ResNet34 has 33 convolutional layers and 1 fully connected (fc) layer. The convolutional layers mostly capture the main local features of images with 3×3 filters, and the last fully connected layer gives a binary classification according to the global feature connected from all local features. It is worth noticing that batch normalization was employed in the same magnitude at each convolutional layer. To optimize the neural network, the weights of network were initialized randomly. Loss was calculated according to the cross entropy (log mean square error). The selected optimizer was the 'Adam' optimizer with the following parameters: lr=5×10⁻⁵, β1=0.9, β2=0.99, w=10-4; where lr and w represent the learning rate and weight decay, respectively; β1 and β2 represent the memory lifetimes of the first and second moment [48]. Images were fed in batches with a batch size of 100.
Data augmentation techniques were used to help produce similar but non-identical data, which could effectively enlarge image database for the training of deep-learning models [49,50]. In this work, we applied rotation, flipping and color jittering of images to effectively enlarge our image dataset. The random rotation angle was set to 20 degrees, and the probability of horizontal and vertical flipping is set to 0.5. The best color jitter values including image brightness, saturation and contrast fluctuations are set to 0.4.
Results
Characterization of SRS microscope
The basic principle of SRS process is illustrated in Figure 1A. We first calibrated the SRS spectroscopy of our system with standard chemicals of lipid (OA) and protein (BSA) by measuring the SRS intensity as functions of time delays. SRS spectra of OA and BSA showed the Raman shifts of 2845 and 2930 cm-1 corresponding to the time delays of 0 and -2.2 ps in our platform, respectively (Figure S1). Figure 1B shows the typical SRS spectra of cell nucleus, and cytoplasm in larynx tissues. The difference of lipid and protein contents in cell nucleus and cytoplasm provides the basis of contrast for cellular morphology, i.e. cell nucleus contain much less lipids than surrounding tissues. Noting that collagen fibers showed strong SHG signal, which was used as is in this study. We then demonstrated multi-color imaging of larynx tissue with our integrated SRS/SHG microscope as shown in Figure 1C, where the raw SRS images of the CH2 (2845 cm-1) and CH3 (2930 cm-1) vibrations, as well as the SHG image of collagen fibers were clearly shown. In SRS image taken at 2845 cm-1, cell nucleus appeared much darker than surrounding extranuclear structures because of the relatively lower concentrations of lipids. By contrast, SRS image obtained at 2930 cm-1 appeared bright in the whole cell. Lipid and protein contents could be extracted from the raw SRS image taken at 2845 cm-1 and 2930 cm-1 with linear decomposition algorithms. We color coded lipid, protein and collagen fibers as green, blue and red, respectively. Such three-color images could map out tissue architectures and provide detailed structural and chemical contrast for the histopathology of laryngeal tissue (Figure 1D). Figure 1E shows the SRS and SHG intensity profiles along the dashed line as marked in Figure 1D, demonstrating clear interfaces between cellulous epithelium layers and collagen-rich connective tissues. Hence, multi-color SRS microscopy may reveal important cellular features and tissue morphologies for larynx histology.
Figure 1
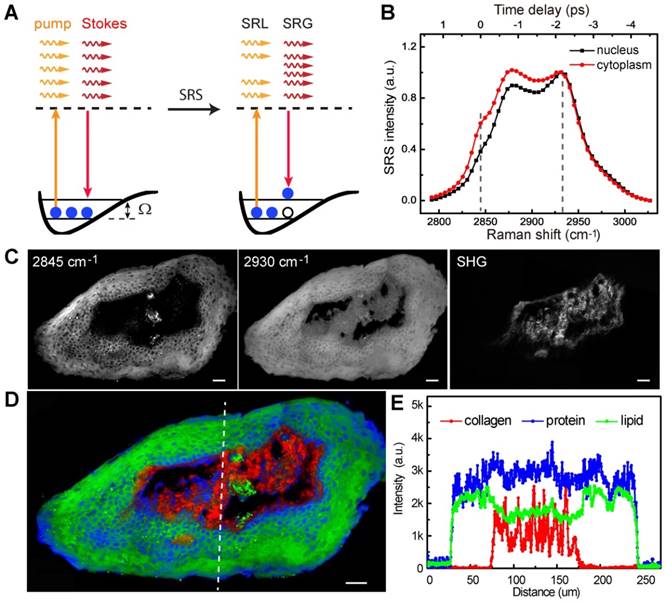
Experimental design. A, Illustration of stimulated Raman scattering process, which leads to the reduction of pump photons - stimulated Raman loss (SRL) and the gain of Stokes photons - stimulated Raman gain (SRG); meanwhile the molecules are excited to their vibrational excited states with Raman frequency Ω. B, Representative SRS spectra of cell nucleus and cytoplasm in laryngeal tissue. C, Raw SRS images of a typical laryngeal tissue taken at 2845 and 2930 cm-1, as well as the SHG channel. D, Composite image reconstructed from data in C, green: lipids; blue: proteins; red: collagen fibers. E, Intensity profiles of the three components across the epithelium and connective tissues along the dashed line shown in D. Scale bars: 30 μm.
Validation of SRS imaging on thin frozen sections of larynx tissues
We began by evaluating the ability of SRS microscopy to image the architecture of normal larynx tissue sections. SRS and H&E images of adjacent thin tissue sections of vocal cord polypus were shown in Figure 2. Both SRS and H&E demonstrated the ability to detect characteristic large-scale histoarchitectural features including the squamous mucosa layer in the periphery and the underlying connective tissues (Figure 2A). Zoom-in SRS images could clearly reveal microscopic features of normal larynx (Figure 2B-E), including the intact basal lamina, regularly patterned basal layer, and squamous mucosa layer viewed from cross-section and en face (Figure 2D and E). Therefore, both SRS and H&E are capable of generating similar images of the microscopic architectures of normal larynx tissues that correlate well with each other.
We next evaluated the ability of SRS microscopy to characterize the diagnostic features of laryngeal SCC. Figure 3A showed a typical SCC in situ, demonstrating thickened squamous mucosa layer and increased cellular density, yet the basal lamina stays intact. In contrary to SCC in situ, invasive SCC tissue demonstrated infiltrative epithelial cells scattered across the basal lamina into the stroma (Figure 3B). Furthermore, zoomed-in SRS images could reveal detailed diagnostic features of SCC, including cytological atypia (Figure 3C), abnormal arrangement of neoplastic cells and lymphocytes (Figure 3D), cancer nests (Figure 3E) and keratin pearl (Figure 3F). It could be seen that SRS microscopy clearly differentiated these key histological features of SCC with high consistency with H&E staining.
We tested the hypothesis that SRS microscopy could provide an alternative method of intraoperative histology, based on its capability to reveal diagnostic features. For each specimen, a pair of adjacent frozen sections were separately imaged with SRS and stained with H&E. We collected 160 images in total (80 SRS and 80 H&E) for the evaluation, a few of which are shown in Figure S2. Three professional larynx pathologists read the randomly mixed images of H&E and SRS following their own clinical practices. Responses were collected regarding the classification of neoplasia or normal based on cytology and histoarchitecture, and rated results by comparing with standard histology are shown in Table 1. Statistical analysis of the pathologists' diagnostic results on SRS and frozen H&E images yielded high concordance (Cohen's kappa) between them (κ=0.905-0.942). Moreover, pathologists were highly accurate in distinguishing neoplastic from normal larynx tissues based on SRS images (> 90%) (Table 1). These results verified that SRS microscopy may serve as an alternative means for intraoperative histology with high accuracy and concordance compared with H&E.
Figure 2
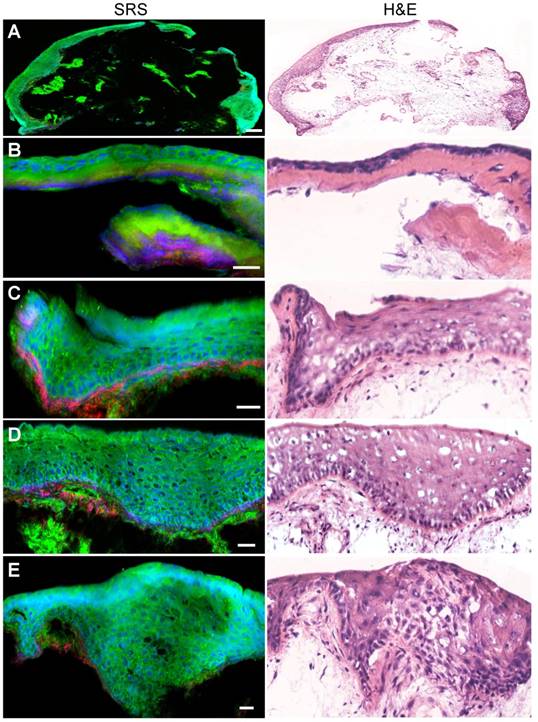
SRS and H&E images of adjacent frozen sections from normal laryngeal tissues. A, Typical large-scale images from normal laryngeal tissue. B-E, Zoom-in images demonstrating regular structures of the basal lamina, basal layer, epical layer, as well as the scale-like squamous cells. Scale bars: 100 μm (A), 30 μm (B-E).
SRS imaging of fresh surgical specimens
We performed SRS imaging on fresh larynx tissues, which were free of the freezing and sectioning artifacts with well-preserved tissues architectures. More importantly, fresh tissue imaging mimics the label-free intraoperative histology without complex sample processing. We first carpet-scanned the epithelium layer of a normal larynx specimen to show the detailed structures of epithelium tissues. Figure 4A-C showed typical SRS images collected at different locations of the tissue, showing regular cellular morphology and patterns of normal squamous cells.
Figure 3
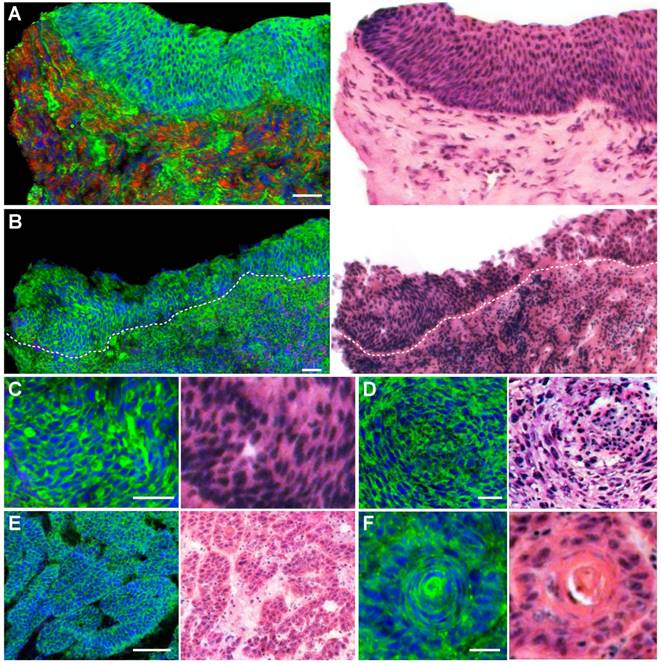
SRS and HE images of frozen sections from laryngeal squamous cell carcinoma tissues. A, Laryngeal SCC in situ. B, Invasive SCC. C, Cytological atypia. D, Cytological atypia accompanied with lymphocytes and architectural neoplasm. E, Cancer nests. F, A typical keratin pearl. Scale bars: 100 μm (B and E), 30 μm (A, C, D and F).
Table 1
Comparison of SRS and H&E images from web-based survey results. 80 pairs of both types of images were presented to three pathologists (P1-P3) in random order for evaluation. Each image was rated as “normal” or “neoplasia” and compared with the standard histopathology result.
| Diagnosis | P1 | P2 | P3 | Accuracy | ||||
|---|---|---|---|---|---|---|---|---|
| Correct | Incorrect | Correct | Incorrect | Correct | Incorrect | (%) | ||
| normal | H&E | 20 | 0 | 17 | 3 | 19 | 1 | 93.3 |
| SRS | 20 | 0 | 16 | 4 | 19 | 1 | 91.7 | |
| neoplastic | H&E | 57 | 3 | 58 | 2 | 56 | 4 | 95.0 |
| SRS | 58 | 2 | 58 | 2 | 55 | 5 | 95.0 | |
| Total | H&E | 77 | 3 | 75 | 5 | 75 | 5 | 94.6 |
| SRS | 78 | 2 | 74 | 6 | 74 | 6 | 94.2 | |
| Accuracy (%) (% (%) | 96.9 | 93.1 | 93.1 | |||||
| Concordance | 0.905 | 0.933 | 0.942 | |||||
Figure 4
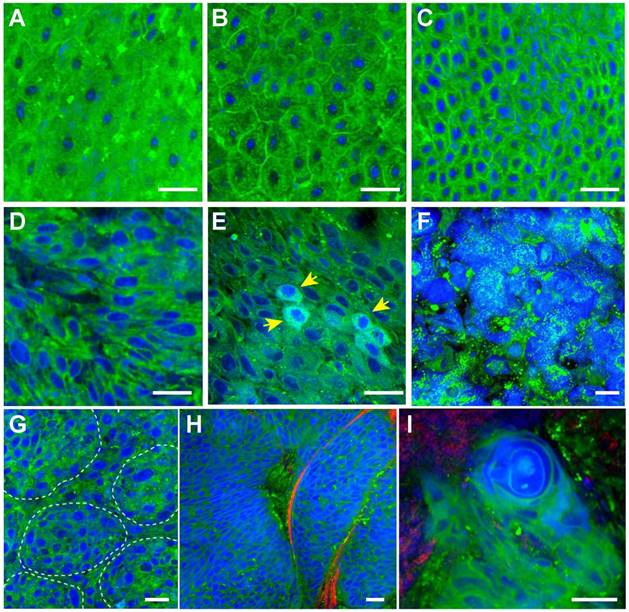
SRS imaging of unprocessed fresh larynx surgical tissues. A-C, Normal squamous cells imaged at various locations of the epithelium layer. Histological hallmarks of laryngeal SCC could be visualized, including: D, Enlarged cell nucleus and abnormal nuclear morphology; E, Cells with enriched nuclear contents (yellow arrows); F, Highly disordered cells with almost disrupted cell morphologies; G, Clustered small nests; H, High grade dysplasia. I, Keratin pearl. Scale bars: 30 μm.
We next imaged fresh laryngeal SCC tissues to demonstrate its diagnostic capability on these highly heterogeneous specimens (Figure 4D-I). SCC is the most common laryngeal cancer with abnormal squamous cells being a major pathological feature. Various pathological hallmarks at both cellular and tissue levels could be revealed by SRS imaging. Figure 4D shows the typical heteromorphic cell nucleus, including diversified nucleus size and shape, in strong contrast to the normal squamous cells (Figure 4A-C). Figure 4E shows scattered cells with enriched protein contents in nucleus (yellow arrows), which may be associated with the mitotic figures of proliferating tumor cells that contain elevated protein and DNA levels [25]. Figure 4F shows highly disordered cells with disrupted cellular morphologies, indicating high grade dysplasia. Cancer nests formed by a few clustered cells could be readily identified in Figure 4G. Typical cancer nests surrounded by collagen fibers could be seen in Figure 4H, demonstrating both cytological atypia and structural neoplasia. In highly differentiated laryngeal SCC tissue, typical keratin pearl could be observed in Figure 4I. Fresh-tissue SRS imaging not only generates higher quality image data than frozen sections, but also simulates rapid intraoperative histology which may provide even faster and automated diagnosis when combined with proper image processing methods. We have developed a numerical algorithm to quantitatively analyze cellular density, nuclear morphology, and lipid/protein ratio, which could be used to differentiate normal and SCC tissues (Figure S3). However, such feature based method relies on the pre-knowledge of quantitative histological details, requires very high image quality, and is computationally inefficient. We thus decided to apply deep-learning based method to classify SRS images instead.
Construction and training of deep-learning model
We employed ResNet34 model to assist the diagnosis of larynx tissues based on SRS image data. The network architecture is shown in Figure 5A, the work flow and data segmentation are illustrated in Figure 5B. To train the RetNet34 model, we incorporated SRS images from 45 training cases of 21 normal and 24 neoplastic cases (Table S1), and labelled them as “normal” and “neoplasia”, respectively. Typical SRS images of the two groups are shown in Figure S4. SRS images of 33 untrained cases were kept untouched as the test set until the very end of the training process. We then sliced all images into small tiles of 200×200 pixels (77×77 µm) and randomly selected 18,750 image tiles from the training cases for model training. The total data sizes of the “normal” and “neoplasia” groups were kept equal. In addition, data augmentation techniques, such as rotation, vertical and horizontal flipping methods, were applied to inflate the size of the training dataset to reduce overfitting [50]. At last, the enhanced training data was fed into the ResNet34 model for iteration to minimize the loss function.
Figure 5
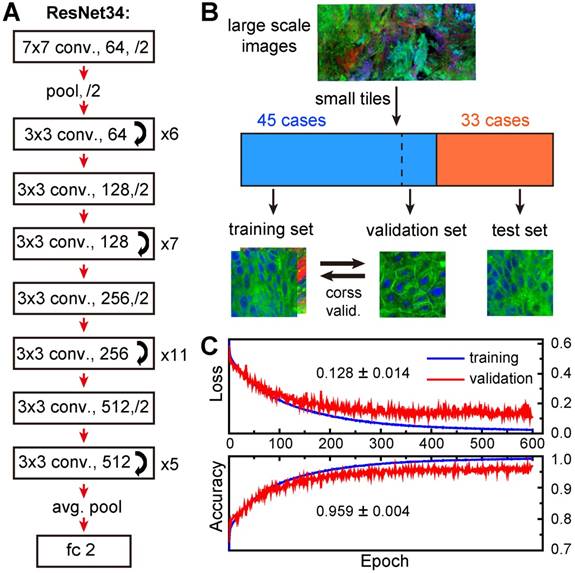
Construction and validation of deep-learning model. A, Network architecture of ResNet34. B, Schematic illustration of the work flow for training and validation of the model. C, Five-fold cross validation results.
K-fold cross-validation (K-CV) approach was used to estimate the generalization capability of ResNet model and eliminate possible correlation between samples. Typically, K value of 5 or 10 was chosen to achieve balanced bias and variance [51]. In our study, 5-fold cross-validation (5-CV) method was used: the total 18,750 training image tiles were randomly divided into five equal segments, one of which (3,750 tiles) was used for validation, and the remaining 4 segments (15,000 tiles) were used for training (model building); this process was repeated 5 times by using each of the 5 segments as the validation set, and the averaged accuracy and loss were reported for optimization in the next epoch. We plotted the averaged losses and accuracies of the 5-CV for both training and validation sets in Figure 5C. The results showed high validation accuracy up to 95.9% with a stable standard deviation of 0.4% and low validation errors of 12.8% with a standard deviation of 1.4%, indicating a well-balanced bias and variance. In addition, both accuracies and errors remained stable from 300 to 600 epochs, implying minimum overfitting of our model.
Deep-learning assisted tissue histology
We next tested our trained ResNet34 model on SRS images of fresh larynx tissues. To illustrate our method, we showed an SRS image of a laryngeal SCC tissue in Figure 6A, which was divided into 9✕9 image tiles (200✕200 pixels each). Our ResNet34 model made predictions on each image tile, yielding binary results of either normal (grey) or neoplasia (brown), as shown in the right panel of Figure 6A. In the same way, we processed a typical normal laryngeal tissue and plotted the prediction results in Figure 6B. Note the histoarchitectural heterogeneity of laryngeal SCC tissues and the fact that some specimens may contain a mixture of neoplastic and normal tissues. We judged the diagnostic results on specimen level based on the most common diagnostic class tiles by calculating the percentage of neoplastic image tiles within the entire specimen. The above two examples gave percentages of 92.6% for Figure 6A and 3.7% for Figure 6B, generating predicted diagnostic results of “neoplasia” and “normal”, respectively.
Figure 6
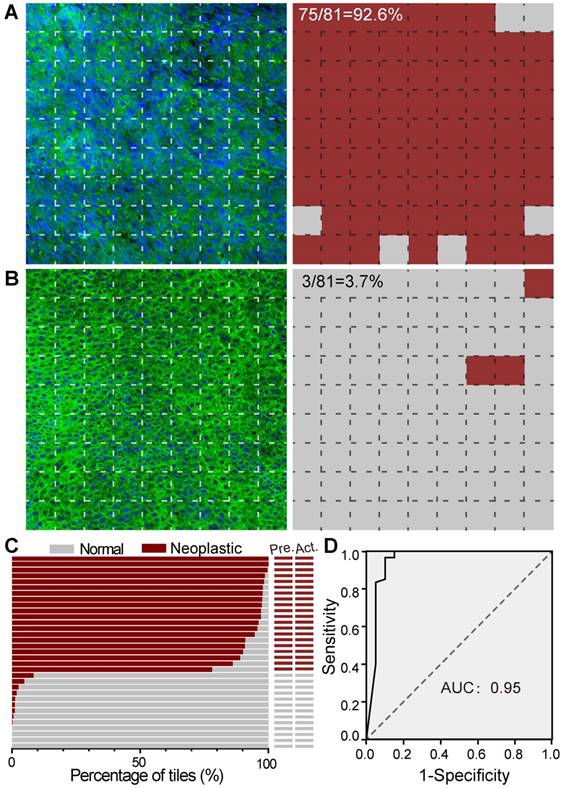
SRS histology of larynx tissue with the aid of ResNet34. A, Imaging and prediction results of a laryngeal SCC tissue. The large image was divided into small FOVs (77×77 μm), and predictions were made on individual FOV to yield either normal (gray) or neoplastic (red). B, Results of a normal tissue. C, Diagnostic results of 33 independent cases using ResNet34-SRS, compared with true pathology results. D, ROC analysis of the results from ResNet34. AUC: area under the curve.
The statistical percentages of neoplastic tiles for SRS images of specimens from 33 untrained laryngeal patient cases (test set, Table S1) are shown in Figure 6C. Each large SRS image of the whole specimen contains on average ~ 1000 image tiles for deep learning prediction. Although the total training process of ~ 600 epochs took about 10 hours, the prediction on an image of 1000 tiles only took ~ 20 seconds. Our results showed that the trained ResNet34 accurately differentiated neoplastic from normal specimens with 100% accuracy compared to standard H&E histology using paraffin embedded tissue sections. These results demonstrated the validity of ResNet34 model for laryngeal SCC prediction.
The diagnostic capacity of the ResNet34 for classifying individual image was demonstrated by evaluating the 80 SRS images included in the above survey for pathologists. Based on the survey results, the receiver operating characteristic (ROC) analysis for our RestNet34 model is shown in Figure 6D, demonstrating its validity for the classification of laryngeal SCC with an area under curve (AUC) of 0.95 and an accuracy of 90%.
Evaluation of simulated resection margins with deep-learning based SRS
We next demonstrated the possibility of using ResNet34-assisted SRS microscopy to evaluate the surgical margins. We used totally removed larynxes to simulate the surgical process (Figure 7). On the removed organ, the surgeon could visually identify the gross margin, as well as the estimated resection margin (Figure 7A) for simulated surgery. Three fresh tissue specimens were collected within the tumor (T), at the gross margin (M), and ~ 5 mm away from the gross margin (N) as judged by the surgeon based on his experience with naked eyes (Figure 7A). These specimens were imaged with SRS and then sent for standard histology. We presented the results of three studied cases in Figure 7B. Only in the first case did the surgeon's assessment match well with the ResNet34-SRS prediction. In the other two cases, residual neoplasm could be detected at simulated surgical margins. Figure 7C shows an SRS image of a specimen collected at the gross margin and its ResNet34 predicted results, demonstrating mixed normal and neoplastic regions with a detectable boundary. Corresponding image tiles predicted as neoplastic and normal tissues are also shown. These results implied that resection margins identified by naked eyes may still be infiltrated by tumor cells, and ResNet34-assisted SRS microscopy may provide rapid intraoperative assessments on resection margins.
Figure 7
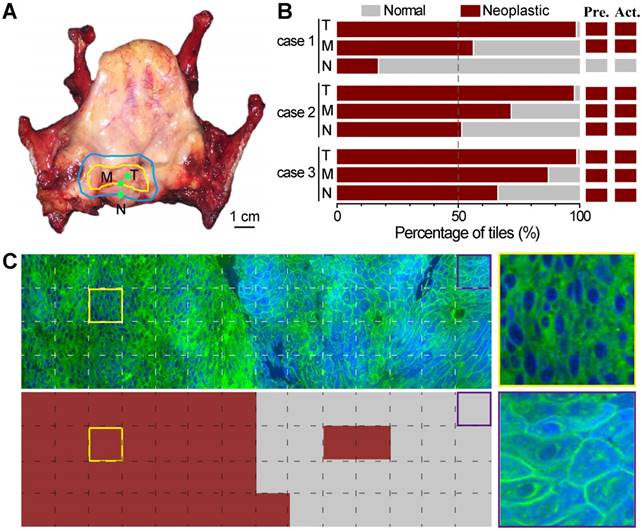
Evaluation of simulated resection margins with ResNet34-SRS. A, A typical totally removed larynx, showing the gross margin (yellow line) of the tumor and the estimated resection margin (blue line); tissues were taken from inside the tumor (T), at the gross margin (M) and ~5 mm away from the gross margin (N) during simulated surgery. B, Evaluation results of three simulated surgical cases with ResNet34-SRS. C, Imaging and prediction results of a surgical tissue taken from the gross margin. Zoom-in images of neoplastic (yellow frame) and normal (purple frame) regions were shown in the right panels.
Discussion
The ideal laryngeal tumor surgery is to remove all local malignant tissues without any residual viable tumor cells left behind. In clinic, after tumor resection, surgeons always cut several pieces of tissues at the residual margin to be evaluated by a pathologist. If cancerous cells still exist at the resection margin, extended resection and examination is demanded to reach the goal of complete tumor resection. Resection margins considered normal would be retained for the preservation of functions, especially for early laryngeal SCC. However, it is difficult to obtain three-dimensional assessment of tumor edges with traditional histology, and sub-mucosal extension may be left behind with a risk of tumor recurrence despite seemingly clear resection margins. Although the imaging depth of SRS microscopy is limited (<200 um), it still holds potential for providing 3D histology in the setting of intraoperative imaging, because of the intrinsic optical sectioning capability. Moreover, since SRS microscopy is non-invasive, surgical tissues imaged by SRS could still be used for further molecular and histological evaluations.
Although simple neural networks with a few of hidden layers could approximate any continuous function, it has limited capacity, inadequate data expression ability, and is prone to fall into local minimums during optimization process. With the increasing number of hidden layers, deep neural network usually works better for approximating the true distribution of data, especially when the training dataset is large. However, overly increasing the depth of neural network may cause vanishing or exploding gradient problems, and lead to worse training results. For instance, the performance of the well-known VGGNet (16 or 19 layers) and GoogLeNet (22 layers) may become worse when the number of layers is further increased [43]. Comparing with plain CNN, ResNet contains additional identity mappings which allows the information of the input and gradient to pass smoothly through many layers. ResNet performs exceptionally well when the network gets much deeper, and it won the ImageNet Large Scale Visual Recognition Competition (ILSVRC) in 2015. The commonly used ResNet has 18, 34, 50, 101 or 152 layers. Considering our computational capacity and image data size, we chose the 34-layer ResNet in this work. Comparing with previous SRS studies using random forests and MLP (9,21), ResNet34 model has the advantage of retaining the structures of two-dimensional SRS data, and outperformed 4-layer MLP for the same training dataset as we have tested (Fig. S5). Thus RestNet34 based SRS microscopy may provide an alternative for DL-based histopathology with high accuracy.
In principle, the deeper the neural network is used, the larger the dataset is needed. In the current study, the achievable dataset is limited by the number of accessible fresh surgical samples from patients. We partially compromised this issue by applying data augmentation techniques to effectively enlarge the image dataset, and suppressed the overfitting of our DL model. For the same reason, DL classification of cancerous specimens into subtypes was not possible at the current stage. To increase the size of SRS image dataset, it is important to accumulate more surgical tissues as well as increase the imaging speed. With the advancement of multi-color imaging techniques and fast scanning methods [21,44], the imaging speed for large-area tissues may ultimately approach that of digital pathology. It is expected that larger image datasets provides opportunities for further development and optimization of DL based neural networks to accomplish more refined tasks, such as the classification of tumors into different grades and subtypes.
In summary, we have shown that multicolor SRS microscopy could provide label-free histology for larynx tissues, revealing key diagnostic features with results similar to traditional H&E. Moreover, SRS integrated with ResNet34 deep neural network may provide a rapid and accurate means for intraoperative diagnosis on fresh, unprocessed larynx surgical tissues. With future larger image datasets, ResNet34 model could be further optimized for robust and automated prediction that can help informing surgical goals and improving decision-making work flows. Our work widens the biomedical applications of this emerging technique, and our method may be applied to broader types of solid tumors that might benefit from rapid intraoperative diagnosis.
Abbreviations
SRS: stimulated Raman scattering; SHG: second harmonic generation; SCC: squamous cell carcinoma; H&E: hematoxylin and eosin; ML: machine learning; MLP: multilayer perceptron; CNN: convolutional neural network; ResNet: residual convolutional neural network; ILSVRC: ImageNet Large Scale Visual Recognition Competition; OPO: optical parametric oscillator; EOM: electro optical modulator; LIA: lock-in amplifier; PD: photodiode; SP: short pass filter; SRL: stimulated Raman loss; PMT: photomultiplier; FOV: field of view; OA: oleic acid; BSA: bovine serum albumin; SPSS: statistical product and service solutions; K-CV: K-fold cross-validation; 5-CV: 5-fold cross-validation; ROC: receiver operating characteristic; AUC: area under curve.
Supplementary Material
Supplementary figures and table; the optical setup; typical SRS and H&E images used for the survey; quantitative image analysis; and typical SRS images used for training deep-learning model.
Acknowledgements
We thank the financial support from the National Natural Science Foundation of China (81671725); Shanghai Municipal Science and Technology Major Project (2017SHZDZX01); National Key R&D Program of China (2016YFC0102100); Shanghai Action Plan for Scientific and Technological Innovation program (16441909200, 15441904500); Natural Science Foundation and Major Basic Research Program of Shanghai (16JC1420100); and Medicine and Health Research Foundation of Zhejiang Province (2019RC006, 2015KYB025, 2016KYB013).
Competing Interests
The authors have declared that no competing interest exists.
References
1. Steuer CE, El-Deiry M, Parks JR, Higgins KA, Saba NF. An update on larynx cancer. CA Cancer J Clin. 2017;67:31-50
2. Franchin G, Vaccher E, Politi D, Minatel E, Gobitti C, Talamini R. et al. Organ preservation in locally advanced head and neck cancer of the larynx using induction chemotherapy followed by improved radiation schemes. Eur Arch Otorhinolaryngol Suppl. 2009;266:719-726
3. Mehta DD, Hillman RE. Current role of stroboscopy in laryngeal imaging. Curr Opin Otolaryngol Head Neck Surg. 2012;20:429-436
4. Miles BA, Patsias A, Quang T, Polydorides AD, Richards-Kortum R, Sikora AG. Operative margin control with high-resolution optical microendoscopy for head and neck squamous cell carcinoma. Laryngoscope. 2015;125:2308-2316
5. Weinstein GS, Laccourreye O, Ruiz C, Dooley P, Chalian A, Mirza N. Larynx preservation with supracricoid partial laryngectomy with cricohyoidoepiglottopexy: correlation of videostroboscopic findings and voice parameters. Ann Otol Rhinol Laryngol. 2002;111:1-7
6. American Society of Clinical O, Pfister DG, Laurie SA, Weinstein GS, Mendenhall WM, Adelstein DJ, et al. American society of clinical oncology clinical practice guideline for the use of larynx-preservation strategies in the treatment of laryngeal cancer. J Clin Oncol. 2006;24:3693-3704
7. Plaat BEC, Zwakenberg MA, van Zwol JG, Wedman J, van der Laan B, Halmos GB. et al. Narrow-band imaging in transoral laser surgery for early glottic cancer in relation to clinical outcome. Head Neck. 2017;39:1343-1348
8. Lu FK, Calligaris D, Olubiyi OI, Norton I, Yang W, Santagata S. et al. Label-free neurosurgical pathology with stimulated Raman imaging. Cancer Res. 2016;76:3451-3462
9. Ji M, Orringer DA, Freudiger CW, Ramkissoon S, Liu X, Lau D. et al. Rapid, label-free detection of brain tumors with stimulated Raman scattering microscopy. Sci Transl Med. 2013;5:201ra119
10. Ji M, Lewis S, Camelo-Piragua S, Ramkissoon SH, Snuderl M, Venneti S. et al. Detection of human brain tumor infiltration with quantitative stimulated Raman scattering microscopy. Sci Transl Med. 2015;7:309ra163
11. Hollon TC, Lewis S, Pandian B, Niknafs YS, Garrard MR, Garton H. et al. Rapid intraoperative diagnosis of pediatric brain tumors using stimulated Raman histology. Cancer Res. 2018;78:278-289
12. Yang Y, Chen L, Ji M. Stimulated Raman scattering microscopy for rapid brain tumor histology. J Innov Opt Health Sci. 2017;11:1730010-1730021
13. Bentley JN, Ji MB, Xie XS, Orringer DA. Real-time image guidance for brain tumor surgery through stimulated Raman scattering microscopy. Expert Rev Anticancer Ther. 2014;14:359-361
14. Freudiger CW, Min W, Saar BG, Lu S, Holtom GR, He C. et al. Label-free biomedical imaging with high sensitivity by stimulated Raman scattering microscopy. Science. 2008;322:1857-1861
15. Ploetz E, Laimgruber S, Berner S, Zinth W, Gilch P. Femtosecond stimulated Raman microscopy. Appl Phys B. 2007;87:389-393
16. Saar BG, Freudiger CW, Reichman J, Stanley CM, Holtom GR, Xie XS. Video-rate molecular imaging in vivo with stimulated Raman scattering. Science. 2010;330:1368-1370
17. Fu D, Yu Y, Folick A, Currie E, Farese RV Jr, Tsai TH. et al. In vivo metabolic fingerprinting of neutral lipids with hyperspectral stimulated Raman scattering microscopy. J Am Chem Soc. 2014;136:8820-8828
18. Shen Y, Zhao Z, Zhang L, Shi L, Shahriar S, Chan RB. et al. Metabolic activity induces membrane phase separation in endoplasmic reticulum. Proc Natl Acad Sci U S A. 2017;114:13394-13399
19. Wang MC, Min W, Freudiger CW, Ruvkun G, Xie XS. RNAi screening for fat regulatory genes with SRS microscopy. Nat Methods. 2011;8:135-138
20. Fu D, Zhou J, Zhu WS, Manley PW, Wang YK, Hood T. et al. Imaging the intracellular distribution of tyrosine kinase inhibitors in living cells with quantitative hyperspectral stimulated Raman scattering. Nat Chem. 2014;6:614-622
21. Zhang B, Sun M, Yang Y, Chen L, Zou X, Yang T. et al. Rapid, large-scale stimulated Raman histology with strip mosaicing and dual-phase detection. Biomed Opt Express. 2018;9:2604-2613
22. Freudiger CW, Pfannl R, Orringer DA, Saar BG, Ji MB, Zeng Q. et al. Multicolored stain-free histopathology with coherent Raman imaging. Lab Invest. 2012;92:1661-1661
23. Ji M, Arbel M, Zhang L, Freudiger CW, Hou SS, Lin D. et al. Label-free imaging of amyloid plaques in Alzheimer's disease with stimulated Raman scattering microscopy. Sci Adv. 2018;4:eaat7715
24. Zhang X, Roeffaers MBJ, Basu S, Daniele JR, Fu D, Freudiger CW. et al. Label-free live cell imaging of nucleic acids using stimulated Raman scattering (SRS) microscopy. Chemphyschem. 2012;13:1054-1059
25. Lu FK, Basu S, Igras V, Hoang MP, Ji M, Fu D. et al. Label-free DNA imaging in vivo with stimulated Raman scattering microscopy. Proc Natl Acad Sci U S A. 2015;112:11624-11629
26. Orringer DA, Pandian B, Niknafs YS, Hollon TC, Boyle J, Lewis S. et al. Rapid intraoperative histology of unprocessed surgical specimens via fibre-laser-based stimulated Raman scattering microscopy. Nat Biomed Eng. 2017:1
27. Freudiger CW, Yang W, Holtom GR, Peyghambarian N, Xie XS, Kieu KQ. Stimulated Raman scattering microscopy with a robust fibre laser source. Nat photonics. 2014;8:153-159
28. Richa M, Mihaela B, Tatiana K, Potma EO, Laila E, Zachary CB. et al. Evaluation of stimulated Raman scattering microscopy for identifying squamous cell carcinoma in human skin. Lasers Surg Med. 2013;45:496-502
29. Francis A, Berry K, Chen Y, Figueroa B, Fu D. Label-free pathology by spectrally sliced femtosecond stimulated Raman scattering (SRS) microscopy. PloS One. 2017;12:e0178750
30. Bocklitz TW, Salah FS, Vogler N, Heuke S, Chernavskaia O, Schmidt C. et al. Pseudo-HE images derived from CARS/TPEF/SHG multimodal imaging in combination with Raman-spectroscopy as a pathological screening tool. BMC Cancer. 2016;16:534
31. Kim B, Chung E, Kim KH, Lee KH, Lee S, Su WY. et al. Brain tumor delineation enhanced by moxifloxacin-based two-photon/CARS combined microscopy. Biomed Opt Express. 2017;8:2148-2161
32. Heuke S, Chernavskaia O, Bocklitz T, Legesse FB, Meyer T, Akimov D. et al. Multimodal nonlinear microscopy of head and neck carcinoma - toward surgery assisting frozen section analysis. Head Neck. 2016;38:1545-1552
33. Rodner E, Bocklitz T, von Eggeling F, Ernst G, Chernavskaia O, Popp J. et al. Fully convolutional networks in multimodal nonlinear microscopy images for automated detection of head and neck carcinoma: pilot study. Head Neck. 2019;41:116-121
34. Djuric U, Zadeh G, Aldape K, Diamandis P. Precision histology: how deep learning is poised to revitalize histomorphology for personalized cancer care. Npj Precis Oncol. 2017:1
35. Kermany DS, Goldbaum M, Cai WJ, Valentim CCS, Liang HY, Baxter SL. et al. Identifying medical diagnoses and treatable diseases by image-based deep learning. Cell. 2018;172:1122
36. Malon C, Miller M, Burger HC, Cosatto E, Graf HP. Identifying histological elements with convolutional neural networks. International Conference on Soft Computing As Transdisciplinary Science and Technology, ACM. 2008:450-456
37. Ertosun MG, Rubin DL. Automated grading of gliomas using deep learning in digital pathology images: A modular approach with ensemble of convolutional neural networks. AMIA Annu Symp Proc. 2015;2015:1899
38. Xu J, Luo X, Wang G, Gilmore H, Madabhushi A. A deep convolutional neural network for segmenting and classifying epithelial and stromal regions in histopathological images. Neurocomputing. 2016;191:214-223
39. Kainz P, Pfeiffer M, Urschler M. Semantic segmentation of colon glands with deep convolutional neural networks and total variation segmentation. Computer Science. 2017
40. Coudray N, Ocampo PS, Sakellaropoulos T, Narula N, Snuderl M, Fenyo D. et al. Classification and mutation prediction from non-small cell lung cancer histopathology images using deep learning. Nat Med. 2018;24:1559-1567
41. Gulshan V, Peng L, Coram M, Stumpe MC, Wu D, Narayanaswamy A. et al. Development and validation of a deep learning algorithm for detection of diabetic retinopathy in retinal fundus photographs. JAMA. 2016;316:2402-2410
42. Esteva A, Kuprel B, Novoa RA, Ko J, Swetter SM, Blau HM. et al. Dermatologist-level classification of skin cancer with deep neural networks. Nature. 2017;542:115-118
43. He KM, Zhang XY, Ren SQ, Sun J. Deep residual learning for image recognition. Proc Cvpr Ieee. 2016:770-778
44. He R, Xu Y, Zhang L, Ma S, Wang X, Ye D. et al. Dual-phase stimulated Raman scattering microscopy for real-time two-color imaging. Optica. 2017;4:44-47
45. Suhalim JL, Chung CY, Lilledahl MB, Lim RS, Levi M, Tromberg BJ. et al. Characterization of cholesterol crystals in atherosclerotic plaques using stimulated Raman scattering and second-harmonic generation microscopy. Biophys J. 2012;102:1988-1995
46. Wang Z, Huang Z. Simultaneous stimulated Raman scattering and higher harmonic generation imaging for liver disease diagnosis without labeling. Proceedings of SPIE. 2014;8948:2978-2982
47. Cohen J. A coefficient of agreement for nominal scales. Educ Psychol Meas. 1960;20:37-46
48. Mehta P, Bukov M, Wang CH, Day AGR, Richardson C, Fisher CK. et al. A high-bias, low-variance introduction to machine learning for physicists. Phys Rep. 2018
49. Taylor L, Nitschke G. Improving Deep Learning using Generic Data Augmentation. arXiv. 2017. 1708:06020
50. Krizhevsky A, Sutskever I, Hinton GE. ImageNet classification with deep convolutional neural networks. International Conference on Neural Information Processing Systems. 2012:1097-1105
51. James G, Witten D, Hastie T, Tibshirani R. An Introduction to Statistical Learning. Springer New York. 2013
Author contact
![]() Corresponding authors: zhengbinedu.cn, yanchen99edu.cn, minbiaojedu.cn
Corresponding authors: zhengbinedu.cn, yanchen99edu.cn, minbiaojedu.cn
Citation styles
APA
Zhang, L., Wu, Y., Zheng, B., Su, L., Chen, Y., Ma, S., Hu, Q., Zou, X., Yao, L., Yang, Y., Chen, L., Mao, Y., Chen, Y., Ji, M. (2019). Rapid histology of laryngeal squamous cell carcinoma with deep-learning based stimulated Raman scattering microscopy. Theranostics, 9(9), 2541-2554. https://doi.org/10.7150/thno.32655.
ACS
Zhang, L.; Wu, Y.; Zheng, B.; Su, L.; Chen, Y.; Ma, S.; Hu, Q.; Zou, X.; Yao, L.; Yang, Y.; Chen, L.; Mao, Y.; Chen, Y.; Ji, M. Rapid histology of laryngeal squamous cell carcinoma with deep-learning based stimulated Raman scattering microscopy. Theranostics 2019, 9 (9), 2541-2554. DOI: 10.7150/thno.32655.
NLM
Zhang L, Wu Y, Zheng B, Su L, Chen Y, Ma S, Hu Q, Zou X, Yao L, Yang Y, Chen L, Mao Y, Chen Y, Ji M. Rapid histology of laryngeal squamous cell carcinoma with deep-learning based stimulated Raman scattering microscopy. Theranostics 2019; 9(9):2541-2554. doi:10.7150/thno.32655. https://www.thno.org/v09p2541.htm
CSE
Zhang L, Wu Y, Zheng B, Su L, Chen Y, Ma S, Hu Q, Zou X, Yao L, Yang Y, Chen L, Mao Y, Chen Y, Ji M. 2019. Rapid histology of laryngeal squamous cell carcinoma with deep-learning based stimulated Raman scattering microscopy. Theranostics. 9(9):2541-2554.
This is an open access article distributed under the terms of the Creative Commons Attribution (CC BY-NC) license (https://creativecommons.org/licenses/by-nc/4.0/). See http://ivyspring.com/terms for full terms and conditions.