Impact Factor
- Issue 11; 2026
- Issue 10; 2026
- Issue 9; 2026
- Issue 8; 2026
- Issue 7; 2026
- Volume 16; 2026
- Advance Articles
- Past Issues
- Cover Images
- Cover Suggestion
- Index & Coverage
- Special Issues
Introduction
Methods
Results and discussion
Conclusions
Abbreviations
Supplementary Material
Acknowledgements
References
International Journal of Biological Sciences
International Journal of Medical Sciences
 Global reach, higher impact

Theranostics 2019; 9(10):2939-2949. doi:10.7150/thno.29232 This issue Cite
Research Paper
Highly sensitive quantification of Alzheimer's disease biomarkers by aptamer-assisted amplification
Hei-Nga Chan, Di Xu, See-Lok Ho, Dinggeng He, Man Shing Wong ![]() , Hung-Wing Li
, Hung-Wing Li ![]()
Department of Chemistry, Hong Kong Baptist University, Hong Kong, China
Received 2018-8-14; Accepted 2018-10-26; Published 2019-5-9
Abstract

Alzheimer's disease (AD), a chronic neurodegenerative disease associated with the loss of neurons in the brain, is the most pervasive type of dementia; 47 million people are affected, and the number is expected to increase to more than 131 million by 2050, according to Alzheimer's Disease International. Both early diagnosis and continuous monitoring are crucial for early intervention, symptomatic treatment, monitoring of the efficacy of intervention and improved patient function. Beta-amyloid peptide, tau, and phosphorylated tau are useful for screening and diagnosis; meanwhile, simultaneous assessment of multiple biomarkers is of paramount importance for accurate disease diagnosis.
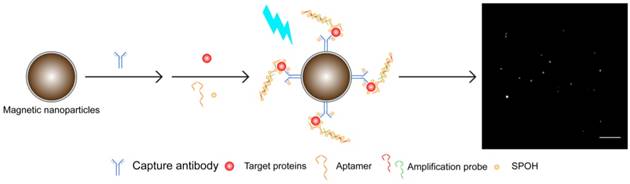
Methods: Herein, we report a direct, inexpensive and ultrasensitive aptamer-based multiplex assay for the quantification of trace amounts of AD biomarkers in both human serum and cerebrospinal fluid (CSF) samples. In this newly developed assay, molecular recognition of an antibody-aptamer pair provides high specificity in target detection, and the use of a DNA amplification strategy affords high sensitivity, allowing quantification of AD biomarkers in both biological fluids in 1.5 h with only a diminutive amount of the sample consumed. A tailor-made turn-on fluorophore, namely, SPOH, was employed to label the antibody-aptamer hybrids and provide a strong fluorescence signal, which was then detected with a total internal reflection fluorescence microscopy electron-multiplying charge-coupled device (TIRFM-EMCCD) imaging system. The simultaneous detection of biomarkers was achieved by a direct shape-coded method in which the nanoplatforms can be distinguished from one another by their morphologies.
Results: This assay demonstrated a lower detection limit (in the femtomolar range) for AD biomarkers than the previously reported antibody-antibody method.
Conclusion: The developed assay holds tremendous clinical potential for early diagnosis of AD and monitoring of its progression.
Keywords: Alzheimer's disease, antibody-aptamer hybrid immunoassay, turn-on fluorophore, magnetic nanoparticle
Introduction
Alzheimer's disease (AD), a progressive neurodegenerative disease, is the most common cause of dementia in the elderly, affecting approximately 5.7 million Americans in 2018 [1]. In recent decades, AD biomarkers have attracted tremendous attention in clinical diagnosis because they precede clinical symptoms by 10-15 years. Tau and beta-amyloid (Aβ), reflecting the key neuropathological hallmarks of AD pathology, are the most intensively studied molecular biomarkers. Compared to samples from healthy controls, cerebrospinal fluid (CSF) from AD patients shows a decreased level of Aβ42 and increased levels of total tau (t-tau) and tau phosphorylated at Thr181 (p-tau181). Currently, surface plasmon resonance, enzyme-linked immunosorbent assay (ELISA), and electrochemical methods have been reported for the detection of AD biomarkers [2-12]. However, they still have limitations in the form of moderate sensitivity, long incubation time, alteration of antibody or enzyme activity due to prelabeling with fluorophores, and, most importantly, a lack of multiplexing. A change in the level of any particular protein is not exclusive to AD. For example, decreases in Aβ42 can be found in other neurodegenerative diseases, including Parkinson's disease (PD), frontotemporal dementia (FTD), vascular dementia (VaD) and Lewy body dementia (LBD) [13]. Hence, the combined assessment of CSF Aβ42, t-tau and p-tau181 improves diagnostic accuracy, increasing demand for a simultaneous detection tool [14-16].
Simultaneous detection of a series of clinically relevant protein biomarkers is indispensable for clinical applications. However, the levels of different biomarkers may cover an expansive range; a biosensor for such markers requires not only high sensitivity but also a broad detection range [17]. For instance, the cut-off levels of Aβ42, t-tau and p-tau181 are 530 pg/mL (117.4 pM), 350 pg/mL (7.6 pM) and 80 pg/mL (1.7 pM) [18]. Hence, although many biosensors for specific biomarkers have been reported, the development of multiplex detection of AD biomarkers remains limited. Recently, several nanomaterial-based multiplex detection methods for AD biomarkers have been developed [19-22]. However, they provide qualitative rather than quantitative measurements, and their sensitivity is not yet adequate.
In response to the problem of sensitivity, an aptamer-based assay has been rapidly developed in the last few years [23]. Aptamers are single-stranded nucleic acids obtained through systematic evolution of ligands by exponential enrichment (SELEX), which involves multiple rounds of iterative selection and amplification of bound sequences [24]. The random sequences will fold into 3D structures with binding sites complementary to target proteins. To date, thousands of aptamers binding to specific targets including small organic molecules, small metal ions, proteins, peptides, surface proteins and other molecules on live cells, and live cells themselves, as well as bacteria and viruses, have been developed [25-28]. Aptamers have numerous advantages over antibodies, including higher or comparable target affinity, higher stability, and lower batch-to-batch variation, and lower manufacturing and shipping costs; most importantly, other technologies involving nucleic acid-based systems, such as DNA nanotechnology, DNA computing and amplification techniques, are also applicable to aptamers [29, 30].
We have previously reported multiplex biosensors based on different emission wavelengths of fluorophores on single magnetic immunocomplexes [31, 32]. In short, fluorescence images were first captured by a total internal reflection fluorescence microscopy electron-multiplying charge-coupled device (TIRFM-EMCCD) imaging system coupled with a transmission grating, and the emission spectra were resolved from the first-order images. The identities of the single light spots were correlated with the emission peak of the respective labeling fluorophores of the magnetic immunocomplexes.
Herein, to further improve on the previous detection assay, we report a direct and ultrasensitive multiplex assay using a hybrid antibody-aptamer sandwich immunoassay. Briefly, the target proteins are captured by the capture antibody-conjugated magnetic nanoplatform and aptamer, and the signal is further amplified by a pair of amplification probes. A tailor-made fluorophore, namely, SPOH, then labels the magnetic hybrids for visualization under a fluorescence imaging system. This assay is capable of achieving higher sensitivity than the antibody-antibody system in quantifying target analytes in both CSF and serum samples. Aβ42 and tau441 can be simultaneously recognized and detected using two magnetic probes with different morphologies. The results obtained by single and multiplex approaches were comparable to one another and were validated using ELISA.
Methods
Chemicals and reagents
A Tris-EDTA conjugation buffer (TE) was prepared by mixing 20 mM pH 8.0 Tris-HCl (Invitrogen) with 1 mM EDTA (Sigma) in distilled water, while Tris-NaCl-EDTA reaction buffer (TNE) was prepared by mixing 20 mM pH 8.0 Tris-HCl with 1 mM EDTA and 250 mM sodium chloride (Sigma) in distilled water. The pH of each buffer was adjusted to pH 7.4 with 1 M HCl. The buffer solutions were filtered through a 0.22 µm nylon membrane filter and autoclaved prior to use. The previously reported aptamers for both Aβ and tau species [33-35] were purchased from Invitrogen, along with the amplification probes am1 and am2. The aptamer for Aβ42 (Aβ P) was as follows: 5′-AGT CTA GGA TTC GGC GTG GGT TAA TTT TTT GCT GCC TGT GGT GTT GGG GCG GGT GCG-3′. The aptamer for tau441 and p-tau181 (tau P) was as follows: 5′-AGT CTA GGA TTC GGC GTG GGT TAA TTT TTT GCG GAG CGT GGC AGG-3′. The sequence of Am1 was as follows: 5′-TTT TTT TTA ACC CAC GCC GAA TCC TAG ACT CAA AGT AGT CTA GGA TTC GGC GTG-3′. The sequence of Am2 was as follows: 5′-AGT CTA GGA TTC GGC GTG GGT TAA CAC GCC GAA TCC TAG ACT ACT TTG TTT TTT-3′. All oligonucleotides were suspended in DEPC-treated water (Ambion) and diluted to appropriate concentrations with TNE buffer. The melting temperatures were predicted based on the nearest neighbor method. The following commercially available antibodies were purchased and used without further purification: 12F4 for Aβ42 (SIG-39142, Covance), BT2 for tau441 (MN1010, Thermo Scientific) and AT270 for p-tau181 (MN1050, Thermo Scientific). Human CSF and serum were purchased from PrecisionMed. Aβ42 and tau441 were purchased from rPeptide, and p-tau181 was purchased from Invitrogen.
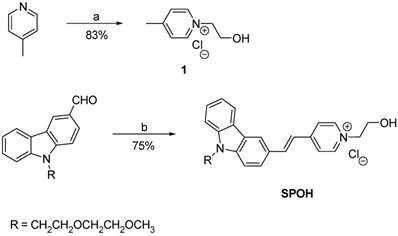
Synthesis of SPOH
For the synthesis of (E)-1-(2-hydroxyethyl)-4-(2-(9-(2-(2-methoxyethoxy)ethyl)-9H-carbazol-3-yl)vinyl)pyridin-1-ium chloride (SPOH), a solution of pyridinium salt 1 (0.13 g, 0.75 mmol), 9-(2-(2-methoxyethoxy)ethyl)-9H-carbazole-3-carbaldehyde (0.27 g, 0.9 mmol) and piperidine (0.1 mL) in ethanol (30 mL) was heated to reflux overnight. After cooling to room temperature, the organic solvent was removed by rotary evaporation. The residue was purified by recrystallization from methanol, producing SPOH (0.18 g) as a pale red solid at a 53% yield. 1H NMR (400 MHz, DMSO- d6) δ 8.88 (d, J = 6.8 Hz, 2H), 8.55 (s, 1H), 8.19 (m, 4H), 7.84 (d, J = 8 Hz, 1H), 7.65 (m, 2H), 7.49 (m, 2H), 7.25 (t, J = 7.2 Hz, 1H), 5.66 (s, 1H), 4.57 (m, 4H), 3.79 (m, 4H), 3.43 (m, 2H), 3.27 (m, 2H), 3.08 (s, 3H). 13C NMR (100 MHz, DMSO-d6) δ 153.4, 144.4, 142.4, 141.7, 140.8, 126.4, 126.3, 126.2, 122.7, 122.6, 122.1, 121.1, 120.3, 120.0, 119.7, 110.4, 110.2, 71.2, 69.8, 68.8, 61.6, 600.1, 58.1, 42.8. HRMS (MALDI-TOF) m/z calculated for C26H29N2O3 417.2172 found 417.2184 [M+].
Synthesis of SPOH. Reagents and conditions: a) MeCN, ClCH2CH2OH, reflux; b) 1, piperidine, EtOH, reflux.
Coverslip pretreatment and preparation of the flow cell
All the coverslips were prewashed prior to use. Briefly, No. 1 22-mm × 22-mm glass slides (Gold Seal, Electron Microscopy System) were successively sonicated for 10 min in household detergent, acetone, ethanol and distilled water. The slides were then soaked in piranha solution (H2SO4:H2O2) (v/v 3:1) for 30 min and sonicated for 30 min, then sonicated again in a solution of HCl:H2O:H2O2 (v/v 1:1:1) at 60 °C for 30 min and soaked in piranha solution for another 30 min, followed by sonication for 30 min. Between steps, all the slides were rinsed thoroughly with filtered H2O. The slides were stored in filtered water and blow-dried with nitrogen gas before use. A flow cell was prepared by combining the pretreated coverslips and the lower 22 mm × 32 mm coverslips with double-sided adhesive tape with a channel width of approximately 3 mm each.
Fabrication of iron oxide nanoparticles
The monodisperse iron oxide nanoparticles were fabricated by a solvothermal method as previously reported [36, 37]. Briefly, 1.5 g of FeCl3 was dissolved in 20 mL of ethylene glycol:diethylene glycol (v/v 1:1), followed by the addition of 1.5 g of anhydrous sodium acetate and 1 g of polyethylene glycol (MW 600) with vigorous stirring. The solution was then transferred into a 25 mL Teflon-lined stainless steel autoclave. The autoclave was heated to 210 °C for 2 h and then cooled to room temperature. The black particles were washed repeatedly with ethanol and filtered H2O.
Application of a silica coating to the iron oxide nanoparticles
The particles were sonicated with 0.1 M HCl for 10 min and rinsed thoroughly with filtered H2O. A silica coating was applied by adding the nanoparticles to a mixture of EtOH:H2O:NH3 (v/v 80:20:1) and then adding an ethanolic solution of TEOS (500 µL of TEOS in 5 mL of ethanol) under sonication. The resulting particles were washed twice with ethanol and H2O and resuspended in ethanol.
Fabrication of magnetic Janus rods
The iron oxide nanoparticles were coated with a thin layer of silica prior to the synthesis of Janus rods. Briefly, the nanoparticles were sonicated with 0.1 M HCl for 10 min and washed thoroughly with filtered H2O. The silica coating was applied by adding an ethanolic solution of TEOS (100 µL in 1.5 mL of EtOH) to a mixture of 48.4 mL of 32% NH4OH:H2O:EtOH (v/v/v 1:8:13) and 20 mg of washed magnetic nanoparticles under sonication. The reaction was completed in 3 h. The formed particles were centrifuged to discard excess reactants, washed with ethanol and water and redispersed in 30 mL of ethanol. The Janus rods were prepared via a wet-chemical method. Briefly, PVP (3 g) was dissolved in 1-hexanol (30 mL) by sonication for 2 h. Then, a mixture of 3 mL of the previously prepared nanoparticles, 840 µL of H2O, 200 µL of aqueous solution of 0.18 M sodium citrate, 675 µL of 32% NH4OH and 300 µL of TEOS were added to the mixture. After being gently shaken for 3 min, the solution was left undisturbed in an oven at 50 °C for 24 h. The product was centrifuged at 1500 ×g for 1 h, and the supernatant was discarded. The product was redispersed in ethanol, and the centrifugation was repeated at 1500 ×g for 15 min, 2 times with ethanol, 2 times with water and again with ethanol. Finally, the product was magnetically separated and washed with ethanol and redispersed in 1 mL of ethanol.
Preparation of the nanoprobes
The nanoprobes were prepared by conjugating the capture antibody with the nanoparticles. The nanoparticles were first amino-functionalized by APTES, and then conjugated with the capture antibody using the cross-linking reagent glutaraldehyde. Briefly, the nanoparticles were added to an ethanolic solution of APTES (APTES:particles, w/w 100:1) and stirred at 70 °C for 24 h. The resulting particles were washed with ethanol twice, then dispersed in 5% glutaraldehyde and stirred at room temperature for 1.5 h. Subsequently, the particles were washed twice with Tris-EDTA buffer (20 mM Tris-HCl, 1 mM EDTA, pH 7.4) (TE) and dispersed in TE solution. Then, an excess amount of capture antibody was incubated with the resulting particles at room temperature for 1.5 h. The antibody-conjugated nanoparticles were washed twice with Tris-NaCl-EDTA buffer (20 mM Tris-HCl, 250 mM NaCl, 1 mM EDTA, pH 7.4) (TNE) and redispersed in TNE solution.
Optimization of the working conditions of the detection assay
To determine the optimal amount of the nanoprobes, we incubated different concentrations of the nanoprobes (1, 10, 100, and 1000 µg/mL) with 1 pM Aβ42 and 20 pM Aβ P, am1 and am2, at 72 °C for 1.5 h and labeled them with 100 µM SPOH. To determine the optimal reaction time, we incubated 1 pM Aβ42 with the nanoprobes along with 20 pM Aβ P, am1 and am2 for 30, 60 and 90 min, respectively, and labeled the probes with 100 µM SPOH. In the interest of ensuring maximum coverage of the nanoprobes, nanoprobes, prepared by 4-, 40-, 80- and 400-fold dilutions of the stock antibody solution were labeled with 100 µM SPOH. The magnetic nanocomposites (MNCs) prepared by incubating the 1 pM Aβ42 with Aβ P, am1 and am2 were labeled with 1, 10, 100 and 250 µM of SPOH to determine the optimal concentration of SPOH. All of the abovementioned resulting MNCs were injected into the flow cell for imaging.
Quantification of the target protein
The calibration curve of the detection assay was constructed by correlating the average net intensity of 50 individual MNCs at each concentration of spiked protein biomarkers. Aβ42, tau441 and p-tau181 at different concentrations (0-1000 fM) were incubated with optimal amount of nanoprobes and 20 pM detection probe (Aβ P, Tau P), am1 and am2, respectively, at 72 °C for 1.5 h. The resulting MNCs were labeled with 100 µM SPOH and then flowed into the channel of the flow cell. Fluorescence images of the MNCs were captured by total internal reflection fluorescence microscopy (TIRFM) with an excitation wavelength of 488 nm.
Simultaneous quantification of the target proteins with 10% glycerol
To explore the feasibility of detection with a commercial fluorimeter, we incubated different concentrations of Aβ42 (0-1000 fM) with the optimal amounts of nanoprobes, Aβ P, am1 and am2 under the optimal conditions in a 10% glycerol-TNE solution at 72 °C for 1.5 h. The resultant MNCs were labeled with 100 μM SPOH, and the fluorescence spectra of the MNCs were recorded with a fluorescence spectrophotometer (PTI QM-4/2005).
Selectivity of the detection assay
To evaluate the selectivity of the detection assay, we prepared four samples: a mixture of Aβ42 nanoprobes and 20 pM Aβ P, am1 and am2, incubated with (i) 0 fM Aβ42, (ii) 250 fM Aβ40, (iii) 250 fM Aβ42, or (iv) a mixture of 250 fM Aβ40 and 250 fM Aβ42. The MNCs were then labeled with 100 µM SPOH and observed by TIRFM.
ELISA
INNOTEST β-Amyloid1-42, Phospho-tau(181P) and hTau Ag were purchased from Fujirebio (Belgium). The detection of Aβ42, t-tau and p-tau181 was performed in duplicate following the manufacturer's assay protocol. For the quantification of Aβ42, 25 μL of Aβ42 standards and CSF samples were added to the capture antibody-coated microwells, followed by 75 μL of biotinylated detection antibody. The mixtures were then incubated at room temperature for 1 h. The wells were emptied and washed five times with 1x wash solution. Then, 100 μL of peroxidase-labeled streptavidin was added to the wells and incubated at room temperature for 30 min. The wells were emptied and washed five times with 1x wash solution. Next, 100 μL of the TMB substrate was added to the wells and incubated in the dark at room temperature for 30 min. Finally, 50 μL of stop solution was added to each well, and the plate was shaken carefully for 1 min. The absorbance at 450 nm was recorded by a Benchmark Plus Microplate Reader. The quantification of t-tau was performed as follows: 25 μL of t-tau standards and CSF sample were added to the capture antibody-coated microwells, followed by 75 μL of biotinylated detection antibody. The mixtures were then incubated at room temperature for 16 h. The wells were emptied and washed five times with 1x wash solution. Then, 100 μL of peroxidase-labeled streptavidin was added to the wells and incubated at room temperature for 30 min. The wells were emptied and washed five times with 1x wash solution. Next, 100 μL of the TMB substrate was added to the wells and incubated in the dark at room temperature for 30 min. Finally, 50 μL of stop solution was added to each well, and the plate was shaken carefully for 1 min. The absorbance at 450 nm was recorded by a Benchmark Plus Microplate Reader. The level of p-tau was determined by the following approaches. In brief, 75 μL of t-tau standards and CSF sample were added to the capture antibody-coated microwells, followed by 25 μL of biotinylated detection antibody. The mixtures were then incubated at 4 °C for 16 h. The wells were emptied and washed five times with 1x wash solution. Then, 100 μL of peroxidase-labeled streptavidin was added to the wells and incubated at room temperature for 30 min. The wells were emptied and washed five times with 1x wash solution. Next, 100 μL of the TMB substrate was added to the wells and incubated in the dark at room temperature for 30 min. Finally, 50 μL of stop solution was added to each well, and the plate was shaken carefully for 1 min. The absorbance at 450 nm was recorded by a Benchmark Plus Microplate Reader.
Gel electrophoresis
To validate the formation of the hybrids between the aptamer probe and amplification probes, we prepared different samples including (i) a mixture of am1 and am2, (ii) Aβ P, a mixture of Aβ P, am1 and am2 in the (iii) absence and (iv) presence of Aβ42, (v) tau P, and a mixture of tau P, am1 and am2 in the (vi) absence and (vii) presence of tau441. In the gel electrophoresis assay, a sample containing 10 μL of each reaction sample and 2 μL of 6× loading buffer was subjected to an 8% nondenaturing polyacrylamide gel in 1× Tris-borate-EDTA buffer (TBE). After running at 180 V for 10 min, the gels were run at a constant voltage of 80 V for 2-3 h. After SYBR Green I staining, the gels were scanned using an Image Master VDS-CL (Amersham Biosciences).
Data analysis
Briefly, fluorescence images of 20 consecutive frames were acquired at different positions from the channel using the WinSpec/32 software provided by Princeton Instruments. All images were analyzed in ImageJ. The fluorescence signal from a single MNC was obtained by measuring the fluorescence intensity of 50 individual MNCs randomly. Net intensity = 1×1 square pixel of the MNCs - 1×1 square pixel of the corresponding background on the image. The average net intensity was obtained by averaging the net intensities of 50 individual MNCs.
Simultaneous detection of protein biomarkers
To achieve simultaneous detection, we prepared probes targeting Aβ42 and tau441 by conjugating magnetic nanorods and magnetic nanoparticles, respectively, with their corresponding capture antibodies. A mixture of these two probes was incubated with the target analytes, aptamers and amplification probes, followed by labeling with SPOH. The dye-labeled magnetic nanocomposites were then infused into the in-house flow cell. The fluorescence images were then acquired with a TIRFM-EMCCD imaging system.
Results and discussion
Detection scheme
A schematic illustration of the detection assay in the single approach is shown in Figure 1. The magnetic nanocomposites (MNCs) formed by the capture antibody-modified magnetic nanoparticles (MNPs-Ab), target proteins, aptamer and amplifier were labeled with the tailor-made fluorophore SPOH, which has absorption and emission maxima at 420 nm and 573 nm, respectively (Figure S1A). The labeled MNCs were then placed into a flow cell prepared with glass coverslips and driven from the bulk solution towards the cover slide/solution interface for TIRFM imaging. Fluorescence images of the MNCs were captured with a TIRFM-EMCCD system using a 488 nm cyan excitation laser.
The silica-coated iron oxide nanoparticles were prepared in two steps as previously reported: solvothermal synthesis of iron oxide nanoparticles and coating with silica by the sol-gel method [38]. TEM imaging demonstrated that the nanoparticles were spherical with an average diameter of 277 ± 8.8 nm (Figure S2). The positions and relative intensities of all diffraction peaks shown in the X-ray diffraction (XRD) spectra were ascribed to magnetite, Fe3O4 (Figure S1B). The powder sample was further analyzed by X-ray photoelectron spectroscopy (XPS), and the Fe2p3/2 peak and Fe2p1/2 peak were observed. The Fe2p3/2 peak is narrower and has a larger area than the Fe2p1/2 peak, which is in close agreement with the previous literature (Figure S1C) [39]. The resulting magnetic nanoparticles were well dispersed in solution and responded to a small bar magnet instantly.
First, gel electrophoresis was performed to validate the successful formation of wire-shaped DNA nanodevices (Figure S3). Lane 1, corresponding to the mixture of am1 and am2, exhibited no amplification event. Lane 3 showed ladder-shaped bands when Aβ P was present in the mixed solution of am1 and am2, indicating successful formation of DNA nanodevices with different molecular weights. The introduction of target Aβ42 had no effect on the formation of DNA nanodevices. Similarly, Figure S2 also demonstrated the tau P-triggered cascade hybridization reaction between am1 and am2 in the presence (lane 7) or absence (lane 6) of target tau441.
The sensitivity of the detection assay is heavily dependent on the fluorescence response of the turn-on fluorophore. In this assay, the signal output is induced by the amplified DNA assembly, which is fluorescently labeled. Here, compared with the previously employed fluorophores, SLAce and SIM, SPOH demonstrates the highest turn-on fluorescence enhancement (approximately 15-fold) once it binds to typical ds-DNA, λ-DNA. (Figure S4). This result suggests that SPOH would provide improved signal output for aptamer-based detection.
Schematic illustration of the detection assay for the direct quantification of target AD protein biomarkers. Scale bar of the TIRFM image = 10 μm.
Optimization of (A) concentration of capture antibody-conjugated probes, (B) concentration of fluorophore (SPOH), (C) concentration of capture antibody and (D) reaction time. Error bars, standard error of the mean; n = 3. Average net intensity = ((1×1 square pixel of 50 individual MNCs) - (1×1 square pixel of 50 individual background areas on the TIRFM images)) / 50.
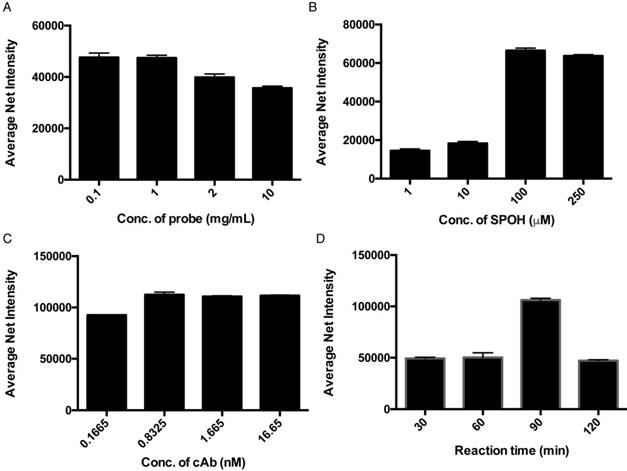
To achieve higher detection efficiency, we then investigated the effect of the dose of magnetic probes on the resulting signal. Although a higher concentration of the magnetic nanoparticle in the detection assay increases the capturing efficiency, the target proteins might also distribute themselves among individual magnetic nanoparticles, averaging out the fluorescence signal of each individual. An optimal concentration of the magnetic nanoparticles must attain a balance between capturing efficiency and signal output. Hence, the sensitivity of the assay can ultimately be improved. Figure 2A illustrates that the fluorescence signals detected with 0.1 and 1 mg/mL of magnetic nanoparticles were higher than those of 2 and 10 mg/mL, which agreed well with our anticipation that an extremely high concentration of the nanoparticle would average out the resulting fluorescence signal. To achieve highly sensitive detection of the target proteins without limiting the probability of the target molecules reaching the capture probe, we used 1 mg/mL of the magnetic nanoparticle for the rest of the experiment. To further improve the performance of the detection assay with regard to the concentration of the fluorophores, we examined the relationship between the average net intensity and the concentration of SPOH; the results are shown in Figure 2B. The net intensity of the MNCs was highly dependent on the concentration of SPOH used between 1 and 100 µM. Beyond 100 µM, the MNCs were saturated with the dye. This result suggests that the optimal concentration of SPOH is 100 µM. As shown in Figure 2C, the fluorescence signal of the nanoparticles is maximal when they are prepared by 0.8 nM of the capture antibody, implying that the capture antibody surface coverage on the nanoparticle was saturated. To investigate the optimal reaction time for the interactions of the target protein, capture antibody, aptamer and amplifier, we incubated the MNCs at 72 °C for 30, 60, 90 and 120 min. As depicted in Figure 2D, the net intensity was at its highest when the MNCs were incubated for 90 min and decreased afterwards, which implies that prolonged incubation may alter the conformation of the proteins or nucleic acids, thus affecting the binding of the probes and targets.
Calibration curve
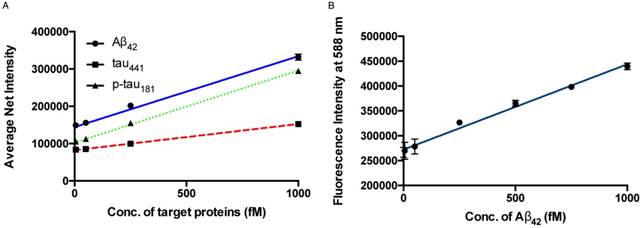
The sensitivity of the detection assay for the quantification of protein biomarkers was investigated by varying the concentration of the target proteins. Under the optimal conditions, a calibration curve of the average net intensity as a function of the concentration of the target proteins was constructed (Figure 3A). In brief, target proteins of different concentrations ranging from 0 to 1000 fM were incubated with 1 mg/mL MNPs-Ab and 20 pM of detection probe and amplifiers at 72 °C followed by labeling with SPOH. By measuring the fluorescence intensity of 50 individual MNCs as a function of the target protein concentration, as shown in Figure 3A, we generated a linear curve with good coefficients of determination, R2 = 0.9923, 0.9996 and 0.9981 for Aβ42, tau441 and p-tau181, respectively. The limits of detection for Aβ42, tau441 and p-tau181 were 8.4 fM (38 fg/mL), 4.3 fM (197 fg/mL) and 3.6 fM (165 fg/mL), respectively. With regard to the cut-off values of Aβ42, tau441 and p-tau181 (530, 350 and 80 pg/mL, respectively), the detection assay was able to quantify the target proteins directly from the untreated samples for clinical diagnosis. Compared with the previously reported methods, as summarized in Table S1, this newly developed assay was able to quantify the target proteins within 1.5 h with increased sensitivity. Moreover, the limits of detection for Aβ42, tau441 and p-tau181 were 23 fM (104 fg/mL), 14 fM (643 fg/mL) and 34 fM (1.56 pg/mL), respectively; thus, this assay enhanced sensitivity by 2- to 9-fold at one-third of the cost compared with our previously reported method [32].
(A) Calibration curve for the quantification of monomeric Aβ42, tau441 and p-tau181 using SPOH. The nanoprobes were incubated with different concentrations of target under optimal conditions. Error bars, standard error of the mean; n = 3. Average net intensity = ((1×1 square pixel of 50 individual MNCs) - (1×1 square pixel of 50 individual background area on the TIRFM images)) / 50. (B) Quantification of Aβ42 in human CSF samples in the presence of 10% glycerol by a spectrofluorimeter. A linear range of 0-1000 fM of Aβ42 and a detection limit of 143 fM were achieved. Error bars, standard deviation; n = 3.
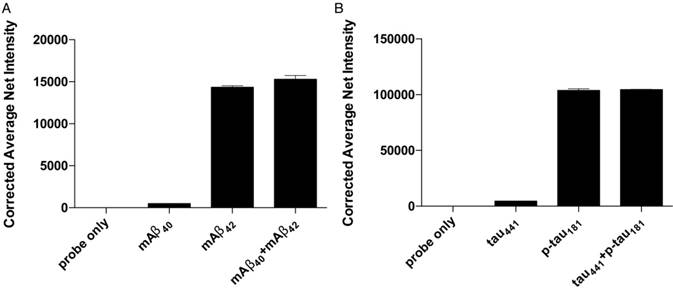
Selectivity of the detection assay for Aβ42 and p-tau181 nanoprobes. The nanoprobes were incubated with 0 fM of the target protein, 500 fM of similar protein and a mixture of 500 fM of each protein from the protein pairs. Error bars, standard error of mean; n = 3. Corrected average net intensity = average net intensity of the sample - average net intensity of the probe. Average net intensity = ((1×1 square pixel of 50 individual MNCs) - (1×1 square pixel of 50 individual background area on the TIRFM images)) / 50.
Specificity
The accuracy of the detection assay is significantly affected by the specificity of the MNPs-Ab. To assess the specificity of the assay, we incubated the probes for both Aβ42 and p-tau181 with their corresponding target proteins, homologous proteins Aβ40 and tau, and a mixture of target proteins and homologous proteins under optimal conditions. The differences in average net intensity caused by the presence of homologous proteins were 1.0% and 0.9% for Aβ, and 4.8% and 0.5% for tau (Figure 4). These differences were calculated as (difference in signal between sample and blank)/blank × 100% or (difference in signal between mixtures and target)/signal from target × 100%. There was a negligible change in the signal in the presence of homologous proteins, implying that such MNP-Abs are highly specific and can be differentiated from their homologous peptides.
Detection of target proteins in real samples
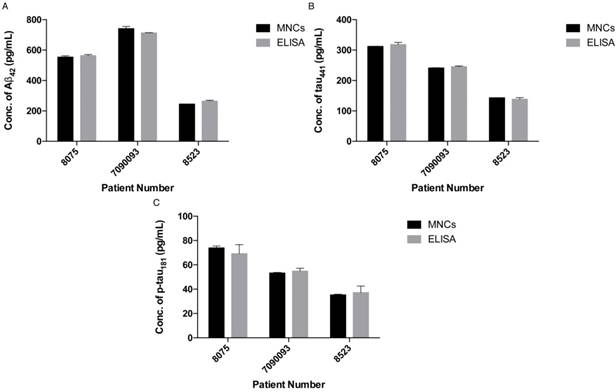
To demonstrate the feasibility of the assay for clinical diagnosis, the newly developed assay was applied to detect and quantify the target proteins in CSF and serum samples directly from healthy donors (donors #8523 and #7090093) and AD patients (donor #8075) by external calibration. As shown in Table 1, the CSF sample donated by an AD patient has a reduced concentration of Aβ42 and increased concentrations of tau441 and p-tau181, which supports a previous study showing that the level of Aβ42 decreases and those of tau441 and p-tau181 increase during the development of AD [40]. As illustrated in Figure 5, all of the results agreed very well with those determined using a commercially available ELISA kit. It is important to note that the expression profiles of Aβ42, tau441 and p-tau181 in the serum samples were different from those in the CSF samples. As demonstrated in Figure S5, the content of Aβ42 in serum samples is much lower than that in CSF samples, while tau441 and p-tau181 levels in both serum samples from AD patients and elderly donors are much lower than those in young controls.
Concentrations of 3 biomarkers in two types of biological fluids from 3 donors as determined by TIRFM.
| CSF samples | |||
|---|---|---|---|
| AD patient #8075 | Healthy donor #7090093 | Healthy donor #8523 | |
| Aβ42 | 553±8.4 | 741±14.3 | 245±0.3 |
| tau441 | 312±0.4 | 241±1.1 | 143±0.4 |
| p-tau181 | 74±1.5 | 53±0.5 | 35±0.6 |
| Serum samples | |||
| AD patient #8075 | Healthy donor #7090093 | Healthy donor #8523 | |
| Aβ42 | 230±3.0 | 262±2.2 | 133±1.3 |
| tau441 | 103±0.6 | 106±0.2 | 569±15.0 |
| p-tau181 | 26±0.4 | 34±0.4 | 90±1.5 |
Direct quantification of the biomarkers using a commercial fluorimeter
Having created an ultrasensitive detection assay, we sought to increase its throughput; thus, the feasibility of using a less sensitive commercially available spectrofluorimeter was explored. To further enhance the signal output of the SPOH fluorophore, we added a 10% glycerol solution to the final MNC solution. As illustrated in Figure 3B, a linear response with a limit of detection of 143 fM for Aβ42 was achieved using SPOH as the reporter for the MNCs. Hence, the detection assay was able to quantify the biomarkers in a general laboratory setting. The detection assay using the spectrofluorimeter was then applied to quantify the biomarkers in human CSF samples; the contents of Aβ42 were 536±48, 776±6 and 288±15 pg/mL for donors #8075, #7090093 and #8523, respectively, which was consistent with the results obtained using the ELISA kit (donors #8075, #7090093, and #8523: 564±30, 713±12 and 265±10 pg/mL, respectively).
Quantification of (A) Aβ42, (B) tau441 and (C) p-tau181 in human CSF samples using the developed assay (left) and a commercially available ELISA kit (right). Error bars, standard error of mean; n = 3. Average net intensity = ((1×1 square pixel of 50 individual MNCs) - (1×1 square pixel of 50 individual background area on the TIRFM images)) / 50.
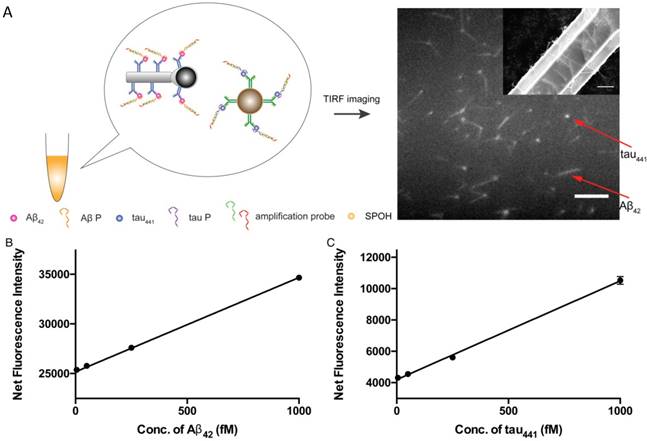
Simultaneous detection of protein biomarkers
Multiplex detection not only has the ability to improve the throughput of analysis but also minimizes sample consumption and analysis time. We employed two different nanoparticle morphologies, i.e., a rod shape and a spherical shape, in the assay. Different antibodies targeting different protein biomarkers were conjugated with the separate nanoplatforms (i.e., antibody for Aβ42 on the nanorods and tau441 antibody on the nanoparticles). These two probes were then incubated with both target proteins, Aβ P, tau P, am1 and am2, followed by fluorescent labeling. The fluorescently labeled hybrids were then visualized using TIRFM. The shape of the nanoplatforms visualized under TIRFM indicated the identity of the target proteins, in which nanorods indicated Aβ42 and round particles indicated tau441. Their respective fluorescence intensities indicated the quantities of the target protein molecules. Hence, direct and simultaneous quantification of AD biomarkers was successfully achieved by measuring the fluorescence intensity of each type of nanoplatform, as shown in Figure 6A. This multiplex approach is attractive because it requires only one excitation light source and one fluorophore compound. As illustrated in Figure 6B-C, a calibration curve of the average net intensity as a function of the concentration of the target proteins was established. Limits of detection of 15 and 4 fM with R2 = 0.9987 and 0.9989 were achieved for Aβ42 (rod-shaped) and tau441 (spherical), respectively. We further applied this simultaneous approach to quantify the biomarkers in human CSF samples. The Aβ42 levels in donors #8075, #7090093, and #8523 were 531±5, 740±15 and 267±2 pg/mL, respectively, while the levels of tau441 in these three donors were 318±15, 139±1 and 235±3 pg/mL, respectively. The results obtained by this approach were comparable to those obtained by ELISA, with relative percentage differences ranging from 0.3% to 6.2%.
Conclusions
In summary, we have developed a direct, inexpensive and highly sensitive aptamer-based multiplex detection assay for the quantification of AD protein biomarkers by employing a tailor-made turn-on fluorophore, SPOH, along with TIRFM. With the use of aptamers and a DNA-based amplification strategy, the limit of detection could be lowered by one order of magnitude, reaching 8.4, 4.3 and 3.6 fM for Aβ42, tau441 and p-tau181, respectively. This newly developed detection assay is simple and does not require prelabeling of the antibody or aptamer, and it can also differentiate the protein isoform Aβ42 from Aβ40 and the phosphorylated form from the nonphosphorylated form of tau proteins. Furthermore, it was successfully applied to quantify the target proteins in human CSF and serum samples, and the results were in close agreement with those obtained through ELISA. Furthermore, this novel assay is one-third the cost and affords 2- to 9-fold enhancement of sensitivity compared to the previously reported antibody-antibody method. Remarkably, different target proteins can be simultaneously detected with ease by taking advantage of the different shapes of the magnetic nanoplatforms assembled. Thus, this advanced and intelligently engineered assay has great potential as a practical tool for the prognosis and diagnosis of AD.
(A) Schematic illustration of the detection assay for the simultaneous quantification of Aβ42 and tau441. Scale bar of the TIRFM image = 10 µm. SEM image of the magnetic Janus rods; scale bar = 5 µm. Calibration curves for the quantification of (B) monomeric Aβ42 and (C) tau441 using SPOH. The nanoprobes were incubated simultaneously with different concentrations of target, corresponding aptamer probes, amplification probes and SPOH. Error bars, standard error of mean; n = 3. Average net intensity for Aβ42 = ((1×10 square pixels of 50 individual MNCs) - (1×10 square pixels of 50 individual background areas on the TIRFM images)) / 50. Average net intensity for tau441 = ((1×1 square pixel of 50 individual MNCs) - (1×1 square pixel of 50 individual background areas on the TIRFM images)) / 50.
Abbreviations
Aβ42: amyloid beta 1-42; Aβ P: detection probe for amyloid beta 1-42; AD: Alzheimer's disease; am1: amplification probe 1; am2: amplification probe 2; APTES: (3-aminopropyl)triethoxysilane; CSF: cerebrospinal fluid; ds-DNA: double-stranded DNA; EDTA: ethylenediaminetetraacetic acid; ELISA: enzyme-linked immunosorbent assay; MNCs: magnetic nanocomposites; MNPs-Ab: capture antibody-modified magnetic nanoparticles; p-tau181: tau phosphorylated at threonine 181; PVP: polyvinylpyrrolidone; SELEX: systematic evolution of ligands by exponential enrichment; SEM: scanning electron microscopy; TIRFM-EMCCD: total internal reflection fluorescence microscopy electron-multiplying charge-coupled device; t-tau: total tau; tau P: detection probe for tau; TBE: tris-borate-ethylenediaminetetraacetic acid buffer; TE: tris-ethylenediaminetetraacetic acid conjugation buffer; TEM: transmission electron microscopy; TEOS: tetraethoxysilane; TMB: 3,3′,5,5′-tetramethylbenzidine; TNE: tris-sodium chloride-ethylenediaminetetraacetic acid buffer reaction buffer.
Supplementary Material
Supplementary figures and tables.
Acknowledgements
This work is supported by the Collaborative Research Fund Scheme of the Hong Kong Research Grant Council (C2012-15G).
Competing Interests
The authors have declared that no competing interest exists.
References
1. Alzheimer'sAssociation. 2018 alzheimer's disease facts and figures. Alzheimers & Dementia. 2018;14:367-425
2. Kaushik A, Jayant RD, Tiwari S, Vashist A, Nair M. Nano-biosensors to detect beta-amyloid for alzheimer's disease management. Biosensors and Bioelectronics. 2016;80:273-87
3. Gagni P, Sola L, Cretich M, Chiari M. Development of a high-sensitivity immunoassay for amyloid-beta 1-42 using a silicon microarray platform. Biosensors and Bioelectronics. 2013;47:490-5
4. Yu Y, Zhang L, Li C, Sun X, Tang D, Shi G. A method for evaluating the level of soluble β-amyloid(1-40/1-42) in alzheimer's disease based on the binding of gelsolin to β-amyloid peptides. Angewandte Chemie International Edition. 2014;53:12832-5
5. Babic M, Vogrinc Z, Diana A, Klepac N, Borovecki F, Hof PR. et al. Comparison of two commercial enzyme-linked immunosorbent assays for cerebrospinal fluid measurement of amyloid beta(1-42) and total tau. Translational Neuroscience. 2013;4:234-40
6. Liu L, Zhao F, Ma F, Zhang L, Yang S, Xia N. Electrochemical detection of β-amyloid peptides on electrode covered with n-terminus-specific antibody based on electrocatalytic o2 reduction by aβ(1-16)-heme-modified gold nanoparticles. Biosensors and Bioelectronics. 2013;49:231-5
7. Oh J, Yoo G, Chang YW, Kim HJ, Jose J, Kim E. et al. A carbon nanotube metal semiconductor field effect transistor-based biosensor for detection of amyloid-beta in human serum. Biosensors and Bioelectronics. 2013;50:345-50
8. Rama EC, González-García MB, Costa-García A. Competitive electrochemical immunosensor for amyloid-beta 1-42 detection based on gold nanostructurated screen-printed carbon electrodes. Sensors and Actuators B: Chemical. 2014;201:567-71
9. Lee YK, Lee K-S, Kim WM, Sohn Y-S. Detection of amyloid-β42 using a waveguide-coupled bimetallic surface plasmon resonance sensor chip in the intensity measurement mode. PLOS ONE. 2014;9:e98992
10. Yu Y, Sun X, Tang D, Li C, Zhang L, Nie D. et al. Gelsolin bound β-amyloid peptides(1-40/1-42): Electrochemical evaluation of levels of soluble peptide associated with alzheimer's disease. Biosensors and Bioelectronics. 2015;68:115-21
11. Demeritte T, Viraka Nellore BP, Kanchanapally R, Sinha SS, Pramanik A, Chavva SR. et al. Hybrid graphene oxide based plasmonic-magnetic multifunctional nanoplatform for selective separation and label-free identification of alzheimer's disease biomarkers. ACS Applied Materials & Interfaces. 2015;7:13693-700
12. Vestergaard Md, Kerman K, Saito M, Nagatani N, Takamura Y, Tamiya E. A rapid label-free electrochemical detection and kinetic study of alzheimer's amyloid beta aggregation. Journal of the American Chemical Society. 2005;127:11892-3
13. Hampel H, Mitchell A, Blennow K, Frank RA, Brettschneider S, Weller L. et al. Core biological marker candidates of alzheimer's disease - perspectives for diagnosis, prediction of outcome and reflection of biological activity. Journal of Neural Transmission. 2004;111:247-72
14. Forlenza OV, Radanovic M, Talib LL, Aprahamian I, Diniz BS, Zetterberg H. et al. Cerebrospinal fluid biomarkers in alzheimer's disease: Diagnostic accuracy and prediction of dementia. Alzheimer's & Dementia: Diagnosis, Assessment & Disease Monitoring. 2015;1:455-63
15. Maddalena A, Papassotiropoulos A, Muller-Tillmanns B, Jung HH, Hegi T, Nitsch RM. et al. Biochemical diagnosis of alzheimer disease by measuring the cerebrospinal fluid ratio of phosphorylated tau protein to beta-amyloid peptide(42). Archives of Neurology. 2003;60:1202-6
16. Mo JA, Lim JH, Sul AR, Lee M, Youn YC, Kim HJ. Cerebrospinal fluid beta-amyloid(1-42) levels in the differential diagnosis of alzheimer's disease-systematic review and meta-analysis. Plos One. 2015:10
17. Chang H, Kang H, Ko E, Jun B-H, Lee H-Y, Lee Y-S. et al. Psa detection with femtomolar sensitivity and a broad dynamic range using sers nanoprobes and an area-scanning method. ACS Sensors. 2016;1:645-9
18. Kern S, Zetterberg H, Kern J, Zettergren A, Waern M, Hoglund K. et al. Prevalence of preclinical alzheimer disease comparison of current classification systems. Neurology. 2018;90:E1682-E1691
19. Miller BB, Mandell JW. Multiplex method for measuring biomarkers of alzheimer disease in cerebrospinal fluid. Clinical Chemistry. 2005;51:289-90
20. Kruse N, Schlossmacher MG, Schulz-Schaeffer WJ, Vanmechelen E, Vanderstichele H, El-Agnaf OM. et al. A first tetraplex assay for the simultaneous quantification of total α-synuclein, tau, β-amyloid42 and dj-1 in human cerebrospinal fluid. PLOS ONE. 2016;11:e0153564
21. Kim H, Lee JU, Song S, Kim S, Sim SJ. A shape-code nanoplasmonic biosensor for multiplex detection of alzheimer's disease biomarkers. Biosensors and Bioelectronics. 2018;101:96-102
22. Song C, Deng P, Que L. Rapid multiplexed detection of beta-amyloid and total-tau as biomarkers for alzheimer's disease in cerebrospinal fluid. Nanomedicine: Nanotechnology Biology and Medicine. 2018;14:1845-52
23. Song SP, Wang LH, Li J, Zhao JL, Fan CH. Aptamer-based biosensors. Trends in Analytical Chemistry. 2008;27:108-17
24. Chen C, Zhou S, Cai YQ, Tang FQ. Nucleic acid aptamer application in diagnosis and therapy of colorectal cancer based on cell-selex technology. Npj Precision Oncology. 2017;1:Article number: 37
25. Zhou J, Rossi J. Aptamers as targeted therapeutics: Current potential and challenges. Nature Reviews Drug Discovery. 2016;16:181
26. Feng SL, Chen CT, Wang W, Que L. An aptamer nanopore-enabled microsensor for detection of theophylline. Biosensors and Bioelectronics. 2018;105:36-41
27. Umrao S, Jain V, Anusha, Chakraborty B, Roy R. Protein-induced fluorescence enhancement as aptamer sensing mechanism for thrombin detection. Sensors and Actuators B: Chemical. 2018;267:294-301
28. Saraf N, Woods ER, Peppler M, Seal S. Highly selective aptamer based organic electrochemical biosensor with pico-level detection. Biosensors and Bioelectronics. 2018;117:40-6
29. Dunn MR, Jimenez RM, Chaput JC. Analysis of aptamer discovery and technology. Nature Reviews Chemistry. 2017;1:0076
30. Sun HG, Zu Y. Aptamers and their applications in nanomedicine. Small. 2015;11:2352-64
31. Ho SL, Xu D, Wong MS, Li HW. Direct and multiplex quantification of protein biomarkers in serum samples using an immuno-magnetic platform. Chemical Science. 2016;7:2695-700
32. Chan HN, Xu D, Ho SL, Wong MS, Li HW. Ultra-sensitive detection of protein biomarkers for diagnosis of alzheimer's disease. Chemical Science. 2017;8:4012-8
33. Kim S, Wark AW, Lee HJ. Femtomolar detection of tau proteins in undiluted plasma using surface plasmon resonance. Analytical Chemistry. 2016;88:7793-9
34. Zhu L, Zhang J, Wang F, Wang Y, Lu L, Feng C. et al. Selective amyloid β oligomer assay based on abasic site-containing molecular beacon and enzyme-free amplification. Biosensors and Bioelectronics. 2016;78:206-12
35. M. KS, Michael M, Razvan N, Yingfu L, Gloria L, N. KS. Tau protein binds single-stranded DNA sequence specifically - the proof obtained in vitro with non-equilibrium capillary electrophoresis of equilibrium mixtures. FEBS Letters. 2005;579:1371-5
36. Zhao B, Zhou H, Liu C, Long Y, Yang G, Tung C-H. et al. Fabrication and directed assembly of magnetic janus rods. New Journal of Chemistry. 2016;40:6541-5
37. Kuijk A, van Blaaderen A, Imhof A. Synthesis of monodisperse, rodlike silica colloids with tunable aspect ratio. Journal of the American Chemical Society. 2011;133:2346-9
38. Qian J, Xu D, Ho SL, Wang K, Wong MS, Li HW. Magnetically controlled immunosensor for highly sensitive detection of carcinoembryonic antigen based on an efficient "turn-on" cyanine fluorophore. Sensors and Actuators B: Chemical. 2018;258:133-40
39. Radu T, Iacovita C, Benea D, Turcu R. X-ray photoelectron spectroscopic characterization of iron oxide nanoparticles. Applied Surface Science. 2017;405:337-43
40. Sunderland T, Linker G, Mirza N, Putnam KT, Friedman DL, Kimmel LH. et al. Decreased beta-amyloid(1-42) and increased tau levels in cerebrospinal fluid of patients with alzheimer disease. Journal of the American Medical Association. 2003;289:2094-103
Author contact
![]() Corresponding author: Hung-Wing Li (hwliedu.hk); Man Shing Wong (mswongedu.hk)
Corresponding author: Hung-Wing Li (hwliedu.hk); Man Shing Wong (mswongedu.hk)