Theranostics
13.3
Impact Factor
- Current Issue
- Advance Articles
- Volume 16; 2026
- Volume 15; 2025
- Volume 14; 2024
- Volume 13; 2023
- Volume 12; 2022
- Archive
- Cover Images
- Cover Suggestion
- Special Issues
Top
Introduction
Results and Discussion
Conclusions
Methods
Abbreviations
Supplementary Material
Acknowledgements
References
Introduction
Results and Discussion
Conclusions
Methods
Abbreviations
Supplementary Material
Acknowledgements
References
International Journal of Biological Sciences
International Journal of Medical Sciences
 Global reach, higher impact

Theranostics 2019; 9(11):3293-3307. doi:10.7150/thno.32867 This issue Cite
Research Paper
Ferroptosis Promotes Photodynamic Therapy: Supramolecular Photosensitizer-Inducer Nanodrug for Enhanced Cancer Treatment
Ting Zhu1,2,3#, Leilei Shi4#, Chunyang Yu4, Yabing Dong5, Feng Qiu1,2,3,6, Lingyue Shen1,2,3, Qiuhui Qian4, Guoyu Zhou1,2,3 ![]() , Xinyuan Zhu4
, Xinyuan Zhu4 ![]()
1. Department of Oral and Maxillofacial-Head Neck Oncology, Department of Laser and Aesthetic Medicine, Shanghai Ninth People's Hospital, College of Stomatology, Shanghai Jiao Tong University School of Medicine, Shanghai 200011, China.
2. National Clinical Research Center for Oral Diseases, Shanghai 200011, China.
3. Shanghai Key Laboratory of Stomatology & Shanghai Research Institute of Stomatology, Shanghai 200011, China.
4. School of Chemistry and Chemical Engineering, Shanghai Key Laboratory for Molecular Engineering of Chiral Drugs, Shanghai Jiao Tong University, Shanghai 200240, China.
5. Department of Dermatology, Huashan Hospital, Fudan University, Shanghai 200040, China.
6. School of Chemical and Environmental Engineering, Shanghai Institute of Technology, Shanghai 201418, China.
#These authors contributed equally to this work.
Received 2019-1-6; Accepted 2019-3-22; Published 2019-5-18
Citation:
Zhu T, Shi L, Yu C, Dong Y, Qiu F, Shen L, Qian Q, Zhou G, Zhu X. Ferroptosis Promotes Photodynamic Therapy: Supramolecular Photosensitizer-Inducer Nanodrug for Enhanced Cancer Treatment. Theranostics 2019; 9(11):3293-3307. doi:10.7150/thno.32867. https://www.thno.org/v09p3293.htm
Other stylesAbstract

The noninvasive nature of photodynamic therapy (PDT) enables the preservation of organ function in cancer patients. However, PDT is impeded by hypoxia in the tumor microenvironment (TME) caused by high intracellular oxygen (O2) consumption and distorted tumor blood vessels. Therefore, increasing oxygen generation in the TME would be a promising methodology for enhancing PDT. Herein, we proposed a concept of ferroptosis-promoted PDT based on the biochemical characteristics of cellular ferroptosis, which improved the PDT efficacy significantly by producing reactive oxygen species (ROS) and supplying O2 sustainably through the Fenton reaction. In contrast to traditional strategies that increase O2 based on decomposition of limited concentration of hydrogen peroxide (H2O2), our methodology could maintain the concentration of H2O2 and O2 through the Fenton reaction.
Methods: For its association with sensitivity to ferroptosis, solute carrier family 7 member 11 (SLC7A11) expression was characterized by bioinformatics analysis and immunohistochemistry of oral tongue squamous cell carcinoma (OTSCC) specimens. Afterwards, the photosensitizer chlorin e6 (Ce6) and the ferroptosis inducer erastin were self-assembled into a novel supramolecular Ce6-erastin nanodrug through hydrogen bonding and π-π stacking. Then, the obtained Ce6-erastin was extensively characterized and its anti-tumor efficacy towards OTSCC was evaluated both in vitro and in vivo.
Results: SLC7A11 expression is found to be upregulated in OTSCC, which is a potential target for ferroptosis-mediated OTSCC treatment. Ce6-erastin nanoparticles exhibited low cytotoxicity to normal tissues. More significantly, The over-accumulated intracellular ROS, increased O2 concentration and inhibited SLC7A11 expression lead to enhanced toxicity to CAL-27 cells and satisfactory antitumor effects to xenograft tumour mouse model upon irradiation.
Conclusion: Our ferroptosis promoted PDT approach markedly enhances anticancer actions by relieving hypoxia and promoting ROS production, thereby our work provides a new approach for overcoming hypoxia-associated resistance of PDT in cancer treatment.
Keywords: photodynamic therapy, ferroptosis, Fenton reaction, carrier free, nanodrug
Introduction
Surgery, chemotherapy and radiation are the most common strategies in traditional cancer therapy. However, dysfunction caused by these treatments has a considerable impact on life quality. Photodynamic therapy (PDT) is an increasingly important therapeutic modality with spatiotemporal selectivity for the treatment of cancer and other diseases. The noninvasive nature of PDT enables maximal preservation of tissue functions. PDT involves the delivery of photosensitizers to the tumor site and subsequent irradiation with certain wavelengths of light to switch on the photochemical reaction. Cytotoxic reactive oxygen species (ROS) produced during PDT can destroy intracellular biomacromolecules through oxidative stress. However, the clinical application of PDT is limited dramatically by hypoxia in the tumor microenvironment (TME) caused by intracellular high oxygen consumption and distorted tumor blood vessels, resulting in low ROS production [1-4]. The majority of efforts to overcome hypoxia have focused on increasing O2 generation efficiency to relieve the hypoxic TME [5-8]. Several catalytic agents that could decompose endogenous hydrogen peroxide (H2O2) or glucose into O2 were developed for O2 supplements in PDT [9-12]. However, intracellular H2O2 is quite limited and difficult to sustainable supplement. In addition, the decomposition of glucose still requires O2, which restricts O2 self-delivery during PDT [10]. Therefore, it is highly desirable to create a strategy for sustainable supplement of O2 for PDT.
Ferroptosis, a recently identified form of regulated cell death, can result in the overproduction of lipid-based ROS via the inhibition of system xc- and the biosynthesis of glutathione (GSH) [11-14]. Another unique property of ferroptosis is that the cellular labile iron pool (LIP) is increased during ferroptosis and the Fenton reaction between H2O2 and ferric ion can produce O2 in a sustained manner [15-19]. Emerging strategies based on ferroptosis have been developed for cancer therapy [18, 20, 21]. It is well known that how to increase the concentration of ROS and O2 in TME is an important bottleneck for PDT. Fortunately, the aforementioned characteristics inside the ferroptosis cells are exactly necessary for promoting PDT. Therefore, we imagined that if ferroptosis could be combined with PDT, the efficacy of PDT could be dramatically improved. Herein, we proposed a novel concept of ferroptosis-promoted PDT. It is noted that a small molecular ferroptosis inducer erastin and a photosensitizer chlorin e6 (Ce6) contain quinazoline and porphine, respectively. Therefore, we inferred that erastin and Ce6 could be self-assembled into nanodrug via hydrogen bonding and π-π interactions. As illustrated in Scheme 1, a carrier-free nanodrug containing erastin and Ce6 was constructed via supramolecular interaction, named as Ce6-erastin. After being uptake by tumor cells, erastin-induced ferroptosis resulted in the accumulation of lipid-based ROS and increased O2 concentration via the Fenton reaction. Upon light irradiation, the sustainable O2 generation could guarantee efficient photochemical reaction to generate increased levels of ROS and result in oxidative damage to the cellular constituents. This strategy enables the combination of ferroptosis and PDT in a supramolecular self-assembled nanostructure to promote PDT in tumor site.
Results and Discussion
Oral tongue squamous cell carcinoma (OTSCC) appears to be an aggressive subgroup of cancer with strong invasion and metastasis ability [22]. As tongue plays an important role in pronunciation, shallowing and digestion, the function-sparing effects of PDT make it a valuable therapeutic option for OTSCC treatments. To determine whether OTSCC is sensitive to ferroptosis, we assessed the expression of Solute Carrier Family 7 Member 11 (SLC7A11) by bioinformatics analysis and immunohistochemical staining. The high proliferation rate of cancer cells increases their dependence on nutrients such as glucose, glutamine and cystine [23]. System xc- is the glutamate/cysteine antiporter, which is involved in GSH synthesis and plays a key role in cellular redox regulation. Erastin induces ferroptosis by inhibiting the import of cysteine via system xc-, leading to GSH depletion and passivation of the glutathione peroxidase 4 (GPX4), which results in overwhelming lipid-ROS (Figure 1A) [11, 24]. SLC7A11, a subunit of system xc-, is reported to overexpress and correlate with malignancy and progression in a variety of human carcinomas [25, 26]. The overexpression of SLC7A11 is relevant to cell death induced by various conditions, such as oxidative stress and glucose starvation strategies [27-33]. Bioinformatics analysis was conducted through published profiles in the ONCOMINE database. SLC7A11 expression is found to be upregulated across different cancer types (Figure S1). Furthermore, SLC7A11 mRNA expression is significantly higher in OTSCC than in normal samples. In the data set of Ye's group [34], SLC7A11 transcripts are 3.960-fold upregulated in OTSCC samples (26 cases) compared with adjacent normal tissue samples (12 cases) (p < 0.001, Figure 1B). To determine the expression of SLC7A11 in clinical OTSCC specimens, OTSCC tumor tissues and adjacent non-tumor tongue tissues were analyzed by immunohistochemistry (IHC). In contrast to the adjacent non-tumor tongue tissue, SLC7A11 is overexpressed in OTSCC specimens (Figure 1C). Based on these results, SLC7A11 may be a potential target for ferroptosis-mediated OTSCC treatment.
Scheme 1
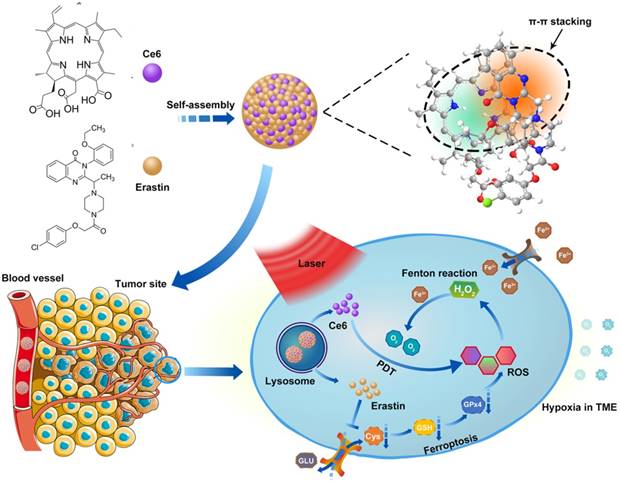
Schematic illustration of the construction of Ce6-erastin nanoparticles and mechanistic study. The nanoparticles were first internalized by cells and then disassembled in lysosomes. Under irradiation, Ce6 and erastin produced ROS by PDT and ferroptosis, respectively. At the same time, H2O2 and increased intracellular ferric ions produced O2 through the Fenton reaction to remedy the loss by PDT consumption.
Figure 1
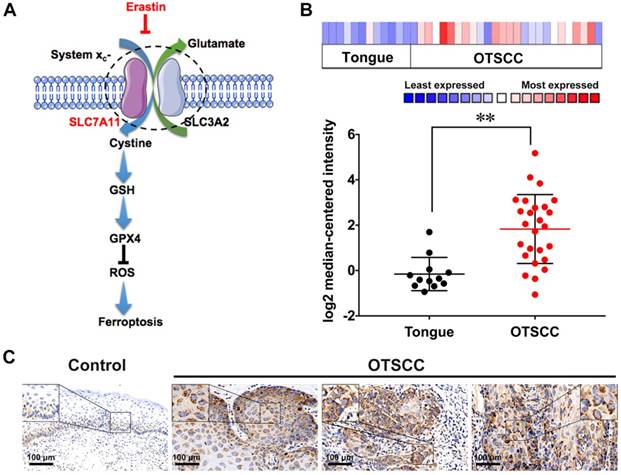
SLC7A11 expression in OTSCC. (A) Illustration of erastin-induced ferroptosis by the suppression of system xc-. (B) SLC7A11 expression was frequently upregulated in 26 OTSCC tissues (OTSCC) compared with 12 adjacent normal tongue samples (Tongue) in ONCOMINE profile. The statistical significance level is *p<0.05, **p<0.01. (C) Representative images of SLC7A11 expression in normal tongue tissue and OTSCC tissues. Scales represent 100 μm.
Figure 2
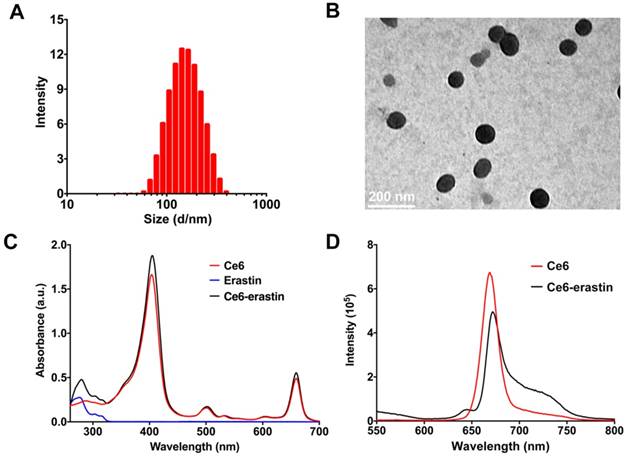
Characterization of Ce6-erastin in deionized water. (A) Representative DLS measurement of Ce6-erastin in an aqueous environment. (B) Representative TEM image of Ce6-erastin. (C) UV spectra of the Ce6-erastin aqueous solution. (D) Fluorescent spectra of Ce6-erastin aqueous solution.
Ce6-erastin was assembled into nanoparticles via supramolecular interaction. Ce6 and erastin were first dissolved in dimethylsulfoxide (DMSO) and added dropwise into phosphate buffer solution (PBS). After stirring for 30 min, the mixture was well dispersed by ultrasonic concussion for another 30 min. The free drugs and DMSO could be removed through ultrafiltration. Here, the feed ratio of erastin and Ce6 in drug-drug delivery system (DDDS) was 1:1, and the resulting drug loading content (DLC) for erastin and Ce6 was 70.2% and 29.8%, respectively. Both dynamic light scattering (DLS) and transmission electron microscopy (TEM) measurements were used to clarify the aggregation behavior of this nanoparticle at a concentration of 1 mg mL-1. The DLS in Figure 2A gives a monodisperse distribution of Ce6-erastin nanoparticles with an average diameter of 150 ± 50 nm. The size and morphology of Ce6-erastin revealed by TEM imaging also shows spherical micelles with a size of 100 ± 20 nm (Figure 2B), which is slightly smaller than the size obtained by DLS, probably due to the swelling of nanoparticles in the hydrated state. Ce6-erastin nanoparticles of this size are appropriate for biological application [35]. We further investigate the stability of the nanoparticles in aqueous phase, DLS measurements were carried out for seven consecutive days. The results demonstrate that the nanoparticles would remain relative stable in PBS and serum-containing DMEM medium at 37 °C during 7 days(Figure S2).
To understand the self-assembly mechanism of Ce6-erastin nanoparticles, various analyses were carried out to examine the intermolecular interactions between Ce6 and erastin. In the UV-vis spectra (Figure 2C), Ce6 exhibits the maximum absorption peak (λmax, Soret band) at 400 nm as well as two small peaks at 502 nm and 657 nm. Upon the formation of nanoparticles with erastin, the λmax of Ce6-erastin appears at approximately 405 nm, exhibiting a bathochromic shift (5 nm) with respect to free Ce6. This phenomenon manifests the J-aggregation of the hydrophobic aromatic ring arising from π-π stacking between Ce6 and erastin. Accordingly, the fluorescence spectrum of Ce6-erastin also exhibits a weak redshift in comparison with that of free Ce6, with a peak at 670 nm, further indicating the emergence of π-π stacking (Figure 2D). Variable-temperature 1H nuclear magnetic resonance (NMR) analysis was used to verify the hydrogen bonding interaction between Ce6 and erastin in a mixed solvent of deuterated tetrachloroethane and deuterated dimethyl sulfoxide (v:v = 5:1). In Figure S3, the proton signal at δ = 2.9 ppm is attributed to the proton of the CH2 group in Ce6 or erastin, which gradually shifts upfield to 2.6 ppm when the temperature varies from 25 °C to 55 °C. This change in the 1H NMR spectra is caused by the deformation of the hydrogen bond. Due to the reversible nature of the hydrogen bond interaction, the original 1H NMR spectrum is recovered upon cooling to room temperature. In addition, the variable-temperature Fourier transform infrared spectroscopy (FTIR) shows a wide stretching vibration peak of the C=O group at low temperature (~ 25 °C) in the range of 1600-1720 cm-1, which indicates that carbonyl groups form strong hydrogen bonds in Ce6-erastin (Figure S4). When the temperature increases from 25 to 55 °C, the C=O group peak gradually becomes sharper and narrower. These results of variable-temperature FTIR clearly demonstrate that hydrogen bonds do exist in the supramolecular self-assembly of Ce6 and erastin. To investigate the formation activity of Ce6-erastin in water, the Critical Aggregation Concentration (CAC) was carried out by using DPH as a UV probe. The UV absorbance at 313 nm increases with increasing concentration of Ce6-erastin solution. The UV absorbance curve shows a inflection point when the Ce6-erastin concentration is 7.94 μg mL-1, which demonstrates that the Ce6-erastin nanoparticles possess steric stabilization (Figure S5).
To estimate the potential of Ce6-erastin nanoparticles as anticancer agents, the in vitro drug release behaviors of Ce6-erastin nanoparticles in PBS at pH 7.4 (with and without 10% FBS) and in acetate buffer at pH 5.0 were investigated at 37 °C to simulate different intracellular environments. The amount of dissociated Ce6 was measured by UV-vis at scheduled time intervals. As shown in Figure S6, the release profile of Ce6 exhibited a rapid release in the first 4 h in all three conditions, mainly related to the concentration gradient between nanoparticles and buffer solution. In the neutral environment with or without FBS, a slower Ce6 release was sustained over a prolonged time, and the cumulative release was less than 50% in 48 h, indicating the relative stability of Ce6-erastin nanoparticles in normal physiological conditions. In contrast, the release of Ce6 in acidic conditions was much faster than that in neutral conditions, and over 80% of the Ce6 was released within 48 h. This result demonstrated that accelerated drug release from Ce6-erastin nanoparticles could be achieved by cleaving the weak supramolecular interactions (H-bond and π-π stacking) between Ce6 and erastin in a low pH environment.
To explore the detailed self-assembly process for nanoparticle formation, a coarse-grained molecular dynamics (CGMD) simulation was performed. Figure 3A shows the coarse-grain mapping scheme. Figure 3B-G indicates snapshots of the self-assembly course at different time intervals of the Ce6 and erastin in solution through CGMD simulations. Proceeding from a random state (Figure 3B), the mixtures of Ce6 and erastin quickly assemble into a collection of small compound micelles (Figure 3C). Subsequently, these small micelles progressively fuse to develop medium sized micelles (Figure 3D-F), finally fusing into one large complex nanoparticle (Figure 3G). Furthermore, the self-assembly morphology of the nanoparticle (Figure 3H) shows that the strong hydrophilic segments (carboxylic acid group) of Ce6 are mainly distributed on the outside surface of the micelle while the other segments form the micelle core. Meanwhile, two kinds of microphase domains was found in the micelle core. One is formed between the apolar groups through hydrophobic and π-π interactions; the other is formed between the nonpolar groups through the hydrogen bonding interactions.
Prior to using Ce6-erastin for antitumor application, the cellular uptake of these nanoparticles by CAL-27 cells was monitored by flow cytometry (FCM) and confocal laser scanning microscopy (CLSM). As illustrated in Figure 4A, the FCM analysis shows that the fluorescence signal is significant after 1 h of incubation with Ce6-erastin. The fluorescence intensity of Ce6 obtained increases with incubation time, demonstrating the successful cellular internalization of Ce6-erastin nanoparticles by CAL-27 cells. The endocytosis of Ce6-erastin nanoparticles was also evaluated by CLSM. As shown in Figure 4B, the red fluorescence of Ce6 remains mostly in the cytoplasm of cells when the cells are cultured with Ce6-erastin, which indicates the successful internalization of nanoparticles into the cells. The brightness of Ce6 fluorescence in nanoparticle-associated CAL-27 cells increases in a time-dependent manner, which is in conformity to the results obtained from FCM. In addition, the cell internalization behavior of Ce6-erastin nanoparticles in CAL-27 cells was investigated via the intracellular trafficking of as-prepared nanoparticles (red) and commercial LysoTracker (Alexa Fluor® 488 Phalloidin, Green). After the incubation of CAL-27 cells with both the nanoparticles and LysoTracker for 4 h, an orange color is observed clearly in the cytoplasmic regions of stained cells due to an overlap of green and red fluorescence (Figure S7). These results show that Ce6-erastin nanoparticles are located in the lysosome, which is promising for the degradation of Ce6-erastin nanoparticles in tumor cells.
Less dark cytotoxicity and excellent PDT-induced cytotoxicity are the essential properties of a photosensitizer. The in vitro dark cytotoxicity of the as-prepared materials toward CAL-27 cells was evaluated by the MTT assay. Figure S8 demonstrates the cell viabilities after incubation with erastin, Ce6 and Ce6-erastin. The results show that after pretreatment with each formulation for 48 h, the CAL-27 cell viability remains above 82.9% compared with the control group. These results suggest that both Ce6 and erastin have less dark cytotoxicity against CAL-27 cells without laser irradiation. The in vitro laser phototoxicity of erastin, Ce6, Ce6-erastin and the mixture of Ce6 and erastin was measured after laser irradiation (650 nm, 100 mW cm-2) for 10 min. As delineated in Figure 4C and D, the cell viability of CAL-27 cells pretreated with erastin is higher than 75% under light irradiation, indicating its low cytotoxicity. After pretreatment with Ce6, the cell viability decreases gradually with increasing Ce6 dose, and beyond 53% of cells dies at the Ce6 concentration of 18.4 μg mL-1. It is calculated that the Ce6 dosage required for 50% cellular growth inhibition (IC50) is 14.24 μg mL-1. The destruction of tumor cells by Ce6 is attributed to the generation of cytotoxic ROS under irradiation. Compared to the free drugs, Ce6-erastin and the Ce6/erastin mixture exhibit much higher cytotoxicity against CAL-27 cells, and the IC50 values reach Ce6 1.78 μg mL-1/erastin 0.75 μg mL-1 and Ce6 7.0 μg mL-1/erastin 2.97 μg mL-1, respectively, which demonstrates that the combination of Ce6 and erastin has an enhanced effect on the inhibition of CAL-27 cell proliferation.
Figure 3
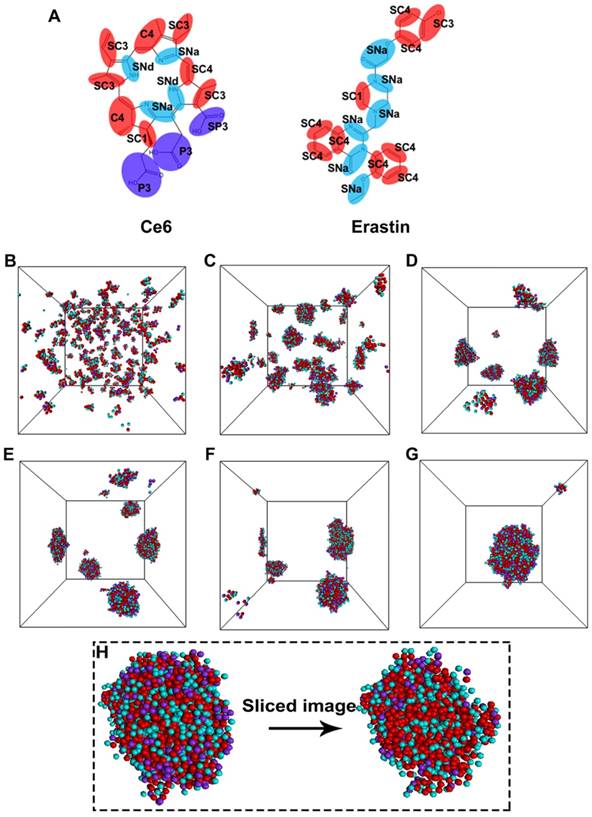
Molecular simulations reveal the self-assembly mechanisms between Ce6 and erastin. (A) Coarse-grained models of Ce6 and erastin. CGMD simulations on the self-assembly of Ce6 and erastin in solution. (B) Initial state; (C) 15 ns; (D) 90 ns; (E) 120 ns; (F) 150 ns; (G) 300 ns; (H) Terminal structure and the cross-sectional view of one Ce6-erastin nanoparticle. Water beads are omitted for clarity.
We further calculated the combination index (CI) [36, 37] of the phototherapy and chemotherapy based on Figure 4E. The CI values of Ce6/erastin mixture and Ce6-erastin nanoparticles at most concentrations is lower than 1, indicating the strong synergistic effect between photodynamic and ferroptosis-induced cytotoxicity against CAL-27 cells. Furthermore, we carried out TEM observations to investigate the morphological changes in photodynamic, ferroptosis and the combination therapy. In the TEM micrograph, cells in control group show normal membrane and organelles. Cells treated by Ce6 and laser irradiation exhibit characteristic features of apoptosis like chromatin condensation, margination and the formation of double-membrane apoptotic bodies. Erastin-treated cells reveal mitochondrial morphological changes of ferroptosis, such as loss of structural integrity [11, 38]. Cells treated by Ce6-erastin and laser irradiation exhibit dual-morphological features of apoptosis and ferroptosis including smaller, ruptured mitochondria with increased membrane density and apoptotic bodies (Figure 4F). These results demonstrated that by contrast to free drugs, Ce6-erastin nanoparticles can induce synergistic effect of photodynamic and ferroptosis-induced cytotoxicity, leading to enhanced PDT efficacy under laser irradiation.
Figure 4
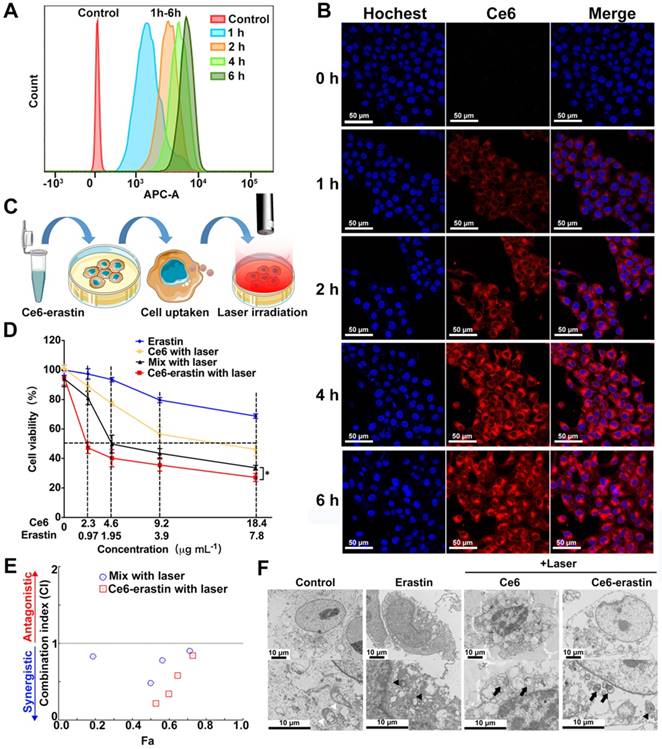
In vitro cellular uptake and cytotoxicity of Ce6-erastin nanoparticles. (A) FCM histogram profiles of CAL-27 cells incubated with Ce6-erastin for 1 h, 2 h, 4 h, and 6 h. (B) Cell internalization of Ce6-erastin nanoparticles observed by CLSM (CAL-27 cells) for 0 h, 1 h, 2 h, 4 h and 6 h. Scales represent 50 μm. (C) Schematic of the in vitro cytotoxicity experiment. (D) Cell viability of CAL-27 cells after incubation with erastin, Ce6, Ce6/erastin drug mixture and Ce6-erastin at different concentrations and after laser irradiation. The statistical significance level is *p<0.05, **p<0.01. (E) CI values of PDT and ferroptosis with Ce6/erastin mixture and Ce6-erastin nanoparticles towards CAL-27 cells. (F) TEM images of CAL-27 cells treated with PBS, Ce6 (2.3 μg mL-1), Ce6-erastin (Ce6 2.3 μg mL-1, erastin 0.97 μg mL-1). White arrowheads, normal mitochondria; black arrowheads, smaller, ruptured mitochondria; black arrow, formation of apoptotic bodies. All scale bars are 10 μm.
Figure 5
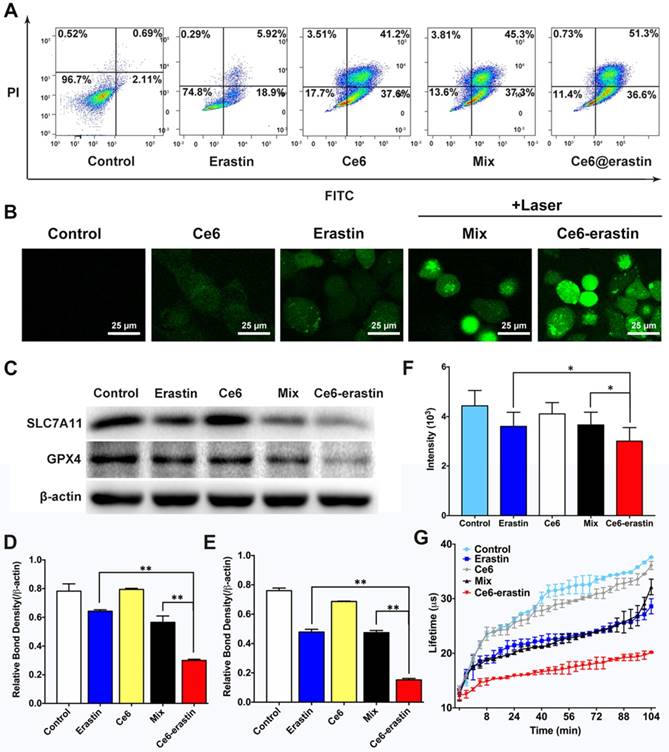
Antitumor effect of Ce6-erastin in vitro. (A) Apoptosis analysis of CAL-27 cells treated with different formulations followed by laser irradiation by FCM. (B) CLSM images of CAL-27 cells stained by DCFH-DA probe after treated with different formulations with or without laser irradiation. Scales represent 25 μm.(C) Immunoblotting of the protein expression status of SLC7A11 and GPX4 in CAL-27 cells after treated with different formulations followed by laser irradiation. (D, E) Relative bond density of the expression levels of SLC7A11 and GPX4. (F, G) The phosphorescence signal and lifetime profile of the oxygen probe reflecting dissolved oxygen in the culture medium of CAL-27 cells after treated with different formulations. The statistical significance level is *p<0.05, **p<0.01.
The apoptosis effect of the as-prepared materials described above on CAL-27 cells could be evaluated by an FITC-Annexin V/PI double-staining assay. After incubation at a Ce6 dose of 4.6 μg mL-1 and an erastin dose of 1.95 μg mL-1 and irradiation with a 650 nm laser, the apoptosis induction in CAL-27 cells by erastin, Ce6, a Ce6/erastin mixture, and Ce6-erastin nanoparticles was determined by FCM. Cells without any treatment were used as control. Figure 5A shows that the percentages of apoptotic cells are 2.80%, 24.8%, 78.8%, 82.6%, and 87.9%, respectively. Compared to the other drug formulations, Ce6-erastin causes the highest apoptosis rate in CAL-27 cells. These results are in agreement with the MTT results.
To further investigate the effect of producing ROS, intracellular ROS levels were tested by fluorescence microscopy using a 2,7-dichlorofluorescein diacetate (DCFH-DA) probe. Once treated by Ce6-erastin and laser irradiation, intracellular ROS could be produced via two pathways. One is ferroptosis induced lipid-ROS accumulation, and the other is photochemical process of ferroptosis-promoted PDT. In addition, cancer cells have the ability of exploiting a variety of cytoprotective mechanisms, including antioxidant molecules such as GSH, which could detoxify ROS to resist the cytotoxic effects of PDT [39]. The inhibition of GSH in ferroptosis could further upregulate intracellular ROS in Ce6-erastin treated cells. Treatment with erastin, Ce6, a Ce6/erastin mixture, and Ce6-erastin nanoparticles was performed, followed by laser irradiation. Cells without any treatment were used as control. As shown in Figure 5B, weak fluorescence is observed in cells incubated with PBS and erastin, indicating a low ROS level. The green fluorescence resulting from treatment is attributed to the presence of 2,7-dichlorofluorescein, whose release is catalyzed by the generation of ROS. The fluorescent signal increases gradually in the following order: Ce6, Ce6/erastin mixture and Ce6-erastin nanoparticles, indicating increased ROS concentrations in the intracellular microenvironment. This phenomenon indicates that Ce6-erastin nanoparticles can exhibit substantial anticancer effects in a ROS-mediated way in vitro.
To confirm that ferroptosis plays a role in Ce6-erastin induced cell death, the influence of all formulations on intracellular SLC7A11 and GPX4 expression was evaluated in vitro by western blotting. As shown in Figure 5C and D, consistent with previous reports that p53 mutant cells are more sensitive to erastin-induced ferroptosis [40], SLC7A11 protein expression is downregulated slightly by free erastin and the Ce6/erastin mixture compared with control. In contrast, the expression of SLC7A11 is remarkably downregulated by Ce6-erastin nanoparticles. The inhibition of GPX4 is essential for the formation of lipid hydroperoxides in ferroptosis [23]. As expected, the expression of GPX4 is shown to be inhibited by the erastin-containing drug formulations. In addition, Ce6-erastin nanoparticles significantly downregulates GPX4 expression compared to the free erastin and Ce6/erastin mixture groups. These data indicate that the nanodrug promotes the regulation of protein expression during ferroptosis.
Moreover, to verify the O2-evolving ability of Ce6-erastin nanoparticles, dissolved oxygen in the culture medium of CAL-27 cells was measured using the extracellular O2 consumption assay kit and a dissolved oxygen meter. Cells were pretreated with erastin, Ce6, a Ce6/erastin drug mixture and Ce6-erastin nanoparticles at a Ce6 dose of 4.6 μg mL-1 and an erastin dose of 1.95 μg mL-1. Cells without any treatment were used as control. The inverse correlation between the phosphorescence signal and O2 concentration is due to the ability of O2 to quench the excited state of the probe. As shown in Figure 5F and G, the erastin-containing drug formulations dramatically decrease the phosphorescence signal. Similarly, oxygen concentration detected by the dissolved oxygen meter is significantly elevated in Ce6-erastin-pretreated cell medium compared to that treated with the free drugs (Figure S9). Taken together, this evidence shows that Ce6-erastin nanoparticles demonstrate a remarkable ability to increase oxygen to supply PDT consumption.
It is widely confirmed that nanoparticles with an appropriate size (~200 nm) exhibit longer blood retention time than free drugs [41]. Here, an in vivo biodistribution study of Ce6 and Ce6-erastin nanoparticles was carried out by intravenous injection into the tail veins of the CAL-27-tumor-xenografted BABL/c nude mice over the course of 4 h. As shown in Figure 6A, the real-time imaging of xenograft tumors is clearly visualized after the injection of free Ce6 for 1 h, and the signal of Ce6 decreases and becomes exceedingly weak by 4 h, indicating that free Ce6 would be quickly cleared from the bloodstream. For Ce6-erastin nanoparticles, relatively high fluorescence in tumor site is sustained for over 4 h. This high accumulation ability of Ce6-erastin in the tumor tissues could be attributed to the enhanced permeability and retention (EPR) effect. For quantitative evaluation of the amount of Ce6 in major organs via intravenous injection, the mice were sacrificed at different time intervals after injection, and the contents of Ce6 in all collected tumors and organs were measured by fluorescence spectroscopy (Figure 6B). The concentrations of Ce6 in the tumors and organs of the Ce6-erastin nanoparticle-treated group are markedly higher than those in the free Ce6 groups. All of the results demonstrate that Ce6-erastin nanoparticles have a long circulation time and good targeting capacity. Accordingly, we confirm that 1 h after drug administration is the optimal therapeutic time for the subsequent in vivo PDT process.
Having demonstrated the high ROS accumulation capability, amelioration of the hypoxia in the TME, and excellent tumor accumulation of Ce6-erastin, we then tested in vivo antitumor efficacy in CAL-27-bearing nude mice. As shown in Figure 6C, nude mice bearing CAL-27 tumors were divided into 8 groups, and each group was treated with different drug formulations under different conditions as follows: (i) saline, (ii) erastin, (iii) Ce6, (iv) Ce6+laser, (v) Ce6/erastin mixture, (vi) Ce6/erastin mixture +laser, (vii) Ce6-erastin and (viii) Ce6-erastin + laser. The concentrations of Ce6 and erastin were 1 mg kg-1 and 0.4 mg kg-1, respectively, and drugs were administered by intravenous injection, and light irradiation was administered for 10 min in the laser groups. As illustrated in Figure 6D, body weight in all pretreated groups exhibit a slight increase, suggesting that all the drug formulations have safe therapeutic effect. After thirty days treatment, the tumor volumes of the control group and the groups without laser irradiation have increased rapidly over time (Figure 6E). However, in the groups that received laser irradiation at 650 nm, tumor growth is significantly retarded, especially by Ce6-erastin nanoparticles. Correspondingly, the calculated tumor inhibitory rates (TIRs) of erastin, Ce6, Ce6/erastin mixture, Ce6-erastin, Ce6+laser, Ce6/erastin mixture+laser and Ce6-erastin+laser are 21.5%, 3.1%, 17.5%, 29.1%, 46.1%, 52.8% and 70.6%, respectively, relative to the tumor volumes in the control group at the end of the experiment (Figure 6F). These results indicate that Ce6-erastin nanoparticles have the highest PDT efficacy among all therapeutic groups due to the synergistic effect of Ce6 and erastin, leading to high generation of cytotoxic ROS under irradiation.
Figure 6
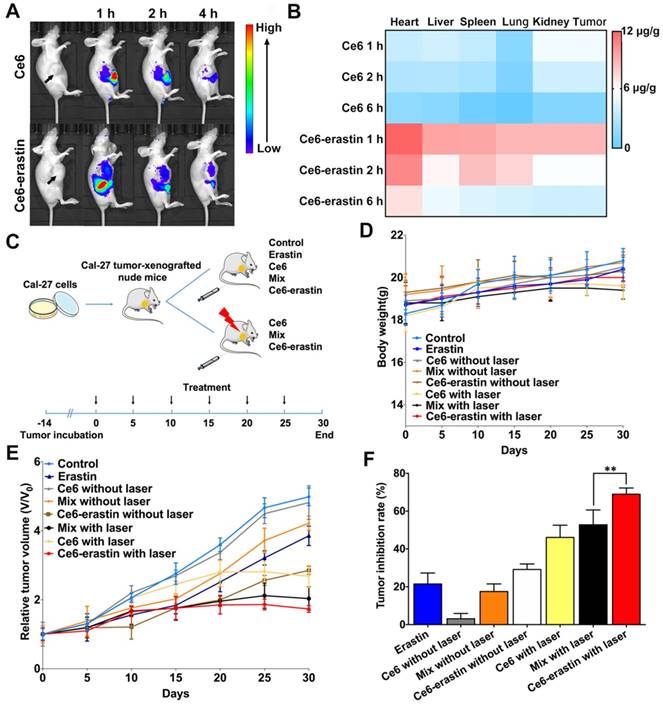
In vivo biodistribution and therapeutic efficacy against CAL-27 tumor-xenografted mouse model. (A) In vivo whole-animal imaging of Ce6 fluorescence at different times after intravenous injection via the tail vein in the form of free Ce6 and Ce6-erastin nanoparticles. (B) Tissue distribution of Ce6 after intravenous injection of free Ce6 (1 mg kg-1) and Ce6-erastin nanoparticles (Ce6 1 mg kg-1). (C) Experimental timeline and groups. (D) Body weight changes in CAL-27 tumor-xenografted nude mice after intravenous injection of saline, Ce6, erastin, Ce6/erastin mixture and Ce6-erastin nanoparticles with and without laser irradiation over a period of 30 days. (E) Relative tumor growth curves of tumor volume after different treatment for 30 days. (F) Tumor inhibition rates after different treatment after day 30. The statistical significance level is *p<0.05, **p<0.01.
After treatment with various formulations, mice were sacrificed to collect and fix the tumor tissue and normal organs. The therapeutic outcome was further confirmed by hematoxylin and eosin (H&E) staining and IHC staining with Ki-67 antibody and a terminal-deoxynucleotidyl transferase-mediated nick end labeling (TUNEL) assay. As illustrated in Figure 7A, biopsies of tumors pretreated with saline and erastin show large nuclei and spindle shapes, suggesting rapid tumor growth. Similar results are obtained in mice after the intravenous injection of Ce6, Ce6/erastin mixture, and Ce6-erastin without irradiation. In contrast, nucleus shrinkage and fragmentation are observed after PDT-inducing treatment in Ce6-containing formulations. More importantly, most tumor cells are destroyed after administration of the Ce6-erastin formulation with irradiation, implying the highest activation of cell apoptosis by the synergistic effect of Ce6 and erastin in nanoparticle formation. No apparent cytotoxicity is observed in other organs after pretreatment with all formulations, as shown by H&E staining (Figure S10). Ki-67 is used as a biomarker of cellular proliferation [42]. Compared to pretreatment with other formulations, Ce6 and the Ce6/erastin mixture with laser irradiation downregulates Ki-67 expression in tumor cells. In particular, Ce6-erastin nanoparticles under irradiation resulted in a significant change in Ki-67 expression. These results are also consistent with the immunofluorescence staining of tumor slides by TUNEL assay, confirming that the Ce6-erastin nanoparticles have the best ability to induce apoptosis among all groups both in vitro and in vivo. In addition, similar to the cellular results, the IHC analysis of SLC7A11 expression in xenografted tumors shows that the mixture of Ce6 and erastin and Ce6-erastin nanoparticles plus laser irradiation dramatically reduced SLC7A11 expression (Figure 7B), suggesting that the inhibition of SLC7A11 plays an important role in eliminating tumors.
Figure 7
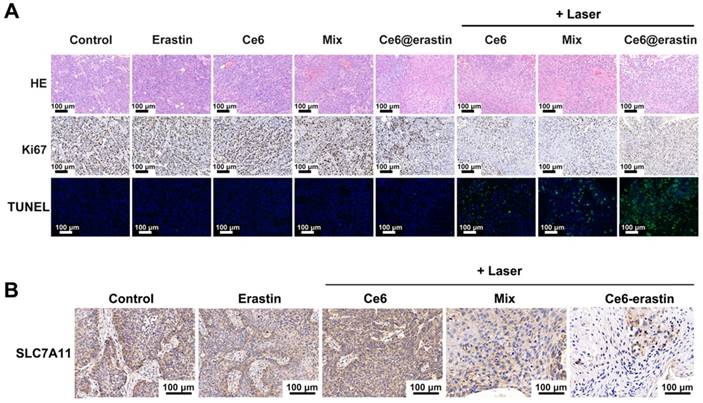
(A) H&E, IHC and TUNEL images of tumor tissue of tumor-bearing mice treated with different formulations with or without the laser irradiation. Green: apoptotic cells. Blue: DAPI-stained cell nuclei. (B) Representative images of SLC7A11 expression in tumors of tumor-bearing mice after different treatment. All scale bars are 100 μm.
Conclusions
In summary, ferroptosis is a new formed programmed cell death with outstanding characteristics of accumulated lipid-ROS and increased ferric ion, which are potential for oxygen supplement. Based on that, we put forward a new concept of ferroptosis-promoted PDT. To verify our concept, a supramolecular Ce6-erastin nanodrug was designed and synthesized. After internalized by tumor cells, Ce6-erastin exhibited unprecedented ability of oxygen self-sufficiency to guarantee efficient oxygen-dependent PDT and exhibited superior cytotoxicity with high ROS production. Meanwhile, the enhanced PDT combined with ferroptosis could be achieved simultaneously in vivo, which showed excellent antitumor ability against CAL-27 tumor-bearing mice. Overall, we believe that this strategy may provide new insights into ferroptosis and PDT combination therapy and find a brand-new strategy for more effective PDT systems for cancer treatment in the future.
Methods
Chemicals and Reagents
Ce6 was bought from J&K Scientific Co, China. Erastin was purchased from Selleck Chemicals, USA. Dead Cell Apoptosis Kit with Annexin V FITC and PI and CellLight® Lysosomes-GFP, BacMam 2.0 were purchased form ThermoFisher Scientific, USA. ROS assay kit and Hoechst 33342 staining solution for live cells, 100X were purchased form Beyotime, China. Extracellular O2 consumption reagent (ab197242), anti-GAPDH antibody (ab181602) and anti-SLC7A11 antibody (ab175186) were purchased from Abcam.
Bioinformatics Analysis
The mRNA levels of SLC7A11 in different type of cancers were evaluated through analysis in ONCOMINE database (www.oncomine.org). The fold change was defined as 2 and p value was set up at 0.01.
IHC of OTSCC Specimens
Paraffin-embedded OTSCC specimens from patients were collected under guidelines approved by the Institutional Review and the Ethics Boards at Shanghai Jiao Tong University School of Medicine (Shanghai, China). Histologic examination was carried out by two pathologists. Briefly, tissue slides were dewaxed and rehydrated, treated with 3% H2O2, incubated with anti-SLC7A11 (ab175186) overnight at 4 °C. After washed with PBST (PBS+1% tween), incubated with secondary antibody and streptavidin-horseradish peroxidase(HRP) conjugate. Tissue sections were then dehydrated, and mounted.
Preparation of Ce6-erastin
Ce6 and erastin were relatively dissolved in DMSO at a concentration of 10 mg mL-1 and stored in -20 °C. Equivalent Ce6 and erastin solution were added dropwise in PBS with stirring. After stirring for 30 min, the mixture was dispersed by ultrasonic dispersion for 30 min at room temperature. The product was then purified by ultrafiltration centrifugation (1000 g, 4 °C) for 5 min. the un-assembled Ce6 and erastin were removed [43]. Finally, the product was stored away from light at 4 °C for subsequent experiments.
Characterization of Ce6-erastin
The UV-vis absorption spectra were collected with a UV-vis spectrophotometer (Thermo EV300, USA). The morphology of nanoparticles was observed by a B-TEM, Tecnai G2 Spirit Biotwin with 120 kV acceleration voltage. The size distributions, PDI were carried out with a DLS (Zetasizer Nano S). Variable-temperature 1H NMR was performed within a mixed solvent of deuterated tetrachloroethane and deuterated dimethyl sulfoxide (v:v = 5:1) at 298 K, 313 K and 328 K (Avance III 400 MHz, Bruker, Germany). Variable-temperature FTIR spectra were measured at 303 K, 363 K and 423 K by a spectrophotometer (Nicolet 6700, Thermo Scientific, America).
Model and Simulation Method
The MARTINI force field with four-to-one mapping strategy is used to represent the interaction center in the molecules [33]. According to the mapping rule of the MARTINI force field, we constructed coarse-grained (CG) model for Ce6 and erastin, respectively. There are three main types of beads: polar (P), nonpolar (N) and apolar (C) to stand for the chemical nature of the atomistic structures. The bead types for smaller particles representing 2-3 atoms including those in ring are labeled by a prefix “S”. Ce6 and erastin were respectively represented by 15 and 16 CG beads.
Firstly, 100 Ce6 molecules and 100 erastin molecules were mixed in a simulation box with 7.5×7.5×7.5 nm3 size (which contains 62333 CG water molecules). Secondly, the configurations were optimized by the L-BFGS algorithm with an energy tolerance of 10.0 kJ mol-1 nm-1. A cutoff value of 1.1 nm was used for non-bond interactions. Lastly, 300 ns long CG molecular dynamics simulations were performed to explore the nanoparticle formation process. All the calculations were employed by using GROMACS 5.1.5 in the NPT ensemble [34]. A 30 fs time step is used to integrate the equations of motion with the leap-frog algorithm. The periodic boundary is used in the x, y and z directions. The neighbor list is updated every 20 steps with a cutoff 1.1 nm. The standard shift function of GROMACS is used to deal with the LJ potential and the reaction-field method is used to deal with the Coulomb potential. The LJ potential is shifted from 0.9 nm to a cutoff of 1.1 nm. The relative dielectric constant of Coulomb potential is 15. The initial velocities of beads are generated based on the Maxwell distribution at system temperature. The temperature and pressure are controlled at 303 K and 1 atm by the V-rescale thermostat and Berendsen barostat method [35].
In Vitro Drug Release of Ce6-erastin
To determine the controlled release property of the Ce6-erastin nanoparticles, 1 mg Ce6-erastin nanoparticles was suspended in 2 mL PBS and loaded into dialysis cartridges (MWCO is 3500 Da). The cartridges were submerged into buffered solutions including acetate buffered solution (pH 5.0), PBS (pH 7.4) and PBS (pH = 7.4 supplemented with 10% FBS) respectively, and stirred at 37 °C with a moderate-speed. The released Ce6 in preselected time was quantitatively measured via UV-vis spectrometer.
Cell experiments
CAL-27 cells were cultivated in DMEM high glucose medium supplemented with 10% (v/v) FBS and 1% (v/v) penicillin-streptomycin solution in a cell incubator (The temperature is 37 °C, 5% carbon dioxide and 10% humidity).
For the cellular uptake assessment, CAL-27 cells were seeded into 6-well plates at a density of 4×10⁵ cells per well, culture media containing Ce6-erastin nanoparticles (Ce6 4.6 μg mL-1, erastin 1.95 μg mL-1) was added to per well and incubated for certain time (1 h, 2 h, 4 h, 6 h) and cells without any treatment were used as the negative control. Flow cytometry quantitative analysis and CLSM (Leica TCP SP5) were performed to observe the intracellular fluorescence intensity of intracellular Ce6. For subcellular location of Ce6-erastin nanoparticles in CAL-27 cells, lysosome was stained by CellLight® Lysosomes-GFP before Ce6-erastin nanoparticles added.
For in vitro viability assay, CAL-27 cells were seeded in 96-well plates with 8000 cells per well and cultured for 24 h to ensure all cells were completely attached. After removal of culture media, 100 μL culture media containing gradient concentration of Ce6 (2.3 μg mL-1, 4.6 μg mL-1, 9.2 μg mL-1 and 18.4 μg mL-1), gradient concentration of erastin (0.97 μg mL-1, 1.95 μg mL-1, 3.9 μg mL-1 and 7.8 μg mL-1), Ce6/erastin mixture which containing equal concentration of Ce6 and erastin relatively to nanoparticle group, Ce6-erastin nanoparticles containing gradient concentration of Ce6 and erastin were added to each well. The concentration of Ce6 and erastin in the assay was determined by the content of Ce6 and erastin in nanoparticles tested in UV-Vis and High Performance Liquid Chromatography-Mass Spectrometry (HPLC-MS). All treatments were exposed to near-infrared lasers (650 nm, 100 mW/cm2) for 10 min after 6 h of incubation. Cells pretreated with all formulations without laser irradiation was tested after incubation for 48 h for dark cytotoxicity assessment. The cell viability was measured by MTT assay. Results were calculated by the following equation:
Cell viability = (OD sample - OD background) / (OD control - OD background) × 100%.
For quantitative measurement of apoptosis, CAL-27 cells were cultured in 6-well plates with 6 × 10⁵ cells per well. Cells were incubated for 6 hours with Ce6, erastin, Ce6/erastin mixture, Ce6-erastin nanoparticles at the same concentration (Ce6 4.6 μg mL-1, erastin 1.95 μg mL-1), and irradiated for 10 min. At the same time, cells without any treatment were used as the negative control. 48 h after irradiation, cells were harvested and stained with FITC-Annexin V/PI.
For O2-evolving measurements, cells were seeded into 96-well plates (black wall clear bottom) with 6000 per well and incubated with 150 μL of Ce6, erastin, Ce6/erastin mixture, Ce6-erastin nanoparticles at the same concentration (Ce6 4.6 μg mL-1, erastin 1.95 μg mL-1). Cells without any treatment were used as control. O2 consumption rate was measured by extracellular O2 consumption assay kit (Abcam, ab197243) and a dissolved oxygen meter according to the manufacture's protocols.
For determining SLC7A11 and GPX4 expression level after treatment, CAL-27 cells were pretreated with PBS, Ce6, erastin, Ce6/erastin mixture, Ce6-erastin nanoparticles at the same concentration (Ce6 4.6 μg mL-1, erastin 1.95 μg mL-1). All the dishes were irradiated for 10 min. 48 h after irradiation, cells were lysed and the concentration of whole lysate protein was determined with BCA reagents. 20 μg of protein was separated using a 12% SDS-polyacrylamide gel and then wet-transferred to a poly (vinylidene fluoride) (PVDF) membrane. The membranes were blocked and incubated by primary antibodies at 4 °C overnight and with horseradish peroxidase conjugated secondary antibody for 1 h at room temperature. The protein bands were finally visualized with an enhanced chemiluminescence (ECL) substrate kit (Merck Millipore, USA) and analyzed using Image J software.
Animal experiments
The Institutional Animal Ethics Committee of Shanghai Jiaotong University School of Medicine approved all experimental procedures. BALB/c mice (4 weeks old, male) were purchased from the Chinese Academy of Science (Shanghai). Xenograft tumor model was established by inoculating subcutaneously with 200 μL of cell suspension (3 × 10⁶ CAL-27 cells per tumor) into nude mice.
For in vivo fluorescence imaging and biodistribution, tumor-bearing BALB/c mice were treated with Ce6 (1 mg kg-1) and Ce6-erastin nanoparticles (containing 1 mg kg-1 Ce6) via intravenous injection. Subsequently, the whole body imaging was acquired by a fluorescence imaging system (CRi Maestro EX, USA). The biodistribution of Ce6-erastin nanoparticles in tumor bearing mice was conducted with intravenous administration of free Ce6 (1 mg kg-1) and Ce6-erastin nanoparticles (containing 1 mg kg-1 Ce6). At the predetermined time points (1 h, 2 h, 4 h, 6 h), mice were sacrificed to separate major organs (liver, spleen, lung, kidney, heart) and tumors. After tissues were weighed and homogenized, Ce6 contents were determined by measuring the absorbance via UV-vis spectrometer.
For in vivo anticancer efficacy assessment, tumor-bearing mice were randomly divided into 8 groups, and each group was treated with different drug formulations under different conditions as follows: (i) saline, (ii) erastin, (iii) Ce6, (iv) Ce6+laser, (v) Ce6/erastin mixture, (vi) Ce6/erastin mixture +laser, (vii) Ce6-erastin and (viii) Ce6-erastin + laser. The concentrations of Ce6 and erastin were 1 mg kg-1 and 0.4 mg kg-1, respectively. Once every 5 days, the test compounds and saline were administered intravenously into tail vein. The tumours in laser treatment groups were subjected to laser exposure (100 mW/cm2 for 10 min) after 1 h of i.v. administration. The tumor size was monitored by a caliper and calculated as follows: V = W2 × L/2, where W and L represented the minor and major length. After 30 days, mice were executed based on the protocol of the IACUC and the major organs and tumors of mice were excised. Subsequently, the tumors and organs were fixed, embedded, sliced. All slides were stained with H&E. Additional IHC staining with anti-Ki67 antibody and anti-SLC7A11 antibody and TUNEL staining were used to analysis protein expression and apoptosis in tumor site.
Abbreviations
PDT: photodynamic therapy; TME: tumor microenvironment; O2: oxygen; ROS: reactive oxygen species; H2O2: hydrogen peroxide; OTSCC: oral tongue squamous cell carcinoma; SLC7A11: Solute Carrier Family 7 Member 11; GPX4: glutathione peroxidase 4; Ce6: chlorin e6; GSH: glutathione; LIP: labile iron pool; DMSO: dimethylsulfoxide; PBS: phosphate buffer solution; DDDS: drug-drug delivery system; DLC: drug loading content; DLS: dynamic light scattering; 1H NMR: 1H nuclear magnetic resonance; FTIR: fourier transform infrared spectroscopy; CGMD: coarse-grained molecular dynamics; DCFH-DA: 2,7-dichlorofluorescein diacetate; FCM: flow cytometry; CLSM: confocal laser scanning microscopy; IC50: 50% cellular growth inhibition.
Supplementary Material
Supplementary figures.
Acknowledgements
The authors thank the National Natural Science Foundation of China (51690151, 81802694, 21774077), and Interdisciplinary Program of Shanghai Jiao Tong University (YG2015QN01, YG2016QN56).
Competing Interests
The authors have declared that no competing interest exists.
References
1. Henderson BW, Fingar VH. Relationship of tumor hypoxia and response to photodynamic treatment in an experimental mouse tumor. Cancer Res. 1987;47:3110-4
2. Piette J, Volanti C, Vantieghem A, Matroule JY, Habraken Y, Agostinis P. Cell death and growth arrest in response to photodynamic therapy with membrane-bound photosensitizers. Biochem Pharmacol. 2003;66:1651-9
3. Dang J, He H, Chen D, Yin L. Manipulating tumor hypoxia toward enhanced photodynamic therapy (PDT). Biomater Sci. 2017;5:1500-11
4. Fan W, Huang P, Chen X. Overcoming the Achilles' heel of photodynamic therapy. Chem Soc Rev. 2016;45:6488-519
5. Li RQ, Zhang C, Xie BR, Yu WY, Qiu WX, Cheng H. et al. A two-photon excited O2-evolving nanocomposite for efficient photodynamic therapy against hypoxic tumor. Biomaterials. 2019;194:84-93
6. Liu WL, Liu T, Zou MZ, Yu WY, Li CX, He ZY. et al. Aggressive Man-Made Red Blood Cells for Hypoxia-Resistant Photodynamic Therapy. Adv Mater. 2018;30:e1802006
7. Liu LH, Zhang YH, Qiu WX, Zhang L, Gao F, Li B. et al. Dual-Stage Light Amplified Photodynamic Therapy against Hypoxic Tumor Based on an O2 Self-Sufficient Nanoplatform. Small. 2017;13:1701621-30
8. Zhang F, Ni Q, Jacobson O, Cheng S, Liao A, Wang Z. et al. Polymeric Nanoparticles with a Glutathione-Sensitive Heterodimeric Multifunctional Prodrug for In Vivo Drug Monitoring and Synergistic Cancer Therapy. Angew Chem Int Ed Engl. 2018;57:7066-70
9. Shen L, Huang Y, Chen D, Qiu F, Ma C, Jin X. et al. pH-Responsive Aerobic Nanoparticles for Effective Photodynamic Therapy. Theranostics. 2017;7:4537-50
10. Li SY, Cheng H, Xie BR, Qiu WX, Zeng JY, Li CX. et al. Cancer Cell Membrane Camouflaged Cascade Bioreactor for Cancer Targeted Starvation and Photodynamic Therapy. ACS Nano. 2017;11:7006-18
11. Dixon SJ, Lemberg KM, Lamprecht MR, Skouta R, Zaitsev EM, Gleason CE. et al. Ferroptosis: an iron-dependent form of nonapoptotic cell death. Cell. 2012;149:1060-72
12. Xie Y, Hou W, Song X, Yu Y, Huang J, Sun X. et al. Ferroptosis: process and function. Cell Death Differ. 2016;23:369-79
13. Gao M, Monian P, Pan Q, Zhang W, Xiang J, Jiang X. Ferroptosis is an autophagic cell death process. Cell Res. 2016;26:1021-32
14. Yang WS, Stockwell BR. Ferroptosis: Death by Lipid Peroxidation. Trends Cell Biol. 2016;26:165-76
15. Bogdan AR, Miyazawa M, Hashimoto K, Tsuji Y. Regulators of Iron Homeostasis: New Players in Metabolism, Cell Death, and Disease. Trends Biochem Sci. 2016;41:274-86
16. Dixon SJ, Stockwell BR. The role of iron and reactive oxygen species in cell death. Nat Chem Biol. 2014;10:9-17
17. Shi W, Cao L, Zhang H, Zhou X, An B, Lin Z. et al. Surface Modification of Two-Dimensional Metal-Organic Layers Creates Biomimetic Catalytic Microenvironments for Selective Oxidation. Angew Chem Int Ed Engl. 2017;56:9704-9
18. Shen Z, Liu T, Li Y, Lau J, Yang Z, Fan W. et al. Fenton-Reaction-Acceleratable Magnetic Nanoparticles for Ferroptosis Therapy of Orthotopic Brain Tumors. ACS Nano. 2018;12:11355-65
19. Zheng DW, Lei Q, Zhu JY, Fan JX, Li CX, Li C. et al. Switching Apoptosis to Ferroptosis: Metal-Organic Network for High-Efficiency Anticancer Therapy. Nano Lett. 2017;17:284-91
20. Shen Z, Song J, Yung BC, Zhou Z, Wu A, Chen X. Emerging Strategies of Cancer Therapy Based on Ferroptosis. Adv Mater. 2018;30:1704007
21. Liu T, Liu W, Zhang M, Yu W, Gao F, Li C. et al. Ferrous-Supply-Regeneration Nanoengineering for Cancer-Cell-Specific Ferroptosis in Combination with Imaging-Guided Photodynamic Therapy. ACS Nano. 2018;12:12181-92
22. Sundquist E, Kauppila JH, Veijola J, Mroueh R, Lehenkari P, Laitinen S. et al. Tenascin-C and fibronectin expression divide early stage tongue cancer into low- and high-risk groups. Br J Cancer. 2017;116:640-8
23. Yang WS, SriRamaratnam R, Welsch ME, Shimada K, Skouta R, Viswanathan VS. et al. Regulation of ferroptotic cancer cell death by GPX4. Cell. 2014;156:317-31
24. Dixon SJ, Patel DN, Welsch M, Skouta R, Lee ED, Hayano M. et al. Pharmacological inhibition of cystine-glutamate exchange induces endoplasmic reticulum stress and ferroptosis. Elife. 2014;3:e02523
25. Bhutia YD, Babu E, Ramachandran S, Ganapathy V. Amino Acid transporters in cancer and their relevance to "glutamine addiction": novel targets for the design of a new class of anticancer drugs. Cancer Res. 2015;75:1782-8
26. Shiozaki A, Iitaka D, Ichikawa D, Nakashima S, Fujiwara H, Okamoto K. et al. xCT, component of cysteine/glutamate transporter, as an independent prognostic factor in human esophageal squamous cell carcinoma. J Gastroenterol. 2014;49:853-63
27. Koppula P, Zhang Y, Shi J, Li W, Gan B. The glutamate/cystine antiporter SLC7A11/xCT enhances cancer cell dependency on glucose by exporting glutamate. J Biol Chem. 2017;292:14240-9
28. Yu Y, Xie Y, Cao L, Yang L, Yang M, Lotze MT. et al. The ferroptosis inducer erastin enhances sensitivity of acute myeloid leukemia cells to chemotherapeutic agents. Mol Cell Oncol. 2015;2:e1054549
29. Timmerman LA, Holton T, Yuneva M, Louie RJ, Padro M, Daemen A. et al. Glutamine sensitivity analysis identifies the xCT antiporter as a common triple-negative breast tumor therapeutic target. Cancer Cell. 2013;24:450-65
30. Drayton RM, Dudziec E, Peter S, Bertz S, Hartmann A, Bryant HE. et al. Reduced expression of miRNA-27a modulates cisplatin resistance in bladder cancer by targeting the cystine/glutamate exchanger SLC7A11. Clin Cancer Res. 2014;20:1990-2000
31. Yoshikawa M, Tsuchihashi K, Ishimoto T, Yae T, Motohara T, Sugihara E. et al. xCT inhibition depletes CD44v-expressing tumor cells that are resistant to EGFR-targeted therapy in head and neck squamous cell carcinoma. Cancer Res. 2013;73:1855-66
32. Nabeyama A, Kurita A, Asano K, Miyake Y, Yasuda T, Miura I. et al. xCT deficiency accelerates chemically induced tumorigenesis. Proc Natl Acad Sci U S A. 2010;107:6436-41
33. Huang Y, Dai Z, Barbacioru C, Sadee W. Cystine-glutamate transporter SLC7A11 in cancer chemosensitivity and chemoresistance. Cancer Res. 2005;65:7446-54
34. Ye H, Yu T, Temam S, Ziober BL, Wang J, Schwartz JL. et al. Transcriptomic dissection of tongue squamous cell carcinoma. BMC Genomics. 2008;9:69
35. Jain RK, Stylianopoulos T. Delivering nanomedicine to solid tumors. Nat Rev Clin Oncol. 2010;7:653-64
36. Chou TC. Drug combination studies and their synergy quantification using the Chou-Talalay method. Cancer Res. 2010;70:440-6
37. Chou TC. Theoretical basis, experimental design, and computerized simulation of synergism and antagonism in drug combination studies. Pharmacol Rev. 2006;58:621-81
38. Yagoda N, von Rechenberg M, Zaganjor E, Bauer AJ, Yang WS, Fridman DJ. et al. RAS-RAF-MEK-dependent oxidative cell death involving voltage-dependent anion channels. Nature. 2007;447:864-8
39. Buytaert E, Dewaele M, Agostinis P. Molecular effectors of multiple cell death pathways initiated by photodynamic therapy. Biochim Biophys Acta. 2007;1776:86-107
40. Xie Y, Zhu S, Song X, Sun X, Fan Y, Liu J. et al. The Tumor Suppressor p53 Limits Ferroptosis by Blocking DPP4 Activity. Cell Rep. 2017;20:1692-704
41. Maeda H, Wu J, Sawa T, Matsumura Y, Hori K. Tumor vascular permeability and the EPR effect in macromolecular therapeutics: a review. J Control Release. 2000;65:271-84
42. Cuylen S, Blaukopf C, Politi AZ, Muller-Reichert T, Neumann B, Poser I. et al. Ki-67 acts as a biological surfactant to disperse mitotic chromosomes. Nature. 2016;535:308-12
43. Liu T, Zhang M, Liu W, Zeng X, Song X, Yang X. et al. Metal Ion/Tannic Acid Assembly as a Versatile Photothermal Platform in Engineering Multimodal Nanotheranostics for Advanced Applications. ACS Nano. 2018;12:3917-27
Author contact
![]() Corresponding authors: G. Zhou. Email: guoyuzhoucom and X. Zhu. E-mail: xyzhuedu.cn
Corresponding authors: G. Zhou. Email: guoyuzhoucom and X. Zhu. E-mail: xyzhuedu.cn
Citation styles
APA
Zhu, T., Shi, L., Yu, C., Dong, Y., Qiu, F., Shen, L., Qian, Q., Zhou, G., Zhu, X. (2019). Ferroptosis Promotes Photodynamic Therapy: Supramolecular Photosensitizer-Inducer Nanodrug for Enhanced Cancer Treatment. Theranostics, 9(11), 3293-3307. https://doi.org/10.7150/thno.32867.
ACS
Zhu, T.; Shi, L.; Yu, C.; Dong, Y.; Qiu, F.; Shen, L.; Qian, Q.; Zhou, G.; Zhu, X. Ferroptosis Promotes Photodynamic Therapy: Supramolecular Photosensitizer-Inducer Nanodrug for Enhanced Cancer Treatment. Theranostics 2019, 9 (11), 3293-3307. DOI: 10.7150/thno.32867.
NLM
Zhu T, Shi L, Yu C, Dong Y, Qiu F, Shen L, Qian Q, Zhou G, Zhu X. Ferroptosis Promotes Photodynamic Therapy: Supramolecular Photosensitizer-Inducer Nanodrug for Enhanced Cancer Treatment. Theranostics 2019; 9(11):3293-3307. doi:10.7150/thno.32867. https://www.thno.org/v09p3293.htm
CSE
Zhu T, Shi L, Yu C, Dong Y, Qiu F, Shen L, Qian Q, Zhou G, Zhu X. 2019. Ferroptosis Promotes Photodynamic Therapy: Supramolecular Photosensitizer-Inducer Nanodrug for Enhanced Cancer Treatment. Theranostics. 9(11):3293-3307.
This is an open access article distributed under the terms of the Creative Commons Attribution (CC BY-NC) license (https://creativecommons.org/licenses/by-nc/4.0/). See http://ivyspring.com/terms for full terms and conditions.