Theranostics
13.3
Impact Factor
 Global reach, higher impact
Theranostics 2019; 9(12):3476-3484. doi:10.7150/thno.31970 This issue Cite
Research Paper
Regularized reconstruction of digital time-of-flight 68Ga-PSMA-11 PET/CT for the detection of recurrent disease in prostate cancer patients
Elin Lindström1,2, Irina Velikyan1,3, Naresh Regula1, Ali Alhuseinalkhudhur1, Anders Sundin1, Jens Sörensen1,4, Mark Lubberink1,2 ![]()
1. Division of Radiology and Nuclear Medicine, Department of Surgical Sciences, Uppsala University, Uppsala, Sweden;
2. Medical Physics, Uppsala University Hospital, Uppsala, Sweden;
3. Department of Medicinal Chemistry, Uppsala University, Uppsala, Sweden;
4. PET Centre, Uppsala University Hospital, Uppsala, Sweden
Received 2019-1-27; Accepted 2019-2-9; Published 2019-5-25
Citation:
Lindström E, Velikyan I, Regula N, Alhuseinalkhudhur A, Sundin A, Sörensen J, Lubberink M. Regularized reconstruction of digital time-of-flight 68Ga-PSMA-11 PET/CT for the detection of recurrent disease in prostate cancer patients. Theranostics 2019; 9(12):3476-3484. doi:10.7150/thno.31970. https://www.thno.org/v09p3476.htm
Other stylesAbstract

Accurate localization of recurrent prostate cancer (PCa) is critical, especially if curative therapy is intended. With the aim to optimize target-to-background uptake ratio in 68Ga-PSMA-11 PET, we investigated the image quality and quantitative measures of regularized reconstruction by block-sequential regularized expectation maximization (BSREM).
Methods: The study encompassed retrospective reconstruction and analysis of 20 digital time-of-flight (TOF) PET/CT examinations acquired 60 min post injection of 2 MBq/kg of 68Ga-PSMA-11 in PCa patients with biochemical relapse after primary treatment. Reconstruction by ordered-subsets expectation maximization (OSEM; 3 iterations, 16 subsets, 5 mm gaussian postprocessing filter) and BSREM (β-values of 100-1600) were used, both including TOF and point spread function (PSF) recovery. Background variability (BV) was measured by placing a spherical volume of interest in the right liver lobe and defined as the standard deviation divided by the mean standardized uptake value (SUV). The image quality was evaluated in terms of signal-to-noise ratio (SNR) and signal-to-background ratio (SBR), using SUVmax of the lesions. A visual assessment was performed by four observers.
Results: OSEM reconstruction produced images with a BV of 15%, whereas BSREM with a β-value above 300 resulted in lower BVs than OSEM (36% with β 100, 8% with β 1300). Decreasing the acquisition duration from 2 to 1 and 0.5 min per bed position increased BV for both reconstruction methods, although BSREM with β-values equal to or higher than 800 and 1200, respectively, kept the BV below 15%. In comparison of BSREM with OSEM, the mean SNR improved by 25 to 66% with an increasing β-value in the range of 200-1300, whereas the mean SBR decreased with an increasing β-value, ranging from 0 to 125% with a β-value of 100 and 900, respectively. Decreased acquisition duration resulted in β-values of 800 to 1000 and 1200 to 1400 for 1 and 0.5 min per bed position, respectively, producing improved image quality measures compared with OSEM at a full acquisition duration of 2 min per bed position. The observer study showed a slight overall preference for BSREM β 900 although the interobserver variability was high.
Conclusion: BSREM image reconstruction with β-values in the range of 400-900 resulted in lower BV and similar or improved SNR and SBR in comparison with OSEM.
Keywords: 68Ga-PSMA-11, prostate cancer, PET/CT, image reconstruction, BSREM, interobserver variability.
Introduction
Prostate cancer (PCa) is the most common cancer in men and the third most common cause of cancer death in Europe [1]. A new section in the European Association of Urology guidelines, added in 2018, emphasizes that non-invasive staging of PCa by positron emission tomography computed tomography (PET/CT) with 11C/18F-choline and prostate-specific membrane antigen (PSMA) targeting radiolabeled ligands, and by magnetic resonance imaging (MRI) has proven more sensitive in detecting lymph node and bone metastases than conventional CT and single photon emission computed tomography (SPECT), although the benefit of initial staging using these methods remains unclear [2].
PSMA is a 100-120 kDa type II integral transmembrane protein expressed in secretory cells within the prostate epithelium, as well as in other tissues, including parts of the kidney, bowel, salivary glands, and ganglia along the sympathetic trunk [3]. The expression of PSMA is upregulated in PCa cells in all stages of the disease [4,5]. Molecular whole-body imaging by 68Ga-PSMA-11 PET/CT has enabled unique assessment of tumor burden and proved its advantage in risk stratification and radiotherapy planning, as compared to standard-of-care imaging [6-11].
Accurate localization of recurrent disease and staging of oligometastatic versus widely disseminated disease is important, since these conditions require different treatments, where locally ablative therapies may be applied in the former patient group, whereas systemic treatment are required in the latter. Precise measurement of tumor uptake is also of increasing interest because molecular imaging techniques, particularly PET/CT, is more frequently applied for therapy response monitoring. The quantitation accuracy of tracer uptake measurements and overall image quality depend heavily on the image reconstruction method, which is the process of transforming the coincidence events detected by the PET scanner into the spatial distribution of the radiotracer in the object. Ordered subsets expectation maximization (OSEM) is the clinical standard-of-care reconstruction method. It is a robust method, although spatial distortion and inaccuracies in quantitative assessment, mainly in the form of underestimation of tracer uptake in small or obscured objects, may occur because of non-uniform convergence rates in the image [12]. An image reconstruction method that aims to overcome these drawbacks is the block-sequential regularized expectation maximization (BSREM) (Q.Clear; GE Healthcare), which implements regularization of the OSEM algorithm by the addition of a relative difference penalty [13-15]. During the relatively brief period of being commercially available for PET image reconstruction in clinical practice, BSREM has been shown to reduce image noise without impeding the tumor detectability [16-18]. The global strength of the regularization in BSREM (β) can be tuned for individual radiotracers allowing for optimal reconstruction depending on the specific characteristics of the radiotracer. Images with low contrast and low noise will be the outcome using a high β-value, whereas sharp contrast and high noise will be the outcome using a low value. A too high β-value will induce excessive smoothing which will negatively impact the image contrast and quantification.
To further optimize the target-to-background uptake ratio of 68Ga-PSMA-11 PET, we analyzed the impact of regularized reconstruction by BSREM on image quality and quantitative accuracy in relation to the applied β-value and acquisition time.
Methods
Patients
Twenty clinical whole-body 68Ga-PSMA-11 (Glu-NH-CO-NH-Lys(Ahx)-[68Ga]Ga-HBED-CC) PET/CT examinations of PCa patients with biochemical recurrence having serum prostate-specific antigen (PSA) value higher than 0.7 ng/mL were included in this study (Table 1). The patients were included in a prospective study on the clinical benefits of 68Ga-PSMA-11 PET/CT which was approved by the regional ethics review board in Uppsala (Dnr 2017/190). Written informed consent was obtained from all research subjects.
Table 1
Patient characteristics.
| Parameter | Value |
|---|---|
| Patients n | 20 |
| Age (y) mean ± SD | 69±7 |
| PSA (ng/mL) | |
| Mean ± SD | 55.0±104.8 |
| Range | 0.7-388.0 |
| Gleason score* | |
| Mean ± SD | 7.3±1.1 |
| Range | 6-9 |
| Primary therapy n | |
| Surgery | 3 |
| RT | 6 |
| Hormonal therapy | 6 |
| RT + hormonal therapy | 5 |
| Pattern of metastatic spread n | |
| Local Lymph nodes Bone Local + lymph nodes Local + lymph nodes + bone Lymph nodes + bone Local + bone | 1 3 5 1 2 5 3 |
*Two subjects' Gleason scores were not available.
PSA: prostate-specific antigen; SD: standard deviation; RT: radiation therapy.
68Ga-PSMA-11 PET/CT imaging protocol
PET/CT was performed 62±5 min (range 60-78 min) after intravenous administration of (mean ± standard deviation (SD)) 2.0±0.4 MBq/kg (range 1.4-2.9 MBq/kg) 68Ga-PSMA-11 on a digital time-of-flight (TOF) capable Discovery MI PET/CT system (GE Healthcare). The PET scanner has a sensitivity of 14 cps/kBq and approximately 4 mm spatial resolution at the center of the field of view (FOV) [19]. A routine clinical PET/CT protocol was applied with 2 min acquisition per bed position (bp) (mid-thigh to the base of the skull), 70-cm transaxial FOV, 256×256 matrix and 2.73×2.73×2.79 mm voxels. Images were reconstructed using the standard OSEM settings recommended by the manufacturer (3 iterations/16 subsets, and a 5-mm gaussian postprocessing filter) and BSREM (β-values of 100-1300 in steps of 100), both including TOF and point-spread function (PSF) recovery, with CT-based attenuation correction. List-mode data were re-binned using the first 1 min/bp and 0.5 min/bp portion of the data and reconstructed with the same settings and a subset of β-values (800-1400 in steps of 200 with an extra β-value of 1600 for 0.5 min/bp).
Good manufacturing practice (GMP) compliant production of 68Ga-PSMA-11
The radionuclide, 68Ga, was obtained from a 68Ge/68Ga generator in 0.1 M HCl (GalliaPharm®, Eckert &Ziegler Radiopharma GmbH, Berlin, Germany). The generator was qualified with respect to the elution efficiency, 68Ge-breakthrough and labeling capacity in agreement with the manufacturer and European Pharmacopoeia monograph specifications [20]. 68Ga-PSMA-11 production was conducted on a synthesis platform (Modular-Lab PharmTrace, Eckert & Ziegler, Eurotope, Germany) equipped with disposable cassettes. The cassette was mounted with chemicals, precursor (PSMA-11, ABX, Germany), cation exchange solid phase extraction cartridge (SCX SPE), reversed phase solid phase extraction cartridge (SPE-C8), sterile sodium chloride solution (0.9%) and sterile filter. The reaction mixture containing 68GaCl3 solution preconcentrated on the SCX SPE and eluted with NaCl/HCl solution, acetate buffer (pH 5.3) and PSMA-11 (10 nmols) was heated at 95 °C for 5 min. The product was purified on SPE-C8 and eluted with 50% EtOH. The product was formulated with sterile NaCl solution to assure a content of EtOH less than 10% and pH of 4-8. The formulation was sterile filtered in line. The production process was conducted on the closed system and the sterile filter integrity was controlled in line on the synthesis platform.
The identity, radiochemical and chemical purity, pH, product sterility and endotoxin content as well as 68Ge content were thoroughly controlled. Quality control analysis was conducted on a high-performance liquid chromatography system (LaChrom, Hitachi, VWR) equipped with reversed phase separation column (C-8) as well as UV- and radio-detectors. The retention time of the radioactive signal co-eluted with the reference (natGa-PSMA-11) UV-signal with correction for the dead volume.
Image analysis
A dedicated workstation (Advantage Workstation Server, Volume Viewer 13.0 ext. 2; GE Healthcare) was used for image analysis. Lesion isocontours were drawn by applying a 41% threshold of the maximum uptake within the respective tumor (n = 50) in the OSEM images. The locations of the maximum pixels were then automatically propagated to the respective BSREM reconstructions where new isocontours were automatically redefined. The image noise level was calculated in terms of background variability (BV) in normal liver tissue by placing a spherical volume of interest (approximately 3 cm in diameter) in the right lobe and defined as the standard deviation divided by the mean standardized uptake value (SUVmean). The image quality was evaluated in terms of signal-to-noise ratio (SNR) and signal-to-background ratio (SBR) using the maximum SUV (SUVmax) of the tumors.
Clinical evaluation
PET images were evaluated by two nuclear medicine physicians and two residents (authors AS, JS, AA, NR). Only one of the observers (JS) had extensive prior experience in reading 68Ga-PSMA-11 images. Anonymized reconstructions were reviewed in randomized order in two parts: first, the number of tumors were counted in all reconstructions (80 reconstructions in total), and secondly, a set of four reconstructions of each patient (n = 20, OSEM 3 iterations/16 subsets 5 mm gaussian postprocessing filter, BSREM β 400, 900 and 1300) were ranked from best to worst in terms of lesion conspicuity, image sharpness and overall image quality. The reviewers were blinded to the order and type of reconstruction method.
Statistical analysis
GraphPad Prism 7.03 and MATLAB 2016b (MathWorks) were used for graphing and statistical analysis. Comparisons were made with reference to OSEM (3 iterations/16 subsets, 5 mm gaussian postprocessing filter, TOF, and PSF recovery) using a paired non-parametric two-tailed t-test (Wilcoxon's signed rank test), and differences were considered statistically significant for p < 0.05. In the tumor count statistics, patients with more than 30 lesions were excluded in the statistical tests.
Results
The effect of using BSREM compared with OSEM on image noise was clearly noticeable (Figure 1-3). Figure 1 shows that the uniform uptake region of the liver is smoother with BSREM β-value 900 and 1200 compared with OSEM. Mean BV was 15.3% using OSEM whereas BV for BSREM was highest at 36.5% with β 100 and decreased to 8.3% with β 1300 (p < 0.01 for β-values ≥ 400) (Figure 4, Table 2). Reduction of the acquisition time by half (1 min/bp) resulted in a BV lower than 15%, the full-length OSEM BV, with β-value 800 or more (p < 0.0001). At 0.5 min/bp, BSREM with a β-value equal to or higher than 1200 resulted in BV lower than 15% (p < 0.01 for β-values ≥ 1200) (Figure 4).
Figure 1
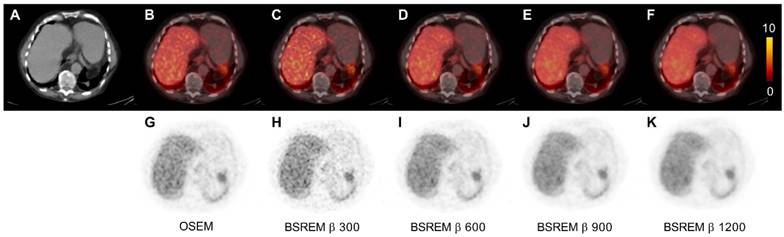
Transversal low dose CT (A), PET (G-K) and fused PET/CT images (B-F) of a PCa patient. The PET images were reconstructed with 2 min per bed position using OSEM (3 iterations/16 subsets, and a 5-mm gaussian postprocessing filter) and BSREM with β-values 300, 600, 900 and 1200. BSREM: block-sequential regularized expectation maximization; OSEM: ordered subsets expectation maximization.
Figure 2
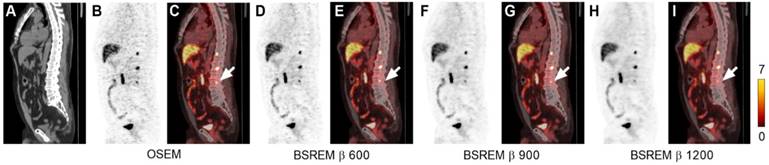
Sagittal low dose CT (A), PET (B,D,F,H) and fused PET/CT images (C,E,G,I) of a PCa patient with local recurrence and bone metastases. The PET images were reconstructed with 2 min per bed position using OSEM (3 iterations/16 subsets, and a 5-mm gaussian postprocessing filter) and BSREM with β-values 600, 900 and 1200. SUVmax of the bone metastasis (arrow) for each respective reconstruction were 8.14, 8.33, 5.10, and 3.87 (OSEM, BSREM β-values 600, 900 and 1200, respectively). BSREM: block-sequential regularized expectation maximization; OSEM: ordered subsets expectation maximization.
Table 2
Liver tissue reference and lesion metrics using OSEM (3 iterations/16 subsets, and a 5-mm gaussian postprocessing filter) and BSREM image reconstruction, both including TOF and PSF recovery, with an acquisition time of 2 min/bed position. Mean (range).
| Reconstruction | Background SUVmean | Noise BV % | SNR | SBR |
|---|---|---|---|---|
| OSEM | 5.2 (1.7-8.9) | 15.2 (10.6-22.1) | 120.9 (21.7-634.2) | 4.5 (0.7-46.2) |
| BSREM β 100 | 5.2 (1.7-9.1) | 36.4 (21.6-62.2) | 105.1 (20.4-287.7) | 8.2 (2.0-60.9) |
| BSREM β 200 | 5.2 (1.7-9.1) | 22.3 (14.5-37.2) | 136.0 (27.6-448.6) | 6.8 (1.4-56.4) |
| BSREM β 300 | 5.2 (1.7-9.1) | 17.1 (11.7-27.1) | 152.2 (31.6-569.8) | 6.1 (1.2-54.0) |
| BSREM β 400 | 5.2 (1.7-9.1) | 14.4 (9.5-21.9) | 163.7 (33.1-660.6) | 5.7 (1.0-51.9) |
| BSREM β 500 | 5.2 (1.7-9.1) | 12.8 (8.4-18.6) | 171.1 (34.7-719.1) | 5.4 (0.9-50.3) |
| BSREM β 600 | 5.2 (1.7-9.1) | 11.7 (7.5-17.0) | 177.7 (37.1-775.5) | 5.1 (0.8-49.0) |
| BSREM β 700 | 5.2 (1.7-9.0) | 10.8 (7.0-15.4) | 183.5 (38.6-826.6) | 4.9 (0.8-47.6) |
| BSREM β 800 | 5.2 (1.7-9.0) | 10.2 (6.6-14.2) | 188.2 (39.7-885.9) | 4.8 (0.7-46.5) |
| BSREM β 900 | 5.2 (1.7-9.0) | 9.8 (6.2-13.8) | 191.4 (41.1-927.6) | 4.6 (0.7-45.6) |
| BSREM β 1000 | 5.2 (1.7-9.0) | 9.3 (5.9-13.0) | 194.5 (42.0-945.2) | 4.5 (0.7-44.5) |
| BSREM β 1100 | 5.2 (1.7-9.0) | 9.0 (5.7-12.6) | 196.2 (42.3-961.3) | 4.4 (0.7-43.6) |
| BSREM β 1200 | 5.2 (1.7-9.0) | 8.7 (5.5-11.7) | 199.0 (41.1-1019.1) | 4.3 (0.7-42.8) |
| BSREM β 1300 | 5.2 (1.7-9.0) | 8.4 (5.3-11.7) | 201.2 (41.5-1043.1) | 4.2 (0.6-42.0) |
BSREM: block-sequential regularized expectation maximization; BV: background variability; OSEM: ordered subsets expectation maximization; PSF; point-spread function; SBR: signal-to-background ratio; SNR: signal-to-noise ratio; SUV: standardized uptake value; TOF: time-of-flight.
Figure 3
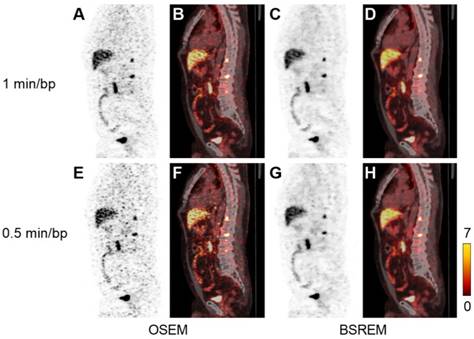
Sagittal PET (A,C,E,G) and fused PET/CT images (B,D,F,H) of a PCa patient with local recurrence and bone metastases (same patient as in Figure 2). The PET images were reconstructed with 1 and 0.5 min per bed position using OSEM (3 iterations/16 subsets, and a 5-mm gaussian postprocessing filter) and BSREM with β-values 1200 (top) and 1600 (bottom). BSREM: block-sequential regularized expectation maximization; OSEM: ordered subsets expectation maximization.
Figure 4
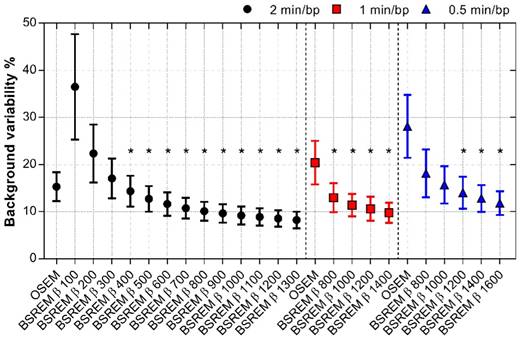
BV of normal liver tissue for OSEM and BSREM image reconstructions, including TOF and PSF recovery, using various parameter settings, and data acquisition of 2, 1 and 0.5 min per bed position. Asterisk indicates significantly lower BV (p < 0.05) compared to the reference OSEM (3 iterations/16 subsets, 5 mm postprocessing filter, 2 min per bed position). The markers show mean ± SD. BSREM: block-sequential regularized expectation maximization; OSEM: ordered subsets expectation maximization.
The SNR improved by 25 to 66% with BSREM compared to OSEM, with a significantly higher SNR for β-values of 200 or more (p < 0.0001). A shortened acquisition time slightly reduced the SNR, although BSREM with β-values in the range of 800-1400 for 1 min/bp, and β-values 800-1600 for 0.5 min/bp still resulted in higher ratios than OSEM at the full acquisition time (p < 0.01) (Figure 5).
The SBR decreased with increasing β-values using BSREM, showing higher SBR for BSREM using β-values below 800 (p < 0.02). However, the SBR remained more or less similar to that of OSEM in the β-value range 800 to 900. Shortening the acquisition time resulted in the SBR ratio improving 6-18% with BSREM β-values 800-1000 (p < 0.0001 for β 800) and 2-43% with β-values 800-1400 (p < 0.02 for β-values 800-1200) compared with OSEM (2 min/bp) for 1 and 0.5 min/bp, respectively (Figure 6).
The trade-off between SBR and SNR is shown in Figure 7A-B, demonstrating that BSREM with a β-value of 900 resulted in a similar SBR, combined with a 60% improvement in SNR compared with OSEM using 2 min/bp. On the other hand, if maximum recovery in small lesions is desired, a β-value as low as 100 resulted in a more than 2-fold increase in SBR at similar SNR levels as those obtained with OSEM.
The clinical image quality evaluation resulted in highest mean ranking of the OSEM and BSREM β 900 reconstructions regarding overall image quality, whereas BSREM β 400 was the preferred reconstruction in the categories; image sharpness and tumor detectability (Figure 8). The interobserver agreement on image quality ranking was low. The physician with extensive experience of reading 68Ga-PSMA-11 PET/CT scans ranked β 900 highest in all three categories. The mean number of tumors found was highest for β 900 and lowest for β 1300 (mean 8.3 vs. 7.5, respectively). For individual observers, no significant differences in the number of detected lesions were found between reconstruction methods (p > 0.05 Wilcoxon's signed rank test). When considering the average number of lesions detected by all four observers, a significance decrease in number of detected lesions was found for β 1300 compared to OSEM (p = 0.0225) whereas β 400 and 900 did not differ significantly from OSEM.
Figure 5
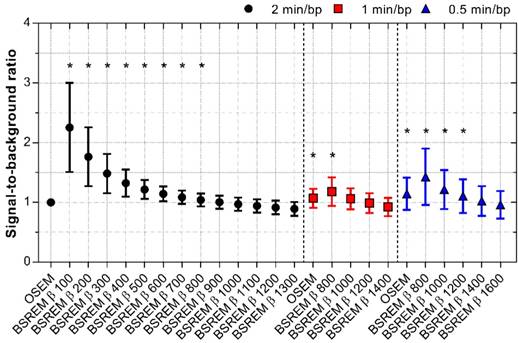
SBR for OSEM and BSREM image reconstructions, including TOF and PSF recovery, using various parameter settings, and data acquisition of 2, 1 and 0.5 min per bed position. The data were normalized to OSEM (3 iterations/16 subsets, 5 mm gaussian postprocessing filter, 2 min per bed position) and asterisk indicates significantly higher SBR (p < 0.05) compared to the reference OSEM. The markers show mean ± SD. BSREM: block-sequential regularized expectation maximization; OSEM: ordered subsets expectation maximization.
Figure 6
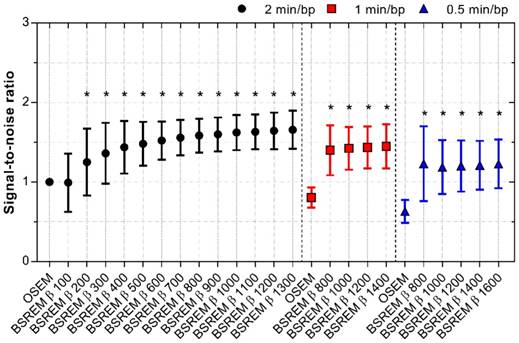
SNR for OSEM and BSREM image reconstructions, including TOF and PSF recovery, using various parameter settings, and data acquisition of 2, 1 and 0.5 min per bed position. The data were normalized to OSEM (3 iterations/16 subsets, 5 mm gaussian postprocessing filter, 2 min per bed position) and asterisk indicates significantly higher SNR (p < 0.05) compared to the reference OSEM. The markers show mean ± SD. BSREM: block-sequential regularized expectation maximization; OSEM: ordered subsets expectation maximization.
Figure 7
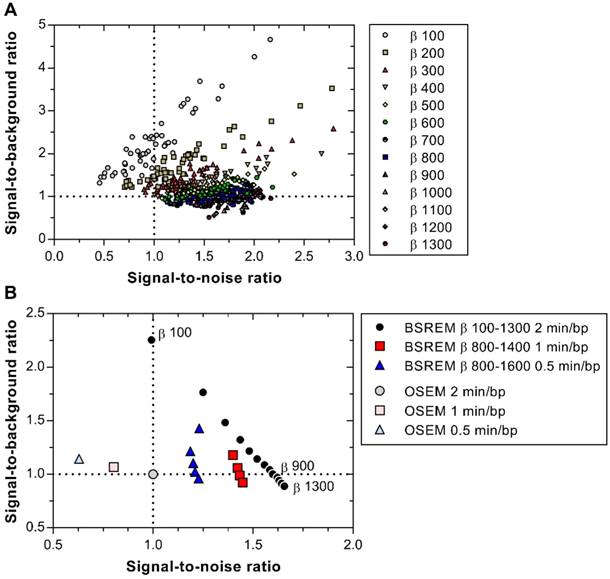
SBR versus SNR of 50 individual lesions with BSREM image reconstruction using β-values of 100-1300 (including TOF and PSF recovery) and 2 min per bed position (A). Mean SBR versus mean SNR for BSREM and OSEM image reconstructions, both including TOF and PSF recovery, for 2, 1 and 0.5 min per bed position (B). The data in both graphs were normalized to OSEM (3 iterations/16 subsets, 5 mm gaussian postprocessing filter, 2 min per bed position). BSREM: block-sequential regularized expectation maximization; OSEM: ordered subsets expectation maximization.
Figure 8
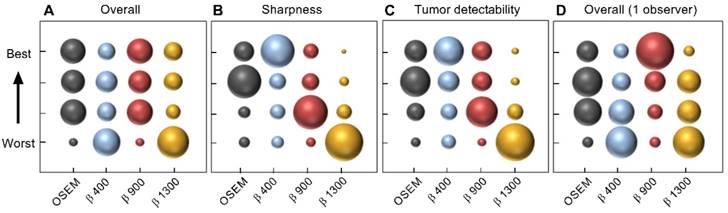
Image quality ranking of reconstructed images by four observers according to overall image quality (A), image sharpness (B), tumor detectability (C), and the separate ranking of overall image quality of one of the observers with extensive experience (D). Twenty examinations were assessed, each examination was reconstructed by four different methods. Reconstruction methods were OSEM (3 iterations/16 subsets, 5 mm gaussian postprocessing filter) and BSREM (β 400, 900, 1300), including TOF and PSF recovery. The area of the marker represents ranking frequency (maximum frequency = 80 in A-C and 20 in D).
Discussion
Whole-body 68Ga-PSMA-11 PET/CT in PCa patients provides accurate means for localization, staging, surveillance and early detection of recurrent disease, as well as therapy monitoring.
The present study comprised patients with biochemical recurrence of PCa after primary curative intended treatment for whom subsequent therapeutic choice relies on accurate restaging to determine the extent of the disease. For such restaging, improved SBR and SNR should allow for more accurate lesion delineation.
Standard of care imaging is insensitive for detecting recurrence at low PSA levels. However, studies on 68Ga-PSMA-11 PET have shown the possibility of discriminating recurrent PCa at an early stage, even if PSA is low [21]. The PET/CT examinations analyzed in this study were obtained from patients included in a prospective study on the clinical benefits of 68Ga-PSMA-11, with one inclusion criteria being well-established recurrence; hence the PSA range was very wide. This implies that the data included in this work is not suitable for assessment of the effects of BSREM on treatment decisions.
The evaluation of BSREM image reconstruction of 68Ga-PSMA-11 PET/CT demonstrated that any β-value between 100 and 900 results in SNR and SBR as good as or better than OSEM, whereas a β-value between 400 and 800 resulted in significantly improved SBR and SNR, as well as lower BV, given a 2 min/bp acquisition time at 1 h post injection of 2.0 MBq/kg 68Ga-PSMA-11 (Figure 7B). It should be mentioned that no further optimization of the OSEM algorithm was performed, as this method is well established in the clinical routine and has previously been optimized.
The study design and choice of β-values were based on previous studies analyzing the effect on image quality using BSREM compared to OSEM [16-18]. In a preceding study evaluating 18F-FDG on the same digital TOF PET/CT scanner, a β-value of 400 was found to provide the optimal gain in image quality compared to OSEM. The optimal β-value was, however, considered the one that yielded noise equivalent to that of OSEM [18]. Different radiotracer characteristics will likely influence the choice of β-value. The optimal settings of the BSREM algorithm may therefore not necessarily produce the desired results for PET/CT with other radiotracers, which thus need to be evaluated specifically for each tracer and clinical application.
The visual image quality evaluation was designed according to a ranking structure to enforce the observers to rate the image reconstructions relative to each other. The outcome resulted in larger discrepancies between the evaluated reconstructions than what was previously found for 18F-FDG, by using an arbitrary scale to rate the images [18]. Considering the low interobserver agreement, we chose to highlight the results from the observer with solely extensive experience of 68Ga-PSMA-11 image reading, who clearly preferred BSREM β 900 over the other reconstruction methods. In hindsight, it might have been better if we would have been able to include more experienced observers with a clearer consensus on what constitutes good image quality for this tracer. As the experience with this tracer is so far limited at our center this was not possible. We do however suggest that future multicenter studies on this subject should be conducted.
No previous studies on 68Ga-PSMA-11 PET/CT have analyzed BSREM image reconstruction data acquired on a digital TOF PET/CT scanner. 68Ga-PSMA-11 was however evaluated on a Signa PET/MRI scanner (GE Healthcare), which uses the same detector technology as the one used in the present work, and the authors found that a β-value between 400 and 500 achieved an optimal tradeoff between high SUVmax and background noise [22]. This slightly lower optimal β-value reported for PET/MRI, compared to that in the present PET/CT study may have several reasons. The most straightforward explanation for the different results is the choice of defining SUVmax as the average of the five hottest voxels in the lesion instead of considering the single hottest voxel within the lesion. This former option was not available with the workstation used in the present study. Inclusion of several voxels instead of a single voxel reduces statistical noise, and even more so for high-noise reconstructions such as OSEM, but also BSREM with low β-values, which may favor lower β-values yielding the largest SNR increase at constant SBR. Other explanations could relate to the varying properties between the different types of scanners that may affect the results. Firstly, the sensitivity of the Signa PET/MRI is higher than that of the Discovery MI PET/CT (circa 23 vs 14 cps/kBq), mainly because of its larger axial FOV. Secondly, the presence of coils inside the PET FOV, combined with the smaller detector ring diameter of the PET/MRI (60 vs 80 cm) results in considerably higher scatter fractions and consequently a more challenging scatter correction. Thirdly, the MR-based attenuation correction of the PET/MRI does not account for bone as compared to that by CT, although it is not obvious how this would affect the results when comparing OSEM to BSREM.
Thus, the β-value considerably influenced the lesion localization accuracy, quantification, and image contrast. The resulting benefits of the BSREM setting optimization on visual assessment at image reading need to be evaluated as well as its impact on the treatment decision, therapy monitoring and overall patient management. In particular, the relation between intensity variations in dynamic PET acquisitions and SUV measurements presents strong interest for the further research to develop quantitative image assessment methods that are relevant to clinical routine applications.
Conclusions
Improved target-to-background uptake ratio could be achieved with BSREM reconstruction compared to OSEM. BSREM image reconstruction with β-values within the range of 400-900 resulted in lower BV, and similar or improved SNR and SBR. BSREM also enabled a shorter acquisition time by adjustment of the β-value. A visual assessment found a slight overall preference for BSREM β 900, although with a high interobserver variability.
Abbreviations
Bp: bed position; BSREM: block-sequential regularized expectation maximization; BV: background variability; CT: computed tomography; FOV: field of view; MRI: magnetic resonance imaging; OSEM: ordered subsets expectation maximization; PCa: prostate cancer; PET: positron emission tomography; PSA: prostate-specific antigen; PSF: point-spread function; PSMA: prostate-specific membrane antigen; SBR: signal-to-background ratio; SD: standard deviation; SNR: signal-to-noise ratio; SUV: standardized uptake value; TOF: time-of-flight.
Acknowledgements
The staff at Uppsala Hospital PET Centre performing the image examinations are greatly acknowledged. Dr. Steve Ross, Dr. Charles Stearns and Tarik Cengiz from GE Healthcare kindly offered their assistance on technical image reconstruction queries. This study was financed by the Swedish Cancer Society (grant CAN 2016/835) and the regional agreement on medical training and clinical research (ALF) between Uppsala University Hospital and Uppsala County.
Competing Interests
A collaborative research agreement between Uppsala University Hospital and GE Healthcare partly financed this study (P.I. ML), covering the salary for EL. The other authors report no disclosures or potential conflicts of interest.
References
1. Ferlay J, Ervik M, Lam F, Colombet M, Mery L, Piñeros M, et al (2018). Global Cancer Observatory: Cancer Today. Lyon, France: International Agency for Research on Cancer. https://gco.iarc.fr/today
2. European Association of Urology, Prostate Cancer Guideline. Chapters of the 2018 EAU PCa Guideline. http://uroweb.org/guideline/prostate-cancer/
3. Demirci E, Sahin OE, Ocak M, Akovali B, Nematyazar J, Kabasakal L. Normal distribution pattern and physiological variants of 68Ga-PSMA-11 PET/CT imaging. Nucl Med Commun. 2016;37:1169-79
4. Perner S, Hofer MD, Kim R, Shah RB, Li H, Möller P. et al. Prostate-specific membrane antigen expression as a predictor of prostate cancer progression. Hum Pathol. 2007;38:696-701
5. Eder M, Eisenhut M, Babich J, Haberkorn U. PSMA as a target for radiolabelled small molecules. Eur J Nucl Med Mol Imaging. 2013;40:819-23
6. Frenzel T, Tienken M, Abel M, Berliner C, Klutmann S, Beyersdorff D. et al. The impact of [68Ga]PSMA I&T PET/CT on radiotherapy planning in patients with prostate cancer. Strahlenther Onkol. 2018;194:646-54
7. Calais J, Czernin J, Cao M, Kishan AU, Hegde JV, Shaverdian N. et al. 68Ga-PSMA-11 PET/CT mapping of prostate cancer biochemical recurrence after radical prostatectomy in 270 patients with a PSA level of less than 1.0 ng/mL: impact on salvage radiotherapy planning. J Nucl Med. 2018;59:230-7
8. Liu C, Liu T, Zhang N, Liu Y, Li N, Du P. et al. 68Ga-PSMA-617 PET/CT: a promising new technique for predicting risk stratification and metastatic risk of prostate cancer patients. Eur J Nucl Med Mol Imaging. 2018;45:1852-61
9. Janssen JC, Meißner S, Woythal N, Prasad V, Brenner W, Diederichs G. et al. Comparison of hybrid 68Ga-PSMA-PET/CT and 99mTc-DPD-SPECT/CT for the detection of bone metastases in prostate cancer patients: Additional value of morphologic information from low dose CT. Eur Radiol. 2018;28:610-9
10. Alonso O, Dos Santos G, García Fontes M, Balter H, Engler H. 68Ga-PSMA and 11C-Choline comparison using a tri-modality PET/CT-MRI (3.0 T) system with a dedicated shuttle. Eur J Hybrid Imaging. 2018;2:9
11. Uprimny C, Svirydenka A, Fritz J, Kroiss AS, Nilica B, Decristoforo C. et al. Comparison of [68Ga]Ga-PSMA-11 PET/CT with [18F]NaF PET/CT in the evaluation of bone metastases in metastatic prostate cancer patients prior to radionuclide therapy. Eur J Nucl Med Mol Imaging. 2018;45:1873-83
12. Boellaard R, van Lingen A, Lammertsma AA. Experimental and clinical evaluation of iterative reconstruction (OSEM) in dynamic PET: quantitative characteristics and effects on kinetic modeling. J Nucl Med. 2001;42:808-17
13. Nuyts J, Bequé D, Dupont P, Mortelmans L. A concave prior penalizing relative differences for maximum-a-posteriori reconstruction in emission tomography. IEEE Trans Med Imaging. 2002;49:56-60
14. De Pierro AR, Yamagishi MEB. Fast EM-like methods for maximum 'a posteriori' estimates in emission tomography. IEEE Trans Med Imaging. 2001;20:280-8
15. Ross S. Q.Clear White Paper. Chicago, IL: GE Healthcare. 2014
16. Teoh EJ, McGowan DR, Bradley KM, Belcher E, Black E, Gleason FV. Novel penalised likelihood reconstruction of PET in the assessment of histologically verified small pulmonary nodules. Eur Radiol. 2016;26:576-84
17. Sah BR, Stolzmann P, Delso G, Wollenweber SD, Hüllner M, Hakami YA. et al. Clinical evaluation of a block sequential regularized expectation maximization reconstruction algorithm in 18F-FDG PET/CT studies. Nucl Med Commun. 2017;38:57-66
18. Lindström E, Sundin A, Trampal C, Lindsjö L, Ilan E, Danfors T. et al. Evaluation of penalized-likelihood estimation reconstruction on a digital time-of-flight PET/CT scanner for 18F-FDG whole-body examinations. J Nucl Med. 2018;59:1152-8
19. Hsu DFC, Ilan E, Peterson WT, Uribe J, Lubberink M, Levin CS. Studies of a next generation silicon-photomultiplier-based time-of-flight PET/CT system. J Nucl Med. 2017;58:1511-8
20. Pharmacopoeia European. Gallium (68Ga) chloride solution for radiolabelling. Pharmeuropa. 2011;23:508-9
21. Roach PJ, Francis R, Emmett L, Hsiao E, Kneebone A, Hruby G. et al. The impact of 68Ga-PSMA PET/CT on management intent in prostate cancer: Results of an Australian prospective multicenter study. J Nucl Med. 2018;59:82-8
22. Ter Voert EEGW, Muehlematter UJ, Delso G, Pizzuto DA, Müller J, Nagel HW. et al. Quantitative performance and optimal regularization parameter in block sequential regularized expectation maximization reconstructions in clinical 68Ga-PSMA PET/MRI. EJNMMI Res. 2018;8:70
Author contact
![]() Corresponding author: Elin Lindström, PhD student at Uppsala University. E-mail: elin.lindstromuu.se
Corresponding author: Elin Lindström, PhD student at Uppsala University. E-mail: elin.lindstromuu.se
Citation styles
APA
Lindström, E., Velikyan, I., Regula, N., Alhuseinalkhudhur, A., Sundin, A., Sörensen, J., Lubberink, M. (2019). Regularized reconstruction of digital time-of-flight 68Ga-PSMA-11 PET/CT for the detection of recurrent disease in prostate cancer patients. Theranostics, 9(12), 3476-3484. https://doi.org/10.7150/thno.31970.
ACS
Lindström, E.; Velikyan, I.; Regula, N.; Alhuseinalkhudhur, A.; Sundin, A.; Sörensen, J.; Lubberink, M. Regularized reconstruction of digital time-of-flight 68Ga-PSMA-11 PET/CT for the detection of recurrent disease in prostate cancer patients. Theranostics 2019, 9 (12), 3476-3484. DOI: 10.7150/thno.31970.
NLM
Lindström E, Velikyan I, Regula N, Alhuseinalkhudhur A, Sundin A, Sörensen J, Lubberink M. Regularized reconstruction of digital time-of-flight 68Ga-PSMA-11 PET/CT for the detection of recurrent disease in prostate cancer patients. Theranostics 2019; 9(12):3476-3484. doi:10.7150/thno.31970. https://www.thno.org/v09p3476.htm
CSE
Lindström E, Velikyan I, Regula N, Alhuseinalkhudhur A, Sundin A, Sörensen J, Lubberink M. 2019. Regularized reconstruction of digital time-of-flight 68Ga-PSMA-11 PET/CT for the detection of recurrent disease in prostate cancer patients. Theranostics. 9(12):3476-3484.
This is an open access article distributed under the terms of the Creative Commons Attribution (CC BY-NC) license (https://creativecommons.org/licenses/by-nc/4.0/). See http://ivyspring.com/terms for full terms and conditions.