Theranostics
13.3
Impact Factor
- Current Issue
- Advance Articles
- Volume 16; 2026
- Volume 15; 2025
- Volume 14; 2024
- Volume 13; 2023
- Volume 12; 2022
- Archive
- Cover Images
- Cover Suggestion
- Special Issues
Top
Introduction
Results and Discussion
Conclusion
Experimental Section
Abbreviations
Supplementary Material
Acknowledgements
References
Introduction
Results and Discussion
Conclusion
Experimental Section
Abbreviations
Supplementary Material
Acknowledgements
References
International Journal of Biological Sciences
International Journal of Medical Sciences
 Global reach, higher impact

Theranostics 2019; 9(12):3515-3525. doi:10.7150/thno.32742 This issue Cite
Research Paper
GSH Activated Biotin-tagged Near-Infrared Probe for Efficient Cancer Imaging
Ruiying Guo1*, Feng Huang1*, Bo Zhang2*, Youyou Yan2, Jinxin Che1, Yizhen Jin 1, Yuxin Zhuang1, Rong Dong2, Yangling Li2, Biqin Tan2, Rui Song3, Yongzhou Hu1, Xiaowu Dong1 ![]() , Xin Li1
, Xin Li1 ![]() , Nengming Lin2
, Nengming Lin2 ![]()
1. College of Pharmaceutical Sciences, Zhejiang University, Hangzhou 310058, China
2. Translational Medicine Research Center, Affiliated Hangzhou First People's Hospital, Zhejiang University School of Medicine, Hangzhou 310006, China
3. Department of Pathology, The Second Affiliated Hospital, Zhejiang University School of Medicine, Hangzhou 310009, China
*These authors contributed equally to this work.
Received 2019-1-2; Accepted 2019-4-29; Published 2019-5-26
Citation:
Guo R, Huang F, Zhang B, Yan Y, Che J, Jin Y, Zhuang Y, Dong R, Li Y, Tan B, Song R, Hu Y, Dong X, Li X, Lin N. GSH Activated Biotin-tagged Near-Infrared Probe for Efficient Cancer Imaging. Theranostics 2019; 9(12):3515-3525. doi:10.7150/thno.32742. https://www.thno.org/v09p3515.htm
Other stylesAbstract

Tumor imaging tools with high specificity and sensitivity are needed to aid the boundary recognition in solid tumor diagnosis and surgical resection. In this study, we developed a near infra-red (NIR) probe (P6) for in vitro/in vivo tumor imaging on the basis of the dual strategy of cancer cell targeting and stimulus-dependent activation. The selective imaging capacity towards cancer cells of P6 was thoroughly investigated, and the potential mechanisms of endocytosis were preliminary explored.
Methods: GSH-activated biotin labelled NIR probe (P6) was designed, synthesized and characterized. The GSH responsive properties were systematically illustrated through UV-vis, fluorescent tests and LC-MS analysis. In vitro fluorescent imaging of probe P6 was collected in various living cancer cell lines (i.e. SW480, HGC-27, H460, BxPC-3, KHOS) and normal cell lines (i.e. BEAS-2B, HLF-1, THP1) under confocal laser scanning microscopy. Probe P6 was further applied to image primary human cancer cells which were freshly isolated from the peritoneal carcinoma and rectal cancer patients. Serial sections of human tumor tissues were collected and sent for H&E (hematoxylin-eosin) staining and P6 imaging. Live fluorescent and photoacoustic imaging were used to investigate the in vivo imaging of P6 in both tumor and normal tissues in HGC-27 and KHOS xenograft model.
Results: Probe P6 could be recognized and transported into cancer cells by tumor specific biotin receptors and efficiently be triggered by GSH to release fluorophore 4. In fact, the cellular uptake of P6 could be partially blocked by the addition of free biotin. Furthermore, probe P6 could image various cancer cell lines, as well as primary cancer cells, exhibiting a ten-fold increase in fluorescence intensity over normal cells. In freshly dissected cancer tissues, P6 fluorescent imaging distinguished the cancerous area under confocal laser scanning microscopy, which was exact the same area as indicated by H&E staining. We also found that P6 exhibited superior selectivity against cancer tissues by local injection.
Conclusion: In this study, we developed a dual-modal NIR probe P6 with enhanced cellular uptake into cancer cells and environmental stimulus triggered fluorescence. Our strategy provided a novel insight into the development of imaging tools that could be potentially used for fluorescent image-guided cancer boundary recognition and possibly cancer diagnosis.
Keywords: GSH activation, Near-Infrared (NIR) imaging, boundary recognition, In Vivo Imaging, histopathological analyses
Introduction
Surgical resection is one of the main curative options for most solid tumors [1, 2], the extent of which is commonly assessed by pathological evaluation of the dissected specimen margin(s) to verify whether the entire tumor has been removed. However, it is very challenging to precisely define the boundaries between the tumor and surrounding normal tissues [3]. Since the accuracy of resection remarkably affects patient prognosis, it is vital to ensure complete resection of the tumor tissues and minimize the damage to normal tissues [3]. To conquer this obstacle, several imaging techniques are currently used to aid surgical demarcation of tumor tissue, such as γ scintigraphy [4], positron emission tomography (PET) [5, 6], magnetic resonance imaging (MRI) and fluorescence imaging [7-13]. Fluorescent probes, especially those with near-infrared (NIR) emission, are highly promising due to its relatively high spatial resolution, lower costs and simple preparation [14-17]. So far two NIR fluorophores (e.g. methylene blue and indocyanine green) have been clinically used at present [18], demonstrating the feasibility of clinical application of NIR probes. Recently, several strategies have been developed to improve the specificity against tumors, including incorporation of ligands specific for tumor cell-surface receptors [19-25], inherent chemical structure modification [26], and acidity/hypoxia-stimulated release [27-29].
The consumption of biotin (also known as vitamin H) in cancer cells is much higher than that in normal cells [30]. As such, the multi-vitamin transporter is generally overexpressed in many cancer cells (e.g. lung, colon, ovarian, breast and gastric cancer) [31, 32], providing theoretical basis for biotin-tagged probes which shows high affinity to tumor cells [33-35]. Additionally, the stimuli-dependent strategy for imaging probe can allow the probe to be selectively released only in the presence of the specific environment, such as reactive oxygen species (ROS) [36], enzymes [37-39], pH value [40] etc. GSH, the most abundant thiols in living cells, is found elevated in many types of cancer and can be utilized as a suitable stimulus for the design of tumor imaging probe [41-43]. Herein, we report a GSH activated biotin-tagged NIR probe P6 (Figure 1) that exhibits sensitive and specific imaging features for cancer cells. Probe P6 can be recognized and transported into cancer cells by tumor specific biotin receptors and efficiently be triggered by GSH to release the fluorophore 4, thereby making various cancer cells to be visualized under confocal microscopy. The cellular uptake of P6 is investigated and is found through not only biotin-receptor mediated process, but also caveolae-dependent endocytosis. Furthermore, frozen serial sections of human tumor tissues and in vivo xenograft models were used to demonstrate that probe P6 presented be a promising agent for imaged-guide histopathological analyses in living systems and its potential application in boundary recognition for surgical resection and possibly diagnosis.
Figure 1
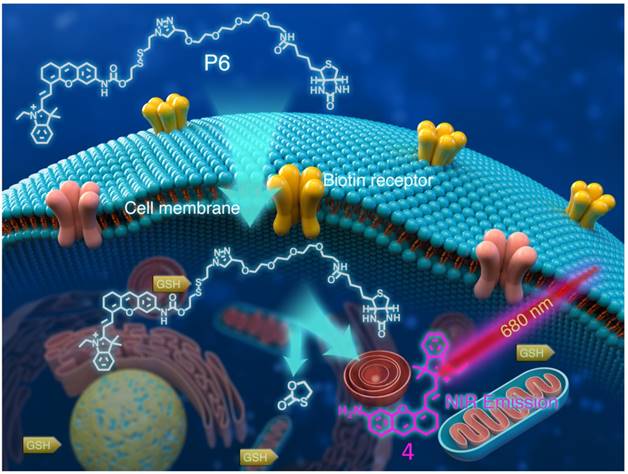
Structure of P6 and its working mechanism. P6 was selectively recognized by Biotin receptor positive cancer cells and activated in the presence of intracellular GSH to release the fluorophore.
Figure 2
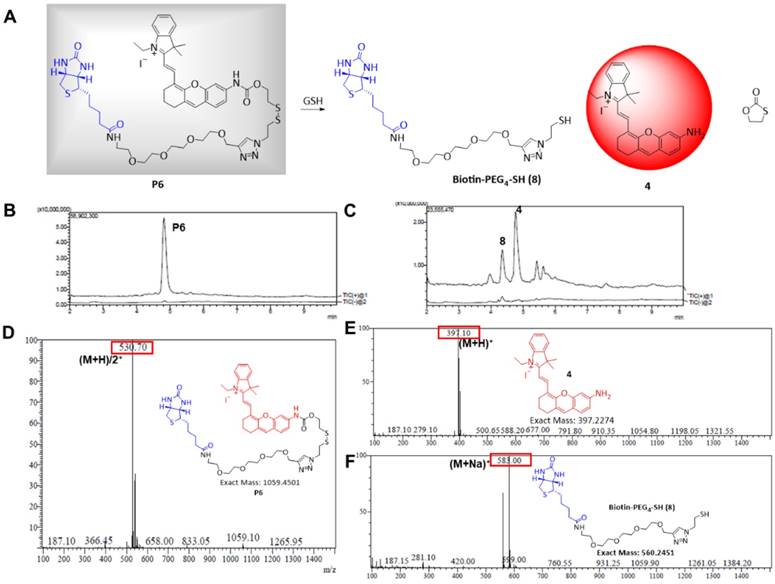
Responsiveness of P6 to GSH. (A) Proposed mechanism of P6 response to GSH. Total ion chromatogram showing peaks of (B) 4.95 min, P6; (C) 4.42 min, 8; 4.85 min, 4. MS spectra showing (D) peak P6 (E) peak 4 (F) peak 8 in positive ion mode.
Results and Discussion
Design and Synthesis of the P6 probe
The amino (-NH2) containing NIR fluorophore 4 was selected because of its good biocompatibility, high quantum efficiency, and suitability for living organism (Figure 2A) [44-46]. This fluorescent recovery was designed based on an intramolecular charge transfer (ICT) process which was commonly accepted and used in previous reports [47,48]. The fluorescence of 4 was quenched in P6 because of the ICT hindrance. After the GSH nucleophilic attacked the disulfide bond in P6, the 1,3-oxathiolan-2-one was formed subsequently, the fluorophore 4 was released and showed significant fluorescence enhancement attributing to the ICT process recovered (Figure S1).
The NIR fluorophore 4 was synthesized as previously described [49], and a cleavable disulfide linker specifically responsive to GSH was then attached. Finally, an azide linker was used to join the biotin ligand to obtain the target compound P6 (Figure S2). Chemical structures were confirmed by 1H NMR, LC-MS, and that of the intermediate 7 and probe P6 were confirmed by HRMS and 13C NMR (see NMR and HRMS Spectra parts in supporting information).
GSH-activated release of fluorophore 4 and biotin from P6
The absorbance and fluorescence spectra of P6 are shown in Figure S3A and B, respectively. P6 (20 µM) fluoresced weakly at the NIR region (λem = 708 nm) in the absence of GSH. But in the presence of GSH (200 µM), the fluorescence intensity increased remarkably and was comparable to that of the same concentration of fluorophore 4 (Figure S3B), which indicated that GSH can activate fluorophore 4 released from probe P6. To confirm this hypothesis (Figure 2A), we incubated 20 µM of P6 with 10-fold higher levels of GSH in PBS for 1h, and monitored the reaction via LCMS. As shown in Figure 2B, the peak of P6 (m/z = 530+) disappeared in the presence of GSH, and coincided with the appearance of the respective peaks of biotin ligand 8 (m/z =583+) and the fluorophore 4 (m/z= 397+). To further verify the relationship between fluorescence intensity and GSH concentration, we incubated P6 with increasing doses of GSH. As shown in Figure 3A, the fluorescence intensity at 708 nm increased in a dose-dependent manner, reaching peak levels with 200 µM of GSH. Furthermore, activation of P6 was also time dependent, as the fluorescence intensity increased seven-fold within 1 hour of GSH exposure (Figure 3B). Therefore, probe P6 was highly responsive to GSH, and could potentially be activated in cancer cells which possessed abundant of GSH.
In order to determine the feasibility of P6 in biological systems, we evaluated its response to various ions, reductive species and amino acids. As shown in Figure 3C and D, no significant changes were observed with most of the tested reagents, except for the reductive Cys and Hcy which probably elicited similar responses due to their thiol groups. Taken together, P6 is a highly selective and sensitive probe that can be activated by the relatively high level of GSH produced by cancer cells, and therefore aid in tumor imaging and diagnosis.
Cellular uptake of probe P6 and fluorophore 4
Biotin was incorporated into P6 to enhance the selective uptake by cancer cells. Therefore, we compared the cellular uptake of P6 and fluorophore 4 in biotin receptor-positive A549 cells. As shown in Figure S4, cells incubated with 5μM of P6 showed five-fold higher fluorescence intensity than fluorophore 4 at the same concentration, indicating probe P6 with biotin moiety could be recognized by biotin receptors on cell membrane and uptaken specifically into cancer cells. However, without biotin conjugation, fluorophore 4 was less likely entering into cancer cells, leading to much lower fluorescence intensity than P6. Similar results were obtained with four additional cancer cell lines (Figure S5).
Figure 3
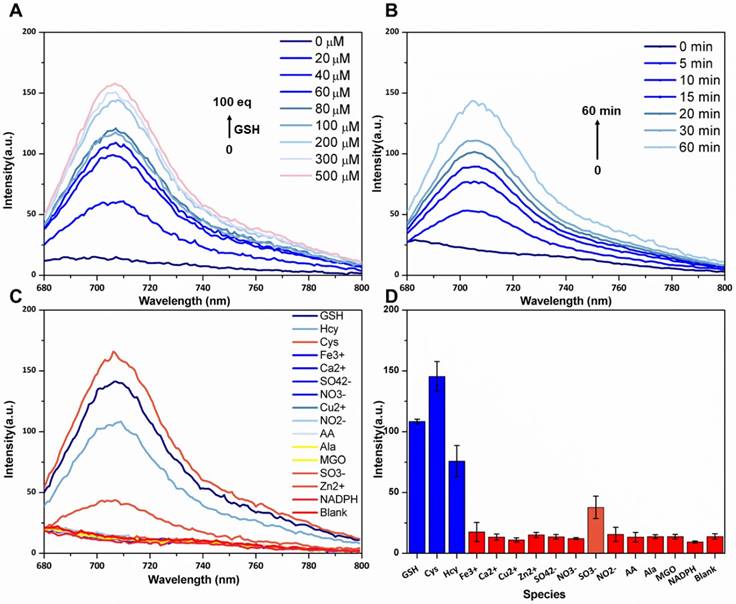
Dose-dependent, time-dependent and selectivity of various species fluorescence spectra. (A) Fluorescence spectra of P6 (5 µM) after treatment with increasing concentrations of GSH (0-100 equiv). (B) Time dependent fluorescence spectra of P6 (5 µM) after treatment with 50 µM GSH (0-60 min). (C, D) Fluorescence spectra and intensity of P6 (5 μM) after treatment with GSH, Cys, Hcy, Ala and other reducing species (NADPH, NO2-, SO32-, Methylglyoxal (MGO), ascorbic acid (AA),) and the NO3-, Fe3+, Ca2+, Zn2+ and Cu2+ ions (50 µM). Each spectrum was acquired at 37 ºC after incubation with GSH for 2 h in PBS (0.1M, pH 7.4 with 20% Acetonitrile), λex = 669 nm and λem = 708 nm.
Figure 4
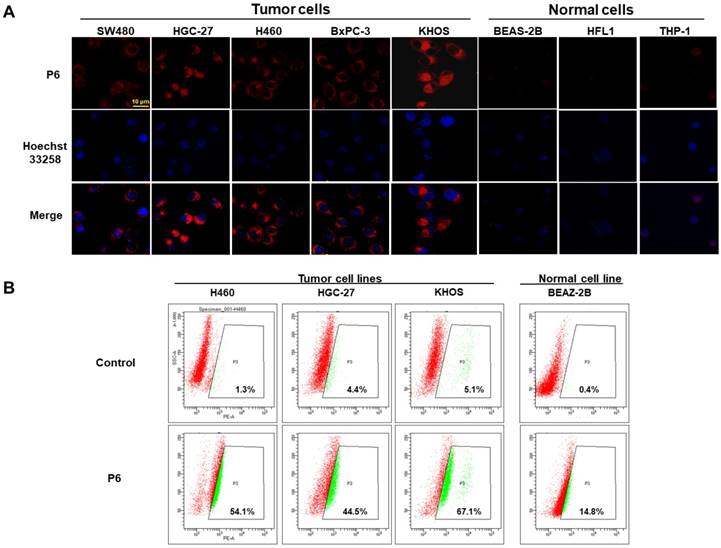
Selective cellular uptake of P6 into cancer cells. (A) Representative confocal laser scanning microscopy images of cancer cells (SW480, HGC-27, H460, BxPC-3 and KHOS cells) and normal cells (BEAS-2B, HFL1, THP-1) incubated with P6 (5 μM) at 37°C for 4 h. Cell nucleus were stained by DAPI. Probe P6 was visualized by excitation at 552 nm; fluorescence emission was observed using a 570-710 nm bandpass filter. DAPI was excited at 405 nm, and emission was detected from 420 to 540 nm. Scale bar = 20 μm. (B) Quantification of cellular uptake of P6 in cancer and normal cells by flow cytometry.
Selective cancer cell imaging in vitro
In order to test the selective uptake of P6 in cancer cells relative to normal cells, we incubated both cancer cells (SW480, HGC-27, H460, BxPC-3 and KHOS) and normal cells (BEAS-2B, HLF-1 and THP-1 cells) with P6, and observed the fluorescence using confocal laser scanning microscopy. As shown in Figure 4A, all cancer cells fluoresced brightly whereas almost no fluorescence was observed in normal cells, indicating selective imaging capacity of P6. Since fluorophore could be released from P6 after triggered by GSH, we analyzed the levels of GSH in these cell lines. As shown in Table S1, incubation with P6 resulted in GSH consumption in all cell types. However, the normal cell lines (except THP1) exhibited lower GSH levels compared to the cancer cells (Figure S6A). Furthermore, a positive correlation was observed between cellular GSH levels and fluorescent intensity after incubation with P6 (Figure S6B). The corrected total cell fluorescence (CTCF) of each cell line was quantified as reported previously [50]. Interestingly, the THP-1 cells showed low fluorescence despite high GSH levels, which we assumed that this may because of its low biotin receptor expression. However, there is no commercially available primary antibody against biotin receptor, thus making it difficult to quantify the biotin receptor in each cell line. Moreover, quantification of the fluorescence in cancerous and normal cells was conducted using flow cytometer at the same experimental conditions as used in confocal microscopy. As shown in Figure 4B, the percentages of positive cancer cells (also known as gated cell population) were much higher than that in normal cells, which was in consistent with the results from confocal experiments. Taken together, the GSH-triggered P6 can selectively image biotin receptor-expressing cancer cells.
Endocytosis mechanism of P6 in the cellular uptake of cancer cell
It has been demonstrated that P6 can specifically image cancer cells compared to normal cells, the underlying mechanism of selective uptake was yet to be unclear. A biotin competitive experiment was designed to validate our assumption that whether the process of entering cancer cells of P6 was mediated by biotin receptors. As a result, addition of free biotin, which was used to saturate the biotin receptor, resulted in about 50% decrease of fluorescence intensity compared with those with P6 only (Figure S7), suggesting that biotin conjugation substantially facilitated the uptake of P6 into cancer cells. Filipin III is a caveolae formation inhibitor that inhibits the lipid-raft mediated endocytosis. After the treatment of cancer cells with 5 μg/ml of Fillipin III for 4 h, the integrated fluorescence density was only one-third of that of P6 treatment (Figure S8 in Supporting Information), suggesting that the endocytosis of P6 was also dependent on the caveolae formation. Thus, we concluded that the biotin conjugation played a pivotal role in the selective cellular uptake of P6 into cancer cells, and the uptake of P6 may be the biotin receptor mediated endocytosis of cancer cells.
Cytotoxicity and intracellular localization of P6
The viability of the cells after P6 treatment was evaluated by CCK8 assay. While normal cells (BEAS-2B and HLF1) were not affected by P6, cancer cells showed moderately decreased viability after treatment of high concentrations of P6 (Figure S9). However, at the concentration used for cancer imaging, which was 5 μM, P6 exhibited little cytotoxicity in cancer cells. Furthermore, HGC-27 cells were co-incubated with P6 and Lyso Tracker Green or Mito Tracker Green, the results showed that a co-localization of P6 was found in both lysosomes and mitochondria (Figure 5), while the fluorescence in cell nucleus was hardly seen. It was reasonable that both lysosomes and mitochondria were abundant of GSH production [51], which may facilitate trigger the release of fluorophore from P6.
Figure 5
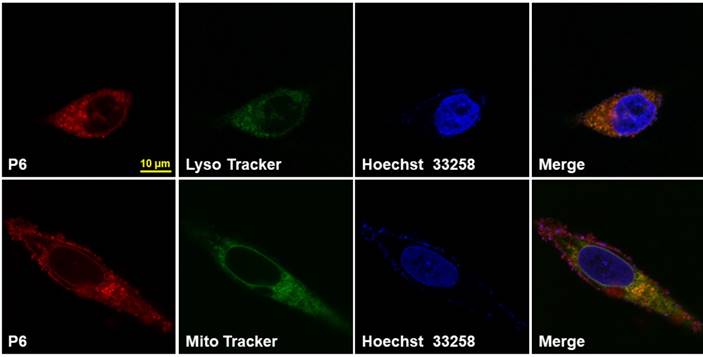
Intracellular localization of P6 in HGC-27 Cells. Representative confocal laser fluorescence microscopy images of HGC-27 cells incubated with 10 µM P6 for 4 h before observation. Probe P6 was visualized by excitation at 552 nm; fluorescence emission was observed using a 570-710 nm bandpass filter. Lyso/Mito tracker was excited at 488 nm; fluorescence emission was observed between 495 - 545 nm. Hoechst 33258 was excited at 405 nm, and emission was detected from 415 to 480 nm. Scale bar = 10 μm.
Primary cancer cell imaging and Histopathological analyses
For evaluating the clinical application ability of P6, we analyzed P6 imaging in patient-derived cancer cells at first. Tumor tissues from peritoneal carcinoma and rectal cancer were dissected, digested and filtered to obtain primary cancer cells, which were incubated with P6 for 4 h before observation. Primary cancer cells showed significantly higher fluorescence intensity than HFL-1 cells at the same experimental conditions (Figure 6), indicating the broad range of applicability of P6 towards cancer cells.
H&E staining is straightforward to distinguish cancerous cells from normal cells. However, H&E staining requires necessary preparation steps and at least 24 h before observation. During the surgery, an instant image is required to guide the dissection by defining the boundaries between cancerous and normal tissues. To determine whether P6 was capable of selectively label tumor cells in dissected cancer tissues, we used H&E staining and fluorescence to visualize serial section of the same tumor tissue. As shown in Figure 7A, the frozen serial sections of tumor tissues were divided into two groups, and was either routinely stained with hematoxylin and eosin (H&E) or confocal laser scanning microscopy after incubation with 10 µM of P6 for 4h. H&E staining was used as a golden standard method to precisely indicate the cancerous area in the section, and the closest serial section underwent fluorescent observation. In control group, the tumor tissue was cultured with medium only, and there was no fluorescence at all although the cancerous area was obvious indicated by H&E stain. However, after the incubation with P6, the fluorescence showed the exact cancerous area as in H&E stain (Figure 7B), indicating that P6 was capable to distinguish cancer tissue from normal tissue in freshly dissected cancer specimens.
Figure 6
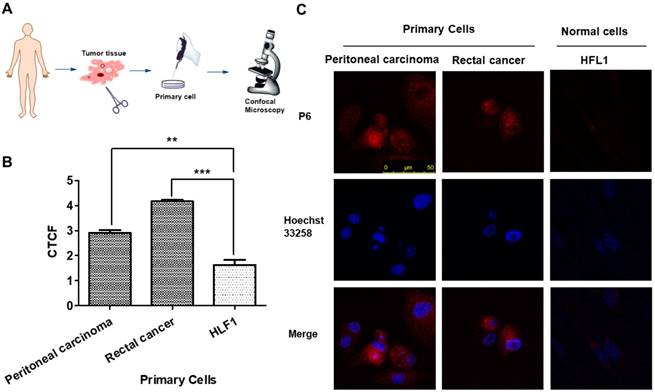
P6 uptake in primary cancer cells derived from patients. (A) Illustrated scheme for primary cell imaging. (B) Average fluorescence intensities of peritoneal carcinoma and rectal cancer cells incubated with P6, calculated from at least 3 images. **p<0.01, *p<0.001 versus HFL1 cells. (C) Representative confocal laser scanning microscopy images of primary tumor cells and normal cells (HFL1) incubated with P6 (5 μM) at 37°C; Probe P6 was visualized by excitation at 552 nm; fluorescence emission was observed using a 570-710 nm bandpass filter. Hoechst 33258 was excited at 405 nm, and emission was detected from 415 to 520 nm. Scale bar = 50 μm.
Figure 7
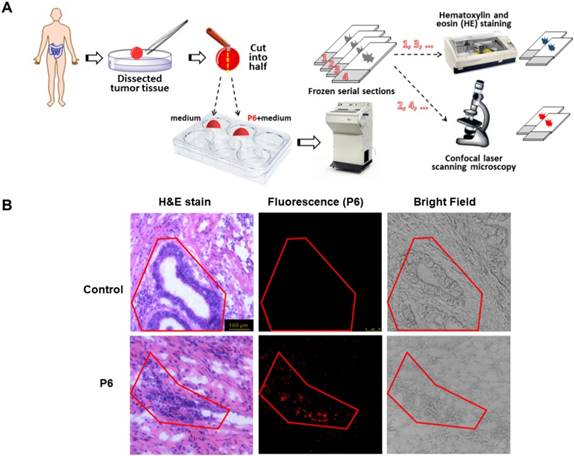
H&E staining and NIR imaging of resected tumor tissues from a gastric cancer patient. (A) Experimental design and procedure of histopathological analyses and fluorescence imaging. (B) H&E staining and NIR imaging indicated boundary between cancer and normal tissue (red line).
Figure 8
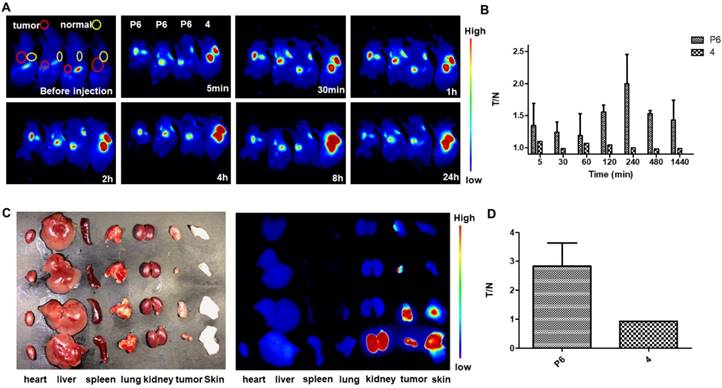
In vivo NIR fluorescence imaging in KHOS tumor-bearing mice with P6 and 4. (A) Real-time in vivo fluorescence images of mice before and 5 min, 30 min, 1 h, 2 h, 4 h, 8 h and 24 h after intratumoral injection and subcutaneous injection of P6 and 4 (0.01 mg/kg). (B) Quantification of the fluorescent intensity with calculated tumor to normal ratio (T/N) at different time points (5 min, 30 min, 1 h, 2 h, 4 h, 8 h and 24 h) (C) Fluorescence images of individual organs and tumors 24 h post injection with P6 and 4. (D) Comparison of the T/N of P6 and 4 after mice were sacrificed.
In vivo fluorescent and photoacoustic imaging
To evaluate the in vivo imaging ability of P6, two different cancer cells-derived xenograft mouse models were constructed, including HGC-27 and KHOS. As for the HGC-27 derived xenograft mouse model, we found that the fluorescence intensity at the tumor site was enhanced immediately after intratumoral injection of P6 (Figure S10A and B), Interestingly, when the probe was administrated intravenously, the fluorescence intensity of the kidney and liver was even stronger than that of the tumor (Figure S10C and D), sugestting that P6 may be more suitable for local injection, avoiding enter into the blood circulation directly.
Further, we injected P6 in a KHOS-derived xenograft mouse model. The fluorescence intensity at the tumor site was enhanced immediately (5 min) and sustained for 24 h (Figure 8A), while the fluorescence intensity at normal tissue site was slightly increased. To compare the imaging selectivity profile of Probe P6 and fluorophore 4, the ratio of the fluorescence intensity at the tumor site to normal site was calculated (T/N), and presented in Figure 8B. Obviously, the selectivity of fluorophore 4 is very poor, while the selectivity of P6 is promising with a maximum T/N value of 2-4 hours. In order to removing other tissues' influence on signal to noise ratio, the mice were sacrificed and dissected, the result also indicated that P6 group showed significant difference comparing to fluorophore 4 (Figure 8C and D).
Optical imaging of P6 has provided valuable information for biomedical applications. However, strong light scattering in tissue leads to a substantial tradeoff between spatial resolution and penetration depth. Photoacoustic (PA) imaging can overcome the limitations of pure optical imaging by acoustically detecting optical absorption contrast [52]. The NIR characteristics of the P6 make it a highly suitable PA imaging agent as well. Therefore, a preliminary study was performed, we obtained PA images of the tumors after intra-tumoral injection of P6 (0.1 mg/kg) using a VisualSonics Vevo® 2100 imaging system. As shown in Figure S11, PA signals were clearly observed at the tumor site 15 min post-injection, and approximately doubled after 60 min. The signals disappeared gradually after 4 h, which is a good observation time window. Taken together, P6 may be able to be suitable for the usage of PA imaging, although its rapid metabolism needs to be improved.
Conclusion
In this study, we developed a dual-modal NIR probe P6. The conjugation of biotin confers P6 with tumor specific cellular uptake and the intermolecular disulfide offers an environmental triggered release of fluorophore, thus enabling the selective imaging of cancer cells/tissues both in vitro and in vivo. Our strategy provided a novel insight into the development of imaging tools that could be potentially used for fluorescent image-guided cancer boundary recognition and possibly cancer diagnosis.
Experimental Section
Materials and Instruments: All the reagents and solvents are of commercial quality and without further purification. Anhydrous solvent were prepared according to general procedure. Phosphate buffered saline (PBS: 2.97 mM Na2HPO4, 1.05 mM KH2PO4; pH 7.4), 1H and 13C NMR spectra were recorded on a Bruker Advance III 500M spectrometer and referenced to solvent signals. Mass spectra were obtained on Shimadzu LCMS-2020 mass spectrometer. Fluorescence spectra were determined on an Agilent Cary Eclipse spectrophotometer. Absorption spectra were determined on a Hitachi U3010 UV-Visible spectrophotometer. Confocal microscopy images were obtained using confocal microscopy (Leica SP8, Mannheim, Germany). In vivo fluorescence images and photoacoustic images were measured with a Maestro in vivo imaging system (CRI Inc, Woburn, MA) and VisualSonics Vevo® 2100 Imaging System (FUJIFILM VisualSonics Inc.), respectively. Cryostat Section of tissues was performed on Leica CM1900.
Clinical human tissue specimen: The clinical samples of peritoneal, rectal and gastric cancer patients were obtained from Hangzhou First People's Hospital (Hangzhou, China). Written informed consents from patients and approval from the Institutional Research Ethics Committee of the hospital were obtained before the use of these clinical materials for research purposes.
Synthesis of P6 probe: See in Supporting Information
Sample Preparing: Stock solutions (10 mM) of probes were prepared in DMSO. Solutions of probes PBS (0.1M, pH 7.4 with 20% Acetonitrile) were used for the absorption and fluorescence spectra at molecular levels. 5 μM solutions of probes in culture media with 0.2 % DMSO were used for in vitro tests (Cellular uptake experiments, Selective cancer cell imaging).
Cell Culture and Confocal Microscopy Imaging: SW480 (human colon adenocarcinoma), HGC-27 (human gastric cancer), H460 (human non-small cell lung cancer), BxPC-3(human pancreas adenocarcinoma) and BEAS-2B (human bronchial epithelium, normal) were cultured in Roswell Park Memorial Institute medium 1640 (RPMI 1640), KHOS (human osteosarcoma) was cultured in Dulbecco's Modified Eagle Medium (DMEM) and HFL1 (human fetal lung fibroblasts, normal) was cultured in Ham's F 12 nutrient medium (F12). Both types of media were supplemented with the 10% FBS (WelGene), penicillin (100 units/mL), and streptomycin (100 μg/mL). The cells were seeded on a cover glass bottomed dish, which were incubated under the humidified atmosphere containing 5 % (v/v) CO2 at 37 oC for 24 hrs and the confocal experiments were performed.
CLSM Observations of the Cell Uptake and Imaging of P6: SW480, HGC-27, H460, BxPC-3, KHOS, BEAS-2B and HFL1 cells were seeded on a cover slip in a 6-well plate at a density of 1× 10⁵ cells per well in culture media. After 24 h, the cells were incubated with 20 μM P6 and 4 μg/mL Hoechst 33258 in the culture media for 4 h at 37 oC. After washing twice with 1 mL PBS to remove the remaining dye, the cells were imaged by confocal microscopy. For biotin competitive experiment, HGC-27 cells were pre-cultured with 5 mM of free biotin for 2 h, and incubated with 5 μM of P6 for 1 h before observation. For Filipin III experiment, HGC-27 cells were pre-cultured with 5 μg/ml of Filipin III, and incubated with 5 μM of P6 for 2 h before observation.
Quantitation of Fluorescence Intensity of Cells Incubated with P6: To quantitation of fluorescence intensity of P6 in the cytoplasm, Image J (NIH, USA) software is used. Corrected total cell fluorescence (CTCF) was calculated using the formula (CTCF = Integrated Density - (Area of selected cell X Mean fluorescence of background readings))
CCK-8 Assay: SW480, HGC-27, H460, BxPC-3, KHOS, BEAS-2B and HFL1 cells were seeded in a 96-well plate at a density of 8 × 10³ cells per well in culture media (RPMI-1640 for SW480, HGC-27, H460, BxPC-3 and BEAS-2B cells, F12 for HFL1 cell). After 24 h, the growth media were removed and the cells were incubated with 100 μL growth media containing 0, 5, 10, 20, 30, 50 μM P6 for 4 hwedc at 37 oC. The growth media containing P6 were then removed and the cells were incubated with 10 μL CCK-8 solution in 100 μL culture media for 1-2 h at 37 oC. The absorbance was recorded using a microplate reader at 450 nm.
Measurement of Intracellular GSH Levels: To measure the intracellular glutathione (GSH) concentration, SW480, HGC-27, H460, BxPC-3, BEAS-2B and HFL1 cells were cultured and prepared. The endogenous GSH from cell extract can react with DTNB (5,5-dithio-bis-[2-nitrobenzenic acid]) to form the colored GSH-DTNB conjugate, which can be determined by the change in absorbance at 405 nm.
In vivo Imaging in Xenograft Tumor Mice Model: All animal studies were approved by the Institutional Animal Care and Use Committee of Zhejiang University (IACUC-18-190). Athymic nude mice (Balb-c/nude, 5 weeks old) were used for the in vivo experiments. HGC-27 tumor tissues and KHOS tumor tissues were planted on the left armpit for 2 weeks till diameter of tumors is around 6 mm. In vivo imaging was recorded at different time internals (0-24 h) after P6 injection using Maestro in vivo imaging system (CRI Inc, Woburn, MA). The number of injected animals (nude mice) is 2×3 (parallel experiments: intratumoral injection 3, intravenous injection 3). The dose of the intratumoral injection and intravenous injection is 0.05 mg kg-1 and 0.5 mg kg-1 (PBS/DMSO = 95:5, pH = 7.4), respectively. In the in vivo imaging, λex = 680 ± 10 nm, λem = 710 ± 10 nm. In situ injection is intratumoral injection.
Photoacoustic Imaging: The same animal model was used for photoacoustic imaging. In vivo imaging was recorded at different time internals (0-6 h) after P6 injection using VisualSonics Vevo® 2100 Imaging System (FUJIFILM VisualSonics Inc.). The dose of the intratumoral injection and intravenous injection is 0.1 mg kg-1 (PBS/DMSO = 95:5, pH = 7.4), respectively.
Abbreviations
GSH: glutathione; NIR: near infra-red; PET: positron emission tomography; ROS: reactive oxygen species; LC-MS: liquid chromatography-mass spectrometry; CTCF: corrected total cell fluorescence; H&E: hematoxylin and eosin; PBS: phosphate buffered saline.
Supplementary Material
Supplementary figures and tables.
Acknowledgements
The authors thank the coworkers Shuai-Fei Wang, Cheng-Hao Pan, Ke-Ke Huang, Jian-Yang Pan at the College for Purification and NMR Analysis. The authors also greatly appreciate the financial support from National Natural Science Foundation of China (81673294), National Science & Technology Major Project “Key New Drug Creation and Manufacturing Program”, China (2018ZX09711002-007), Hangzhou Major Science and Technology Project (20172016A01), Clinical Pharmacy of Zhejiang Medical Key Discipline (2018-2-3), Zhejiang Provincial Program for the Cultivation of High-level Innovative Health talents (2010-190-4), National Training Programs of Innovation and Entrepreneurship for Undergraduates (201810335083).
Competing Interests
The authors have declared that no competing interest exists.
References
1. Siegel RL, Miller KD, Jemal A. Cancer statistics, 2018. CA-Cancer J Clin. 2018;68:7-30
2. Miller KD, Siegel RL, Lin CC, Mariotto AB, Kramer JL, Rowland JH. et al. Cancer treatment and survivorship statistics, 2016. CA-Cancer J Clin. 2016;66:271-89
3. Zhang RR, Schroeder AB, Grudzinski JJ, Rosenthal EL, Warram JM, Pinchuk AN. et al. Beyond the margins: real-time detection of cancer using targeted fluorophores. Nat Rev Clin Oncol. 2017;14:347-64
4. Krag D, Weaver D, Ashikaga T, Moffat F, Klimberg VS, Shriver C. et al. The Sentinel Node in Breast Cancer — A Multicenter Validation Study. New Engl J Med. 1998;339:941-6
5. Strong VE, Humm J, Russo P, Jungbluth A, Wong WD, Daghighian F. et al. A novel method to localize antibody-targeted cancer deposits intraoperatively using handheld PET beta and gamma probes. Surg Endosc. 2008;22:386-91
6. Sun Y, Zeng X, Xiao Y, Liu C, Zhu H, Zhou H. et al. Novel dual-function near-infrared II fluorescence and PET probe for tumor delineation and image-guided surgery. Chem Sci. 2018;9:2092-7
7. Huber PE, Jenne JW, Rastert R, Simiantonakis I, Sinn H-P, Strittmatter H-J. et al. A New Noninvasive Approach in Breast Cancer Therapy Using Magnetic Resonance Imaging-guided Focused Ultrasound Surgery. Cancer Res. 2001;61:8441-7
8. Hynynen K, Pomeroy O, Smith DN, Huber PE, McDannold NJ, Kettenbach J. et al. MR Imaging-guided Focused Ultrasound Surgery of Fibroadenomas in the Breast: A Feasibility Study. Radiology. 2001;219:176-85
9. Schaafsma BE, Mieog JSD, Hutteman M, van der Vorst JR, Kuppen PJK, Löwik CWGM. et al. The clinical use of indocyanine green as a near-infrared fluorescent contrast agent for image-guided oncologic surgery. J Surg Oncol. 2011;104:323-32
10. Pichlmeier U, the ALAGSG, Bink A, the ALAGSG, Schackert G, the ALAGSG. et al. Resection and survival in glioblastoma multiforme: An RTOG recursive partitioning analysis of ALA study patients. Neuro-Oncology. 2008;10:1025-34
11. Tummers QRJG, Boonstra MC, Frangioni JV, van de Velde CJH, Vahrmeijer AL, Bonsing BA. Intraoperative near-infrared fluorescence imaging of a paraganglioma using methylene blue: A case report. Int J Surg. 2015;6:150-3
12. Ishizawa T, Fukushima N, Shibahara J, Masuda K, Tamura S, Aoki T. et al. Real-time identification of liver cancers by using indocyanine green fluorescent imaging. Cancer. 2009;115:2491-504
13. van Manen L, Handgraaf HJM, Diana M, Dijkstra J, Ishizawa T, Vahrmeijer AL. et al. A practical guide for the use of indocyanine green and methylene blue in fluorescence-guided abdominal surgery. J Surg Oncol. 2018;118:283-300
14. Vahrmeijer AL, Hutteman M, van der Vorst JR, van de Velde CJH, Frangioni JV. Image-guided cancer surgery using near-infrared fluorescence. Nat Rev Clin Oncol. 2013;10:507-18
15. Gu K, Xu Y, Li H, Guo Z, Zhu S, Zhu S. et al. Real-Time Tracking and In Vivo Visualization of beta-Galactosidase Activity in Colorectal Tumor with a Ratiometric Near-Infrared Fluorescent Probe. J Am Chem Soc. 2016;138:5334-40
16. Owens EA, Hyun H, Dost TL, Lee JH, Park G, Pham DH. et al. Near-Infrared Illumination of Native Tissues for Image-Guided Surgery. J Med Chem. 2016;59:5311-23
17. Tan X, Luo S, Wang D, Su Y, Cheng T, Shi C. A NIR heptamethine dye with intrinsic cancer targeting, imaging and photosensitizing properties. Biomaterials. 2012;33:2230-9
18. Kobayashi H, Ogawa M, Alford R, Choyke PL, Urano Y. New Strategies for Fluorescent Probe Design in Medical Diagnostic Imaging. Chem Rev. 2010;110:2620-40
19. van Dam GM, Themelis G, Crane LMA, Harlaar NJ, Pleijhuis RG, Kelder W. et al. Intraoperative tumor-specific fluorescence imaging in ovarian cancer by folate receptor-α targeting: first in-human results. Nat Med. 2011;17:1315-9
20. Becker A, Hessenius C, Licha K, Ebert B, Sukowski U, Semmler W. et al. Receptor-targeted optical imaging of tumors with near-infrared fluorescent ligands. Nat Biotechnol. 2001;19:327-31
21. Zhang X, Wang B, Zhao N, Tian Z, Dai Y, Nie Y. et al. Improved Tumor Targeting and Longer Retention Time of NIR Fluorescent Probes Using Bioorthogonal Chemistry. Theranostics. 2017;7:3794-802
22. Cai W, Shin D-W, Chen K, Gheysens O, Cao Q, Wang SX. et al. Peptide-Labeled Near-Infrared Quantum Dots for Imaging Tumor Vasculature in Living Subjects. Nano Lett. 2006;6:669-76
23. Hou JT, Ko KP, Shi H, Ren WX, Verwilst P, Koo S. et al. PLK1-Targeted Fluorescent Tumor Imaging with High Signal-to-Background Ratio. ACS Sensors. 2017;2:1512-6
24. Choi HS, Gibbs SL, Lee JH, Kim SH, Ashitate Y, Liu F. et al. Targeted zwitterionic near-infrared fluorophores for improved optical imaging. Nat Biotechnol. 2013;31:148-53
25. Koide Y, Urano Y, Hanaoka K, Piao W, Kusakabe M, Saito N. et al. Development of NIR fluorescent dyes based on Si-rhodamine for in vivo imaging. J Am Chem Soc. 2012;134:5029-31
26. Hyun H, Park MH, Owens EA, Wada H, Henary M, Handgraaf HJM. et al. Structure-inherent targeting of near-infrared fluorophores for parathyroid and thyroid gland imaging. Nat Med. 2015;21:192-7
27. Zheng X, Mao H, Huo D, Wu W, Liu B, Jiang X. Successively activatable ultrasensitive probe for imaging tumour acidity and hypoxia. Nat Biomed Eng. 2017;1:57-65
28. Zhao T, Huang G, Li Y, Yang S, Ramezani S, Lin Z. et al. A transistor-like pH nanoprobe for tumour detection and image-guided surgery. Nat Biomed Eng. 2016;1:6-13
29. Zheng X, Wang X, Mao H, Wu W, Liu B, Jiang X. Hypoxia-specific ultrasensitive detection of tumours and cancer cells in vivo. Nat Commun. 2015;6:5834-45
30. Shi J-F, Wu P, Jiang Z-H, Wei X-Y. Synthesis and tumor cell growth inhibitory activity of biotinylated annonaceous acetogenins. Eur J Med Chem. 2014;71:219-28
31. Doerflinger A, Quang NN, Gravel E, Pinna G, Vandamme M, Ducongé F. et al. Biotin-functionalized targeted polydiacetylene micelles. Chem Commun. 2018;54:3613-6
32. Russell-Jones G, McTavish K, McEwan J, Rice J, Nowotnik D. Vitamin-mediated targeting as a potential mechanism to increase drug uptake by tumours. J Inorg Biochem. 2004;98:1625-33
33. Jiang J, Zhao Z, Hai Z, Wang H, Liang G. Intracellular Proteolytic Disassembly of Self-Quenched Near-Infrared Nanoparticles Turning Fluorescence on for Tumor-Targeted Imaging. Anal Chem. 2017;89:9625-8
34. Muhammad N, Sadia N, Zhu C, Luo C, Guo Z, Wang X. Biotin-tagged platinum(iv) complexes as targeted cytostatic agents against breast cancer cells. Chem Commun. 2017;53:9971-4
35. Shou K, Tang Y, Chen H, Chen S, Zhang L, Zhang A. et al. Diketopyrrolopyrrole-based semiconducting polymer nanoparticles for in vivo second near-infrared window imaging and image-guided tumor surgery. Chem Sci. 2018;9:3105-10
36. Liu HW, Hu XX, Li K, Liu Y, Rong Q, Zhu L. et al. A mitochondrial-targeted prodrug for NIR imaging guided and synergetic NIR photodynamic-chemo cancer therapy. Chem Sci. 2017;8:7689-95
37. Weissleder R, Tung C-H, Mahmood U, Bogdanov Jr A. In vivo imaging of tumors with protease-activated near-infrared fluorescent probes. Nat Biotechnol. 1999;17:375-8
38. Olson ES, Jiang T, Aguilera TA, Nguyen QT, Ellies LG, Scadeng M. et al. Activatable cell penetrating peptides linked to nanoparticles as dual probes for in vivo fluorescence and MR imaging of proteases. Proc Natl Acad Sci U S A. 2010;107:4311-6
39. Tian R, Li M, Wang J, Yu M, Kong X, Feng Y. et al. An intracellularly activatable, fluorogenic probe for cancer imaging. Org Biomol Chem. 2014;12:5365-74
40. Lee H, Akers W, Bhushan K, Bloch S, Sudlow G, Tang R. et al. Near-Infrared pH-Activatable Fluorescent Probes for Imaging Primary and Metastatic Breast Tumors. Bioconjugate Chem. 2011;22:777-84
41. Lee H, Kim J, Kim H, Kim Y, Choi Y. A folate receptor-specific activatable probe for near-infrared fluorescence imaging of ovarian cancer. Chem Commun. 2014;50:7507-10
42. Lee MH, Kim JY, Han JH, Bhuniya S, Sessler JL, Kang C. et al. Direct Fluorescence Monitoring of the Delivery and Cellular Uptake of a Cancer-Targeted RGD Peptide-Appended Naphthalimide Theragnostic Prodrug. J Am Chem Soc. 2012;134:12668-74
43. Yang Z, Lee JH, Jeon HM, Han JH, Park N, He Y. et al. Folate-Based Near-Infrared Fluorescent Theranostic Gemcitabine Delivery. J Am Chem Soc. 2013;135:11657-62
44. Chen H, Dong BL, Tang YH, Lin WY. Construction of a Near-Infrared Fluorescent Turn-On Probe for Selenol and Its Bioimaging Application in Living Animals. Chem-Eur J. 2015;21:11696-700
45. Yuan L, Lin WY, Zhao S, Gao WS, Chen B, He LW. et al. A Unique Approach to Development of Near-Infrared Fluorescent Sensors for in Vivo Imaging. J Am Chem Soc. 2012;134:13510-23
46. Li YH, Wang YJ, Yang S, Zhao YR, Yuan L, Zheng J. et al. Hemicyanine-based High Resolution Ratiometric near-Infrared Fluorescent Probe for Monitoring pH Changes in Vivo. Anal Chem. 2015;87:2495-503
47. Xie XL, Yang XE, Wu TH, Li Y, Li MM, Tan Q. et al. Rational Design of an alpha-Ketoamide-Based Near-Infrared Fluorescent Probe Specific for Hydrogen Peroxide in Living Systems. Anal Chem. 2016;88:8019-25
48. Zhang CY, Zhai BB, Peng T, Zhong ZL, Xu LB, Zhang QZ. et al. Design and synthesis of near-infrared fluorescence-enhancement probes for the cancer-specific enzyme hNQO1. Dyes Pigments. 2017;143:245-51
49. Yuan L, Lin W, Zhao S, Gao W, Chen B, He L. et al. A Unique Approach to Development of Near-Infrared Fluorescent Sensors for in Vivo Imaging. J Am Chem Soc. 2012;134:13510-23
50. Burgess A, Vigneron S, Brioudes E, Labbe JC, Lorca T, Castro A. Loss of human Greatwall results in G2 arrest and multiple mitotic defects due to deregulation of the cyclin B-Cdc2/PP2A balance. P Natl Acad Sci U S A. 2010;107:12564-9
51. Ott M, Gogvadze V, Orrenius S, Zhivotovsky B. Mitochondria, oxidative stress and cell death. Apoptosis. 2007;12:913-22
52. Yao J, Kaberniuk AA, Li L, Shcherbakova DM, Zhang R, Wang L. et al. Multiscale photoacoustic tomography using reversibly switchable bacterial phytochrome as a near-infrared photochromic probe. Nat Methods. 2016;13:67-73
Author contact
![]() Corresponding author: Email: dongxwedu.cn (Xiaowu Dong); Email: Lixin81edu.cn (Xin Li); Email: lnm1013com (Nengming Lin)
Corresponding author: Email: dongxwedu.cn (Xiaowu Dong); Email: Lixin81edu.cn (Xin Li); Email: lnm1013com (Nengming Lin)
Citation styles
APA
Guo, R., Huang, F., Zhang, B., Yan, Y., Che, J., Jin, Y., Zhuang, Y., Dong, R., Li, Y., Tan, B., Song, R., Hu, Y., Dong, X., Li, X., Lin, N. (2019). GSH Activated Biotin-tagged Near-Infrared Probe for Efficient Cancer Imaging. Theranostics, 9(12), 3515-3525. https://doi.org/10.7150/thno.32742.
ACS
Guo, R.; Huang, F.; Zhang, B.; Yan, Y.; Che, J.; Jin, Y.; Zhuang, Y.; Dong, R.; Li, Y.; Tan, B.; Song, R.; Hu, Y.; Dong, X.; Li, X.; Lin, N. GSH Activated Biotin-tagged Near-Infrared Probe for Efficient Cancer Imaging. Theranostics 2019, 9 (12), 3515-3525. DOI: 10.7150/thno.32742.
NLM
Guo R, Huang F, Zhang B, Yan Y, Che J, Jin Y, Zhuang Y, Dong R, Li Y, Tan B, Song R, Hu Y, Dong X, Li X, Lin N. GSH Activated Biotin-tagged Near-Infrared Probe for Efficient Cancer Imaging. Theranostics 2019; 9(12):3515-3525. doi:10.7150/thno.32742. https://www.thno.org/v09p3515.htm
CSE
Guo R, Huang F, Zhang B, Yan Y, Che J, Jin Y, Zhuang Y, Dong R, Li Y, Tan B, Song R, Hu Y, Dong X, Li X, Lin N. 2019. GSH Activated Biotin-tagged Near-Infrared Probe for Efficient Cancer Imaging. Theranostics. 9(12):3515-3525.
This is an open access article distributed under the terms of the Creative Commons Attribution (CC BY-NC) license (https://creativecommons.org/licenses/by-nc/4.0/). See http://ivyspring.com/terms for full terms and conditions.