Theranostics
13.3
Impact Factor
- Current Issue
- Advance Articles
- Volume 16; 2026
- Volume 15; 2025
- Volume 14; 2024
- Volume 13; 2023
- Volume 12; 2022
- Archive
- Cover Images
- Cover Suggestion
- Special Issues
Top
Introduction
Materials and Methods
Results
Discussion
Conclusions
Abbreviations
Supplementary Material
Acknowledgements
References
Author Biographies
Introduction
Materials and Methods
Results
Discussion
Conclusions
Abbreviations
Supplementary Material
Acknowledgements
References
Author Biographies
International Journal of Biological Sciences
International Journal of Medical Sciences
 Global reach, higher impact

Theranostics 2019; 9(13):3812-3824. doi:10.7150/thno.32546 This issue Cite
Research Paper
Development of a stem cell tracking platform for ophthalmic applications using ultrasound and photoacoustic imaging
Kelsey P. Kubelick1*, Eric J. Snider1*, C. Ross Ethier1, Stanislav Emelianov1,2 ![]()
1. Wallace H. Coulter Department of Biomedical Engineering, Georgia Institute of Technology and Emory University School of Medicine, 313 Ferst Dr NW, Atlanta, GA 30332 USA
2. School of Electrical and Computer Engineering, Georgia Institute of Technology, 777 Atlantic Drive, Atlanta, GA 30332, USA
*Equal contribution
Received 2018-12-24; Accepted 2019-4-18; Published 2019-5-31
Citation:
Kubelick KP, Snider EJ, Ethier CR, Emelianov S. Development of a stem cell tracking platform for ophthalmic applications using ultrasound and photoacoustic imaging. Theranostics 2019; 9(13):3812-3824. doi:10.7150/thno.32546. https://www.thno.org/v09p3812.htm
Other stylesAbstract

Glaucoma is the second leading cause of blindness in the world. Disease progression is associated with reduced cellularity in the trabecular meshwork (TM), a fluid drainage tissue in the anterior eye. A promising therapy seeks to deliver stem cells to the TM to regenerate the tissue and restore its function. However, like many stem cell-based regenerative therapies, preclinical development relies heavily on histology to evaluate outcomes. To expedite clinical translation, we are developing an ultrasound/photoacoustic (US/PA) imaging platform for longitudinal tracking of stem cells in the anterior eye.
Methods: Mesenchymal stem cells (MSCs) were labeled with gold nanospheres in vitro and injected through the cornea into the anterior chamber of ex vivo porcine eyes. Physiological pressure was imposed to mimic in vivo conditions. AuNS-labeled MSCs were injected through the cornea while single-wavelength US/PA images were acquired. At 5 hours post-injection, three-dimensional multi-wavelength US/PA datasets were acquired and spectroscopic analysis was used to detect AuNS-labeled MSCs. US/PA results were compared to fluorescent microscopy.
Results: The US/PA imaging platform was able to provide real-time monitoring of the stem cell injection and distinguish AuNS-labeled MSCs from highly absorbing background tissues in the anterior segment.
Conclusion: Our US/PA imaging approach can inform preclinical studies of stem cell therapies for glaucoma treatment, motivating further development of this theranostic imaging tool for ophthalmic applications.
Keywords: glaucoma, ultrasound/photoacoustic imaging, stem cell tracking, regenerative medicine, trabecular meshwork.
Introduction
Glaucoma is the second leading cause of blindness in the world, estimated to affect more than 70 million people [1]. Disease progression is frequently associated with elevated intraocular pressure (IOP), which in turn is associated with reduced cellularity in the trabecular meshwork (TM), a fluid drainage tissue in the anterior eye [2-4]. There is no cure for glaucoma, and existing treatments focus on slowing disease progression.
A promising therapeutic approach is to deliver stem cells to the TM to regenerate this tissue and restore its function, so as to lower IOP. To this end, induced pluripotent stem cells and mesenchymal stem cells (MSCs) have been investigated as therapeutics to renormalize IOP in glaucoma [5-8]. Although stem cell delivery decreased IOP and restored TM function, conclusions on how stem cells caused a positive therapeutic outcome were inconsistent and contradictory [7,8].
In this case, like many other regenerative therapies using stem cells, preclinical development relies heavily on histology to evaluate outcomes [9,10]. Although histology provides detailed information at the cellular and molecular level, drawbacks include highly invasive, destructive sample preparation [9-11]. A related approach is fluorescent imaging of labeled cells in whole tissue using confocal microscopy [9,12], which is somewhat less time-consuming than traditional histology but is also destructive and typically suffers from poor imaging resolution at depths beyond the sub-millimeter scale due to strong optical scattering by the overlying tissues [9]. As a result, longitudinal monitoring is challenging, making it more difficult to interpret results and inform future therapy design. Development and clinical translation of this novel stem cell therapy would thus be expedited by developing a minimally invasive, longitudinal stem cell tracking platform for the anterior eye.
A variety of imaging technologies exist at the preclinical or clinical stage to address this need, including magnetic resonance imaging (MRI), X-ray/computed tomography (CT), optical imaging, positron emission tomography (PET), and ultrasound. Each has its own advantages, and compromises are always made between resolution, sensitivity, image acquisition speed, penetration depth, contrast, safety, and cost. Specific to ophthalmology, optical coherence tomography (OCT) and ultrasound are widely used clinically [13-18], with contrast based on backscattering of optical and acoustic waves, respectively [19-21]. Both modalities provide excellent anatomical information, but their contrast is inherently poor. OCT faces an additional challenge for anterior segment imaging due to light penetration through highly scattering ocular tissues, such as the sclera [22-24].
One imaging modality, photoacoustic (PA) imaging, has been explored for anterior and posterior segment imaging in ophthalmology [25-28]. Unlike OCT and ultrasound, PA imaging is advantageous because contrast is based on optical absorption that significantly varies between different tissue types. In PA imaging, a pulsed laser irradiates an optical absorber, such as an endogenous chromophore or exogenous contrast agent. Heat deposition upon absorption causes thermoelastic expansion of the surrounding medium to create transient acoustic waves, which can be detected with a conventional ultrasound imaging transducer [29-32]. PA imaging combines advantages of acoustic and optical modalities to provide cellular- or molecular-level information with high resolution and contrast at increased imaging depths [9,10]. Furthermore, combined ultrasound and photoacoustic (US/PA) imaging simultaneously provides anatomical and functional information [29,30]. This multimodal imaging approach is even more appealing due to existing clinical use of ultrasound in ophthalmic applications [17].
In this work, we describe development of a combined US/PA imaging platform to track stem cells in the anterior segment of the eye. We first compare the detection capabilities of a traditional optical modality (confocal microscopy of fluorescently labeled cells) with photoacoustic imaging in a simplified phantom system where the number of cells was known a priori. We then proceed to image cells in whole, intact eyes using US/PA imaging. Although PA imaging has been used to successfully monitor stem cells in other applications, translation of US/PA imaging of stem cells in the anterior segment of the eye has to satisfy several unique requirements involving the optical properties of anterior ocular tissues, selection of a contrast agent to label stem cells, light-tissue interactions, and laser safety [33-38]. We show proof-of-principle of the US/PA imaging platform to monitor stem cell location in real-time and to distinguish stem cells from highly absorbing background tissues in the anterior segment of the eye. This work will inform future development of stem cell therapies for glaucoma treatment and lays the groundwork for a novel theranostic imaging tool in ophthalmology.
Materials and Methods
Cell culture
Human adipose-derived MSCs (Lonza) were grown in α-minimum essential medium supplemented with 20% fetal bovine serum (FBS), penicillin, streptomycin, and L-glutamine. At 80-90% confluency, MSCs were detached using 0.05% Trypsin/EDTA and seeded in fresh T75 cell culture flasks at a density of 5,000 cells/cm2. In all experiments, MSCs were used at passage numbers five or six. Each MSC donor strain was validated by Lonza for expression of MSC surface markers (CD13, CD29, CD44, CD73, CD90, CD105, and CD166) and minimal expression of negative MSC markers (CD14, CD131, CD45). Each MSC donor strain was also previously characterized in our lab for adipogenic, chondrogenic, and osteogenic differentiation potential, as well as CD90 expression following expansion [39].
Synthesis of the photoacoustic imaging contrast agent
Plasmonic nanoparticles, i.e., gold nanospheres, were used as the contrast agent for photoacoustic imaging. Hydrogen tetrachloroaurate (III) hydrate (HAuCl4 x H2O, Alfa Aesar) and sodium citrate tribasic dihydrate (HOC(COONa)(CH2COONa)2 x 2H2O), Sigma Aldrich), were used as received. Gold nanospheres (AuNSs), 20 nm diameter, were synthesized via the citrate reduction method as described elsewhere [40]. Briefly, 0.5 ml of a 1% w/v solution of hydrogen tetrachloroaurate was added to 47 ml of deionized ultrafiltered water. The solution was brought to a boil while stirring, then 2.5 ml of a 1% w/v solution of sodium citrate was added. After approximately 15 minutes, the solution appeared red and was cooled to room temperature. UV-Vis spectrophotometry (Synergy HT microplate reader, BioTek Instruments) between 400 nm to 995 nm was used to validate the absorbance spectrum. Transmission electron microscopy (TEM; Hitachi HT7700 TEM, IEN/IMAT Materials Characterization Facility, Georgia Institute of Technology) was used to validate particle size and morphology. The hydrodynamic diameter and zeta-potential of AuNSs were assessed (Malvern Zetasizer Nano ZS). Dynamic light scattering (DLS) measurements to determine hydrodynamic diameter were performed at 25 ˚C using a disposable cuvette. Six recordings were obtained, each consisting of 13 measurements. Zeta-potential measurements were performed using a Folded Capillary Zeta Cell (Malvern) to determine the surface charge of AuNSs. Six recordings were obtained, each consisting of at least 12 measurements.
Labeling cells with the photoacoustic contrast agent
AuNSs were sterilized under UV light for at least 12 hours prior to stem cell labeling experiments. Adipose-derived MSCs (Lonza) were incubated for 24 hours with AuNSs at an optical density of 2, a measure of concentration according to light absorbance, which corresponds to approximately 200 μg/ml of gold/ml of media, in α-minimum essential medium (Mediatech) supplemented with 20% fetal bovine serum, 2mM L-glutamine, and 1x penicillin/streptomycin. AuNSs were previously determined to have minimal cytotoxic effects on stem cell viability and multipotency [40]. We also carried out Alamar blue tests and confirmed that, for the AuNS concentration used in this study, stem cell metabolic activity was not impacted. Following uptake, gold nanosphere-labeled stem cells (hereinafter referred to as AuNS-labeled MSCs) were collected and used for cell tracking experiments. AuNS-labeled MSCs were washed with phosphate buffered saline (PBS) to remove excess nanoparticles, detached with Trypsin-EDTA, and centrifuged (300 x g, 10 minutes) to separate free AuNSs from AuNS-labeled MSCs. Successful labeling was confirmed by measuring cellular side scatter by flow cytometry (Attune NxT flow cytometer, Thermo Fisher), as previously described [12,41], and brightfield microscopy (Zeiss AxioObserver) of naïve (unlabeled) and AuNS-labeled MSCs stained with eosin in vitro. For fluorescent cell detection, in addition to AuNSs, MSCs were also labeled with 5 µM carboxyfluorescein succinimidyl ester (CFSE, Affymetrix) for fifteen minutes at 37oC, followed by washing with cell culture media to remove excess CFSE (hereinafter referred to as double-labeled MSCs).
Overview of Vevo LAZR imaging system
A Vevo 2100/LAZR (FujiFilm VisualSonics, Inc.) imaging system, incorporating ultrasound and photoacoustic (US/PA) imaging modes, was used for all imaging experiments. US/PA images were acquired using a 256 element ultrasound transducer array operating at 20 MHz center frequency (LZ250). The laser source was a Q-switched Nd:YAG pumped OPO laser (pulse repetition frequency = 20 Hz, 7 ns pulse duration). PA images were acquired within the 680 - 970 nm wavelength range at a frame rate of 5 Hz. Variations in laser pulse energy were corrected at the time of data acquisition using built-in features of the Vevo 2100/LAZR system. All three-dimensional (3D) US/PA images were produced using a translational motor stage.
Analyzing photoacoustic signal of labeled cells in a tissue mimicking phantom
To verify successful cell labeling, AuNS-labeled MSCs were imaged in a tissue-mimicking gelatin phantom [42]. The base of the phantom consisted of 8% (w/v) gelatin and 0.2% (w/v) silica (Sigma-Aldrich). Inclusions were made by adding 16% (w/v) gelatin to an equal volume of AuNS-labeled MSCs. Each inclusion was imaged over a range of wavelengths (λ = 680 nm to 970 nm at 5 nm increments). Data was exported and post-processed in MATLAB (MathWorks, Inc.).
Comparing photoacoustic imaging and fluorescent microscopy in agarose gels
Double-labeled MSCs (AuNSs and CFSE) were collected, fixed in 10% neutral buffered formalin for 10 minutes, and suspended at concentrations of 0, 1k, 5k, 10k, 25k, 50k, 100k, 250k and 500k cells/1 mL in 1% (w/v) agarose gels (Sigma Aldrich). Triplicates of each gel were formed in 48 well plates. Once solidified, the gels were removed from the well plate and stained using DAPI (Thermo Fisher). Each gel was imaged using confocal microscopy (LSM 700, Carl-Zeiss) followed by US/PA imaging at a wavelength of 700 nm to produce three-dimensional images for both modalities. Total fluorescent signal, total PA signal, and cell counts from DAPI labeling were determined. Although the cylindrical gels had a depth of approximately 17 mm, analysis could only be performed for a smaller region of interest with a depth of 0.5 mm due to limited light penetration of confocal microscopy. The region of interest was selected according to the optimum light focal depth for each modality, and cells were evenly distributed throughout the gel.
Ex vivo studies in whole porcine eyes
For ocular delivery experiments, porcine eyes from a slaughterhouse (Holifield Farms, Covington, GA) were used within 3 to 4 hours after enucleation. Eyes were secured on top of a tissue-mimicking phantom base composed of 1% (w/v) agarose. To maintain physiological pressures during cell injection, a reservoir containing serum-free, phenol red-free DMEM (supplemented with 1x penicillin, 1x streptomycin, 1x amphotericin, and 2 mM L-glutamine) was connected to each eye by cannulating the anterior chamber using a 23-gauge needle passing through the cornea. The elevated reservoir was placed 10 to 16 cm above the limbus (cornea-sclera transition region) to clamp IOP at 8 to 12 mmHg. A 250 µL suspension of double-labeled MSCs at concentrations of 1000, 2000, or 4000 cells/μl were injected into the anterior chamber through the cornea using a 27-gauge needle. After injection, eyes remained pressure clamped at a physiological pressure of 8 to 12 mmHg and were stored in a cell culture incubator for 5 hours. During this time, media from the elevated reservoir flowed into the anterior chamber and then out through the trabecular meshwork, which naturally drains fluid from the anterior chamber; thus allowing for continuous stem cell circulation in the anterior chamber and complete exchange of the anterior chamber fluid. The schematic of the perfusion set up is presented in Figure S1. Eyes were then fixed by submersion in a 10% neutral buffered formalin solution for 24 hours.
Eyes were fully submerged in PBS for US/PA imaging. In a subset of eyes, two-dimensional (2D) US and PA (680 nm wavelength) images were continuously acquired during cell injections. Spectroscopic PA images were also acquired within the 680 - 970 nm wavelength range in 5 nm increments for the first 15 minutes post-injection. After 5 hours post-injection, eyes were fixed, and then 3D spectroscopic US/PA datasets were acquired in all eyes (n=4 for each cell concentration). Due to hardware limitations, 3D US/PA images were acquired at a subset of wavelengths (680 - 710 nm wavelength range, 5 - 10 nm increments). All datasets were exported to MATLAB for post-processing. Three-dimensional volumetric US/PA images were produced using AMIRA (Thermo Fisher).
Trabecular meshwork dissection studies
Five-hours after cell injection, fixed eyes were dissected to isolate the anterior segment, similar to previously reported methods [43,44], to specifically assess double-labeled MSC localization at the TM. Briefly, orbital connective tissue was removed, and eyes were hemisected with a razor blade to isolate the front half of the eye. The vitreous humor and lens were removed, the iris was cut radially back to the iris root and pectinate ligaments until the TM was revealed, and the ciliary processes were carefully removed while preserving the TM. Any remaining vascularized or pigmented tissue was removed. Dissected anterior segments (n=4 for each cell concentration) were marked with stickers of black printed letters and two small pieces of dowel rod to act as fiducial markers for both fluorescent microscopy and US/PA imaging.
For US/PA imaging, dissected anterior segments were secured with the cornea facing down on top of a tissue-mimicking phantom base composed of 1% (w/v) agarose and were fully submerged in PBS. This orientation was required to maintain light delivery consistent with that of the inverted confocal microscope. Three-dimensional spectroscopic US/PA datasets were acquired in all dissected eyes (n=4 for each cell concentration) and exported to MATLAB for post-processing.
For fluorescent microscopy, anterior segments were placed in PBS on a 50 mm glass-bottomed dish (Ted Pella). Additional scleral tissue posterior to the TM was removed as needed to bring the TM in contact with the glass bottomed dish. Micrographs of the entire TM circumference were captured by confocal microscopy (LSM 700, Carl-Zeiss) as z-stacks of tile scans at 50x. Brightfield overlays were also captured. Maximum intensity projections were created for each en face image for further processing.
Spectroscopic analysis of multi-wavelength PA datasets
All PA datasets were post-processed using MATLAB. Initially, all PA datasets were spatially filtered using a 41 µm x 45 µm (3 x 3 pixel) median filter to suppress large noise fluctuations. Then, for two-dimensional spectroscopic PA datasets, a moving average filter with a spatial kernel of 252 µm x 405 µm, roughly three times the axial and lateral resolution, and a wavelength kernel of 15 nm was used. For three-dimensional spectroscopic PA datasets, the spatial kernel was extended in the elevational dimension (267 µm or 3 imaging slices), and no wavelength filtering was performed. Finally, PA signals below the noise threshold, defined as  were eliminated from the dataset, where
  and
and  are the lowest and the largest values of the PA signals.
Following filtering, PA datasets were analyzed using Equation 1, according to methods described elsewhere [45,46]:
(1)
where  describes the measured PA signal in terms of pressure on the surrounding tissue;
  is the fluence; and
  is the Grüneisen parameter. The product of the fluence and the Grüneisen parameter was treated as a constant,
  . Here, we assumed the resulting PA signal at each pixel,
  , was a superposition of individual PA signals from melanin, the primary endogeneous absorber in the anterior eye, and AuNS-labeled MSCs. Therefore
  is a matrix of optical cross-sections for i absorbers, melanin and AuNS-labeled MSCs. Optical cross-sections were determined a priori [47], and linear least squares regression was used to produce separate concentration maps
  depicting melanin or AuNS-labeled MSC localization in the anterior eye. The concentration maps,
  , were restricted to positive values.
Locating stem cells in photoacoustic images
For whole, ex vivo porcine eyes, PA datasets were further processed to eliminate signals from stem cells that had accumulated on the lens, thus highlighting stem cells localized to the iris and the TM region, as follows. The 3D concentration maps of melanin and stem cells, obtained from spectroscopic analysis, were integrated with respect to anterior-posterior depth, thus projecting the PA signals onto a 2D plane showing absorber distribution (melanin or cells) around the circumference of the eye. To eliminate PA signals from the anterior lens, the map of melanin distribution was used to define an annular ring mask, as follows: the mask's inner border was taken to be 0.5 mm exterior to the inner edge of the melanin map, representing the pupillary margin, and the mask's outer border was taken as 3 mm exterior to the inner border of the mask. The map of cell distribution was then multiplied by this annular ring mask to isolate cells at the iris and in the angle.
For dissected anterior segments, the 3D concentration maps were also integrated with respect to depth to produce 2D maps of absorber distribution, and the map of melanin distribution was used to create an annular ring mask defining the TM region. Unlike the situation in whole eyes, the iris had been removed from the dissected anterior segments; thus, the melanin distribution essentially coincided with the TM, as the only remaining melanin-rich tissue. The inner border of the mask was defined to be the inner edge of the melanin map, i.e. the anterior margin of the TM (nearest to the cornea). The outer border of the mask was defined as 1 mm exterior to the inner border to match the fluorescent image processing technique (see below). The map of cell distribution was multiplied by this annular ring mask to isolate cells in the TM region. The signals resulting from the stickers and dowel rods, which were adhered to the cornea as fiducial markers, were removed during image processing.
Locating stem cells in fluorescent images
Due to inherent differences between visualization of anatomical landmarks in PA imaging vs. fluorescent microscopy, different masking methods were required to visualize stem cell distribution in the TM region by fluorescent microscopy. In dissected anterior segments an annular ring mask was created with the inner border defined to be the corneal margin, as observed in brightfield images. The outer border of the mask was defined to be 1 mm exterior to the inner border of the mask, to match the mask created for PA images. Fluorescent images were masked and exported to MATLAB for further processing. Images were filtered with the same approach used for PA image processing. Specifically, a 3 x 3 pixel median filter was used to remove noise spikes, followed by filtering using a moving average with a kernel size of 400 µm x 400 µm. The signals resulting from the stickers and dowel rods, which were adhered to the cornea as fiducial markers, were removed.
Results
Gold nanospheres to label stem cells for photoacoustic imaging were successfully synthesized, as verified by transmission electron microscopy (TEM; Figure 1A). The average hydrodynamic diameter and surface charge of AuNSs were determined using DLS and zeta-potential, respectively. The AuNSs had an average hydrodynamic diameter of 17.89 nm +/- 6.4 nm with an average poly-dispersity index of 0.106 +/- 0.020. The average surface charge of AuNSs was -29.7 mV +/- 11 mV. Both results agreed with previous reports [40]. Brightfield microscopy confirmed successful labeling of stem cells with AuNSs after incubation with nanoparticles for 24 hours in vitro (Figure 1D - F) compared to naïve (unlabeled) stem cells (Figure 1B - C). As expected, tissue-mimicking phantom experiments showed that AuNS-labeled MSCs had an increased PA signal at 700 nm wavelength compared to naïve MSCs (Figures 1G and 1H). A representative PA spectrum of AuNS-labeled MSCs was compared to melanin, the primary endogenous absorber in the anterior segment (Figure 1I) [47]. Although AuNSs typically absorb at ~520 nm wavelength, surface plasmon resonance coupling upon particle endocytosis caused a red-shift in the peak absorption [48], indicated by absorption of AuNS-labeled MSCs well-beyond 700 nm wavelength (Figure 1I). The spectra were distinct, e.g., having different slopes. This supported the feasibility of AuNS labeling to identify and track stem cells within the anterior segment without interference due to signal from melanin. The shift in the absorption peak of AuNS-labeled MSCs compared to free AuNSs was also observed with UV-Vis spectrophotometry (Figure S2).
Further in vitro analysis was conducted with stem cells in agarose phantoms, a simplified system that allowed us to evaluate the ability of US/PA imaging to detect cells under well-controlled conditions. Cells were labeled with both CFSE, a fluorescent dye, and AuNSs (“double-labeled MSCs”). Known numbers of double-labeled MSCs were suspended in agarose gel phantoms at several different concentrations. Triplicates were prepared for each cell concentration. All agarose gels were imaged by confocal microscopy and PA imaging to produce 3D datasets. Although our PA imaging system has a light penetration depth of more than 20 mm, a region of interest with a depth of 0.5 mm was used to enable a fair comparison to confocal fluorescent microscopy, which has more limited light penetration. When comparing total PA signal to cell number loaded into the phantom, a linear relationship was observed (R2 = 0.94), as was the case when comparing fluorescent signal to cell number (R2 = 0.98; Figure 2). The lower detection limits were approximately 10k cells/ml and 5k cells/ml for PA and fluorescence, respectively. Therefore, PA imaging is a viable option for minimally invasive, longitudinal monitoring, and information provided is comparable to that of existing fluorescent cell tracking techniques, with the added benefit of increased light penetration.
Figure 1
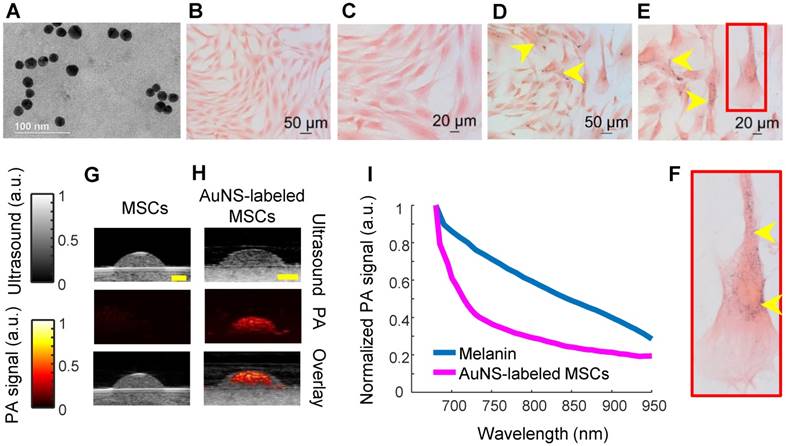
Characterization of AuNS-labeled MSCs. (A) TEM of AuNSs showing uniformity and approximate particle size. Brightfield micrographs of eosin-stained naïve (unlabeled) MSCs (B - C) and AuNS-labeled MSCs (D - F). (F) Enlarged image of the region of interest defined by the red box in (E). Yellow arrows identify AuNSs (black spots). (G - H) Ultrasound (grayscale map), photoacoustic (hot color map), and overlay images at 700 nm wavelength for (G) unlabeled MSCs and (H) AuNS-labeled MSCs. Scale bar = 2 mm. (I) Representative PA spectrum of melanin at the iris, determined from prior measurements [47], and AuNS-labeled MSCs. The distinct spectra, notably differences in slope, make AuNSs a promising contrast agent choice for stem cell tracking in the anterior segment, where melanin is the major PA signal source.
Figure 2
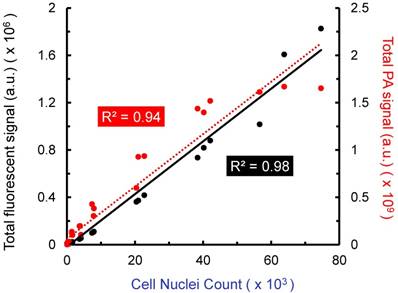
Amplitude of fluorescent and photoacoustic imaging signals vs. cell number loaded into agarose gel phantoms. Double-labeled MSCs (labeled with AuNSs and CFSE) were suspended at known concentrations in agarose gels formed in 48 well plates. Triplicates were prepared for each cell concentration. Total fluorescent and total PA signal were compared to cell nuclei count (DAPI staining) over a depth of 0.5 mm. Each point represents total signal for one gel. PA and fluorescent microscopy produced similar results, which further motivates use of minimally invasive PA imaging to track stem cells in the anterior segment.
We next carried out studies in perfused whole porcine eyes, which are an excellent model system due to similar pigmentation and anatomy to the human eye [49,50]. Physiological pressure was imposed using an elevated reservoir to mimic the in vivo secretion and flow of aqueous humor throughout the anterior chamber (Figure S1). Thus, after injection, stem cells were allowed to circulate in the anterior chamber because inflowing media from the elevated reservoir continuously flowed out through the trabecular meshwork, which is part of the eye's natural fluid drainage pathway. AuNS-labeled MSCs were injected through the cornea into the anterior chamber. Real-time, single-wavelength PA imaging visualized the stem cell injection and circulation through the chamber for the first 15 minutes post-injection (Video S1 and Figure 3A - D), showing potential for image-guided delivery. However, single-wavelength PA imaging did not distinguish AuNS-labeled stem cells from background signals from melanin-rich tissues, such as the iris and TM (Figure 3A). Thus, multi-wavelength PA imaging and spectroscopic analysis were required.
We distinguished AuNS-labeled MSCs from background (melanin) signal (Figure 1I) using multi-wavelength PA imaging and spectroscopic analysis (Figure 3). Prior to injection of AuNS-labeled MSCs, melanin was accurately localized to the iris and TM (Figure 3E), and no cells were identified (Figure 3I), indicating minimal cross-talk between the spectra of melanin and AuNS-labeled MSCs. Immediately and up to 15 minutes post-injection, melanin and AuNS-labeled MSCs were distinguished (Figures 3F - H and J - L). Some PA artifacts were also observed. For example, because the imaging plane was positioned to visualize the syringe needle, it was not necessarily centered over the pupil and was closer to the pupillary margin, where out-of-plane light absorption from the iris can occur. This created a PA signal artifact that appeared at the surface of the lens (Figure 3A), which can be removed by 3D imaging of the eye (Figure 5A). In addition, the syringe needle produced a PA signal at the center of the anterior chamber (Figure 3A) and was inaccurately identified as melanin (Figure 3E - H) [51]; however, the source of this artifact can be easily determined.
Stem cells were similarly injected into the anterior chamber of perfused porcine eyes and allowed to circulate for 5 hours, which is sufficient time for complete exchange of all fluid in the anterior chamber due to flow resulting from fluid drainage through the trabecular meshwork. To assess differences in delivery efficiency, injections were carried out with low, medium, and high cell numbers (250k, 500k and 1000k cells, respectively). Multi-wavelength US/PA imaging and spectroscopic analysis was able to distinguish melanin and stem cells at 5 hours post-injection (Figure 4). When 250k stem cells were injected, few cells were visible at 5 hours, and those that could be seen were primarily localized to the anterior lens (Figure 4D). As cell numbers increased, stem cells began to coat the iris and reach the angle (Figure 4F and H). In general, poor delivery efficiency was observed.
Although the 2D US/PA imaging results above provided useful information, 3D imaging was required to more accurately localize stem cells, due to spatially non-uniform flow in the anterior chamber and through the TM. Three-dimensional multi-wavelength US/PA imaging at 5 hours post-injection and spectroscopic analysis confirmed 2D results (Figure 5A and B). Specifically, stem cells primarily accumulated on the anterior lens (Figure 5B). Three-dimensional volumes were then segmented via geometric masking to eliminate stem cell signals at the lens (Figure 5C), with the inner and outer margins of the ring mask corresponding to .5 mm external to the pupillary margin and the irideo-corneal angle, respectively. Strong stem cell signals at the lens suppressed weaker PA signals from stem cells at other anterior tissues, where fewer cells accumulated. Masking allowed better visualization of stem cell localization near the irideo-corneal angle, and circumferentially non-uniform stem cell distribution was more clearly observed.
Figure 3
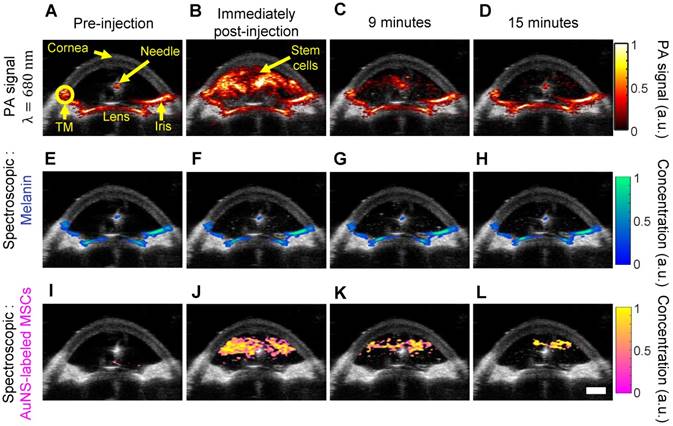
Ultrasound and photoacoustic imaging of AuNS-labeled MSCs delivered into the anterior chamber of perfused porcine eyes ex vivo. (A) Anatomical landmarks were identified, including the trabecular meshwork (TM). Photoacoustic datasets were analyzed before injection, and immediately, nine, and fifteen minutes post-injection (columns left to right). (A - D) PA imaging at 680 nm wavelength. (E - L) Spectroscopic analysis of multi-wavelength PA datasets distinguished signals from endogenous absorbers and AuNS-labeled MSCs. (E - H) Pixels identified as melanin. (I - L) Pixels identified as AuNS-labeled MSCs. Scale bar = 3 mm.
Figure 4
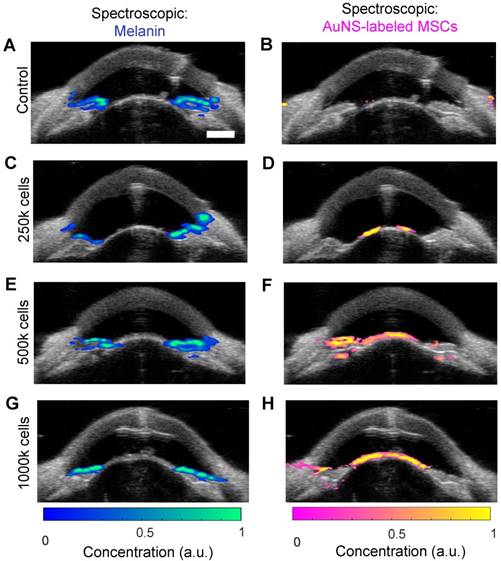
Ultrasound and photoacoustic imaging detects AuNS-labeled MSC location five hours post-injection in perfused porcine eyes ex vivo. Multi-wavelength PA datasets were processed with spectroscopic analysis. The left and right columns show photoacoustic signals separated according to contributions of melanin and AuNS-labeled MSCs, respectively. Each row corresponds to different numbers of cells injected: (A, B) control (perfused with media for 5 hours, no cells injected), (C, D) 250,000 cells, (E, F) 500,000 cells, and (G, H) 1,000,000 cells. Most AuNS-labeled MSCs were detected on the anterior lens, but some reached the angle for the 500k (F) and 1000k (H) cell injections. Scale bar = 3 mm.
Figure 5
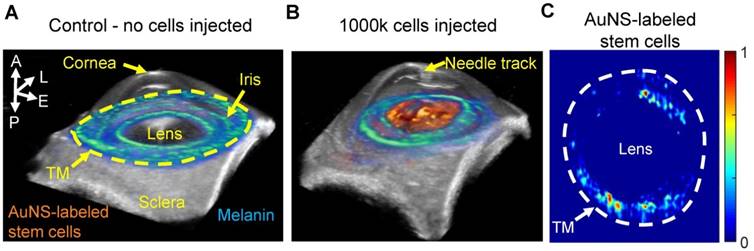
Three-dimensional ultrasound/photoacoustic imaging to detect location of AuNS-labeled MSCs at five hours post-injection. (A, B) Overlays of ultrasound (gray) and spectroscopic photoacoustic (color) images. Spectroscopic photoacoustic analysis distinguished melanin (cool color map) and AuNS-labeled MSCs (hot color map). (A) Control, (perfused with media, no cells injected). (B) 1000k cells injected. AuNS-labeled MSCs accumulated on the anterior lens and iris. (C) Spectroscopic datasets were further processed to identify AuNS-labeled MSCs at the iris and the trabecular meshwork (TM) region. Non-uniform stem cell delivery around the circumference of the iris and TM was observed. A = anterior; L = lateral; E = elevational; P = posterior.
Figure 6
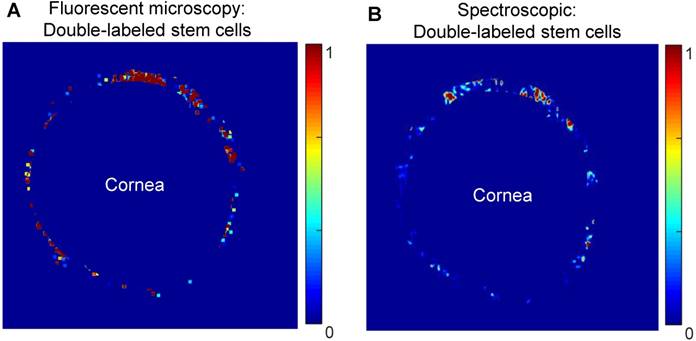
Comparison of the distribution of MSCs as visualized by confocal fluorescent microscopy (A) and spectroscopic photoacoustic imaging (B) in dissected porcine anterior segments. MSCs were double-labeled with a fluorescent marker (CFSE) and AuNSs. Images show stem cell distribution around the circumference of the TM.
At five hours post-injection, intact porcine eyes were hemisected, and extraneous tissues were removed to leave a shell containing only the TM, cornea, and anterior sclera. Dissected anterior segments were used to evaluate capabilities of existing fluorescent microscopy techniques and photoacoustic imaging to track double-labeled stem cells. Image post-processing and electronic masking specifically showed stem cells in the TM region (Figure 6). Four dissected anterior segments for each cell concentration were imaged using both modalities. Non-uniform stem cell distributions around the circumference of the TM were observed with both modalities, with some degree of, but less than perfect, overlap (see representative images in Figure 6).
Discussion
This study shows proof-of-concept for the ability of a US/PA tracking platform to longitudinally monitor stem cell delivery in the anterior eye. We labeled stem cells with AuNSs for PA imaging and injected them into the anterior chamber of perfused porcine eyes ex vivo. We were able to detect stem cell delivery and circulation in the anterior chamber in real-time using single-wavelength PA imaging. The more powerful multi-wavelength PA imaging and spectroscopic analysis were able to distinguish AuNS-labeled MSCs from background signals, laying the groundwork for future in vivo studies. Results support further development of our US/PA imaging platform as a tool to supplement information from existing tracking methods, with the significant advantage of allowing minimally invasive, longitudinal imaging.
Gold nanospheres were used to label stem cells for several reasons. The first important aspect is cytocompatibility. AuNSs have previously been shown to have minimal effects on stem cell differentiation and viability [40]. Second, AuNS labeling allows more accurate detection of labeled cells due to surface plasmon resonance coupling of gold nanospheres upon endocytosis [48]. Without particle aggregation within cellular vesicles, free AuNSs absorb at ~520 nm and would not be detected within the 680 - 970 nm wavelength range. Third, the PA spectrum of AuNS-labeled stem cells was also distinct from background PA spectra of tissues in the anterior eye [47], further supporting the use of AuNSs to detect stem cells. Finally, previous work showed AuNS-labeled MSCs injected in muscle could be detected at up to 10 days post-injection [33], indicating potential for longitudinal in vivo imaging in ophthalmic applications.
Although our initial studies were successful with AuNSs, many other contrast agents exist for labeling and tracking cells with PA imaging, including organic nanomaterials [52,53], dyes [54], other metallic nanoparticles [35,55,56], and photomagnetic nanoparticles [12,37]. The use of dyes is appealing because the small molecules can be cleared; however, dyes are prone to photobleaching, which may limit longitudinal imaging [32]. Beyond gold nanospheres, nanoparticle material, shape, and size can be varied to produce a more distinct PA spectrum to better detect stem cells in the presence of background signal from adjacent tissues [32]. For ophthalmic applications, gold nanorods are also of interest; however, potential instability and cytotoxicity are disadvantages compared to gold nanospheres [57,58]. Beyond detection, the use of photomagnetic nanoparticles has appealing qualities for other purposes, such as multi-modal imaging or magnetic steering [12].
In agarose gel phantom experiments, fluorescent microscopy and PA imaging were equally effective at detecting double-labeled stem cells (AuNS and CFSE). These experimental conditions favored fluorescent microscopy since no additional optical scatterers were introduced into the gel (unlike the situation in the eye), and a region of interest with a depth of only 0.5 mm was selected to accommodate the limited light penetration of fluorescent microscopy. In the anterior eye, the presence of highly scattering tissues, such as the sclera, and strong melanin absorption will further reduce light penetration. Thus, implementing purely optical imaging methods to monitor stem cells in the anterior segment may be challenging. Although our current PA imaging system cannot detect single stem cells, clinically relevant cell concentrations could be detected in agarose gels and in ex vivo porcine eyes with highly scattering tissues intact. The ability to image intact ocular tissues was a key advantage of PA imaging compared to confocal fluorescent microscopy, which ultimately required dissection of porcine eyes to image the TM and visualize stem cells. As a result, PA imaging can potentially facilitate minimally invasive, longitudinal stem cell tracking in vivo in the future.
In dissected samples from whole eyes, agreement between confocal fluorescent microscopy and PA imaging results was reasonable but not perfect, which we believe can be explained by several reasons. First, different masking methods were required for each modality because visualization of anatomical landmarks differed, and it was impossible to precisely align the masks despite our best efforts. Second, fluorescent microscopy could potentially detect single cells, while US/PA imaging detected groups of cells. Third, due to sensitivity of confocal imaging to light attenuation, which limits imaging depth, we had to dissect away tissue to visualize the TM because of the presence of highly scattering and pigmented tissues in the eye's anterior segment. This dissection may have also slightly disturbed the remaining tissues and the labeled cell distributions. For these reasons, we concluded that confocal fluorescent microscopy was unfortunately an imperfect comparison for our PA stem cell tracking platform in whole eyes. However, because fluorescent microscopy is currently used as an assessment tool for monitoring stem cell delivery and is also an absorption-based modality like PA imaging, we believe it was the most reasonable modality to attempt comparison.
Multi-wavelength PA imaging and spectroscopic analysis distinguished AuNS-labeled stem cells from background signals (primarily melanin) in 2D cross-sections and in 3D volumetric images. Although studies were conducted in ex vivo porcine eyes, we implemented flow in the eye to mimic the in vivo environment where there is a continuous circulation of fluid in the anterior eye. By 5 hours post-injection, AuNS-labeled MSCs accumulated primarily on the anterior lens. At higher cell numbers (500k and 1000k), some stem cells reached the angle, where the TM is located, but challenges with delivery efficiency were apparent. The US/PA tracking platform clearly highlighted poor delivery efficiency to the TM target tissue. Thus, US/PA tracking provided valuable information regarding stem cell localization. As the platform is translated to longitudinal in vivo studies, correlating stem cell localization and migratory patterns with changes in intraocular pressure, one indicator of glaucoma risk, can provide valuable information to better design stem cell therapies.
To address the issue of poor delivery efficiency, we are currently developing Prussian blue nanocubes (PBNCs) with combined magnetic and optical properties [59,60]. Magnetic properties allow PBNC-labeled stem cells to be pulled to a tissue target, such as the TM [12], while optical properties allow detection of PBNC-labeled stem cells with PA imaging. Once magnetic guidance to target PBNC-labeled stem cells to the TM has advanced to the clinical stage, application-specific light delivery systems could be implemented to allow longitudinal monitoring of stem cell retention in the TM. Thus, development of light delivery systems will eventually be critical for safety and clinical translation of anterior ocular PA imaging systems [61,62]. Together, the optical and magnetic properties of PBNCs will facilitate image-guided stem cell delivery to the TM to improve therapeutic outcomes and clinical utility, further adding to the theranostic benefits of the US/PA imaging platform in the future.
Conclusions
We demonstrate a US/PA imaging platform that can provide longitudinal feedback to assess MSC delivery in the anterior eye. Compared to existing stem cell detection techniques in the anterior eye, namely histology and/or confocal fluorescent microscopy, which require time-consuming, destructive sample preparation, US/PA tracking was minimally invasive and could be implemented in intact porcine eyes. Thus, US/PA tracking can provide additional, more holistic information on therapy progression to researchers and clinicians. Initial results also showed poor stem cell delivery efficiency, highlighting opportunities for future development of a theranostic US/PA platform to expedite therapy development and clinical translation.
Abbreviations
2D: two-dimensional; 3D: three-dimensional; AuNS: gold nanosphere; CFSE: carboxyfluorescein succinimidyl ester; CT: computed tomography; DLS: dynamic light scattering; FBS: fetal bovine serum; IOP: intraocular pressure; MRI: magnetic resonance imaging; MSC: mesenchymal stem cell; PBNC: Prussian blue nanocube; PBS: phosphate buffered saline; OCT: optical coherence tomography; PA: photoacoustic; PET: positron emission tomography; TEM: transmission electron microscopy; TM: trabecular meshwork; US/PA: ultrasound and photoacoustic.
Supplementary Material
Supplementary figures and video legend.
Supplementary video.
Acknowledgements
The authors acknowledge Dr. Heechul Yoon of the Georgia Institute of Technology for his assistance and valuable advice on image processing. This work was performed in part at Georgia Tech's Institute for Electronics and Nanotechnology, a member of the National Nanotechnology Coordinated Infrastructure, which is supported by the National Science Foundation (grant no. ECCS-1542174). The authors acknowledge support from the Georgia Research Alliance (GRA), National Institutes of Health (NIH), and the National Science Foundation (NSF).
Competing Interests
The authors have declared that no competing interest exists.
References
1. Quigley HA, Broman AT. The number of people with glaucoma worldwide in 2010 and 2020. Br J Ophthalmol. 2006;90:262-7
2. Alvarado J, Murphy C, Juster R. Trabecular meshwork cellularity in primary open-angle glaucoma and nonglaucomatous normals. Ophthalmology. 1984;91:564-79
3. Alvarado J, Polansky J, Murphey C, Juster R. Age-related changes in trabecular meshwork cellularity. Investig Ophthalmol Vis Sci. 1981;21:714
4. Liton PB, Liu X, Challa P, Epstein DL, Gonzalez P. Induction of TGF-beta1 in the trabecular meshwork under cyclic mechanical stress. J Cell Physiol. 2005;205:364-71
5. Zhu W, Gramlich OW, Laboissonniere L, Jain A, Sheffield VC, Trimarchi JM. et al. Transplantation of iPSC-derived TM cells rescues glaucoma phenotypes in vivo. Proc Natl Acad Sci U S A. 2016;113:E3492-500
6. Abu-Hassan DW, Li X, Ryan EI, Acott TS, Kelley MJ. Induced pluripotent stem cells restore function in a human cell loss model of open-angle glaucoma. Stem Cells. 2015;33:751-61
7. Manuguerra-Gagné R, Boulos PR, Ammar A, Leblond FA, Krosl G, Pichette V. et al. Transplantation of Mesenchymal Stem Cells Promotes Tissue Regeneration in a Glaucoma Model Through Laser-Induced Paracrine Factor Secretion and Progenitor Cell Recruitment. Stem Cells. 2013;31:1136-48
8. Roubeix C, Godefroy D, Mias C, Sapienza A, Riancho L, Degardin J. et al. Intraocular pressure reduction and neuroprotection conferred by bone marrow-derived mesenchymal stem cells in an animal model of glaucoma. Stem Cell Res Ther. 2015;6:177
9. Nam SY, Ricles LM, Suggs LJ, Emelianov SY. Imaging Strategies for Tissue Engineering Applications. Tissue Eng Part B Rev. 2014;21:1-44
10. Santiesteban DY, Kubelick KP, Dhada KS, Dumani DS, Suggs L, Emelianov S. Monitoring/Imaging and Regenerative Agents for Enhancing Tissue Engineering Characterization and Therapies. Ann Biomed Eng. 2016;44:750-72
11. Schroeder T. Imaging stem-cell-driven regeneration in mammals. Nature. 2008;453:345-51
12. Snider EJ, Kubelick KP, Tweed K, Kim RK, Li Y, Gao K. et al. Improving Stem Cell Delivery to the Trabecular Meshwork Using Magnetic Nanoparticles. Sci Rep. 2018;8:12251
13. Schuman JS, Hee MR, Arya A V, Pedut-Kloizman T, Puliafito CA, Fujimoto JG. et al. Optical coherence tomography: a new tool for glaucoma diagnosis. Curr Opin Ophthalmol. 1995;6:89-95
14. Swanson EA, Izatt JA, Lin CP, Fujimoto JG, Schuman JS, Hee MR. et al. In vivo retinal imaging by optical coherence tomography. Opt Lett. 1993;18:1864
15. Konstantopoulos A, Hossain P, Anderson DF. Recent advances in ophthalmic anterior segment imaging: a new era for ophthalmic diagnosis? Br J Ophthalmol. 2007;91:551-7
16. Izatt JA, Hee MR, Swanson EA, Lin CP, Huang D, Schuman JS. et al. Micrometer-Scale Resolution Imaging of the Anterior Eye In Vivo With Optical Coherence Tomography. Arch Ophthalmol. 1994;112:1584
17. Silverman RH. High-resolution ultrasound imaging of the eye - a review. Clin Experiment Ophthalmol. 2009;37:54-67
18. Radhakrishnan S, Goldsmith J, Huang D, Westphal V, Dueker DK, Rollins AM. et al. Comparison of Optical Coherence Tomography and Ultrasound Biomicroscopy for Detection of Narrow Anterior Chamber Angles. Arch Ophthalmol. 2005;123:1053
19. Silverman RH, Kong F, Chen YC, Lloyd HO, Kim HH, Cannata JM. et al. High-resolution photoacoustic imaging of ocular tissues. Ultrasound Med Biol. 2010;36:733-42
20. Huang D, Swanson EA, Lin CP, Schuman JS, Stinson WG, Chang W. et al. Optical coherence tomography. Science. 1991;254:1178-81
21. Fercher AF, Drexler W, Hitzenberger CK, Lasser T. Optical coherence tomography - principles and applications. Reports Prog Phys. 2003;66:239-303
22. Radhakrishnan S, Rollins AM, Roth JE, Yazdanfar S, Westphal V, Bardenstein DS. et al. Real-Time Optical Coherence Tomography of the Anterior Segment at 1310 nm. Arch Ophthalmol. 2001;119:1179
23. Hoerauf H, Gordes RS, Scholz C, Wirbelauer C, Koch P, Engelhardt R. et al. First Experimental and Clinical Results With Transscleral Optical Coherence Tomography. Ophthalmic Surgery, Lasers Imaging Retin. 2000;31:218-22
24. Hoerauf H, Scholz C, Koch P, Engelhardt R, Laqua H, Birngruber R. Transscleral Optical Coherence Tomography. Arch Ophthalmol. 2002;120:816
25. de la Zerda A, Paulus YM, Teed R, Bodapati S, Dollberg Y, Khuri-Yakub BT. et al. Photoacoustic ocular imaging. Opt Lett. 2010;35:270
26. Jiao S, Jiang M, Hu J, Fawzi A, Zhou Q, Shung KK. et al. Photoacoustic ophthalmoscopy for in vivo retinal imaging. Opt Express. 2010;18:3967
27. Song W, Wei Q, Liu T, Kuai D, Burke JM, Jiao S. et al. Integrating photoacoustic ophthalmoscopy with scanning laser ophthalmoscopy, optical coherence tomography, and fluorescein angiography for a multimodal retinal imaging platform. J Biomed Opt. 2012;17:061206
28. Hariri A, Wang J, Kim Y, Jhunjhunwala A, Chao DL, Jokerst J V. In vivo photoacoustic imaging of chorioretinal oxygen gradients. J Biomed Opt. 2018;23:1
29. Mallidi S, Luke GP, Emelianov S. Photoacoustic imaging in cancer detection, diagnosis, and treatment guidance. Trends Biotechnol. 2011;29:213-21
30. Emelianov SY, Li P-C, O'Donnell M. Photoacoustics for molecular imaging and therapy. Phys Today. 2009;62:34-9
31. Wang L V, Hu S. Photoacoustic Tomography: In Vivo Imaging from Organelles to Organs. Science (80- ). 2012;335:1458-62
32. Luke GP, Yeager D, Emelianov SY. Biomedical Applications of Photoacoustic Imaging with Exogenous Contrast Agents. Ann Biomed Eng. 2012;40:422-37
33. Nam SY, Ricles LM, Suggs LJ, Emelianov SY. In vivo ultrasound and photoacoustic monitoring of mesenchymal stem cells labeled with gold nanotracers. PLoS One. 2012;7:1-9
34. Ricles LM, Nam SY, Treviño EA, Emelianov SY, Suggs LJ. A dual gold nanoparticle system for mesenchymal stem cell tracking. J Mater Chem B. 2014;2:8220-30
35. Jokerst J V, Thangaraj M, Kempen PJ, Sinclair R, Gambhir SS. Photoacoustic Imaging of Mesenchymal Stem Cells in Living Mice via Silica-Coated Gold Nanorods. ACS Nano. 2012;6:5920-30
36. Donnelly EM, Kubelick KP, Dumani DS, Emelianov SY. Photoacoustic Image-Guided Delivery of Plasmonic-Nanoparticle-Labeled Mesenchymal Stem Cells to the Spinal Cord. Nano Lett. 2018;18:6625-32
37. Kim T, Lemaster JE, Chen F, Li J, Jokerst J V. Photoacoustic Imaging of Human Mesenchymal Stem Cells Labeled with Prussian Blue-Poly( l -lysine) Nanocomplexes. ACS Nano. 2017;11:9022-32
38. Chung E, Nam SY, Ricles LM, Emelianov SY, Suggs LJ. Evaluation of gold nanotracers to track adipose-derived stem cells in a PEGylated fibrin gel for dermal tissue engineering applications. Int J Nanomedicine. 2013;8:325-36
39. Snider EJ, Vannatta RT, Schildmeyer L, Stamer WD, Ethier CR. Characterizing differences between MSCs and TM cells: Toward autologous stem cell therapies for the glaucomatous trabecular meshwork. J Tissue Eng Regen Med. 2018:12
40. Ricles LM, Nam SY, Sokolov K, Emelianov SY, Suggs LJ. Function of mesenchymal stem cells following loading of gold nanotracers. Int J Nanomedicine. 2011;6:407-16
41. Zucker RM, Massaro EJ, Sanders KM, Degn LL, Boyes WK. Detection of TiO2 nanoparticles in cells by flow cytometry. Cytom Part A. 2010;77A:677-85
42. Cook JR, Bouchard RR, Emelianov SY. Tissue-mimicking phantoms for photoacoustic and ultrasonic imaging. Biomed Opt Express. 2011;2:3193-206
43. Bhattacharya SK, Gabelt BT, Ruiz J, Picciani R, Kaufman PL. Cochlin Expression in Anterior Segment Organ Culture Models after TGFβ2 Treatment. Investig Opthalmology Vis Sci. 2009;50:551
44. Bachmann B, Birke M, Kook D, Eichhorn M, Lütjen-Drecoll E. Ultrastructural and Biochemical Evaluation of the Porcine Anterior Chamber Perfusion Model. Investig Opthalmology Vis Sci. 2006;47:2011
45. Wang L V. Photoacoustic Imaging and Spectroscopy. CRC Press. 2009:144
46. Luke GP, Nam SY, Emelianov SY. Optical wavelength selection for improved spectroscopic photoacoustic imaging. Photoacoustics. 2013;1:36-42
47. Kubelick KP, Snider EJ, Ethier CR, Emelianov S. Photoacoustic properties of anterior ocular tissues. J Biomed Opt. 2019 In Print
48. Nam SY, Ricles LM, Suggs LJ, Emelianov SY. Nonlinear photoacoustic signal increase from endocytosis of gold nanoparticles. Opt Lett. 2012;37:4708-10
49. McMenamin PG, Steptoe RJ. Normal anatomy of the aqueous humour outflow system in the domestic pig eye. J Anat. 1991;178:65-77
50. Ruiz-Ederra J, García M, Hernández M, Urcola H, Hernández-Barbáchano E, Araiz J. et al. The pig eye as a novel model of glaucoma. Exp Eye Res. 2005;81:561-9
51. Su J, Karpiouk A, Wang B, Emelianov S. Photoacoustic imaging of clinical metal needles in tissue. J Biomed Opt. 2010;15:021309
52. Wang C, Ma X, Ye S, Cheng L, Yang K, Guo L. et al. Protamine Functionalized Single-Walled Carbon Nanotubes for Stem Cell Labeling and In Vivo Raman/Magnetic Resonance/Photoacoustic Triple-Modal Imaging. Adv Funct Mater. 2012;22:2363-75
53. Yin C, Wen G, Liu C, Yang B, Lin S, Huang J. et al. Organic Semiconducting Polymer Nanoparticles for Photoacoustic Labeling and Tracking of Stem Cells in the Second Near-Infrared Window. ACS Nano. 2018;12:12201-11
54. Zheng S, Li H, Lai K, Chen M, Fu G, Liu W-H. et al. Noninvasive photoacoustic and fluorescent tracking of optical dye labeled T cellular activities of diseased sites at new depth. J Biophotonics. 2018;11:e201800073
55. Ricles LM, Nam SY, Treviño EA, Emelianov SY, Suggs LJ. A dual gold nanoparticle system for mesenchymal stem cell tracking. J Mater Chem B. 2014;2:8220-30
56. Zhang YS, Wang Y, Wang L, Wang Y, Cai X, Zhang C. et al. Labeling human mesenchymal stem cells with gold nanocages for in vitro and in vivo tracking by two-photon microscopy and photoacoustic microscopy. Theranostics. 2013;3:532-43
57. Alkilany AM, Nagaria PK, Hexel CR, Shaw TJ, Murphy CJ, Wyatt MD. Cellular Uptake and Cytotoxicity of Gold Nanorods: Molecular Origin of Cytotoxicity and Surface Effects. Small. 2009;5:701-8
58. Chen Y-S, Frey W, Kim S, Homan K, Kruizinga P, Sokolov K. et al. Enhanced thermal stability of silica-coated gold nanorods for photoacoustic imaging and image-guided therapy. Opt Express. 2010;18:8867
59. Cook JR, Dumani DS, Kubelick KP, Luci J, & Emelianov S. Prussian blue nanocubes: multi-functional nanoparticles for multimodal imaging and image-guided therapy. SPIE Photonics West. 2017
60. Kubelick KP, Snider E, Karpiouk A, Ethier CR, & Emelianov S. Ultrasound/Photoacoustic Imaging Platform to Expedite Development of Novel Glaucoma Treatments. IEEE Int Ultrason Symp. 2018
61. Latina MA, Sibayan SA, Shin DH, Noecker RJ, Marcellino G. Q-switched 532-nm Nd:YAG laser trabeculoplasty (selective laser trabeculoplasty): A multicenter, pilot, clinical study. Ophthalmology. 1998;105:2082-90
62. Juzych MS, Chopra V, Banitt MR, Hughes BA, Kim C, Goulas MT. et al. Comparison of long-term outcomes of selective laser trabeculoplasty versus argon laser trabeculoplasty in open-angle glaucoma. Ophthalmology. 2004;111:1853-9
Author Biographies
 Kelsey P. Kubelick is a PhD candidate in the Coulter Department of Biomedical Engineering at the Georgia Institute of Technology and Emory University. Her research focuses on development of cell and particle tracking approaches using ultrasound, photoacoustic, and magnetic resonance imaging to expedite translation of novel therapies, particularly in the fields of regenerative medicine and immunology.
 Eric J. Snider received his doctorate in Biomedical Engineering at Georgia Institute of Technology/Emory University where his research took steps towards developing stem cell therapies for the glaucomatous trabecular meshwork. He is currently a postdoctoral fellow at the United States Army Institute of Surgical Research, focused on developing therapeutics and diagnostics for ocular trauma.
 C. Ross Ethier holds the Lawrence L. Gellerstedt, Jr. Chair in Bioengineering and is a Georgia Research Alliance Eminent Scholar in the Coulter Department of Biomedical Engineering at Georgia Tech/Emory. His research is in the biomechanics of cells and whole organs, with specific emphasis on ocular biomechanics. He works on developing treatments for glaucoma, the second most common cause of blindness, and for SANS, a syndrome affecting astronauts which is a major NASA human health concern.
 Stanislav Emelianov is a Joseph M. Pettit Endowed Chair, Georgia Research Alliance Eminent Scholar, and Professor of Electrical & Computer Engineering and Biomedical Engineering at the Georgia Institute of Technology and Emory University School of Medicine. Furthermore, Dr. Emelianov is Director of the Ultrasound Imaging and Therapeutics Research Laboratory. Projects in Dr. Emelianov's laboratory are focused on the discovery, development, and clinical translation of diagnostic imaging and therapeutic instrumentation, augmented with theranostic nanoagents.
![]() Corresponding author: Stanislav Emelianov, E-mail: stasedu
Corresponding author: Stanislav Emelianov, E-mail: stasedu
Citation styles
APA
Kubelick, K.P., Snider, E.J., Ethier, C.R., Emelianov, S. (2019). Development of a stem cell tracking platform for ophthalmic applications using ultrasound and photoacoustic imaging. Theranostics, 9(13), 3812-3824. https://doi.org/10.7150/thno.32546.
ACS
Kubelick, K.P.; Snider, E.J.; Ethier, C.R.; Emelianov, S. Development of a stem cell tracking platform for ophthalmic applications using ultrasound and photoacoustic imaging. Theranostics 2019, 9 (13), 3812-3824. DOI: 10.7150/thno.32546.
NLM
Kubelick KP, Snider EJ, Ethier CR, Emelianov S. Development of a stem cell tracking platform for ophthalmic applications using ultrasound and photoacoustic imaging. Theranostics 2019; 9(13):3812-3824. doi:10.7150/thno.32546. https://www.thno.org/v09p3812.htm
CSE
Kubelick KP, Snider EJ, Ethier CR, Emelianov S. 2019. Development of a stem cell tracking platform for ophthalmic applications using ultrasound and photoacoustic imaging. Theranostics. 9(13):3812-3824.
This is an open access article distributed under the terms of the Creative Commons Attribution (CC BY-NC) license (https://creativecommons.org/licenses/by-nc/4.0/). See http://ivyspring.com/terms for full terms and conditions.