Theranostics
13.3
Impact Factor
- Current Issue
- Advance Articles
- Volume 16; 2026
- Volume 15; 2025
- Volume 14; 2024
- Volume 13; 2023
- Volume 12; 2022
- Archive
- Cover Images
- Cover Suggestion
- Special Issues
Top
Introduction
Materials and Methods
Results
Discussion
Conclusions
Abbreviations
Supplementary Material
Acknowledgements
References
Introduction
Materials and Methods
Results
Discussion
Conclusions
Abbreviations
Supplementary Material
Acknowledgements
References
International Journal of Biological Sciences
International Journal of Medical Sciences
 Global reach, higher impact

Theranostics 2020; 10(2):585-601. doi:10.7150/thno.36572 This issue Cite
Research Paper
In vivo liposomal delivery of PPARα/γ dual agonist tesaglitazar in a model of obesity enriches macrophage targeting and limits liver and kidney drug effects
Victoria Osinski1,2 ![]() , Dustin K. Bauknight1,3, Siva Sai Krishna Dasa1,3, Matthew J. Harms4, Tobias Kroon4, Melissa A. Marshall1, James C. Garmey1, Anh T. Nguyen1, Julia Hartman1,3, Aditi Upadhye1, Prasad Srikakulapu1, Andrea Zhou1,3, Gavin O'Mahony4, Alexander L. Klibanov1,5, Kimberly A. Kelly1,3, Jeremie Boucher4,6,7, Coleen A. McNamara1,5
, Dustin K. Bauknight1,3, Siva Sai Krishna Dasa1,3, Matthew J. Harms4, Tobias Kroon4, Melissa A. Marshall1, James C. Garmey1, Anh T. Nguyen1, Julia Hartman1,3, Aditi Upadhye1, Prasad Srikakulapu1, Andrea Zhou1,3, Gavin O'Mahony4, Alexander L. Klibanov1,5, Kimberly A. Kelly1,3, Jeremie Boucher4,6,7, Coleen A. McNamara1,5
1. Robert M. Berne Cardiovascular Research Center, University of Virginia, Charlottesville, Virginia, 22908, USA
2. Department of Pathology, University of Virginia, Charlottesville, VA, 22908, USA
3. Department of Biomedical Engineering, University of Virginia, Charlottesville, Virginia, 22908, USA
4. Research and Early Development, Cardiovascular, Renal and Metabolism (CVRM), BioPharmaceuticals R&D, AstraZeneca, Gothenburg, Sweden
5. Department of Medicine, Division of Cardiovascular Medicine, University of Virginia, Charlottesville, VA, USA
6. The Lundberg Laboratory for Diabetes Research, University of Gothenburg, Sweden
7. Wallenberg Centre for Molecular and Translational Medicine, University of Gothenburg, Sweden
Received 2019-5-10; Accepted 2019-10-6; Published 2020-1-1
Citation:
Osinski V, Bauknight DK, Dasa SSK, Harms MJ, Kroon T, Marshall MA, Garmey JC, Nguyen AT, Hartman J, Upadhye A, Srikakulapu P, Zhou A, O'Mahony G, Klibanov AL, Kelly KA, Boucher J, McNamara CA. In vivo liposomal delivery of PPARα/γ dual agonist tesaglitazar in a model of obesity enriches macrophage targeting and limits liver and kidney drug effects. Theranostics 2020; 10(2):585-601. doi:10.7150/thno.36572. https://www.thno.org/v10p0585.htm
Other stylesAbstract

Macrophages are important regulators of obesity-associated inflammation and PPARα and -γ agonism in macrophages has anti-inflammatory effects. In this study, we tested the efficacy with which liposomal delivery could target the PPARα/γ dual agonist tesaglitazar to macrophages while reducing drug action in common sites of drug toxicity: the liver and kidney, and whether tesaglitazar had anti-inflammatory effects in an in vivo model of obesity-associated dysmetabolism.
Methods: Male leptin-deficient (ob/ob) mice were administered tesaglitazar or vehicle for one week in a standard oral formulation or encapsulated in liposomes. Following the end of treatment, circulating metabolic parameters were measured and pro-inflammatory adipose tissue macrophage populations were quantified by flow cytometry. Cellular uptake of liposomes in tissues was assessed using immunofluorescence and a broad panel of cell subset markers by flow cytometry. Finally, PPARα/γ gene target expression levels in the liver, kidney, and sorted macrophages were quantified to determine levels of drug targeting to and drug action in these tissues and cells.
Results: Administration of a standard oral formulation of tesaglitazar effectively treated symptoms of obesity-associated dysmetabolism and reduced the number of pro-inflammatory adipose tissue macrophages. Macrophages are the major cell type that took up liposomes with many other immune and stromal cell types taking up liposomes to a lesser extent. Liposome delivery of tesaglitazar did not have effects on inflammatory macrophages nor did it improve metabolic parameters to the extent of a standard oral formulation. Liposomal delivery did, however, attenuate effects on liver weight and liver and kidney expression of PPARα and -γ gene targets compared to oral delivery.
Conclusions: These findings reveal for the first time that tesaglitazar has anti-inflammatory effects on adipose tissue macrophage populations in vivo. These data also suggest that while nanoparticle delivery reduced off-target effects, yet the lack of tesaglitazar actions in non-targeted cells such (as hepatocytes and adipocytes) and the uptake of drug-loaded liposomes in many other cell types, albeit to a lesser extent, may have impacted overall therapeutic efficacy. This fulsome analysis of cellular uptake of tesaglitazar-loaded liposomes provides important lessons for future studies of liposome drug delivery.
Keywords: liposomes, tesaglitazar, peroxisome proliferator-activated receptors, obesity-associated dysmetabolism, macrophages
Introduction
Liposomal drug delivery has emerged as a promising strategy to limit the side effects of otherwise effective therapeutics by directing the active compound to the cells and tissue of interest while avoiding others, such as the liver and kidney, which often contribute to undesired side effects [1, 2]. With the addition of polyethylene glycol (PEG) to liposome formulations, half-life of circulating liposomes increases and uptake by the reticuloendothelial system (RES, comprised of the liver, kidneys, spleen, bone marrow, lungs, and lymph nodes) and free drug in circulation are reduced. Even with such advancements in liposome formulations, uptake of liposomes by the liver and other RES tissues and phagocytes is still prevalent [2]. Liposomes enrich drug delivery to phagocytic cells such as tissue-resident macrophages including liver-resident macrophages known as Kupffer cells [3]. Liposome delivery has been identified as a promising approach for diseases associated with macrophage dysfunction [4, 5]. There is current interest in using targeted nanoparticle approaches to deliver compounds to both macrophages and a variety of non-macrophage cell types including cancer cells [6] and endothelial cells [7], but a thorough characterization of the cell types that take up liposomes in vivo has not been reported. In the context of obesity-associated dysmetabolism, a disease characterized and driven by macrophage dysfunction, the capacity to target drugs to macrophages or other non-phagocytic immune cell types including B cells and T cells in the adipose may prove useful as both cell types play important roles in regulating inflammation and macrophage recruitment to the adipose tissue during obesity [8]. To address this, we used fluorescent labeling of liposomes coupled with fluorescently activated cell sorting (FACS), or flow cytometry, to thoroughly describe these cell types in vivo in an unbiased manner.
Furthermore, therapeutic compounds for obesity-associated dysmetabolism already exist, including the family of peroxisome proliferator-activated receptor (PPAR) agonists. These compounds act on nuclear receptors, PPARs, which respond to metabolites such as lipids and regulate expression of lipid and glucose metabolism genes [9]. They are known to act on multiple tissues in humans and mice where they regulate lipid metabolism in the liver, triglyceride clearance, and insulin resistance to alleviate symptoms of diabetes and obesity-associated dysmetabolism [10, 11]. There are three PPAR subtypes: PPARα, PPARγ, and PPARδ. While PPARα and PPARγ both effectively increase insulin sensitivity in tissues, PPARα activates fatty acid oxidation in the liver and PPARγ induces lipogenesis [9, 12]. The family of PPARα/γ dual agonists, known as glitazars, includes a compound known as tesaglitazar, which lowers hyperglycemia and improves circulating lipid levels more effectively than PPARγ agonists such as pioglitazone [13, 14]. However, increases in creatinine and reduction in glomerular filtration rate in subjects contributed to the termination of Phase III trials with this compound [13-20]. Tesaglitazar has effects in the liver and kidneys of rodent models [21, 22], which make it a useful compound to study the effects of liposome formulation on the biodistribution and drug action among RES tissues. PPARα agonism profoundly induces expression of many lipid metabolism and transport genes in the murine liver and kidney including the Fatty acid binding protein family (Fabp), lipoprotein lipase (Lpl), Enol-CoA hydratase and 3-hydroxyacyl CoA dehydrogenase (Ehhadh), and Pyruvate dehydrogenase kinase 4 (Pdk4) [23, 24]. Additionally, PPARα agonists increase murine liver mass [10], an easily measured biomarker of liver target engagement. Nakashiro et al. demonstrated the efficacy of nanoparticle delivery of the PPARγ agonist pioglitazone to attenuate effects in the kidneys [25], but whether liposomal delivery of PPAR agonists attenuates drug action in the liver remains uninvestigated. Thus, to test whether liposomal delivery effectively reduces tesaglitazar-induced PPARα/γ agonism in the liver and kidney, we quantified liver mass and gene expression in the liver and kidney.
PPARα/γ agonism in the liver is known to be metabolically beneficial, however, previous literature reporting knockout of PPARγ in macrophages or in vivo treatment with a PPARγ agonist suggests that PPARα/γ agonism in macrophages (including Kupffer cells in the liver) might be sufficient to reduce obesity-associated dysmetabolism [26, 27]. Macrophages are a key cellular regulator of obesity-associated inflammation [28] and reduction of adipose tissue macrophage (ATM) populations attenuates adipose tissue inflammation and insulin resistance [29, 30]. A spectrum of ATM phenotypes ranging from pro-inflammatory CD11c+ M1 macrophages to anti-inflammatory, tissue resident CD301+ M2 macrophages exist in obese adipose tissue [31]. M1 macrophages can be further divided by expression of CD206 (mannose receptor): CD11c+CD206- M1a macrophages are characterized by increased expression of pro-inflammatory cytokines, while CD11c+CD206+ M1b macrophages are recruited to obese adipose tissue but are not characterized by a pro-inflammatory phenotype [31]. PPARα and -γ agonism in macrophages has been demonstrated to have anti-inflammatory effects [26, 32-39]. More specifically, treatment with tesaglitazar reduced circulating pro-inflammatory cytokines and the number of infiltrating macrophages in atherosclerotic plaques and liver in models of atherosclerosis and non-alcoholic fatty liver disease, respectively [22, 36, 37]. Furthermore, macrophage-specific loss of PPARγ inhibits maturation of M2, anti-inflammatory macrophages and exacerbates obesity-associated dysmetabolism in vivo [26]. To date, the effect of a PPARa/γ dual agonist, such as tesaglitazar, on macrophage populations in adipose tissue during obesity and dysmetabolism has not been reported. Thus, we also investigated the effects of oral and liposomal delivery of tesaglitazar on adipose tissue-resident macrophages using flow cytometry.
In summary, our approach comparing intravenous delivery of tesaglitazar in liposomes to non-liposomal, oral administration was used to (1) more thoroughly assess the cellular uptake of liposomes in vivo, (2) determine the impact of tesaglitazar both delivered non-liposomally and in liposomes on pro-inflammatory ATM populations and on overall metabolic effects, and (3) validate the efficacy of liposomal delivery in attenuating PPAR agonism in tissues of the RES, specifically the liver and kidney. We hypothesized that liposomal delivery of tesaglitazar would attenuate PPARα/γ agonism in the liver and kidney and reduce macrophage-induced adipose inflammation to improve overall metabolic effects.
Materials and Methods
Non-liposomal drug preparation
Tesaglitazar was dissolved in 0.5% carboxymethyl cellulose to a concentration of 0.35 mM. Volumes administered to mice were calculated based on body weights in order to delivery 1 μmol per kg of body weight each day. The vehicle used for non-liposomal drug treatments was 0.5% carboxymethyl cellulose administered at equal volumes to that of tesaglitazar.
Liposome preparation and characterization
Liposome preparation
Liposomes were initially prepared with the remote loading attractant calcium acetate using the reverse-phase evaporation technique [40] with DSPC (phosphocholine), cholesterol and PEG-2000 DSPE at a mass ratio of 2:1:1 (phospholipids were from Avanti or Lipoid; cholesterol from Sigma). Additionally, during this step liposomes were fluorescently labeled by adding DiD lipid dye at a concentration of 1 mg DiD per 1 ml of liposomes (molar ratio of 46:1 of DSPC:DiD). DiD is an accepted abbreviation for 1,1'-dioctadecyl-3,3,3',3'tetramethylindocarbocyanine dye. As this material has two octadecyl "fatty tails" like DSPC, the main component of the liposomes, we do not expect a significant amount to be outside of the lipid membrane. Long-chain phospholipids normally possess critical micelle concentrations in the picomolar range, so we expect a negligible amount of free dye present. Lipid dyes like DiO, DiD and DiI are routunely used for liposome research and they are considered non-exchangeable [41].
Briefly, an ether-chloroform solution of lipids was mixed with aqueous calcium acetate (Ca-acetate, 1 M, pH 7.4). The ratio between organic and aqueous phase was 4:1. A mixture was subjected to emulsification by sonication (XL2020, Misonix, 50% power, 30 sec) and then organic solvents were removed under vacuum using a rotary evaporator (Re111, Buchi) connected to a vacuum line. Resulting liposomes were subjected to repeated Nuclepore filtration to achieve homogeneous size distribution, as determined by dynamic laser light scattering (DLS, Nicomp 370). External Ca-acetate was removed using a Zeba spin-column and to half of the batch, aqueous tesaglitazar in HEPES buffer (pH 7.4) was added and incubated with mixing at 37ºC for 1 hour. External unentrapped tesaglitazar was removed from liposomes with a Zeba spin-column. The vehicle used for liposomal treatments was liposomes containing aqueous calcium acetate. These were administered at volumes calculated to deliver comparable numbers of vehicle-loaded liposomes to the number of tesaglitazar-loaded liposomes per mouse.
Quantifying drug loading, liposome size, shape, and zeta potential
Drug loading was determined by measuring 270 nm using ultraviolet-visible spectroscopy (UV-vis). Particles per volume were quantified by Nanoparticle Tracking Analysis (Nanosight NS300, Malvern Instruments Ltd., Worcestershire, UK) in order to calculate μg of tesaglitazar per mg of DPSC lipid. Dynamic light scattering (Particle Sizing System, Inc, Santa Barbara, CA) was utilized to quantify particle size. Liposomes were also imaged using cryoTEM to assess particle structure. Additionally, zeta potential was measured using a Malvern ZetaSizer, in 10 mM HEPES buffer pH 7.4 and 25°C.
Liposome release kinetics
Release kinetics were determined by ultrafiltration in an Amicon 10 KDa 0.5 ml ultrafilter cartridge, where an aliquot of liposomes was added to buffer and spun to separate liposomes from the released free drug in the buffer. Concentration of tesaglitazar outside of the liposomes was quantified by UV-vis following ultrafiltration.
Animals
Male C57Bl/6 leptin-deficient (ob/ob) and high-fat diet-fed C57Bl/6 (DIO) mice were purchased from Jackson Labs (Stock # 000632 and # 380050, respectively). Experiments were performed using 9- to 14-week old male ob/ob mice and 16-week old male DIO mice that were fed an obesity diet (60% cholesterol, Research Diets D12492) for 10 weeks. All animal experiments were performed in accordance with the Institutional Animal Care and Use Committee of the University of Virginia.
Ex vivo biodistributions and blood pharmacokinetics
Blood pharmacokinetics
To quantify pharmacokinetics of oral administration of tesaglitazar, a single dose of tesaglitazar was administered by oral gavage. Blood was drawn at 15 min, 30 min, 1 h, 2 h, 4 h, 8 h, and 24 h post administration. Tesaglitazar levels at each of these time points were measured using LC-MS (see “Plasma and liver tesaglitazar concentrations” section of the methods). To quantify pharmacokinetics of tesaglitazar-loaded liposomes, a dose of approximately 2.5 μmol tesaglitazar/kg was administered via tail vein. Blood draws were collected at 1 min, 3 min, 5 min, 10 min, 15 min, 30 min, 1 h, 2 h, 6 h, and 24 h post-injection. Fluorescence molecular tomography (FMT) imaging was used to measure the amount of liposomes in circulation at each time point. Samples were imaged using the 680 nm laser of the FMT 4000 system (PerkinElmer, Waltham, MA). Pharmacokinetics of orally administered tesaglitazar and liposomal tesaglitazar were determined using non-compartmental analysis (NCA, Phoenix WinNonlin 8.1, Certara, NJ USA).
Ex vivo biodistribution
Tissues were harvested 4 and 24 hours post-injection. Liposome tissue biodistribution was measured using ex vivo FMT imaging of organs to determine the amount of DiD present in tissues. It was represented as percentage of injected dose per gram of tissue (%ID / g) and calculated by %ID / g = (Tissue Value * 100) / (Total injected dose) where the total injected dose was the sum of injected doses in instances in which treatments involved multiple injections.
In vivo treatments and metabolic studies
Non-liposomal oral drug treatments were performed daily from the first to seventh day of the week-long treatment by oral gavage at a dose of 1 μmol/kg/day of tesaglitazar or an equal volume of vehicle (0.5% carboxymethyl cellulose). Vehicle treatment results are labeled as “Vehicle” and tesaglitazar treatment results as “Drug” in Figures 4 and 6. Liposomes containing tesaglitazar or vehicle (calcium acetate) were injected via the tail vein at a dose of 1 μmol/kg/day. Injections were made on the first, third or fourth, and seventh day of the weeklong treatment. For each injection, the appropriate amount of liposomes was administered to deliver 1 µmol/kg/day for the given number of days prior to consecutive treatment. This provided a dose that matches that of the non-liposomal delivery method. Vehicle-treated mice received equal numbers of liposomes to those given tesaglitazar-loaded liposomes. Results from treatments with vehicle-loaded liposomes are labeled as “Vehicle”, from tesaglitazar-loaded liposomes as “Drug”, and from non-liposome treatments as “PBS” in Figure 5 and 6. One day following the final treatment (day 8), mice were fasted for approximately 4 hours in wood chip-lined cages with water provided ad libitum. Following fasting, a small tail snip was made to obtain blood for measuring blood glucose levels with a glucometer (OneTouch Ultra 2 glucometer and UniStrip Technologies 24850). Mice were then placed under anesthesia (Isofluorane) and blood was collected via retro-orbital bleed. Blood was treated with EDTA (0.5 M) and spun down to collect plasma to measure insulin (ALPCO, 80-INSMR-CH01), triglyceride and glycerol levels (Sigma, TR0100), and cholesterol levels (ThermoFisher, TR13421).
QUICKI Index calculations
To determine insulin sensitivity for each mouse, the quantitative insulin sensitivity check index (QUICKI Index) was used. The following equation is used to calculate this index: QUICKI Index = 1/[log(I0) + log(G0)] where I0 is fasting insulin in μU/mL and G0 is fasting glucose in mg/dL [42].
Plasma and liver tesaglitazar concentrations
Plasma sample preparations
Plasma samples (20 µL) as well as spiked, serially diluted blank plasma (20 µL, for standard curve) were placed in a plate (Thermofisher, 260252) and 150 µL of cold acetonitrile (containing internal standard and 0.2 % formic acid) was added to each well. After mixing and centrifugation (20 min, 10,000 G at 4°C), 75 µL of the supernatant was diluted with 75 µL Milli-Q water (containing 33 % acetonitrile and 0.2 % formic acid).
Liver sample preparations
Frozen liver sample weights were recorded (~50-100 mg) and placed in a 2 mL tube (Sarstedt, 72.694.007) containing 6 ceramic beads (Retsch, 05.368.0090) and PBS (1x, pH 7.4) was added in a 4-fold ratio to liver sample weight. Samples were homogenized for 2x20 sec at 5000 rpm (Precellys 24, Bertin, France) and additionally 5 min at 25 Hz (Mixer Mill 301, Retsch, Germany) and centrifuged (10 min, 10,000 G at 4°C). The supernatant (50 µL) as well as spiked, serially diluted blank liver supernatant (50 µL, for standard curve) were placed in a plate (Thermofisher, 260252) and 180 µL of cold acetonitrile (containing internal standard and 0.2 % formic acid) was added to each well. After mixing and centrifugation (20 min, 10,000G at 4°C), 75 µL of the supernatant was diluted with 75 µL Milli-Q water (containing 33 % acetonitrile and 0.2 % formic acid).
Liquid chromatography-mass spectrometry (LC-MS)
Analysis of tesaglitazar concentrations in plasma and liver were performed using reverse phase LC-MS (UPLC Acquity coupled to a Quattro Premier XE, Waters Corporation, Milford, MA, USA). The mobile phases consisted of (A) 2% acetonitrile, 0.1% formic acid in water and (B) 0.1% formic acid in acetonitrile. Separation was performed on an Acquity UPLC HSS T3 1.8 µm column (Waters Corporation, Milford, MA, USA) with the gradient (0.7 mL/min) increased from 5-95% B over 1.0 min, held at 95% B for 1.0 min and returned to initial conditions in one step. Detection was achieved using positive electron-spray ionization (ES+) and the mass transition was 409-199 (CV: 10; CE: 21). Data acquisition and evaluation were performed using MassLynx 4.1 (Waters Corporation, Milford, MA, USA). The method showed linearity over a concentration range of 0.013-3.0 µM.
Tissue harvest
Peritoneal lavages were collected prior to cardiac puncture to collect blood. Perfusion was performed through the left ventricle (after cutting the right atrium) with 10 mL PBS supplemented with 0.5 mM EDTA followed by 5-10 mL of PBS before harvesting all other tissues. Inguinal lymph nodes were removed before harvesting the inguinal (subcutaneous) adipose tissue. All tissues harvested for RNA extraction or cholesterol assays were flash frozen in liquid nitrogen and stored at -80°C.
Processing tissues for flow cytometry
Peritoneal cells
Peritoneal cells were collected by peritoneal lavage. Lavages were spun down and treated with AKC lysis buffer (0.15 M NH4Cl, 0.01 M KHCO3, 0.1 mM EDTA) to lyse remaining red blood cells. Cells were then washed with FACS buffer (PBS, 0.05% NaN3, 1% BSA) to be stained for flow cytometry.
Adipose stromal vascular fraction (SVF) cells
Whole adipose tissue was placed in digestion buffer (0.12 M NaCl, 4.7 mM KCl, 1.3 mM CaCl22H2O, 1.2 mM KH2PO4, 1.2 mM MgSO47H2O, 40 mM HEPES (pH 7.5), 2.5% BSA, 200 nM adenosine, 1 mg/mL Collagenase Type 1), minced, and incubated at 37°C with shaking for 45 minutes. Digested tissue was then washed with FACS buffer, and pelleted separating floating adipocytes from the remaining stromal vascular fraction (SVF) in the pellet. Cells were treated with AKC lysis buffer to lyse remaining red blood cells and then filtered through a 70 µm filter to remove undigested tissue and/or matrix proteins. Cells were then stained for flow cytometry.
Bone marrow cells
Following perfusion, rear femurs and tibias were harvested and excess muscle and tissue removed. The ends of each bone were cut away to access the marrow. Using 5mL of PBS per bone, each bone was flushed using a syringe. Cell suspensions were spun and treated with AKC lysis buffer to lyse remaining red blood cells. Cells were then washed with FACS buffer to be stained for flow cytometry.
Spleen
Spleens were mashed through a 70 µm filter and washed with 10 mL of FACS buffer, then spun down. Cell pellets were resuspended in 5 mL of AKC lysis buffer and incubated for 5 minutes before being quenched with 5 mL of FACS buffer. Cells were then spun down and aliquoted to use 1/50th of each sample for flow cytometry.
Blood cells
100 μL of blood was treated with AKC lysis buffer for 5 minutes. Lysis was quenched with FACS buffer and cells were spun down to be stained for flow cytometry.
Processing livers for cholesterol assays
To quantify cholesterol levels, liver samples (50-100 mg) were homogenized in 2 ml Folch (chloroform/methanol, 2:1, v/v) with a polytron homogenizer. The organic phase was separated with 1 mL of water and centrifugation and then dried under nitrogen. Samples were reconstituted in isopropranol:Triton-X100 (9:1 v/v) and aliquots subjected to colorimetric enzymatic assays for total cholesterol (ThermoFisher, TR13421).
Flow cytometry
All cells were stained with Live/Dead (ThermoFisher, L34966) in PBS for 30 minutes at 4°C then washed with FACS buffer. Next, the cells were stained with fluorescently-labeled antibodies against cell surface proteins (Table S1) in FACS buffer for 25 minutes at 4°C then washed with FACS buffer. Cells were then fixed with 2% PFA for 7-10 minutes at room temperature and washed with FACS buffer. If cells were sorted, they were not fixed. Finally, cells were re-suspended in FACS buffer and stored at 4°C until analyzed. Fixed samples were run on the Attune NxT (Thermofisher; one-week liposome uptake experiments) or CyAN ADP LX (Beckman Coulter; 4 hour and 24 hour liposome uptake and one-week macrophage subset experiments) and live cells were sorted on the INFLUX (BD).
Real-time polymerase chain reaction
RNA was extracted from tissues and cells using Trizol extraction. One µg of RNA was then treated with DNase (Invitrogen) and used to reverse transcribe cDNA using an iScript cDNA synthesis kit (BioRad). To quantify gene expression, cDNA was diluted 1:10 in water and combined with 0.5 mM forward and reverse primers (Table S2) and SYBR Green (SensiFast, BioLine). Semi-quantitative real-time PCR was performed on a CFX96 Real-Time System with an annealing temperature of 60°C for all reactions (BioRad). Data were calculated by the ΔΔCt method and expressed in arbitrary units that were normalized to 18s ribosomal RNA or Tata box binding protein (Tbp) levels.
Immunofluorescence
Livers were fixed in 4% PFA and then subjected to a sucrose gradient (10% overnight, 20% 6hrs, 30% overnight) at 4°C, rotating. Then, tissues were embedded in OCT and 10 μm sections obtained. For staining, tissue sections were permeabilized with 0.25% Triton-100 in PBS, and then washed in PBS. Sections were blocked with 10% Horse Serum in 0.3% fish skin gelatin in PBS, then incubated with rat anti-CLECSF13 antibody (R&D Systems, MAB2784) at a 1:250 dilution in 10% Serum in PBS overnight at 4°C. Sections were washed as before and then incubated with donkey anti-rat Dylight 550 secondary antibody at a 1:250 dilution. Following one final wash, slides were counterstained with DAPI and coverslipped using ProLong Gold (Life Technologies). Z-stack images were obtained at 1 μm intervals using Zeiss LSM700 confocal microscope, 20X objective. Figures shown are maximal intensity projection images.
Whole-mounted imaging
Aliquots of epididymal and subcutaneous adipose were fixed in 4% PFA then washed in PBS. Adipose was blocked and permeabilized in 5% BSA, 0.3% Triton in PBS before incubating overnight with an anti-CD68-PE conjugated antibody (Biolegend, Clone FA-11) and an Isolectin GS-IB4-AF488 conjugate (Thermofisher) at 4°C. After a final wash, samples were mounted in a 1:1 solution of PBS:Glycerol and digital images were acquired using confocal microscopy (Nikon Instruments Incorporated, Model TE200-E2; 20X objective). 40 μm Z-stacks with 2 μm step size were acquired with a 20x magnification power and processed using ImageJ software.
Statistics
All statistical analyses were performed using Prism 7 (GraphPad Software, Inc.). Mann-Whitney U tests were used to analyze oral treatment experimental groups, while Kruskal-Wallis with Dunn's multiple comparison tests were used to analyze liposome treatment experimental groups. Data are expressed as mean ± standard deviation (SD). P values are specified in figure legends.
Results
Synthesis, circulation kinetics, and tissue biodistribution of tesaglitazar-loaded liposomes
PEGylated liposomes labeled with fluorescent DiD and loaded with tesaglitazar were synthesized for these studies with an average size of approximately 160 nm (Figure 1A-C). Following months of refrigerated storage, particle size and size distribution did not change significantly (Figure 1A). Repeats of the ultrafiltration tests showed that tesaglitazar was not presented at a significant quantity outside the ultrafilters, with over 90% retained. This drug retention is similar to what is observed for Doxil/Lipodox, which is also prepared by remote loading (Figure 1A). The zeta potential of the liposomes was -19.2 mV ± 13 mV and drug loading was 245 μg/mg of DSPC (Figure 1A). Pharmacokinetic and biodistribution studies were performed using LC-MS and fluorescence molecular tomography (FMT) and the amount of DiD in each tissue was quantifed from reconstructed images. The half-life of the liposomes in circulation was estimated to be 22.4 ± 10.4 h by non-compartmental analysis. It is hence in the same order of magnitude as the half-life of orally delivered tesaglitazar (35.4 ± 23.4 h, Figure 1D). Estimations of the C-max reveal a value of 0.62 ± 0.20 μmol tesaglitazar/L for orally-delivered tesaglitazar, while liposomal delivery demonstrated a C-max value of 4.38 ± 0.68 (Figure 1D).
Figure 1
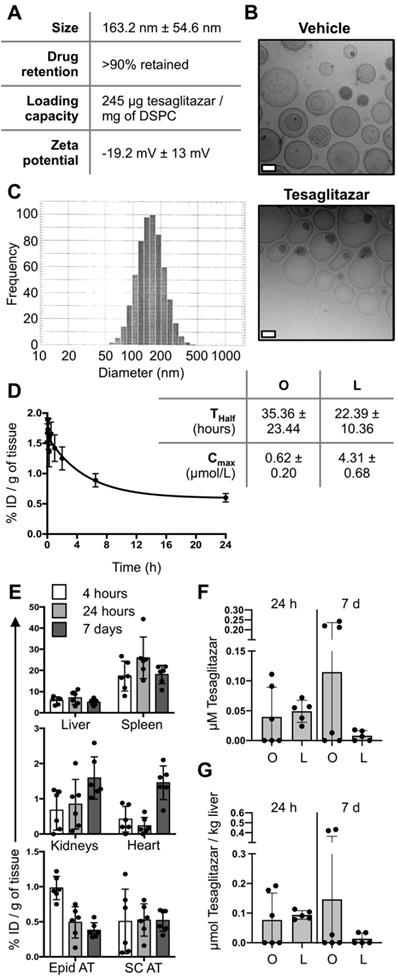
Liposome synthesis and blood and tissue PK and biodistribution. (A) Liposomes were synthesized, labeled with DiD, and loaded with tesaglitazar. Data reporting liposome characteristics are listed. (B) CryoTEM images of vehicle- and tesaglitazar-loaded liposomes are displayed to provide examples of liposome shape. White scale bars represent 50 nm. (C) DLS was utilized to quantify liposome size. (D) Tesaglitazar was administered orally (O) and in DiD-labeled liposomes (L) and blood was harvested at multiple time points to calculate the half-life (Thalf) and C-max (Cmax) of drug in circulation using non-compartmental analysis. (E) FMT was used to quantify liposome uptake in liver, spleen, kidneys, heart, Epid and SC adipose tissues four and 24 hours following administration as well as after seven days with three administrations of liposomes. (F,G) LC-MS was utilized to quantify tesaglitazar levels in circulation (F) and in liver tissue (G) at 24-hour and 7-day time points post-treatment. Standard oral formulation (O) and liposomal (L) delivery methods were compared to verify comparable drug exposure levels. Data represents the mean ± SD.
Calculated as percent injected dose per gram of tissue, DiD content in the liver, spleen, kidney, heart, epididymal (Epid) and subcutaneous (SC) adipose tissues were quantified at 4 hours, 24 hours and 7 days post-liposome treatment (Figure 1E). Levels of tesaglitazar at 24 hour and 7 days post-treatment in circulation and the liver were quantified using LC-MS and revealed that standard oral formulation and liposome treatments resulted in similar drug accumulation in both compartments (Figure 1F,G). It should be noted that neither of these time points were at C-max.
Macrophages were the predominant cell type that took up liposomes in visceral white adipose tissue
To characterize the cell types that take up drug-loaded liposomes in our system, DiD-labeled liposomes were administered intravenously to ob/ob mice three times over the course of one week (Figure 2A). Immunofluorescence staining of livers from these mice revealed co-localization of DiD and Kupffer cell marker CLECSF13 (Figure 2B, Figure S1). Flow cytometry was performed to identify the cell types that take up tesaglitazar-loaded liposomes in adipose tissue and the peritoneal cavity (Figure S2A, Figure S3A). We found that nearly all CD45+F4/80+ macrophages in the adipose stromal vascular fraction (SVF) and the peritoneal cavity (PerC) were DiD+ (Figure 2C). Consistent with flow cytometry findings, immunofluorescent staining with the macrophage marker CD68 demonstrated that DiD-labeled liposomes co-localized with macrophages within whole mounted white adipose tissue samples (Figure 2D, Figure S4). Of the total DiD+ population, macrophages made up approximately 67% and 40% of DiD+ cells in epididymal (Figure 2E) and subcutaneous (Figure 2F) SVFs, respectively. Other CD45+ cells as well as CD45- vascular and stromal cells, particularly endothelial cells (ECs), were DiD+ demonstrating that cells other than professional phagocytes are capable of liposomal uptake (Figure 2E-F, Figure S2B,C). Various cell types including macrophages and other immune cells such as B and T cells in the peritoneal cavity (Figure S3B), bone marrow (Figure S5B), and blood (Figure S6B) also took up liposomes.
Figure 2
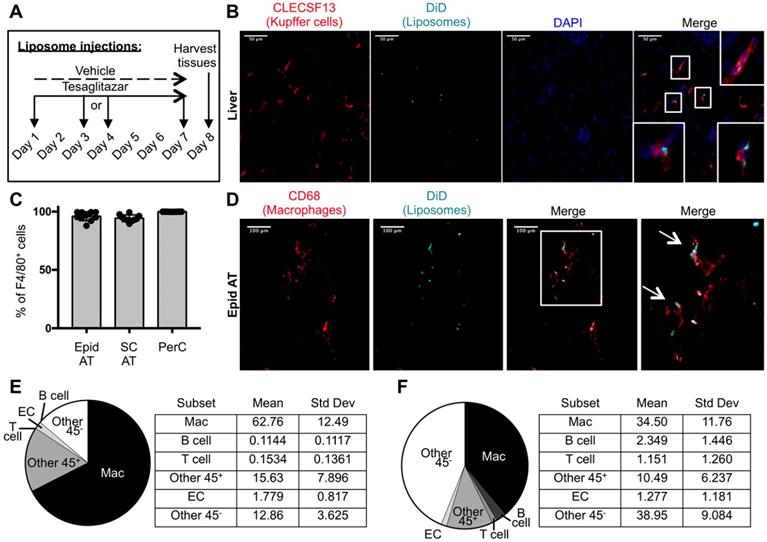
Cellular characterization of liposome uptake after one week of treatment. (A) DiD-labeled liposomes were injected intravenously into male ob/ob mice three times over the course of seven days. (B) Z-stack images of liver sections from ob/ob mice treated with tesaglitazar-loaded liposomes were stained with CLECS13F to identify Kupffer cells and assessed for co-localization with DiD-labeled liposomes. Co-localization of CLECS13F+ cells and DiD are marked by white boxes. (C) Peritoneal lavages and Epid and SC AT were harvested to stain peritoneal cavity (PerC) cells and SVF cells, respectively, for analysis by flow cytometry. The percentage of CD45+F4/80+ macrophages that were DiD+ was quantified. (D) Z-stack images of whole mounted Epid AT from an ob/ob mouse treated with tesaglitazar-loaded liposomes was stained with CD68 to identify macrophages and assessed for co-localization with DiD-labeled liposomes. Co-localization of interstitial CD68+ cells and DiD are marked by white arrows. The white box delineates the area of the merged image that is enlarged (right-most panel). (E,F) DiD+ macrophages and other cell subsets were also quantified as a percent of total DiD+ cells in the Epid AT (E) and SC AT (F), n = 5 in each group. The cell subsets analyzed were macrophages (Mac, CD45+F4/80+), B cells (CD45+CD19+), T cells (CD45+CD3+), other CD45+ Cells (Other 45+, CD45+CD19-CD3-F4/80-), endothelial cells (EC, CD45-CD31+), and other CD45- cells (Other 45-, CD45-CD31-). Data represents the mean ± SD.
To better understand the initial kinetics by which liposomes are taken up by macrophages and other cell types, male ob/ob mice were administered a single dose of tesaglitazar-loaded DiD-labelled liposomes and the circulation time and cellular uptake of liposomes at 4 and 24 hours post-injection was assessed. A significant proportion of CD115+ monocytes, which can differentiate into macrophages, in the blood were DiD+ at 4 and 24 hours post-injection (Figure S6C). Additionally, nearly all macrophages found in the spleen were also DiD+ at early time points (Figure S7) and within the bone marrow, macrophages make up the highest proportion of DiD+ cells (Figure S5D). Within the adipose, a smaller proportion of macrophages were DiD+ and, notably, CD31+ ECs and other CD45- stromal and vascular cells made up a greater proportion of DiD+ cells after four and 24 hours (Figure 3A-D, Figure S8). However, when quantifying the DiD mean fluorescent intensity (MFI), which is the level of fluorescence per cell, DiD MFI was highest in the macrophage population in adipose tissue suggesting that macrophages took up a larger portion of liposomes per cell than other subsets (Figure 3E, Figure S2D). When comparing uptake at four hours post-injection to 24 hours post-injection, an increase in the proportion of macrophages that were DiD+ can already be observed (Figure S2E). This accumulation of liposomes in the adipose tissue as well as the peritoneal cavity continues over the course of a seven-day treatment (Figure 3F).
Tesaglitazar delivered as a standard oral formulation improved metabolic parameters and reduced total macrophage and pro-inflammatory macrophage numbers in white adipose tissue
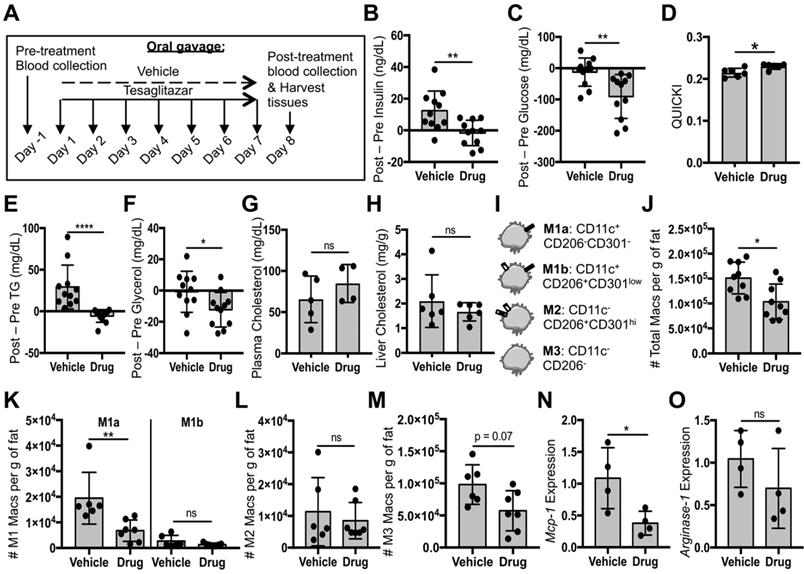
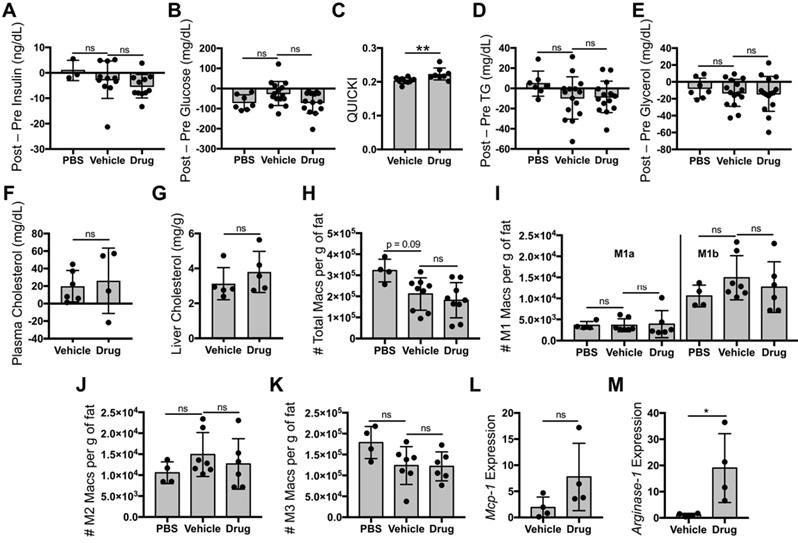
Given the established anti-inflammatory role of PPARα and -γ in macrophages, we first investigated whether tesaglitazar administered as a standard oral formulation had effects on macrophage populations in vivo. Ob/ob mice were treated with tesaglitazar via daily oral administration for one week before assessing circulating metabolic parameters and ATM populations by flow cytometry (Figure 4A). Consistent with previous studies [43], we found that one week of oral tesaglitazar treatments reduced levels of circulating insulin (Figure 4B) and glucose (Figure 4C). These changes resulted in improved indices of insulin sensitivity, as indicated by the QUICKI index (Figure 4D). Tesaglitazar treatment also resulted in reduced triglycerides (Figure 4E) and glycerol (Figure 4F), but no change in cholesterol levels in circulation (Figure 4G) or in the liver (Figure 4H). Efficacy of tesaglitazar treatment in a model of high-fat diet-induced obesity was performed to validate efficacy of the treatment in other models of obesity-associated dysmetabolism. One week of daily tesaglitazar treatments effectively lowered circulating insulin (Figure S9A) and triglyceride levels (Figure S9B), but did not affect glucose (Figure S9C) or glycerol levels (Figure S9D), nor did it improve QUICKI index values (Figure S9E). Furthermore, we found that equal doses of tesaglitazar for one week did not induce expression of PPARα and -γ gene targets in the liver and Epid AT as effectively in the DIO model as they did in the ob/ob strain of mice (Figure S9F). For these reasons, the ob/ob model was utilized in all other experiments in this study.
Flow cytometry gating for macrophage subsets in this study was based on previously published strategies [31, 44, 45] (Figure 4I, Figure S2A). Mice treated orally with tesaglitazar had fewer total CD45+F4/80+CD11b+ macrophages in Epid AT (Figure 4J) with a trend to fewer macrophages in SC AT (Figure S10B). Additionally, the standard oral formulation of tesaglitazar reduced pro-inflammatory M1a macrophage numbers (Figure 4K, Figure S10C), but did not change pro-inflammatory M1b (Figure 4K, Figure S10C) or resident, anti-inflammatory, M2 macrophage numbers (Figure 4L, Figure S10D). There was also a trend towards reducing the number of Epid M3 macrophage numbers (Figure 4M), which have been characterized as macrophages enriched in mRNA expression of chemokine receptors Ccr9, Ccr2, and Cx3cr1 [46]. Finally, we measured expression of M1 gene marker Monocyte chemoattractant protein-1 (Mcp-1) and M2 gene marker Arginase-1 in CD45+CD11b+F4/80+ macrophages sorted from mice treated with vehicle or tesaglitazar and found that standard oral formulation treatments of tesaglitazar reduced Mcp-1 expression levels (Figure 4N), but did not affect Arginase-1 levels (Figure 4O).
Figure 3
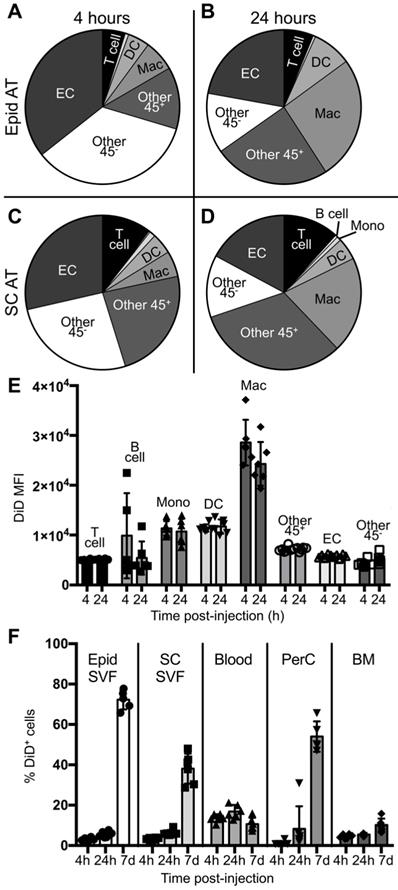
Cellular biodistribution of liposomes at 4- and 24-hour time points. DiD-labeled liposomes were injected intravenously into male ob/ob mice and tissues were harvested four or 24 hours later. Peritoneal lavages, bone marrow, blood and Epid and SC AT were harvested to stain peritoneal cavity (PerC), bone marrow (BM), blood, and SVF cells, respectively, for analysis by flow cytometry. (A-D) DiD+ macrophages and other cell subsets were also quantified as a percent of total DiD+ cells at four (A,C) and 24 hours (B,D) post-injection in the Epid AT (A,C) and SC AT (B, D), n = 6 in each group. The cell subsets analyzed were macrophages (Mac, CD45+F4/80+), B cells (CD45+CD19+), T cells (CD45+CD3+), monocytes (Mono, CD45+CD115+), dendritic cells (DC, CD45+CD11c+), other CD45+ Cells (Other 45+, CD45+CD19-CD3-F4/80- CD11c- CD115-), endothelial cells (EC, CD45-CD31+), and other CD45- cells (Other 45-, CD45-CD31-). (E) The mean fluorescence intensity (MFI) of DiD within each of these subsets was also quantified in Epid AT. (F) The percent of total cells in all aforementioned tissues that were DiD+ was also quantified. Data represents the mean ± SD.
Figure 4
Tesaglitazar delivered as a standard oral formulation improved metabolic parameters and reduced total macrophage and pro-inflammatory macrophage numbers in white adipose tissue. (A) Male ob/ob mice were treated daily by oral administration of tesaglitazar or vehicle for seven days. To assess metabolic effects, blood was harvested from mice before and after treatments and plasma was harvested. (B,C) Circulating insulin (B) and glucose (C) levels before and after treatment were measured and the changes in levels per mouse were calculated. (D) Post-treatment levels were also utilized to quantify QUICKI index for each mouse. (E-G) Circulating triglyceride (E), glycerol (F), and cholesterol (G) levels before and after treatment were measured and the changes in levels per mouse were calculated. (H) Post-treatment cholesterol levels in the liver were also quantified. (I) Epid SVF cells from ob/ob mice were stained with antibodies against markers of macrophages and macrophage subsets to quantify cell numbers by flow cytometry. (J) Total CD45+CD11b+F4/80+ macrophage numbers from epididymal adipose were normalized to the total mass of the adipose depot. (K-M) M1a and M1b (K), M2 (L), and M3 (M) macrophage subsets were quantified and normalized to total adipose mass as well. (N,O) RNA was extracted from sorted CD45+CD11b+F4/80+ peritoneal macrophages and macrophage chemokine Mcp-1 (N) and M2 marker Arginase-1 (O) expression levels were quantified. Data represents the mean ± SD; * p ≤ 0.05, ** p ≤ 0.01, **** p ≤ 0.0001. Vehicle indicates animals treated orally with vehicle, drug indicates animals treated orally with tesaglitazar.
Liposomal delivery of tesaglitazar does not substantially improve metabolic parameters nor reduce pro-inflammatory ATM numbers
Since most ATMs took up liposomes, we then investigated whether liposomal delivery of tesaglitazar (Figure 2A) would affect metabolic parameters and ATM populations similarly to that of orally administered tesaglitazar (Figure 4A). One week of treatment with tesaglitazar-loaded liposomes did not significantly lower levels of fasting blood insulin (Figure 5A) or glucose (Figure 5B), but did improve indices of insulin resistance (Figure 5C). Tesaglitazar treatments did not reduce triglycerides (Figure 5D), glycerol (Figure 5E), or cholesterol in circulation (Figure 5F) in the liver (Figure 5G) beyond those of vehicle-loaded liposomes. Additionally, liposomal delivery of tesaglitazar did not affect total macrophage numbers in Epid or SC AT (Figure 5H, Figure S10B) compared to vehicle liposomes. Tesaglitazar-loaded liposomes did not alter M1a (Figure 5I, Figure S10C), M1b (Figure 5I, Figure S10C), M2 (Figure 5J, Figure S10D), or M3 (Figure 5K, Figure S10E) macrophage numbers compared to vehicle-loaded liposomes or PBS. Interestingly, liposomal delivery of tesaglitazar did not affect M1 gene marker Mcp-1 (Figure 5L), but induced M2 gene marker Arginase-1 (Figure 5M) in sorted CD45+CD11b+F4/80+ macrophages.
Liposomal delivery of tesaglitazar attenuates PPARα/γ agonism in the liver and kidney
To compare the impact of oral and liposomal delivery methods on inducing drug action in the liver and kidney, ob/ob mice were treated with tesaglitazar and vehicle controls by either oral (Figure 4A) or liposomal (Figure 2A) delivery. Oral delivery of tesaglitazar significantly increased liver mass in ob/ob mice, while there was no statistically significant change in liver mass in mice treated with tesaglitazar-loaded liposomes compared to controls (Figure 6A). Oral administration of tesaglitazar induced expression of PPARα target genes in the liver with a 386-, 25-, and 24-fold induction of Fapb3 (Figure 6B), Ehhadh (Figure 6C), and Lpl (Figure 6D), respectively, over vehicle controls. Gene expression changes in the liver were attenuated when tesaglitazar was administered in liposomes as opposed to standard oral formulation. Indeed, liposomal delivery of tesaglitazar had no effect on Lpl expression in the liver (Figure 6D), and moderately induced expression of the other PPARα gene targets Ehhadh and Fabp3 by 4- and 17-fold, respectively, over controls (Figure 6B,C). A similar effect was seen in the kidney: tesaglitazar induced a 3-fold increase in expression of PPARγ target genes Pdk4 (Figure 6E) and Ehhadh (Figure 6F), in the kidneys compared to vehicle controls. Liposomal delivery of tesaglitazar did not significantly induce expression of PPARγ gene targets Ehhadh and Pdk4 in the kidney over controls (Figure 6E,F).
Discussion
In this study, a murine model of obesity-associated dysmetabolism was treated with PPARα/γ dual agonist tesaglitazar as a standard oral formulation or intravenously in liposomes in order to (1) further characterize the cell types that take up liposomes in vivo, (2) investigate whether liposomes could effectively attenuate drug action in the liver and kidney, and (3) determine if tesaglitazar delivered either as a standard oral formulation or in liposomes had anti-inflammatory effects on macrophage populations.
Figure 5
Liposomal delivery of tesaglitazar does not improve metabolic parameters nor reduce pro-inflammatory ATM numbers. Male ob/ob mice were treated intravenously three times over the course of seven days with PBS, vehicle-loaded liposomes, or tesaglitazar-loaded liposomes. To assess metabolic effects, blood was harvested from mice before and after treatments and plasma was harvested. (A,B) Circulating insulin (A) and glucose (B) levels before and after treatment were measured and the changes in levels per mouse were calculated. (C) Post-treatment levels were also utilized to quantify QUICKI index for each mouse. (D-F) Circulating triglyceride (D), glycerol (E), and cholesterol (F) levels before and after treatment were measured and the changes in levels per mouse were calculated. (G) Post-treatment cholesterol levels in the liver were also quantified. As before, Epid SVF cells from ob/ob mice treated via oral or liposomal delivery for seven days were stained with antibodies against markers of macrophages and macrophage subsets to quantify cell numbers by flow cytometry. (H) Total CD45+CD11b+F4/80+ macrophage numbers from epididymal adipose were normalized to the total mass of the adipose depot. (I-K) M1a and M1b (I), M2 (J), and M3 (K) macrophage subsets were quantified and normalized to total adipose mass as well. (L,M) RNA was extracted from sorted CD45+CD11b+F4/80+ peritoneal macrophages and macrophage chemokine Mcp-1 (L) and M2 marker Arginase-1 (M) expression levels were quantified. Data represents the mean ± SD; * p ≤ 0.05, ** p ≤ 0.01. Vehicle indicates vehicle-loaded liposomes, drug indicates tesaglitazar-loaded liposomes, PBS indicates no liposomes.
Figure 6
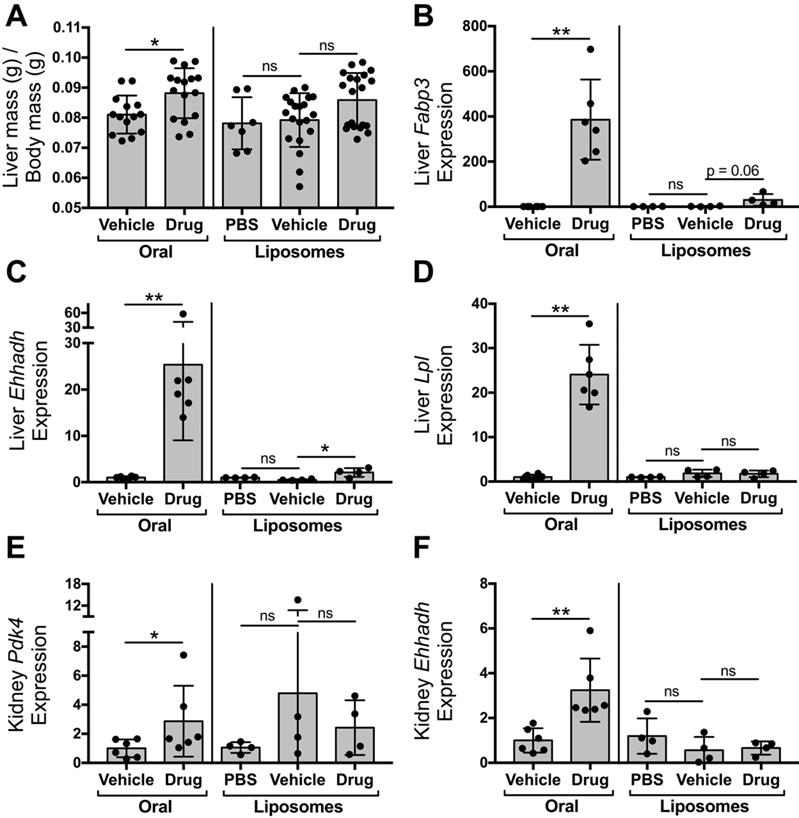
Liposomal delivery attenuates tesaglitazar-induced effects in the kidney and liver observed with administration of a standard oral formulation. Male ob/ob mice were either treated daily by oral administration of tesaglitazar or vehicle for seven days or treated intravenously three times over the course of seven days with PBS, vehicle-loaded liposomes, or tesaglitazar-loaded liposomes. After the final treatment, livers and kidneys were harvested from each mouse and total body and liver mass was measured. (A) Liver mass was quantified relative to total body mass. (B-D) RNA extracted from livers of each mouse was used to quantify relative gene expression of Fabp3 (B), Ehhadh (C), and Lpl (D) by qRT-PCR. (E-F) RNA extracted from kidneys of each mouse was used to quantify relative gene expression of Pdk4 (E) and Ehhadh (F), by qRT-PCR. Data represents the mean ± SD; * p ≤ 0.05, ** p ≤ 0.01. Vehicle indicates vehicle-loaded liposomes or vehicle-treated animals, drug indicates animals treated by tesaglitazar-loaded liposomes or a standard oral formulation, PBS indicates no liposomes.
Ergen et al. recently found that myeloid subsets including macrophages take up liposomes in a number of tissues including liver, kidney, and lung, but uptake in the adipose tissue and by non-myeloid cells was not determined [47]. Our results represent a fuller characterization of in vivo liposomal uptake in myeloid and non-myeloid cell types and include analysis of adipose tissue at multiple time points. After one week of treatment, liposomes were taken up by nearly 100% of macrophages in adipose tissue and the peritoneal cavity. With regard to potentially treating macrophage-induced effects in adipose tissue, our data would suggest that excellent delivery could be achieved. But many other cell types including CD19+ B cells, CD3+ T cells, and CD31+ ECs, and other CD45- cells, which could be fibroblasts, vascular smooth muscle cells (VSMCs), or progenitor cells, also took up these liposomes in adipose tissue of obese mice. This finding introduces an important caveat of our study, as well as many other studies employing the use of liposomes, that may affect our understanding of the mechanisms driving observed biological outcomes. Therefore, we cannot conclude with certainty that observed tesaglitazar-loaded liposome-induced biological effects were due to uptake and action in macrophages only since so many other cell types took up liposomes.
This finding raises interesting questions regarding the cell-specific effects of tesaglitazar in non-macrophage cells. Generally, PPARα and PPARγ have anti-inflammatory effects in non-macrophage immune cells. PPARγ and -α agonism in T cells inhibits proliferation and cytokine expression [48-51] and PPARγ also promotes FoxP3+ Treg accumulation in adipose tissue [52, 53]. PPARγ activation in dendritic cells attenuates toll-like receptor activation and promotes cell migration to lymph nodes during lung inflammation [54, 55]. PPARγ activation has been shown to boost memory responses in B cells through antibody production and differentiation [56, 57]. These responses may be considered beneficial or detrimental depending on the disease or infection context. In vascular and stromal cells, PPARα and -γ generally play anti-fibrotic and anti-proliferative roles. Global knockout of PPARγ in mice is embryonically lethal due to vascular defects [58] and, depending on the environment; PPARγ can be pro- or anti-angiogenic in adults [59, 60]. PPARα and PPARγ both inhibit proliferation and promote apoptosis of VSMCs [61, 62] and induce anti-fibrotic effects in fibroblasts [63-65] and liver stellate cells [66]. Overall, studies suggest the possibility that PPARα/γ agonism in most cells targeted by our tesaglitazar-loaded liposomes could induce anti-inflammatory responses. Whether these changes facilitate improved metabolic outcomes is unclear from this study, but the reduced PPARα and -γ agonism in the liver suggests these improvements would be limited. Metabolic changes may have also been limited due to the short duration of the treatments performed. Follow-up studies extending the duration of liposomal treatment would address whether longer-term liposome treatments could improve metabolic outcomes. Furthermore, there is the challenge of identifying the cell types in which PPARα/γ agonism has beneficial effects. Delivery methods that target specific cell types would be the optimal approach to assess this.
Additionally, assessment of liposomal uptake at different time points revealed that monocytes in circulation and vascular cells in adipose tissue initially take up liposomes. However, within the first 24 hours, the percentage of adipose SVF cells that contain liposomes significantly increases even as the MFI, or amount of DiD in the cell, does not. This suggests that it may be the cells rather than the liposomes alone that are entering from the circulation with time. These data suggest that penetration of the vessel wall by liposomes to effect drug delivery of immune cells in inflamed tissues may be facilitated by disease-associated increases in tissue immune cell accumulation. These findings prompt additional questions regarding liposome biodistribution over time and the specificity of liposome targeting that could be pursued in future studies. Overall, our fulsome approach for evaluating liposome uptake in vivo with flow cytometry is a useful tool to understand the cellular mechanisms by which liposomal delivery of compounds may influence biological outcomes and the residual potential risks of off target effects.
Additionally, we were able to validate that liposomal delivery of a drug can indeed attenuate drug action in liver and kidney observed by non-liposomal delivery methods. We observed equivalent drug levels in the liver at the end of treatment and greater C-max values in mice treated with liposomes than orally-delivered tesaglitazar. Furthermore, our findings suggest drug-loaded liposomes were predominantly taken up by Kupffer cells, not hepatocytes. We hypothesize that this transfer of drug delivery away from hepatocytes and toward Kupffer cells is a likely mechanism for the dampened effects in the liver and kidney. Indeed, Ehhadh is expressed at high levels in hepatocytes [67] and we observed significant attenuation of tesaglitazar-induced Ehhadh by liposomal delivery. Consistent with the study by Nakashiro et al. [25], we also found attenuation of drug-induced gene expression in the kidney. Hepatic and renal toxicity are caused by many medications and supplements, so liposomal delivery may be a valuable approach to reduce hepatocyte and kidney uptake and toxicity of many compounds.
On the other hand, some therapeutic effects of drugs are dependent on drug action in hepatocytes. Tesaglitazar is one example of such compounds: its beneficial effects are in part due to action in the liver. Indeed, loss of PPARγ expression in the liver exacerbates dysmetabolism associated with obesity [68]. Our results demonstrate that tesaglitazar delivered as a standard oral formulation effectively improves indices of insulin resistance and lowers circulating levels of triglycerides, insulin, and glucose. Liposomal treatment, however, only improved QUICKI index values leaving circulating levels of triglycerides, insulin, and glucose unchanged. This reduced delivery to hepatocytes may explain the discrepancies between delivery methods on metabolic efficacy. Given the altered delivery kinetics and reduced bioavailability of liposomes while in circulation, it is also possible that longer treatment duration may result in improved metabolic effect. An additional follow-up study extending treatment duration would directly address this possibility.
The rationale for selecting tesaglitazar for this study came in two parts. Our first motive was its profound and easily quantified effects in the liver and kidney. Additionally, however, utilizing tesaglitazar provided an opportunity to test whether delivery of a PPARα/γ dual agonist to macrophages was sufficient to improve metabolic outcomes in a murine model of obesity. A study by Odegaard et al. demonstrated that expression of PPARγ in macrophages is important for improving insulin resistance during metabolic syndrome [26]. Our approach eliminated any caveats that come with genetic knockout studies and also applied a potential therapeutic strategy to previous findings regarding the role of PPARα and -γ in macrophages.
Results of the present study are the first to fully characterize the effects of PPARα/γ dual agonism on macrophage subtypes in adipose tissue during obesity. Additionally, we employed a recently updated flow cytometry staining and gating strategy to characterize adipose tissue macrophages subtypes based on work by Lumeng and others [31]. Pro-inflammatory, M1 macrophages are important cellular mediators of inflammation and insulin resistance [29, 30] and PPARα and -γ agonism and genetic knockout demonstrate anti-inflammatory effects in macrophages both in vitro and in vivo [26, 32-35]. Oral administration of tesaglitazar significantly reduced the number of pro-inflammatory M1a ATMs. Consistent with the role of these subtypes in inflammation and the link between inflammation and metabolism, oral delivery of tesaglitazar also improved metabolism.
However, liposomal delivery of tesaglitazar did not reduce pro-inflammatory ATM numbers suggesting PPARα/γ dual agonism in non-macrophage cell types may influence ATM biology. The attenuated effects were not due to inadequate liposomal uptake as 95-100% of macrophages in SC AT, Epid AT, and the peritoneal cavity took up drug-loaded liposomes. Furthermore, increased PPARγ gene target Arginase-1 levels in macrophages treated with tesaglitazar-loaded liposomes provided evidence that drug was released and PPARγ agonism occurred in macrophages following liposomal uptake in vivo. Interestingly, the effect of non-liposomal tesaglitazar treatments on ATM Mcp-1 levels was opposite to that of liposomal delivery, suggesting that ATM Mcp-1 expression was not due to direct PPARα/γ transcription regulation in ATMs. Adipocytes and other stromal cell types, such as ECs and VSMCs, express macrophage function-modulating signals in response to excess lipid loading and hypoxia [69-71] and thus tesaglitazar action in these cell types may results in secretion of molecular signals to induce paracrine effects that regulate ATM populations. Indeed, only about 10% and 40% of CD45- cells in Epid and SC AT, respectively, took up liposomes so drug action in these cell types was likely attenuated relative to non-liposomal tesaglitazar treatments. This may explain why the standard oral formulation of tesaglitazar, but not liposomal delivery was able to induce reduced numbers of ATMs. Development of a targeted liposome construct to deliver tesaglitazar to more CD45- or other non-macrophage subtypes could aid in verifying the hypothesis that tesaglitazar effects in non-macrophage cells influence ATM biology and potentially increase the beneficial metabolic effects of tesaglitazar.
Alternatively, targeting other anti-inflammatory compounds to macrophages in liposomes, using macrophage-specific targeting moieties, or utilizing mechanical manipulation of macrophages via magnetic nanoparticles may also improve metabolic outcomes. Glucocorticoid receptor (GR) agonism has potent anti-inflammatory effects and GR agonists have been used as rheumatoid arthritis therapies, though undesired side effects remain in many patients [72-74]. Liposome targeting of a GR agonist to macrophages could be a means of increasing their therapeutic window. Recently, a study utilizing a mannose receptor-targeted nanoparticle to target delivery of PPARα/γ agonist, lobeglitazone, to macrophages in advanced atherosclerotic plaques effectively reduced plaque burden and inflammation [39]. Future studies evaluating the capacity of this targeted particle to target ATMs and improve symptoms in an obese, diabetic model may prove successful. Additionally, studies have demonstrated that delivery of magnetic nanoparticles to macrophages followed by induction of varying mechanical forces can alter macrophage phenotype [75, 76]. Applying such a technique in vivo to induce an anti-inflammatory phenotype may effectively treat symptoms of obesity-associated dysmetabolism.
Finally, we found it surprising that liposomal delivery of tesaglitazar did not change expression of Mcp-1 in macrophages, given that PPARα and -γ agonists have previously been shown to inhibit MCP-1 expression [33, 77]. This led us to question whether PPARα/γ agonism coupled with liposomal uptake differentially affects transcriptional regulation. Indeed, lipids that are commonly used in liposomal formulations have been shown to influence macrophage biology [78, 79]. Further investigation is needed to better understand the biological action(s) of these liposomes in vivo.
Conclusions
In summary, this study demonstrates that (1) macrophages are the predominant cell type that takes up drug-loaded liposomes in vivo, however our fulsome analysis highlights the need to understand the potential impact of therapeutic drugs in other cell types. (2) For the first time, we demonstrate that a PPARα/γ dual agonist reduces inflammatory macrophages in adipose tissue through paracrine effects. And finally, (3) liposomal delivery is an effective strategy to reduce drug action in hepatocytes and kidneys.
Abbreviations
AT: adipose tissue; ATM: adipose tissue macrophages; DSPC: 1,2-distearoyl-sn-glycero-3-phosphocholine; DSPE: 1,2-distearoyl-sn-glycero-3-phosphoethanolamine; Ehhadh: enol-CoA hydratase and 3-hydroxyacyl CoA dehydrogenase; EC: endothelial cell; Epid: epididymal; Fabp: fatty acid binding protein; FACS: fluorescently activated cell sorting; FMT: fluorescence molecular tomography; GR: gluococorticoid receptor; Lpl: lipoprotein lipase; MCP-1: monocyte chemoattractant protein-1; MFI: mean fluorescent intensity; Pdk4: Pyruvate dehydrogenase kinase 4; PEG: polyethylene glycol; PerC: peritoneal cavity; PPAR: peroxisome proliferator-activated receptor; RES: reticuloendothelial system; SC: subcutaneous; SD: standard deviation; SVF: stromal vascular fraction; Tbp: tata box binding protein; VSMCs: vascular smooth muscle cells.
Supplementary Material
Supplementary figures and tables.
Acknowledgements
This work was financially supported by AstraZeneca. The authors thank Kristina Wallenius, Lena Svensson, and Peter Gennemark from Astrazeneca for their assistance with acquiring and analyzing pharmacokinetic data (KW, LS, PG) and providing language help (PG). The authors also thank Chantel McSkimming from the McNamara Lab, and Joanne Lannigan and Mike Solga from the University of Virginia Flow Cytometry Core for technical advice (JL, MS, CM) and assistance on flow cytometry experiments (MS, CM). The authors also thank Ira Schulman from the Department of Pharmacology and Susanna Keller from the Department of Medicine, Division of Endocrinology at the University of Virginia for providing guidance and protocols to execute metabolic assays.
Competing Interests
The authors have declared that no competing interest exists.
References
1. Allen TM, Cullis PR. Liposomal drug delivery systems: from concept to clinical applications. Adv Drug Deliv Rev. 2013;65:36-48
2. Sercombe L, Veerati T, Moheimani F, Wu SY, Sood AK, Hua S. Advances and Challenges of Liposome Assisted Drug Delivery. Front Pharmacol. 2015;6:286
3. Song G, Petschauer JS, Madden AJ, Zamboni WC. Nanoparticles and the mononuclear phagocyte system: pharmacokinetics and applications for inflammatory diseases. Curr Rheumatol Rev. 2014;10:22-34
4. He H, Ghosh S, Yang H. Nanomedicines for dysfunctional macrophage-associated diseases. J Control Release. 2017;247:106-26
5. Kelly C, Jefferies C, Cryan SA. Targeted liposomal drug delivery to monocytes and macrophages. J Drug Deliv. 2011;2011:1-11
6. Deshpande PP, Biswas S, Torchilin VP. Current trends in the use of liposomes for tumor targeting. Nanomedicine (Lond). 2013;8:1509-28
7. Xue Y, Xu X, Zhang XQ, Farokhzad OC, Langer R. Preventing diet-induced obesity in mice by adipose tissue transformation and angiogenesis using targeted nanoparticles. Proc Natl Acad Sci U S A. 2016;113:5552-7
8. Chatzigeorgiou A, Karalis KP, Bornstein SR, Chavakis T. Lymphocytes in obesity-related adipose tissue inflammation. Diabetologia. 2012;55:2583-92
9. Wang YX. PPARs: diverse regulators in energy metabolism and metabolic diseases. Cell Res. 2010;20:124-37
10. Burri L, Thoresen GH, Berge RK. The Role of PPARalpha Activation in Liver and Muscle. PPAR Res. 2010;2010:1-11
11. Gavrilova O, Haluzik M, Matsusue K, Cutson JJ, Johnson L, Dietz KR. et al. Liver peroxisome proliferator-activated receptor gamma contributes to hepatic steatosis, triglyceride clearance, and regulation of body fat mass. J Biol Chem. 2003;278:34268-76
12. Ahmadian M, Suh JM, Hah N, Liddle C, Atkins AR, Downes M. et al. PPARgamma signaling and metabolism: the good, the bad and the future. Nat Med. 2013;19:557-66
13. Bays H, McElhattan J, Bryzinski BS, Group GS. A double-blind, randomised trial of tesaglitazar versus pioglitazone in patients with type 2 diabetes mellitus. Diab Vasc Dis Res. 2007;4:181-93
14. Goldstein BJ, Rosenstock J, Anzalone D, Tou C, Ohman KP. Effect of tesaglitazar, a dual PPAR alpha/gamma agonist, on glucose and lipid abnormalities in patients with type 2 diabetes: a 12-week dose-ranging trial. Curr Med Res Opin. 2006;22:2575-90
15. Bailey CJ. Learning from tesaglitazar. Diab Vasc Dis Res. 2007;4:161-2
16. Fagerberg B, Edwards S, Halmos T, Lopatynski J, Schuster H, Stender S. et al. Tesaglitazar, a novel dual peroxisome proliferator-activated receptor alpha/gamma agonist, dose-dependently improves the metabolic abnormalities associated with insulin resistance in a non-diabetic population. Diabetologia. 2005;48:1716-25
17. Hamren B, Ericsson H, Samuelsson O, Karlsson MO. Mechanistic modelling of tesaglitazar pharmacokinetic data in subjects with various degrees of renal function-evidence of interconversion. Br J Clin Pharmacol. 2008;65:855-63
18. Hamren B, Ohman KP, Svensson MK, Karlsson MO. Pharmacokinetic-pharmacodynamic assessment of the interrelationships between tesaglitazar exposure and renal function in patients with type 2 diabetes mellitus. J Clin Pharmacol. 2012;52:1317-27
19. Schuster H, Fagerberg B, Edwards S, Halmos T, Lopatynski J, Stender S. et al. Tesaglitazar, a dual peroxisome proliferator-activated receptor alpha/gamma agonist, improves apolipoprotein levels in non-diabetic subjects with insulin resistance. Atherosclerosis. 2008;197:355-62
20. Derosa G, Sahebkar A, Maffioli P. The role of various peroxisome proliferator-activated receptors and their ligands in clinical practice. J Cell Physiol. 2018;233:153-61
21. Cha DR, Zhang X, Zhang Y, Wu J, Su D, Han JY. et al. Peroxisome proliferator activated receptor alpha/gamma dual agonist tesaglitazar attenuates diabetic nephropathy in db/db mice. Diabetes. 2007;56:2036-45
22. Zhang BC, Li WM, Li XK, Zhu MY, Che WL, Xu YW. Tesaglitazar ameliorates non-alcoholic fatty liver disease and atherosclerosis development in diabetic low-density lipoprotein receptor-deficient mice. Exp Ther Med. 2012;4:987-92
23. Rakhshandehroo M, Knoch B, Muller M, Kersten S. Peroxisome proliferator-activated receptor alpha target genes. PPAR Res. 2010;2010:1-20
24. Sugden MC, Bulmer K, Gibbons GF, Holness MJ. Role of peroxisome proliferator-activated receptor-alpha in the mechanism underlying changes in renal pyruvate dehydrogenase kinase isoform 4 protein expression in starvation and after refeeding. Arch Biochem Biophys. 2001;395:246-52
25. Nakashiro S, Matoba T, Umezu R, Koga J, Tokutome M, Katsuki S. et al. Pioglitazone-Incorporated Nanoparticles Prevent Plaque Destabilization and Rupture by Regulating Monocyte/Macrophage Differentiation in ApoE-/- Mice. Arterioscler Thromb Vasc Biol. 2016;36:491-500
26. Odegaard JI, Ricardo-Gonzalez RR, Goforth MH, Morel CR, Subramanian V, Mukundan L. et al. Macrophage-specific PPARgamma controls alternative activation and improves insulin resistance. Nature. 2007;447:1116-20
27. Luo W, Xu Q, Wang Q, Wu H, Hua J. Effect of modulation of PPAR-gamma activity on Kupffer cells M1/M2 polarization in the development of non-alcoholic fatty liver disease. Sci Rep. 2017;7:1-13
28. Weisberg SP, McCann D, Desai M, Rosenbaum M, Leibel RL, Ferrante AW Jr. Obesity is associated with macrophage accumulation in adipose tissue. J Clin Invest. 2003;112:1796-808
29. Bu L, Gao M, Qu S, Liu D. Intraperitoneal injection of clodronate liposomes eliminates visceral adipose macrophages and blocks high-fat diet-induced weight gain and development of insulin resistance. AAPS J. 2013;15:1001-11
30. Feng B, Jiao P, Nie Y, Kim T, Jun D, van Rooijen N. et al. Clodronate liposomes improve metabolic profile and reduce visceral adipose macrophage content in diet-induced obese mice. PLoS One. 2011;6:1-11
31. Morris DL, Singer K, Lumeng CN. Adipose tissue macrophages: phenotypic plasticity and diversity in lean and obese states. Curr Opin Clin Nutr Metab Care. 2011;14:341-6
32. Chawla A. Control of macrophage activation and function by PPARs. Circ Res. 2010;106:1559-69
33. Hulsmans M, Geeraert B, Arnould T, Tsatsanis C, Holvoet P. PPAR agonist-induced reduction of Mcp1 in atherosclerotic plaques of obese, insulin-resistant mice depends on adiponectin-induced Irak3 expression. PLoS One. 2013;8:1-12
34. Murakami K, Bujo H, Unoki H, Saito Y. Effect of PPARalpha activation of macrophages on the secretion of inflammatory cytokines in cultured adipocytes. Eur J Pharmacol. 2007;561:206-13
35. Penas F, Mirkin GA, Vera M, Cevey A, Gonzalez CD, Gomez MI. et al. Treatment in vitro with PPARalpha and PPARgamma ligands drives M1-to-M2 polarization of macrophages from T. cruzi-infected mice. Biochim Biophys Acta. 2015;1852:893-904
36. van der Hoorn JW, Jukema JW, Havekes LM, Lundholm E, Camejo G, Rensen PC. et al. The dual PPARalpha/gamma agonist tesaglitazar blocks progression of pre-existing atherosclerosis in APOE*3Leiden.CETP transgenic mice. Br J Pharmacol. 2009;156:1067-75
37. Zadelaar AS, Boesten LS, Jukema JW, van Vlijmen BJ, Kooistra T, Emeis JJ. et al. Dual PPARalpha/gamma agonist tesaglitazar reduces atherosclerosis in insulin-resistant and hypercholesterolemic ApoE*3Leiden mice. Arterioscler Thromb Vasc Biol. 2006;26:2560-6
38. Bouhlel MA, Derudas B, Rigamonti E, Dievart R, Brozek J, Haulon S. et al. PPARgamma activation primes human monocytes into alternative M2 macrophages with anti-inflammatory properties. Cell Metab. 2007;6:137-43
39. Choi JY, Ryu J, Kim HJ, Song JW, Jeon JH, Lee DH. et al. Therapeutic Effects of Targeted PPAR Activation on Inflamed High-Risk Plaques Assessed by Serial Optical Imaging In Vivo. Theranostics. 2018;8:45-60
40. Szoka F Jr, Papahadjopoulos D. Procedure for preparation of liposomes with large internal aqueous space and high capture by reverse-phase evaporation. Proc Natl Acad Sci U S A. 1978;75:4194-8
41. Kulkarni JA, Witzigmann D, Leung J, van der Meel R, Zaifman J, Darjuan MM. et al. Fusion-dependent formation of lipid nanoparticles containing macromolecular payloads. Nanoscale. 2019;11:9023-31
42. Katz A, Nambi SS, Mather K, Baron AD, Follmann DA, Sullivan G. et al. Quantitative insulin sensitivity check index: a simple, accurate method for assessing insulin sensitivity in humans. J Clin Endocrinol Metab. 2000;85:2402-10
43. Ljung B, Bamberg K, Dahllof B, Kjellstedt A, Oakes ND, Ostling J. et al. AZ 242, a novel PPARalpha/gamma agonist with beneficial effects on insulin resistance and carbohydrate and lipid metabolism in ob/ob mice and obese Zucker rats. J Lipid Res. 2002;43:1855-63
44. Lumeng CN, Bodzin JL, Saltiel AR. Obesity induces a phenotypic switch in adipose tissue macrophage polarization. J Clin Invest. 2007;117:175-84
45. Lumeng CN, DelProposto JB, Westcott DJ, Saltiel AR. Phenotypic switching of adipose tissue macrophages with obesity is generated by spatiotemporal differences in macrophage subtypes. Diabetes. 2008;57:3239-46
46. Zeyda M, Gollinger K, Kriehuber E, Kiefer FW, Neuhofer A, Stulnig TM. Newly identified adipose tissue macrophage populations in obesity with distinct chemokine and chemokine receptor expression. Int J Obes (Lond). 2010;34:1684-94
47. Ergen C, Heymann F, Al Rawashdeh W, Gremse F, Bartneck M, Panzer U. et al. Targeting distinct myeloid cell populations in vivo using polymers, liposomes and microbubbles. Biomaterials. 2017;114:106-20
48. Choi JM, Bothwell AL. The nuclear receptor PPARs as important regulators of T-cell functions and autoimmune diseases. Mol Cells. 2012;33:217-22
49. Clark RB, Bishop-Bailey D, Estrada-Hernandez T, Hla T, Puddington L, Padula SJ. The nuclear receptor PPAR gamma and immunoregulation: PPAR gamma mediates inhibition of helper T cell responses. J Immunol. 2000;164:1364-71
50. Dunn SE, Ousman SS, Sobel RA, Zuniga L, Baranzini SE, Youssef S. et al. Peroxisome proliferator-activated receptor (PPAR)alpha expression in T cells mediates gender differences in development of T cell-mediated autoimmunity. J Exp Med. 2007;204:321-30
51. Hontecillas R, Bassaganya-Riera J. Peroxisome proliferator-activated receptor gamma is required for regulatory CD4+ T cell-mediated protection against colitis. J Immunol. 2007;178:2940-9
52. Cipolletta D, Feuerer M, Li A, Kamei N, Lee J, Shoelson SE. et al. PPAR-gamma is a major driver of the accumulation and phenotype of adipose tissue Treg cells. Nature. 2012;486:549-53
53. Wohlfert EA, Nichols FC, Nevius E, Clark RB. Peroxisome proliferator-activated receptor gamma (PPARgamma) and immunoregulation: enhancement of regulatory T cells through PPARgamma-dependent and -independent mechanisms. J Immunol. 2007;178:4129-35
54. Appel S, Mirakaj V, Bringmann A, Weck MM, Grunebach F, Brossart P. PPAR-gamma agonists inhibit toll-like receptor-mediated activation of dendritic cells via the MAP kinase and NF-kappaB pathways. Blood. 2005;106:3888-94
55. Nobs SP, Natali S, Pohlmeier L, Okreglicka K, Schneider C, Kurrer M. et al. PPARgamma in dendritic cells and T cells drives pathogenic type-2 effector responses in lung inflammation. J Exp Med. 2017;214:3015-35
56. Garcia-Bates TM, Baglole CJ, Bernard MP, Murant TI, Simpson-Haidaris PJ, Phipps RP. Peroxisome proliferator-activated receptor gamma ligands enhance human B cell antibody production and differentiation. J Immunol. 2009;183:6903-12
57. Ramon S, Bancos S, Thatcher TH, Murant TI, Moshkani S, Sahler JM. et al. Peroxisome proliferator-activated receptor gamma B cell-specific-deficient mice have an impaired antibody response. J Immunol. 2012;189:4740-7
58. Barak Y, Nelson MC, Ong ES, Jones YZ, Ruiz-Lozano P, Chien KR. et al. PPAR gamma is required for placental, cardiac, and adipose tissue development. Mol Cell. 1999;4:585-95
59. Kotlinowski J, Jozkowicz A. PPAR Gamma and Angiogenesis: Endothelial Cells Perspective. J Diabetes Res. 2016;2016:1-11
60. Vattulainen-Collanus S, Akinrinade O, Li M, Koskenvuo M, Li CG, Rao SP. et al. Loss of PPARgamma in endothelial cells leads to impaired angiogenesis. J Cell Sci. 2016;129:693-705
61. Gizard F, Bruemmer D. Transcriptional Control of Vascular Smooth Muscle Cell Proliferation by Peroxisome Proliferator-Activated Receptor-gamma: Therapeutic Implications for Cardiovascular Diseases. PPAR Res. 2008;2008:1-11
62. Gizard F, Nomiyama T, Zhao Y, Findeisen HM, Heywood EB, Jones KL. et al. The PPARalpha/p16INK4a pathway inhibits vascular smooth muscle cell proliferation by repressing cell cycle-dependent telomerase activation. Circ Res. 2008;103:1155-63
63. Nuwormegbe SA, Sohn JH, Kim SW. A PPAR-Gamma Agonist Rosiglitazone Suppresses Fibrotic Response in Human Pterygium Fibroblasts by Modulating the p38 MAPK Pathway. Invest Ophthalmol Vis Sci. 2017;58:5217-26
64. Ogata T, Miyauchi T, Irukayama-Tomobe Y, Takanashi M, Goto K, Yamaguchi I. The peroxisome proliferator-activated receptor alpha activator fenofibrate inhibits endothelin-1-induced cardiac fibroblast proliferation. J Cardiovasc Pharmacol. 2004;44(Suppl 1):S279-82
65. Ogata T, Miyauchi T, Sakai S, Irukayama-Tomobe Y, Goto K, Yamaguchi I. Stimulation of peroxisome-proliferator-activated receptor alpha (PPAR alpha) attenuates cardiac fibrosis and endothelin-1 production in pressure-overloaded rat hearts. Clin Sci (Lond). 2002;103(Suppl 48):284S-8S
66. Zhang F, Lu S, He J, Jin H, Wang F, Wu L. et al. Ligand Activation of PPARgamma by Ligustrazine Suppresses Pericyte Functions of Hepatic Stellate Cells via SMRT-Mediated Transrepression of HIF-1alpha. Theranostics. 2018;8:610-26
67. Thul PJ, Akesson L, Wiking M, Mahdessian D, Geladaki A, Ait Blal H. et al. A subcellular map of the human proteome. Science. 2017;356:1-12
68. Moran-Salvador E, Lopez-Parra M, Garcia-Alonso V, Titos E, Martinez-Clemente M, Gonzalez-Periz A. et al. Role for PPARgamma in obesity-induced hepatic steatosis as determined by hepatocyte- and macrophage-specific conditional knockouts. FASEB J. 2011;25:2538-50
69. Takahashi K, Yamaguchi S, Shimoyama T, Seki H, Miyokawa K, Katsuta H. et al. JNK- and IkappaB-dependent pathways regulate MCP-1 but not adiponectin release from artificially hypertrophied 3T3-L1 adipocytes preloaded with palmitate in vitro. Am J Physiol Endocrinol Metab. 2008;294:E898-909
70. Ito A, Suganami T, Miyamoto Y, Yoshimasa Y, Takeya M, Kamei Y. et al. Role of MAPK phosphatase-1 in the induction of monocyte chemoattractant protein-1 during the course of adipocyte hypertrophy. J Biol Chem. 2007;282:25445-52
71. Deshmane SL, Kremlev S, Amini S, Sawaya BE. Monocyte chemoattractant protein-1 (MCP-1): an overview. J Interferon Cytokine Res. 2009;29:313-26
72. Bhattacharyya S, Brown DE, Brewer JA, Vogt SK, Muglia LJ. Macrophage glucocorticoid receptors regulate Toll-like receptor 4-mediated inflammatory responses by selective inhibition of p38 MAP kinase. Blood. 2007;109:4313-9
73. Chinenov Y, Coppo M, Gupte R, Sacta MA, Rogatsky I. Glucocorticoid receptor coordinates transcription factor-dominated regulatory network in macrophages. BMC Genomics. 2014;15:1-19
74. Cooper MS, Zhou H, Seibel MJ. Selective glucocorticoid receptor agonists: glucocorticoid therapy with no regrets? J Bone Miner Res. 2012;27:2238-41
75. Kang H, Jung HJ, Kim SK, Wong DSH, Lin S, Li G. et al. Magnetic Manipulation of Reversible Nanocaging Controls In Vivo Adhesion and Polarization of Macrophages. ACS Nano. 2018;12:5978-94
76. Kang H, Kim S, Wong DSH, Jung HJ, Lin S, Zou K. et al. Remote Manipulation of Ligand Nano-Oscillations Regulates Adhesion and Polarization of Macrophages in Vivo. Nano Lett. 2017;17:6415-27
77. Lee H, Shi W, Tontonoz P, Wang S, Subbanagounder G, Hedrick CC. et al. Role for peroxisome proliferator-activated receptor alpha in oxidized phospholipid-induced synthesis of monocyte chemotactic protein-1 and interleukin-8 by endothelial cells. Circ Res. 2000;87:516-21
78. Trial J, Cieslik KA, Entman ML. Phosphocholine-containing ligands direct CRP induction of M2 macrophage polarization independent of T cell polarization: Implication for chronic inflammatory states. Immun Inflamm Dis. 2016;4:274-88
79. Tall AR, Yvan-Charvet L. Cholesterol, inflammation and innate immunity. Nat Rev Immunol. 2015;15:104-16
Author contact
![]() Corresponding author: Victoria Osinski, Email: vo3scedu
Corresponding author: Victoria Osinski, Email: vo3scedu
Citation styles
APA
Osinski, V., Bauknight, D.K., Dasa, S.S.K., Harms, M.J., Kroon, T., Marshall, M.A., Garmey, J.C., Nguyen, A.T., Hartman, J., Upadhye, A., Srikakulapu, P., Zhou, A., O'Mahony, G., Klibanov, A.L., Kelly, K.A., Boucher, J., McNamara, C.A. (2020). In vivo liposomal delivery of PPARα/γ dual agonist tesaglitazar in a model of obesity enriches macrophage targeting and limits liver and kidney drug effects. Theranostics, 10(2), 585-601. https://doi.org/10.7150/thno.36572.
ACS
Osinski, V.; Bauknight, D.K.; Dasa, S.S.K.; Harms, M.J.; Kroon, T.; Marshall, M.A.; Garmey, J.C.; Nguyen, A.T.; Hartman, J.; Upadhye, A.; Srikakulapu, P.; Zhou, A.; O'Mahony, G.; Klibanov, A.L.; Kelly, K.A.; Boucher, J.; McNamara, C.A. In vivo liposomal delivery of PPARα/γ dual agonist tesaglitazar in a model of obesity enriches macrophage targeting and limits liver and kidney drug effects. Theranostics 2020, 10 (2), 585-601. DOI: 10.7150/thno.36572.
NLM
Osinski V, Bauknight DK, Dasa SSK, Harms MJ, Kroon T, Marshall MA, Garmey JC, Nguyen AT, Hartman J, Upadhye A, Srikakulapu P, Zhou A, O'Mahony G, Klibanov AL, Kelly KA, Boucher J, McNamara CA. In vivo liposomal delivery of PPARα/γ dual agonist tesaglitazar in a model of obesity enriches macrophage targeting and limits liver and kidney drug effects. Theranostics 2020; 10(2):585-601. doi:10.7150/thno.36572. https://www.thno.org/v10p0585.htm
CSE
Osinski V, Bauknight DK, Dasa SSK, Harms MJ, Kroon T, Marshall MA, Garmey JC, Nguyen AT, Hartman J, Upadhye A, Srikakulapu P, Zhou A, O'Mahony G, Klibanov AL, Kelly KA, Boucher J, McNamara CA. 2020. In vivo liposomal delivery of PPARα/γ dual agonist tesaglitazar in a model of obesity enriches macrophage targeting and limits liver and kidney drug effects. Theranostics. 10(2):585-601.
This is an open access article distributed under the terms of the Creative Commons Attribution License (https://creativecommons.org/licenses/by/4.0/). See http://ivyspring.com/terms for full terms and conditions.