Theranostics
13.3
Impact Factor
- Current Issue
- Advance Articles
- Volume 16; 2026
- Volume 15; 2025
- Volume 14; 2024
- Volume 13; 2023
- Volume 12; 2022
- Archive
- Cover Images
- Cover Suggestion
- Special Issues
Top
Introduction
Methods
Results
Discussion
Conclusions
Abbreviations
Supplementary Material
Acknowledgements
References
Introduction
Methods
Results
Discussion
Conclusions
Abbreviations
Supplementary Material
Acknowledgements
References
International Journal of Biological Sciences
International Journal of Medical Sciences
 Global reach, higher impact

Theranostics 2020; 10(25):11595-11606. doi:10.7150/thno.49515 This issue Cite
Research Paper
Human oral microbiome dysbiosis as a novel non-invasive biomarker in detection of colorectal cancer
Sheng Zhang1,2,3,4#, Cheng Kong5#, Yongzhi Yang1,2, Sanjun Cai1,2, Xinxiang Li1,2 ![]() , Guoxiang Cai1,2
, Guoxiang Cai1,2 ![]() , Yanlei Ma1,2
, Yanlei Ma1,2 ![]()
1. Department of Colorectal Surgery, Fudan University Shanghai Cancer Center, Shanghai, China.
2. Department of Oncology, Shanghai Medical College, Fudan University, Shanghai, China.
3. Guangdong Provincial People's Hospital & Guangdong Academy of Medical Science, Guangdong Lung Cancer Institute, Guangzhou, China.
4. School of Medicine, South China University of Technology, Guangzhou, China.
5. Department of GI Surgery, Shanghai Tenth People's Hospital Affiliated to Tongji University, Shanghai, China.
#These authors contributed equally to this work.
Received 2020-6-15; Accepted 2020-9-2; Published 2020-9-18
Citation:
Zhang S, Kong C, Yang Y, Cai S, Li X, Cai G, Ma Y. Human oral microbiome dysbiosis as a novel non-invasive biomarker in detection of colorectal cancer. Theranostics 2020; 10(25):11595-11606. doi:10.7150/thno.49515. https://www.thno.org/v10p11595.htm
Other stylesAbstract

Background: The oral microbiome may play an important role in colorectal carcinogenesis. However, few studies have investigated the association between oral microbiome and the development of colorectal cancer (CRC). We aimed to investigate whether oral health-colorectal tumor association has an underlying microbial basis, in the quest for novel non-invasive biomarkers for CRC.
Methods: We collected oral swab samples from 161 patients with CRC, 34 patients with colorectal adenoma (CRA), and 58 healthy volunteers. The oral microbiota was assessed using 16S rRNA sequencing. We characterized oral microbiome, identified microbial markers, constructed and validated colorectal tumor (CRA and CRC) classifier.
Results: Oral microbial composition and diversity were significantly different among the three groups, and the CRA group had the highest diversity. Analysis of the functional potential of oral microbiota demonstrated that the pathway involving cell motility was overrepresented in the CRA and CRC groups relative to that in the healthy controls. Moreover, a random forest model was constructed based on oral microbial markers, which could distinguish the colorectal tumor groups from the healthy controls and achieve a powerful classification potential in the discovery and validation cohorts.
Conclusion: This study suggests a potential association between oral microbiome dysbiosis and colorectal cancer. Oral microbiota-based biomarkers may be helpful in predicting the risks for the development of CRA and CRC.
Keywords: colorectal cancers, colorectal adenomas, oral microbiome, 16S rRNA
Introduction
Colorectal cancer (CRC) is the third most common cancer and the second leading cause of death among malignant tumors worldwide [1, 2]. It mainly originates from an adenomatous polyp then develops into advanced colorectal adenoma (CRA) with high-grade dysplasia, and finally progresses to invasive cancer [3]. Many environmental factors, such as diet and lifestyle, are crucial for the gut microbial composition and function, which can affect the host gene expression, metabolic regulation, and local and systemic immune response, thereby influencing cancer development [4]. The gut microbiota has been recognized to play an important role in colorectal tumorigenesis, which may promote CRC development through inflammatory pathways, microbial metabolites, or the interference in the energy balance of cancer cells [5, 6]. Our previous work suggested a potential relationship between gut microbiome and metabolome in CRC [7]. Adults produce >1000 mL of saliva per day on average, almost all of which enters the gastrointestinal tract [8]. The lower gastrointestinal tract is inoculated every day by approximately 1011 bacteria from the oral cavity, which can be detected in the oral and fecal microbiota of approximately 45% tested individuals [9]. As chemical converters, microbes metabolize both dietary-acquired and host-produced nutrients [10]. The resulting metabolites can promote genotoxicity and tumor suppression or progression through multiple mechanisms, such as the alteration of metabolic fluxes to promote anabolic metabolism, competitive enzymatic inhibition, and modification of signaling proteins [11]. Therefore, oral microbial communities may affect the gut microbial community structure [12].
The oral microbiome diversity is correlated with several human diseases including cancers [13]. Fan et al. found that oral microbiota may play a role in the etiology of pancreatic cancer [14]. Another study showed that the oral microbiome composition has potential implications for the early detection and prevention of esophageal cancers [15]. Microbiota dysbiosis refers to altered bacterial composition [16], and the study of oral and intestinal microbiota disorders is of great importance for exploring the mechanism of colorectal carcinogenesis [17-20]. However, few studies have focused on the differences in oral microbiota profiles between patients with CRA and CRC and those of healthy individuals. These three groups are consistent with the normal-adenoma-carcinoma sequence model, which reflects the evolution process of colorectal carcinogenesis [21, 22]. In this study, we hypothesize that the oral health-colorectal tumor association may have an underlying microbial basis. We further explored this potential oral-gut axis in the quest for novel non-invasive biomarkers for CRC.
Methods
Study design and oral sample collection
Oral samples were prospectively collected from participants by rubbing the insides of both cheeks with a swab as described previously [23]. The swab containing the specimen was placed in a sterile tube and then stored at -80 °C until further use. None of the participants had recently suffered from oral disease, and no participants were treated with any drugs according the NIH Human Microbiome Project - Core Microbiome Sampling Protocol [24]. Oral samples from patients with CRC or CRA group were collected before any surgical procedure. For the CRC cohort, the exclusion criteria were: i) the diagnosis of hereditary or inflammation-associated CRC, and ii) an active preoperative treatment course. For the CRA cohort, the exclusion criteria were: i) the diagnosis of familial adenomatous polyposis, and ii) previous history of CRC. Finally, 253 eligible cases including 58 healthy controls, 34 patients with CRA, and 161 patients with CRC, were included in this study according to the recruitment process and randomly divided into the discovery phase and the validation phase (Figure 1).
Oral DNA extraction for microbiome analysis
Genomic DNA from oral swab samples was extracted using the Mag-Bind Blood & Tissue DNA HDQ 96 Kit (M6399-01, Omega, Inc, USA) according to the manufacturer's guidelines. DNA integrity and size were verified by 1.0% agarose gel electrophoresis, and DNA concentrations were determined using the NanoDrop spectrophotometer (NanoDrop, Germany).
High-throughput 16S ribosomal RNA gene sequencing
16S ribosomal RNA (rRNA) gene amplification was performed using the primers (319F: 5′-ACTCCTACGGGAGGCAGCAG-3′; 806R: 5′-GGACTACHVGGGTWTCTAAT-3′) directionally targeting the V3 and V4 hypervariable regions of the 16S rRNA gene. To differentiate each sample and yield accurate phylogenetic and taxonomic information, the gene products were attached with forward and reverse error-correcting barcodes. The amplicons were quantified after purification. Then, the normalized equimolar concentrations of each amplicon were pooled and sequenced on the MiSeq PE300 sequencing instrument (Illumina, USA) using 2 × 300 bp chemistry according to the manufacturer's specifications.
Sequencing data analysis
Paired-end reads were assigned to samples based on their unique barcodes and truncated by cutting off the barcode and primer sequences. Then these paired-end reads were merged using the Fast Length Adjustment of SHort reads (FLASH) tool. To obtain high-quality clean tags, the raw tags were quality filtered under specific conditions using the QIIME pipeline (Version 1.7.0) [25]. Chimeric sequences were filtered using the Usearch software (Uparse v6.0.307). Sequences with a similarity threshold ≥97% were assigned to the same operational taxonomic units (OTUs) using the CD-HIT online tool (v. 4.6.1). Classification of representative sequences for each OTU was carried out and taxonomic data were then assigned to each representative sequence using the Ribosomal Database Project (RDP) classifier based on the 11.5 revision of the RDP database. We also use the NT-16S database annotation results for correction. To study the phylogenetic relationship of different OTUs, multiple sequence alignments were conducted using the PyNAST software. OTU abundance was normalized using the sample with the least sequences as a standard. To estimate the OTU richness, a rarefaction curve was designed using the Mothur software package (http://www.mothur.org/wiki/Main_Page). After the taxonomic assignment of OTUs, sequences were aligned for phylogenetic analysis. Alpha diversity was evaluated to analyze the complexity of microbial diversity for each sample through four indices (Chao1, Shannon, Simpson, and observed species) using the QIIME software. To evaluate microbial diversity between samples, beta diversity was evaluated by principal coordinate's analysis (PCoA) and cluster analysis using QIIME software. The Wilcoxon rank-sum test and Welch's t-test were used to compare bacterial abundance and diversity in oral swab samples from patients with CRC versus those from healthy subjects. The heatmaps were drawn based on the nonparametric Wilcox test (p < 0.05, q < 0.1) at the genus level.
Identification of microbial OTU-based markers
A tenfold cross-validation was conducted on a random forest model to identify the optimal OTU-based markers as described previously [26]. This model could specifically distinguish the CRA or CRC groups from the healthy control group.
Statistical analysis
Associations between the clinical characteristics were performed by Pearson's Chi-square test or Fisher's exact test, as appropriate P values were two-tailed and adjusted using the false discovery rate (FDR). FDR values less than 0.05 were considered as statistically significant (*, <0.05; **, <0.01; ***, <0.001). All data were analyzed using GraphPad Prism v. 6.01 (Graph Pad software, lnc, San Diego, California, USA), Microsoft Excel (Microsoft Corporation, Seattle, WA, USA), and R package v. 3.3.2 (R Foundation for Statistical Computing, Vienna, Austria, http://www.R-project.org/).
Results
Participant information and study design
In total, 253 eligible cases including 58 healthy controls, 34 patients with CRA and 161 patients with CRC were included in this study according to the recruitment process and randomly divided into the discovery cohort and validation cohorts (Figure 1). There were no significant differences in the clinical characteristics, including age, gender, BMI, alcohol consumption, and smoking status among the three groups. Detailed clinical data for the studied individuals were shown in Table 1.
Table 1
Clinical characteristics of the enrolled participants
| Characteristics | Healthy control (n = 58) | CRA(n = 34) | CRC (n = 161) | P value |
|---|---|---|---|---|
| Age (mean ± SD) | 50.71±11.34 | 51.88±7.67 | 59.25±10.71 | 0.114* |
| BMI (mean ± SD) kg/m2 | 22.98±2.22 | 22.53±1.53 | 22.49±1.78 | 0.678* |
| Sex | ||||
| Male | 31 (53.4%) | 20 (58.8%) | 107 (66.5%) | 0.192# |
| Female | 27 (46.6%) | 14 (41.2%) | 54 (33.5%) | |
| Smoking status | ||||
| Never smoker | 48 (82.8%) | 30 (88.2%) | 120 (74.5%) | 0.163# |
| Former smoker | 9 (15.5%) | 2 (5.9%) | 36 (22.4%) | |
| Current smoker | 1 (1.7%) | 2 (5.9%) | 5 (3.1%) | |
| Alcohol consumption | ||||
| Never drink | 33 (56.9%) | 20 (58.8%) | 98 (60.9%) | 0.525# |
| <1 standard drink per day | 18 (31.0%) | 11 (32.4%) | 55 (34.1%) | |
| ≥1 standard drink per day | 7 (12.1%) | 3 (8.8%) | 8 (5.0%) | |
| Diabetes | ||||
| Yes | 0 (0%) | 0 (0%) | 23 (14.3%) | |
| No | 58 (100%) | 34 (100%) | 138 (85.7%) | |
| Tumor location | ||||
| Rectum | - | 17 (50.0%) | 78 (48.5%) | 0.984# |
| Distal colon | - | 10 (29.4%) | 48 (29.8%) | |
| Proximal colon | - | 7 (20.6%) | 35 (21.7%) | |
| Tumor size (mean ± SD) | - | 0.8±0.3 (cm) | 4.1±1.5 (cm) | |
| TNM stage | ||||
| Stage I | - | - | 24 (14.9%) | |
| Stage II | - | - | 66 (41.0%) | |
| Stage III | - | - | 60 (37.3%) | |
| Stage IV | - | - | 11 (6.8%) |
*One-way analysis of variance (ANOVA);
#Pearson Chi-square test.
Bacterial diversity of the oral microbiota
The oral microbiota was assessed using 16S rRNA MiSeq sequencing. A total of 4,986,545 high-quality 16S rRNA gene sequences were identified, with a median read count of 17,693 (ranging from 9677 to 75385) per sample. After the taxonomic assignment, 2181 OTUs were obtained (Table S1). The species accumulation curve of all samples successfully reached the asymptote, supporting the adequacy of our sampling efforts (Figure 2A). Likewise, relative bacterial evenness was evaluated by rank abundance curves, exhibiting similar patterns in all samples (Figure 2B). Alpha diversity indexes were calculated to assess the differences in bacterial diversity among the three groups (Table S2). Bacterial diversity was analyzed using sampling-based OTUs and presented by the Shannon and Simpson indexes. The results showed that oral microbial alpha diversity was significantly higher in the CRA and CRC groups than in the healthy controls, but was lower in the CRC group than in the CRA group (Figure 2C-D). Moreover, the Venn diagram showed that 1500 of the total 2181 OTUs were shared among the three groups, whereas 1550 of 2140 OTUs were shared between the CRA and CRC groups. Notably, 266 OTUs were unique for the CRC group (Figure 2E). To display the microbiome space between samples, beta diversity was calculated using the unweighted UniFrac method and the principal coordinate nanlysis (PCoA) was performed. The results showed a gradually separated distribution of the oral microbial communities among these three groups (Figure 2F).
Phylogenetic profiles of oral microbial communities
The average composition of bacterial communities at the phylum, family, genus, and species levels was shown in Figure 3A-D, respectively. Bacteroidetes, Firmicutes, Actinobacteria, Proteobacteria, and Fusobacteria were the five dominant bacterial phyla in the three groups (Table S3). At the phylum level, Proteobacteria, Bacteroidetes, and Fusobacteria were significantly lower in the CRC group than in the CRA group (Figure S1A, Table S4). At the genera level, Fusobacterium, Prevotella, and Porphyromonas were significantly enriched in the CRA group compared with the CRC group (Figure S1B, Table S5). Phylum Fusobacteria and Bacteroidetes were significantly higher in the CRA group than in the control group (Figure S1C, Table S6). At the genus level, Fusobacterium, Prevotella, Porphyromonas and Veillonella were significantly higher, whereas Streptococcus, Gemella, and Megamonas were significantly lower in the CRA group than in the control group (Figure S1D, Table S7). Bacterial abundance at the phylum and genus levels was also compared between the CRC and control groups. The results showed that bacterial abundance was higher in the CRC group than in the control group, especially for the phyla Fusobacteria and Bacteroidetes, and the genera Fusobacterium, Prevotella, and Veillonella (Figure S1E-F, Table S8-9).
Figure 1
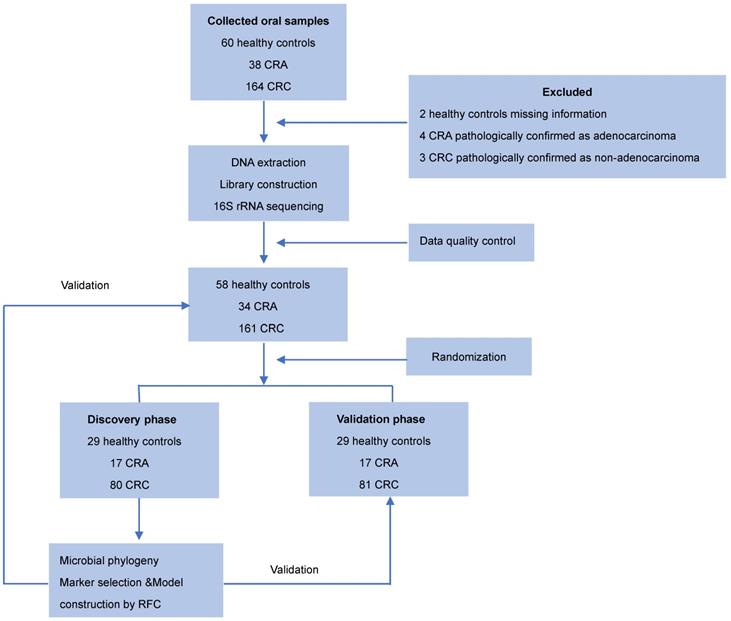
Study design and flow diagram. Consecutive oral samples were prospectively collected from 60 healthy controls, 38 patients with CRA, and 164 patients with CRC according to the inclusion criteria. Finally, 58 healthy controls, 34 patients with CRA, and 161 patients with CRC were included and randomly divided into discovery and validation cohorts. In the discovery phase, we characterized the oral microbiome among 80 CRC, 17 CRA, and 29 healthy controls, identified microbial markers, and constructed CRC and CRA classifiers using a random forest model. In the validation phase, 81 CRC, 17 CRA, and 29 healthy controls were used to validate the diagnostic efficacy of CRC and CRA classifiers. Furthermore, all samples (161 CRC, 34 CRA, and 58 controls) were used in another independent validation phase. CRC, colorectal cancer; CRA, colorectal adenoma.
Figure 2
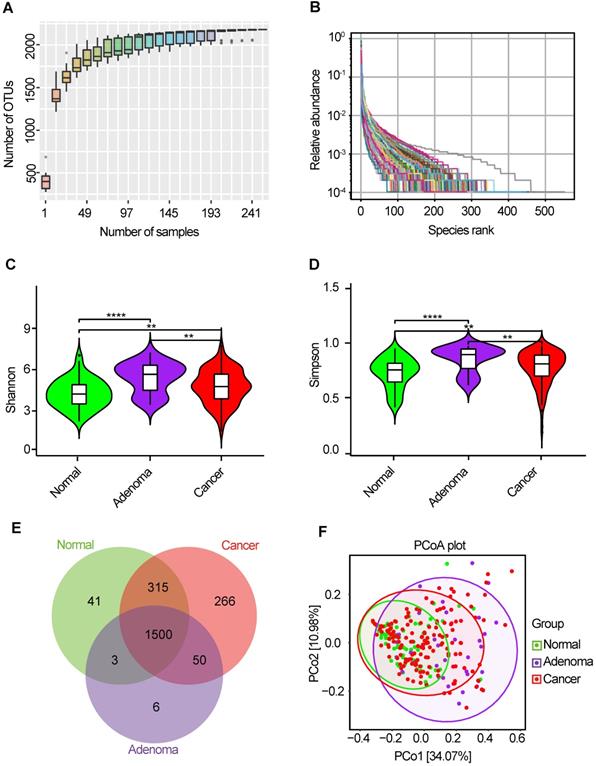
Bacterial diversity of the oral microbiota. (A) Species accumulation curve between number of samples. (B) The relative bacterial evenness was evaluated by the rank abundance curves. Oral microbial diversity was estimated by the Shannon index (C) and Simpson index (D). (E) A Venn diagram displayed the overlaps between groups. (F) Beta diversity was calculated using weighted UniFrac by PCoA. CRA, colorectal adenoma; CRC, Colorectal cancer; OTUs, Operational Taxonomy Units; PCoA, principal coordinates analysis.
Functional and correlation network analysis of oral microbiota
Microbiota imbalance induces systematic metabolic alterations [27, 28], while metabolic dysfunction can in turn influence microbiota composition [29]. To study the functional and metabolic changes in oral microbial communities, all OTUs were aligned into the Phylogenetic Investigation of Communities by Reconstruction of Unobserved States (PICRUSt) built-in reference database [30, 31]. A principal component analysis was then performed using the total KEGG pathways data generated from all samples (Figure 4A). PICRUSt analysis identified 20 KEGG pathways with significant differential abundance between the CRA and CRC groups (Figure 4B), 13 KEGG categories between the CRC group and the healthy controls (Figure 4C), and 27 KEGG categories between CRA groups and healthy controls (Figure 4D). As shown in Figure 4B-D, the membrane transport pathway was decreased in the CRA group compared with that of CRC group and control group. In addition, the pathway involved in cell motility was overrepresented while the pathway involved in carbohydrate metabolism was inhibited, in the CRA and CRC groups relative to those in the control group. The association between differential bacteria and metabolic pathways was investigated using correlation heatmaps. As the results showed, genera Streptococcus was negatively correlated with cell motility, endocrine system, and common oncogenic pathways, while genera Fusobacterium, Prevotella, Leptotrichia, Selenomonas, and Lachnoanaerobaculum were positively correlated with the endocrine system and oncogenic pathways (Figure S2A-C).
Given the significant dysbiosis of the oral microbiome in the CRA and CRC groups, as reflected by differences in bacterial composition, diversity, and function among the three groups, we focused on the 20 OTUs shared among the three groups and clustered them based on the abundance profiles (Figure 4E). Finally, we identified two kinds of oral bacterial co-abundance groups (CAGs): the pathogen CAG (e.g. Fusobacterium, Treponema and Porphyromonas) and the biofilm CAG (e.g. Streptococcus, Faecalibacterium, and Rothia). The abundance of pathogen CAG was higher in the CRA and CRC groups than that in the control group (Figure S3A), while the opposite results were observed for bacterial abundance of biofilm CAG (Figure S3B). A stringent network analysis was also performed to obtain further insight with respect to correlative bacterial populations at the genus level. Despite the apparent dissimilarity of the microbial composition when comparing the three groups, the resulting network comprising 20 genera showed significant co-occurrence and anti-occurrence (Figure 4F). The oral pathogen Fusobacterium co-occurred with 8 other genera, namely, Leptotrichia, Capnocytophaga, Treponema, SR1_genera_incertae_sedis, Porphyromonas, Alloprevotella, Prevotella, and Lachnoanaerobaculum, many of which were categorized as oral pathogens. In contrast, Fusobacterium showed mutual exclusion with Streptococcus. We also found that the pathogenic genera belonging to the Firmicutes phylum (Veillonella, Actinomyces, Leptotrichia, Selenomonas, and Lachnoanaerobaculum) were closely connected to each other.
Figure 3
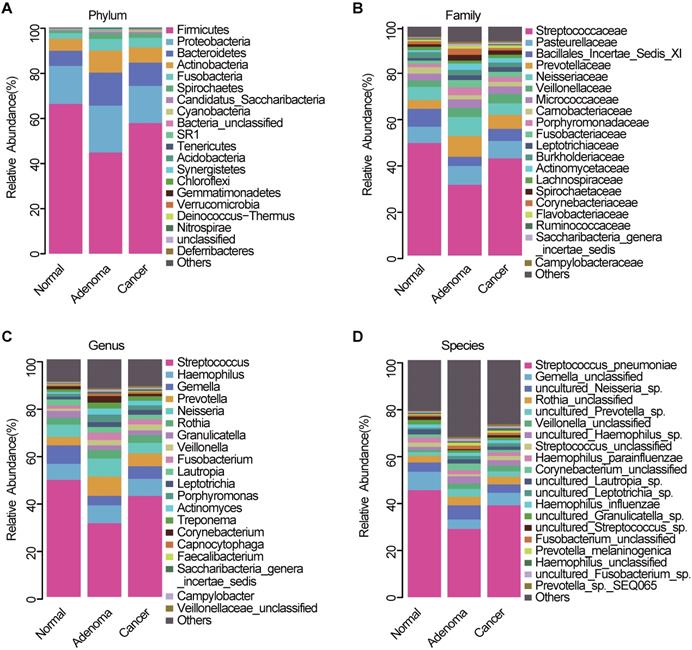
Oral microbiota composition. Average composition of bacterial community at the phylum (A), family (B), genus (C) and species (D) levels. CRA, colorectal adenoma; CRC, Colorectal cancer.
Figure 4
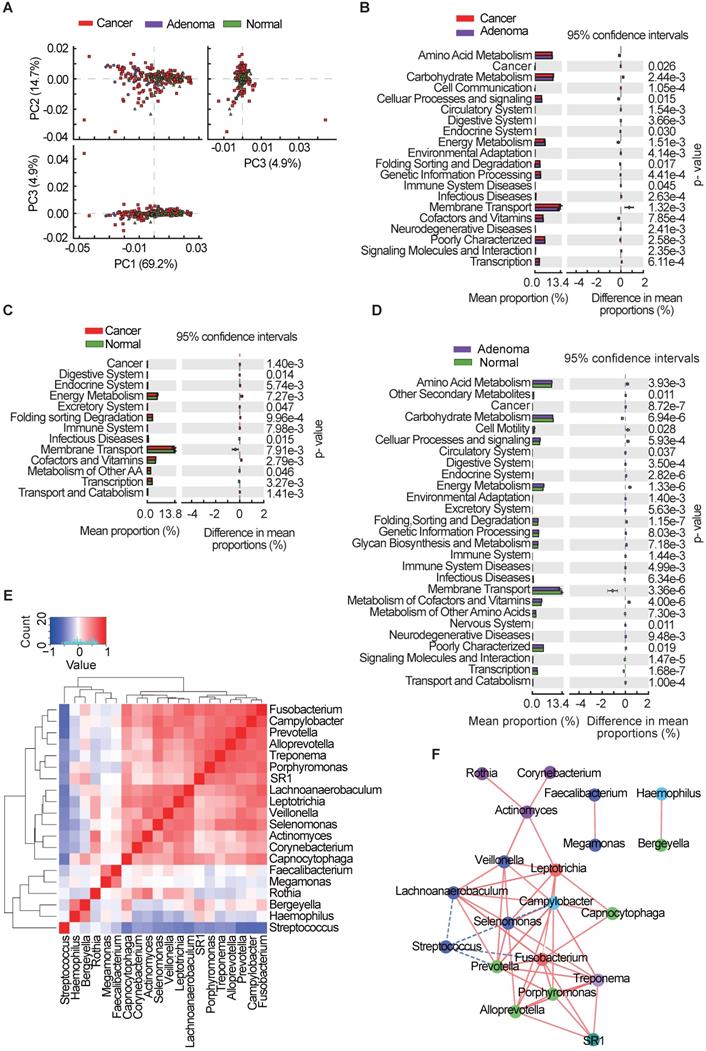
Oral microbial functional dysbiosis in patients with CRA and CRC. (A) Differential KEGG pathways were analyzed using PICRUSt, and PCoA analysis was conducted for the three groups. Significant differences between CRC and CRA group (B), CRC and control group (C), and CRA and control group (D) were presented respectively. (E) Heatmap showing Spearman correlation coefficients of 20 genera shared among CRA, CRC, and healthy controls. (F) Bacterial co-occurrence and anti-occurrence were investigated and presented as a network, with nodes representing bacterial genera (colored according to phylum) and edges representing interactions (red = co-occurrence, blue = mutual exclusion) at p < 0.01. CRA, colorectal adenoma; CRC, colorectal cancer; PCoA, principal coordinates analysis; KEGG, Kyoto encyclopedia of genes and genomes.
Figure 5
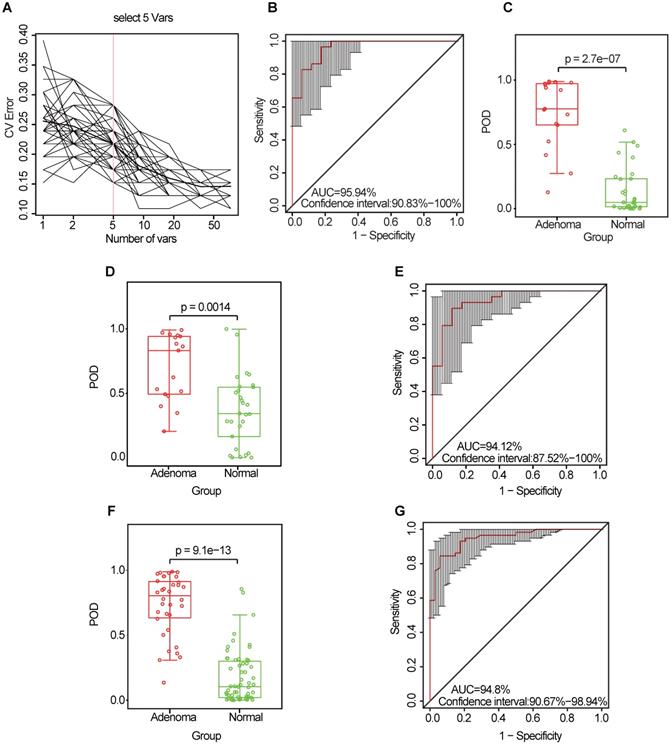
Identification and validation of microbial OTU-based markers of CRA. (A) In the discovery set, a ten-fold cross-validation was performed on a random forest model between 17 CRA samples and 29 controls. Five OTUs were selected as the optimal marker set by random forest models. (B) The POD index achieved an AUC value of 95.94% (95% CI: 90.83%-100%). (C) The POD value was significantly higher in the CRA oral samples than in the controls (p = 2.7 × 10⁻⁷). In the validation phase, the average POD value was significantly higher in the 17 patients with CRA versus the 29 controls (p = 0.0014) (D), and the POD index achieved an AUC value of 94.12% (95% CI: 87.52%-100%) (E). All samples including 34 CRA and 58 controls were used to verify POD reliability. The average POD value was significantly higher in CRA samples than in the controls (p = 9.1 × 10⁻¹³) (F), and the POD achieved an AUC value of 94.8% (95% CI: 90.67%-98.94%) (G). AUC, area under the curve; CV Error, the cross-validation error; CRA, colorectal adenoma; OTUs, operational taxonomic units; POD, probability of disease.
Identification and validation of oral microbial OTU-based markers for CRA and CRC
To explore the value of the oral microbiome for CRA diagnosis, a random forest classifier model was constructed to specifically distinguish the CRA from the healthy control groups: a ten-fold cross-validation was performed in the discovery phase (data from 17 CRA cases and 29 healthy controls). As a result, five OTU markers were selected as the optimal marker set (Figure 5A, Table S10). The probability of disease (POD) index was calculated using the identified optimal five OTU set for both the discovery cohort and the validation cohort. In the discovery phase, the POD index achieved an area under the curve (AUC) value of 95.94% (95% CI: 90.83%-100%) (Figure 5B), and the POD value was significantly higher in the CRA group than in the control group (p = 2.7 × 10⁻⁷, Figure 5C). In the validation phase (data from 17 CRA cases and 29 healthy controls), the average POD value was also significantly higher in the CRA group than in the control group (p = 0.0014, Figure 5D), and the AUC was 94.12% (95% CI: 87.52%-100%) (Figure 5E). Moreover, to further confirm the diagnostic potential of this random forest model, all samples (34 CRA cases and 58 healthy controls) were used to verify the POD reliability. The result also showed that the average POD value was significantly higher in the CRA group than in the control group (p = 9.1 × 10⁻¹³, Figure 5F), achieving an AUC value of 94.8% (95% CI: 90.67%-98.94%) (Figure 5G).
Similarly, the diagnostic value of the CRC oral microbiome was investigated. In the discovery phase (data from 80 CRC cases and 29 healthy controls), five OTU markers were selected as the optimal marker set (Figure 6A, Table S11). The POD index achieved an AUC value of 76.42% (95% CI: 67.1%-85.74%) (Figure 6B), and the POD value was significantly higher in the CRC group than in the control group (p = 2.7 × 10⁻⁵, Figure 6C). In the validation phase (data from 81 CRC cases and 29 healthy controls), the average POD value was also significantly higher (p = 0.027, Figure 6D) in the CRC group than in the control group and the POD index achieved an AUC value of 63.86% (95% CI: 51.72%-75.99%) (Figure 6E). Furthermore, all samples (from 161 CRC cases and 58 healthy controls) were used to verify the POD reliability. This result also showed that the average POD value was significantly higher in the CRC group than in the control group (p = 2.7 × 10⁻¹⁴, Figure 6F), achieving an AUC value of 83.74% (95% CI: 77.09%-90.39%) (Figure 6G).
Figure 6
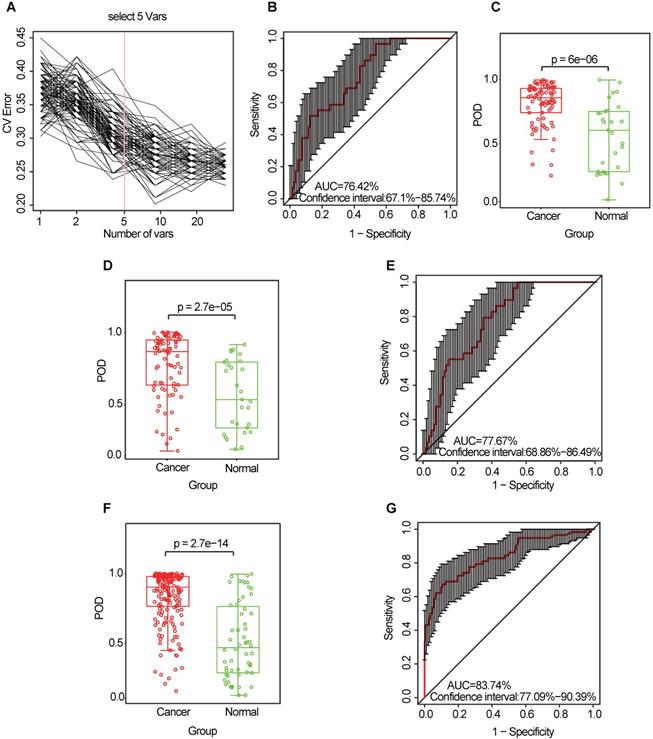
Identification and validation of oral microbial OTU-based markers of CRC. (A) A ten-fold cross-validation was conducted on a random forest model between 80 CRC samples and 29 controls in the discovery set, and five OTU markers were selected as the optimal marker set. (B) The POD index achieved an AUC value of 76.42% (95% CI: 67.1% to 85.74%). (C) The POD value was significantly higher in the CRC oral samples than in the controls (p = 6 × 10⁻⁶). In the validation phase, the average POD value was significantly higher in 81 patients with CRC versus 29 controls (p = 2.7 × 10⁻⁵) (D), and the POD index achieved an AUC value of 77.67% (95% CI: 68.86%-86.49%) (E). All samples, including 161 CRC and 58 control samples, were used to verify POD reliability. The average POD value was significantly higher in the CRC samples than in the controls (p = 2.7 × 10⁻¹⁴) (F), and the POD achieved an AUC value of 83.74% (95% CI: 77.09%-90.39%) (G). AUC, area under the curve; CV Error, the cross-validation error; CRC, colorectal cancer; OTUs, operational taxonomic units; POD, probability of disease.
Collectively, our results indicate the powerful potential diagnostic efficacy of the POD index based on oral microbial markers from patients with CRA or CRC.
Discussion
Accumulating evidence shows that the oral microbiome is capable of ectopic colonization and producing an extraordinarily wide range of microbial metabolites with the potential to promote tumorigenesis via modulation of pathways related to energy homeostasis, nutritional intake, and immunologic balance [32-34]. Farrell et al. observed associations between variations of patients' oral microbiota with pancreatic cancer and chronic pancreatitis [35]. Lu et al. identified microbiota dysbiosis of tongue coat in patients with liver carcinoma, which may provide novel and non-invasive potential diagnostic biomarker of liver carcinoma [36]. Another study have shown that a high abundance of oral commensal bacteria such as Corynebacterium and Kingella correlated with a decreased risk of head and neck squamous cell cancer [37]. Although there are some studies on the relationship between oral microbiota and CRC, the results are not consistent [17]. In this study, we aimed to delineate the community structure and function of the oral microbiome from patients with CRA and CRC and to further establish diagnostic markers for CRA and CRC based on oral microbial OTUs.
First, we evaluated the oral microbiome diversity and found that CRC group and CRA group have a higher diversity than healthy controls. Notably, the oral microbiota of CRA group exhibited the highest diversity. It was reported that oral bacterial diversity is higher in oral diseases, such as in periodontal disease [38]. By hematogenous and enteral routes, oral pathogenic bacteria can translocate to the gastrointestinal tract and induce various gastrointestinal diseases, which suggested that the higher diversity of oral microbiota in CRA group may be a high risk for gastrointestinal tumorigenesis [39]. Fusobacterium is known to be associated with colorectal adenomas and carcinoma [40-42]. In this study, we found an enrichment of Fusobacterium in the oral cavity of patients with colorectal tumors, especially in CRA group. Therefore, we speculate that the enrichment of Fusobacterium in the oral cavity may lead to its colonization in the colonic mucosa and further promote colorectal carcinogenesis, which indicates that Fusobacterium may serve as a “driver” in colorectal carcinogenesis [43]. By contrary, Fusobacterium may serve as a “passenger” according to the classic “driver-passenger model” by Tjalsma et al. [44]. Thus, the definite role of this oral species to CRC pathogenesis is still a matter of debate. Interestingly, the abundance of Fusobacterium was significantly lower in the CRC group than in the CRA group. Several studies have shown that Fusobacterium was enriched in the tumor tissue of CRC compared to CRA [43, 45], but different sample types and different detection methods may result in ambiguous results. In this study, the sample type was oral swab rather than tumor tissues. We speculated that the abundance of Fusobacterium in oral cavity may not be consistent with that in the tumor tissues. Moreover, Fusobacterium may involve in colorectal carcinogenesis in the adenoma stage, and the increase of Fusobacterium in oral cavity may be a specific clinical manifestation of CRA stage. This inconsistency is strange and interesting, and the mechanism involved this inconsistency need to be further studied. Furthermore, we found a significant change in the oral bacteria composition of the CRC group relative to that of the healthy controls. Flemer et al. found that several oral taxa were differentially abundant in CRC compared with controls in western populations [23]. However, the differentiated composition of oral microbiome in our study is distinct from that of Flemer et al., which may be due to the different dietary structure and different races of the subjects. Together, these results indicate a significant global shift in the oral microbiota among the three groups.
Next, we conducted a functional analysis using PICRUSt. The results showed that the membrane transport pathway was decreased in the CRA groups and CRC groups compared with that in the healthy controls, which may have a potential impact on the anti-tumor immune response, such as the response mediated by bacterial outer membrane vesicles [46]. In contrast, the cell motility pathway was found to be overrepresented in the CRA and CRC groups, which can promote tumor invasion and migration [47]. Moreover, we identified two kinds of CAGs (pathogen CAGs and biofilm CAGs) from the top 20 bacterial genera among the three groups. Bacteria from the pathogen CAG such as Fusobacterium, Treponema and Porphyromonas were previously shown to be involved in the late colonization of oral biofilms and human diseases including CRC and juvenile periodontitis [48-51]. Since the pathogenicity of this type of bacteria is more worthy of attention, we define them as the pathogen CAGs. In addition, several genera such as Streptococcus, Faecalibacterium, and Rothia existed in the early formation of tooth biofilm, which play a non-pathogenic role in healthy tooth pockets or have potential probiotic effects [52]. Accordingly, we define them as biofilm CAGs. Streptococcus, a biofilm CAG, has promising results in treatment of halitosis, which often concurrent with digestive tract microbial disorders during the colorectal carcinogenesis [53, 54]. In this study, the decrease of Streptococcus in the oral cavity of CRA group may contribute to microbiota dysbiosis-associated colorectal carcinogenesis. Interestingly, the stringent network analysis showed that Fusobacterium (pathogen CAG) and Streptococcus (biofilm CAG) are mutually exclusive, indicating that there may be a biological antagonism between the two CAGs. Overall, these data further suggest an oral microbiota dysbiosis in CRC and CRA groups relative to healthy controls.
Finally, we identified specific oral microbial markers to distinguish CRA or CRC patients from healthy controls and verified their diagnostic efficacy using random forest classification models. The results show that the classifier based on the five optimal OTU markers can effectively distinguish CRA or CRC patients from healthy controls in discovery cohort and validation cohort. These findings suggest that biomarkers based on the oral microbiota may help predict the risk of CRA and CRC. Hong et al. found that microbiome dysbiosis in early aberrant crypt foci legion can be used as a biomarker for potential CRC development [55]. However, colonoscopy used in the study of Hong is an invasive method, whilst oral swab in our study is non-invasive that makes patients more compliant.
Nevertheless, there are some limitations about this study. First, we just compared the difference in oral microbiota compositions among the three groups, rather than do some research about the potential mechanism involved in colorectal carcinogenesis. Second, we just conducted a single-center study instead of a multi-center research, while the composition and activity of gut microbiota depends on many factors. The biomarkers are strongly ethnicity-dependent and should be validated in wide range of population. Third, metabolomics detection techniques, which can clarify the alteration of oral metabolites, may help us better understand the microecosystem network of oral microbial dysbiosis. Finally, methods of collecting oral microbes mainly include tongue coating, saliva, oral wash, and oral swabs [56]. In this study, only oral swabs were used to collect samples, which may lead to biased results due to uneven distribution of oral microbiome.
Conclusions
Oral microbial dysbiosis was found to be a common state in patients with CRA and CRC. Dysbiosis of the oral pathogen CAG (e.g. Fusobacterium, Treponema and Porphyromonas) and the biofilm CAG (e.g. Streptococcus, Faecalibacterium, and Rothia) may be important risks for colorectal carcinogenesis. Oral microbiota-based biomarkers can serve as a promising non-invasive tool for the detection of CRA and CRC. Further studies, such as constructing the special xenograft based on the target microbiota for in vivo and in vitro study, are needed to dissect the mechanisms of oral microbiota dysbiosis in colorectal carcinogenesis.
Abbreviations
CRC: colorectal cancer; CRA: colorectal adenoma; OTUs: operational taxonomic units; PCoA: principal coordinate analysis; PICRUSt: Phylogenetic Investigation of Communities by Reconstruction of Unobserved States; CAGs: co-abundance groups; POD: probability of disease; AUC: area under the curve.
Supplementary Material
Supplementary figures.
Supplementary tables.
Acknowledgements
Author contribution
Study concept and design: YM, SZ; Specimen provider: SZ, YM, YY; Acquisition of clinical data: SZ, YY; Data analysis and interpretation (including statistical analysis): CK, SZ, YM, YY, GC; Drafting of the manuscript: SZ, CK, and YM. All authors approved the current version of this manuscript.
Funding
This work was supported by grants from the National Natural Science Foundation of China (Nos. 81920108026, 81871964), the National Ten Thousand Plan Young Top Talents (for Dr. Yanlei Ma), the Shanghai Young Top Talents (for Dr. Yanlei Ma. No. QNBJ1701), the Shanghai Science and Technology Development Fund (No.19410713300, No. 20XD1421200), the CSCO-Roche Tumor Research Fund (No. Y-2019Roche-079), Fudan University Excellence 2025 Talent Cultivation Plan (for Dr. Yanlei Ma). The authors take this opportunity to thank all of the participating patients and healthy volunteers for supporting this study by donating the precious samples used in this research.
Competing Interests
The authors have declared that no competing interest exists.
References
1. Siegel RL, Miller KD, Fedewa SA, Ahnen DJ, Meester RGS, Barzi A. et al. Colorectal cancer statistics, 2017. CA Cancer J Clin. 2017;67:177-93
2. Chen W, Zheng R, Baade PD, Zhang S, Zeng H, Bray F. et al. Cancer statistics in China, 2015. CA Cancer J Clin. 2016;66:115-32
3. Markowitz SD, Bertagnolli MM. Molecular origins of cancer: molecular basis of colorectal cancer. N Engl J Med. 2009;361:2449-60
4. Song M, Chan AT. Environmental factors, gut microbiota, and colorectal cancer prevention. Clin Gastroenterol Hepatol. 2019;17:275-89
5. Bultman SJ. Molecular pathways: gene-environment interactions regulating dietary fiber induction of proliferation and apoptosis via butyrate for cancer prevention. Clin Cancer Res. 2014;20:799-803
6. Song M, Garrett WS, Chan AT. Nutrients, foods, and colorectal cancer prevention. Gastroenterology. 2015;148:1244-60 e16
7. Yang Y, Misra BB, Liang L, Bi D, Weng W, Wu W. et al. Integrated microbiome and metabolome analysis reveals a novel interplay between commensal bacteria and metabolites in colorectal cancer. Theranostics. 2019;9:4101-14
8. Pfaffe T, Cooper-White J, Beyerlein P, Kostner K, Punyadeera C. Diagnostic potential of saliva: current state and future applications. Clin Chem. 2011;57:675-87
9. Segata N, Haake SK, Mannon P, Lemon KP, Waldron L, Gevers D. et al. Composition of the adult digestive tract bacterial microbiome based on seven mouth surfaces, tonsils, throat and stool samples. Genome Biol. 2012;13:R42
10. Anand S, Kaur H, Mande SS. Comparative in silico analysis of butyrate production pathways in gut commensals and pathogens. Front Microbiol. 2016;7:1945
11. O'Keefe SJ. Diet, microorganisms and their metabolites, and colon cancer. Nat Rev Gastroenterol Hepatol. 2016;13:691-706
12. Le Bars P, Matamoros S, Montassier E, Le Vacon F, Potel G, Soueidan A. et al. The oral cavity microbiota: between health, oral disease, and cancers of the aerodigestive tract. Can J Microbiol. 2017;63:475-92
13. He J, Li Y, Cao Y, Xue J, Zhou X. The oral microbiome diversity and its relation to human diseases. Folia Microbiol (Praha). 2015;60:69-80
14. Fan X, Alekseyenko AV, Wu J, Peters BA, Jacobs EJ, Gapstur SM. et al. Human oral microbiome and prospective risk for pancreatic cancer: a population-based nested case-control study. Gut. 2018;67:120-7
15. Peters BA, Wu J, Pei Z, Yang L, Purdue MP, Freedman ND. et al. Oral microbiome composition reflects prospective risk for esophageal cancers. Cancer Res. 2017;77:6777-87
16. Thursby E, Juge N. Introduction to the human gut microbiota. Biochem J. 2017;474:1823-36
17. Koliarakis I, Messaritakis I, Nikolouzakis TK, Hamilos G, Souglakos J, Tsiaoussis J. Oral bacteria and intestinal dysbiosis in colorectal cancer. Int J Mol Sci. 2019 20
18. Kato I, Vasquez AA, Moyerbrailean G, Land S, Sun J, Lin HS. et al. Oral microbiome and history of smoking and colorectal cancer. J Epidemiol Res. 2016;2:92-101
19. Yang Y, Cai Q, Shu XO, Steinwandel MD, Blot WJ, Zheng W. et al. Prospective study of oral microbiome and colorectal cancer risk in low-income and African American populations. Int J Cancer. 2019;144:2381-9
20. Brennan CA, Garrett WS. Gut microbiota, inflammation, and colorectal cancer. Annu Rev Microbiol. 2016;70:395-411
21. Bray C, Bell LN, Liang H, Collins D, Yale SH. Colorectal cancer screening. WMJ. 2017;116:27-33
22. Sung JJ, Ng SC, Chan FK, Chiu HM, Kim HS, Matsuda T. et al. An updated Asia Pacific Consensus Recommendations on colorectal cancer screening. Gut. 2015;64:121-32
23. Flemer B, Warren RD, Barrett MP, Cisek K, Das A, Jeffery IB. et al. The oral microbiota in colorectal cancer is distinctive and predictive. Gut. 2018;67:1454-63
24. Gevers D, Knight R, Petrosino JF, Huang K, McGuire AL, Birren BW. et al. The Human Microbiome Project: a community resource for the healthy human microbiome. PLoS Biol. 2012;10:e1001377
25. Caporaso JG, Kuczynski J, Stombaugh J, Bittinger K, Bushman FD, Costello EK. et al. QIIME allows analysis of high-throughput community sequencing data. Nat Methods. 2010;7:335-6
26. Ren Z, Li A, Jiang J, Zhou L, Yu Z, Lu H. et al. Gut microbiome analysis as a tool towards targeted non-invasive biomarkers for early hepatocellular carcinoma. Gut. 2019;68:1014-23
27. Devaraj S, Hemarajata P, Versalovic J. The human gut microbiome and body metabolism: implications for obesity and diabetes. Clin Chem. 2013;59:617-28
28. Nieuwdorp M, Gilijamse PW, Pai N, Kaplan LM. Role of the microbiome in energy regulation and metabolism. Gastroenterology. 2014;146:1525-33
29. Cani PD. Gut cell metabolism shapes the microbiome. Science. 2017;357:548-9
30. Langille MG, Zaneveld J, Caporaso JG, McDonald D, Knights D, Reyes JA. et al. Predictive functional profiling of microbial communities using 16S rRNA marker gene sequences. Nat Biotechnol. 2013;31:814-21
31. Kanehisa M, Goto S. KEGG: kyoto encyclopedia of genes and genomes. Nucleic Acids Res. 2000;28:27-30
32. Poutahidis T, Erdman SE. Commensal bacteria modulate the tumor microenvironment. Cancer Lett. 2016;380:356-8
33. Yang Y, Weng W, Peng J, Hong L, Yang L, Toiyama Y. et al. Fusobacterium nucleatum increases proliferation of colorectal cancer cells and tumor development in mice by activating toll-like receptor 4 signaling to nuclear factor-κb, and up-regulating expression of microRNA-21. Gastroenterology. 2017;152:851-66 e24
34. Kim M, Friesen L, Park J, Kim HM, Kim CH. Microbial metabolites, short-chain fatty acids, restrain tissue bacterial load, chronic inflammation, and associated cancer in the colon of mice. Eur J Immunol. 2018;48:1235-47
35. Farrell JJ, Zhang L, Zhou H, Chia D, Elashoff D, Akin D. et al. Variations of oral microbiota are associated with pancreatic diseases including pancreatic cancer. Gut. 2012;61:582-8
36. Lu H, Ren Z, Li A, Zhang H, Jiang J, Xu S. et al. Deep sequencing reveals microbiota dysbiosis of tongue coat in patients with liver carcinoma. Sci Rep. 2016;6:33142
37. Hayes RB, Ahn J, Fan X, Peters BA, Ma Y, Yang L. et al. Association of oral microbiome with risk for incident head and neck squamous cell cancer. JAMA Oncol. 2018;4:358-65
38. Lamont RJ, Koo H, Hajishengallis G. The oral microbiota: dynamic communities and host interactions. Nat Rev Microbiol. 2018;16:745-59
39. Kitamoto S, Nagao-Kitamoto H, Hein R, Schmidt TM, Kamada N. The bacterial connection between the oral cavity and the gut diseases. J Dent Res. 2020;99:1021-29
40. Ito M, Kanno S, Nosho K, Sukawa Y, Mitsuhashi K, Kurihara H. et al. Association of Fusobacterium nucleatum with clinical and molecular features in colorectal serrated pathway. Int J Cancer. 2015;137:1258-68
41. Kostic AD, Gevers D, Pedamallu CS, Michaud M, Duke F, Earl AM. et al. Genomic analysis identifies association of Fusobacterium with colorectal carcinoma. Genome Res. 2012;22:292-8
42. Mima K, Sukawa Y, Nishihara R, Qian ZR, Yamauchi M, Inamura K. et al. Fusobacterium nucleatum and T Cells in colorectal carcinoma. JAMA Oncol. 2015;1:653-61
43. Kostic AD, Chun E, Robertson L, Glickman JN, Gallini CA, Michaud M. et al. Fusobacterium nucleatum potentiates intestinal tumorigenesis and modulates the tumor-immune microenvironment. Cell Host Microbe. 2013;14:207-15
44. Tjalsma H, Boleij A, Marchesi JR, Dutilh BE. A bacterial driver-passenger model for colorectal cancer: beyond the usual suspects. Nat Rev Microbiol. 2012;10:575-82
45. Rubinstein MR, Wang X, Liu W, Hao Y, Cai G, Han YW. Fusobacterium nucleatum promotes colorectal carcinogenesis by modulating E-cadherin/beta-catenin signaling via its FadA adhesin. Cell Host Microbe. 2013;14:195-206
46. Kim OY, Park HT, Dinh NTH, Choi SJ, Lee J, Kim JH. et al. Bacterial outer membrane vesicles suppress tumor by interferon-gamma-mediated antitumor response. Nat Commun. 2017;8:626
47. Mierke CT. The matrix environmental and cell mechanical properties regulate cell migration and contribute to the invasive phenotype of cancer cells. Rep Prog Phys. 2019;82:064602
48. Arora N, Mishra A, Chugh S. Microbial role in periodontitis: Have we reached the top? Some unsung bacteria other than red complex. J Indian Soc Periodontol. 2014;18:9-13
49. Jover-Diaz F, Cuadrado JM, Laveda R, Andreu L, Merino J. Porphyromonas asaccharolytica liver abscess. Anaerobe. 2003;9:87-9
50. Palmer RJ Jr. Composition and development of oral bacterial communities. Periodontol 2000. 2014;64:20-39
51. Socransky SS, Haffajee AD, Cugini MA, Smith C, Kent RL Jr. Microbial complexes in subgingival plaque. J Clin Periodontol. 1998;25:134-44
52. Heller D, Helmerhorst EJ, Gower AC, Siqueira WL, Paster BJ, Oppenheim FG. Microbial diversity in the early in vivo-formed dental biofilm. Appl Environ Microbiol. 2016;82:1881-8
53. Zupancic K, Kriksic V, Kovacevic I, Kovacevic D. Influence of oral probiotic streptococcus salivarius K12 on ear and oral cavity health in humans: systematic review. Probiotics Antimicrob Proteins. 2017;9:102-10
54. Mogilnicka I, Bogucki P, Ufnal M. Microbiota and malodor-etiology and management. Int J Mol Sci. 2020;21:2886
55. Hong BY, Ideta T, Lemos BS, Igarashi Y, Tan Y, DiSiena M. et al. Characterization of mucosal dysbiosis of early colonic neoplasia. NPJ Precis Oncol. 2019;3:29
56. Chen Y, Chen X, Yu H, Zhou H, Xu S. Oral microbiota as promising diagnostic biomarkers for gastrointestinal cancer: a systematic review. Onco Targets Ther. 2019;12:11131-44
Author contact
![]() Corresponding authors: Department of Oncology, Shanghai Medical College of Fudan University; Department of Colorectal Surgery, Fudan University Shanghai Cancer Center, No.270 Dongan' Road, Xuhui District, Shanghai 200032, China, 200032. Yanlei Ma, M.D., Ph.D., E-mail: yanleimaedu.cn; Guoxiang Cai, M.D., Ph.D., E-mail: guoxiangcaicom; Xinxiang Li, M.D., E-mail: li_xinxiangcom.
Corresponding authors: Department of Oncology, Shanghai Medical College of Fudan University; Department of Colorectal Surgery, Fudan University Shanghai Cancer Center, No.270 Dongan' Road, Xuhui District, Shanghai 200032, China, 200032. Yanlei Ma, M.D., Ph.D., E-mail: yanleimaedu.cn; Guoxiang Cai, M.D., Ph.D., E-mail: guoxiangcaicom; Xinxiang Li, M.D., E-mail: li_xinxiangcom.
Citation styles
APA
Zhang, S., Kong, C., Yang, Y., Cai, S., Li, X., Cai, G., Ma, Y. (2020). Human oral microbiome dysbiosis as a novel non-invasive biomarker in detection of colorectal cancer. Theranostics, 10(25), 11595-11606. https://doi.org/10.7150/thno.49515.
ACS
Zhang, S.; Kong, C.; Yang, Y.; Cai, S.; Li, X.; Cai, G.; Ma, Y. Human oral microbiome dysbiosis as a novel non-invasive biomarker in detection of colorectal cancer. Theranostics 2020, 10 (25), 11595-11606. DOI: 10.7150/thno.49515.
NLM
Zhang S, Kong C, Yang Y, Cai S, Li X, Cai G, Ma Y. Human oral microbiome dysbiosis as a novel non-invasive biomarker in detection of colorectal cancer. Theranostics 2020; 10(25):11595-11606. doi:10.7150/thno.49515. https://www.thno.org/v10p11595.htm
CSE
Zhang S, Kong C, Yang Y, Cai S, Li X, Cai G, Ma Y. 2020. Human oral microbiome dysbiosis as a novel non-invasive biomarker in detection of colorectal cancer. Theranostics. 10(25):11595-11606.
This is an open access article distributed under the terms of the Creative Commons Attribution License (https://creativecommons.org/licenses/by/4.0/). See http://ivyspring.com/terms for full terms and conditions.