Theranostics
13.3
Impact Factor
- Current Issue
- Advance Articles
- Volume 16; 2026
- Volume 15; 2025
- Volume 14; 2024
- Volume 13; 2023
- Volume 12; 2022
- Archive
- Cover Images
- Cover Suggestion
- Special Issues
Top
Introduction
Materials and Methods
Results
Discussion
Conclusion
Abbreviations
Supplementary Material
Acknowledgements
References
Introduction
Materials and Methods
Results
Discussion
Conclusion
Abbreviations
Supplementary Material
Acknowledgements
References
International Journal of Biological Sciences
International Journal of Medical Sciences
 Global reach, higher impact

Theranostics 2020; 10(19):8757-8770. doi:10.7150/thno.47317 This issue Cite
Research Paper
MR-detectable metabolic biomarkers of response to mutant IDH inhibition in low-grade glioma
Abigail R Molloy1*, Chloé Najac1*, Pavithra Viswanath1, Aliya Lakhani1, Elavarasan Subramani1, Georgios Batsios1, Marina Radoul1, Anne Marie Gillespie1, Russell O Pieper2,3, Sabrina M Ronen1,2 ![]()
1. Department of Radiology and Biomedical Imaging, University of California San Francisco, San Francisco, CA, USA
2. Brain Tumor Center, University of California San Francisco, San Francisco, CA, USA
3. Department of Neurological Surgery, Helen Diller Research Center, University of California San Francisco, San Francisco, CA, USA
*Contributed equally
Received 2020-4-22; Accepted 2020-6-17; Published 2020-7-9
Citation:
Molloy AR, Najac C, Viswanath P, Lakhani A, Subramani E, Batsios G, Radoul M, Gillespie AM, Pieper RO, Ronen SM. MR-detectable metabolic biomarkers of response to mutant IDH inhibition in low-grade glioma. Theranostics 2020; 10(19):8757-8770. doi:10.7150/thno.47317. https://www.thno.org/v10p8757.htm
Other stylesAbstract

Mutations in isocitrate dehydrogenase 1 (IDH1mut) are reported in 70-90% of low-grade gliomas and secondary glioblastomas. IDH1mut catalyzes the reduction of α-ketoglutarate (α-KG) to 2-hydroxyglutarate (2-HG), an oncometabolite which drives tumorigenesis. Inhibition of IDH1mut is therefore an emerging therapeutic approach, and inhibitors such as AG-120 and AG-881 have shown promising results in phase 1 and 2 clinical studies. However, detection of response to these therapies prior to changes in tumor growth can be challenging. The goal of this study was to identify non-invasive clinically translatable metabolic imaging biomarkers of IDH1mut inhibition that can serve to assess response.
Methods: IDH1mut inhibition was confirmed using an enzyme assay and 1H- and 13C- magnetic resonance spectroscopy (MRS) were used to investigate the metabolic effects of AG-120 and AG-881 on two genetically engineered IDH1mut-expressing cell lines, NHAIDH1mut and U87IDH1mut.
Results: 1H-MRS indicated a significant decrease in steady-state 2-HG following treatment, as expected. This was accompanied by a significant 1H-MRS-detectable increase in glutamate. However, other metabolites previously linked to 2-HG were not altered. 13C-MRS also showed that the steady-state changes in glutamate were associated with a modulation in the flux of glutamine to both glutamate and 2-HG. Finally, hyperpolarized 13C-MRS was used to show that the flux of α-KG to both glutamate and 2-HG was modulated by treatment.
Conclusion: In this study, we identified potential 1H- and 13C-MRS-detectable biomarkers of response to IDH1mut inhibition in gliomas. Although further studies are needed to evaluate the utility of these biomarkers in vivo, we expect that in addition to a 1H-MRS-detectable drop in 2-HG, a 1H-MRS-detectable increase in glutamate, as well as a hyperpolarized 13C-MRS-detectable change in [1-13C] α-KG flux, could serve as metabolic imaging biomarkers of response to treatment.
Keywords: IDH1 mutation, low grade glioma, hyperpolarized 13C magnetic resonance spectroscopy, AG-881, AG-120
Introduction
Recent reports estimated that over 25,000 new cases of primary malignant brain tumors would be diagnosed in the United States in 2020 [1]. The World Health Organization (WHO) classifies brain tumors according to their cell type (astrocytoma, oligodendroglioma and glioblastoma) and grade (I to IV) based on clinical, histological and, since the revised 2016 WHO classification, molecular/genetic criteria [1-4]. Grade I tumors are typically benign, grade II and III astrocytomas and oligodendrogliomas are mostly considered low-grade gliomas (LGGs), and grade IV glioblastomas (GBMs) are classified as high-grade. Although LGGs have a significantly better prognosis than GBMs, average survival still remains below 7 years [4, 5]. Standard of care for all gliomas involves maximal safe surgical resection followed by treatment, depending on grade [4]. But tumor upgrade and recurrence almost always occur, leading to patient death [4, 5]. Therefore, improved treatment for glioma patients is currently a major focus of the neuro-oncology community.
Up to 70-90% of LGGs and secondary upgraded GBMs harbor a mutation in the cytosolic isocitrate dehydrogenase 1 (IDH1) enzyme or, in a smaller number of cases, in the mitochondrial IDH2 [6-8]. The wild-type IDH enzyme catalyzes the oxidative decarboxylation of isocitrate to α-ketoglutarate (α-KG). In contrast, mutant IDH catalyzes the reduction of α-KG to 2-hydroxyglutarate (2-HG) leading to abnormal accumulation of the oncometabolite 2-HG in mutant cells. Elevated levels of 2-HG drive tumor development by leading to genome-wide histone and DNA methylation changes as well as stabilization of HIF-1α, all of which can mediate oncogenesis via multiple pathways [6-8]. Therefore, the IDH mutation is now recognized as a “driver mutation” required for the initiation of LGGs, and IDH mutational status has been included as a genotypic parameter in the revised 2016 WHO classification of diffuse gliomas [3].
Due to its critical role in tumor development, targeting the IDH mutation is being considered as a potential therapeutic approach for mutant IDH gliomas [9-11]. Several inhibitors have been developed [11] and are currently in clinical trials, either alone or in combination with chemotherapy or immunotherapy (e.g. clinicaltrials.gov NCT03343197, NCT02746081, NCT03030066, NCT03684811, NCT02381886). However, assessment of early response to these inhibitors using conventional non-invasive imaging techniques, such as magnetic resonance imaging (MRI) or computerized axial tomography (CT), is challenging. Both MRI and CT are mostly limited to the detection of anatomical changes, which can occur relatively late post treatment initiation. In fact, studies with other targeted inhibitors in tumors including gliomas show that treatment can lead tumor stasis rather than shrinkage [12, 13]. Furthermore, LGGs are slow growing and difficult to monitor based on tumor size alone. Therefore, there is an urgent need for complementary imaging approaches which can identify early biomarkers of response to treatment and confirm target engagement prior to tumor shrinkage.
Magnetic resonance spectroscopy (MRS) is a well-established non-invasive technique that could help address the challenge of evaluating response to treatment by monitoring metabolic alterations specifically associated with mutant IDH inhibition. 1H-MRS informs on steady-state metabolite concentrations and 13C-MRS can be used complementarily to evaluate metabolic fluxes by monitoring the fate of exogenous 13C-labeled substrates [14-16]. Furthermore, development of the hyperpolarized 13C-MRS technique, which uses dissolution dynamic nuclear polarization (dDNP), has been shown to enhance the signal-to-noise ratio of 13C-labeled metabolites by >10,000 fold [17]. This provides a translational non-invasive method to evaluate real time metabolism both in vitro and in vivo, and has been successfully translated to the clinic using [1-13C] pyruvate as an imaging biomarker for several tumor types including glioma [18-20].
In the context of brain tumors, several studies have demonstrated the utility of MRS to differentiate tumors from normal brain and non-neoplastic lesions as well as inform on IDH mutational status [14, 21-26]. 1H-MRS has been used to detect the oncometabolite 2-HG in vivo in patients with mutant IDH gliomas, and ex vivo in glioma biopsies [27-34]. Beyond 2-HG detection, investigations of glioma cell models, tumor samples ex vivo, and patients in vivo have all demonstrated broad reprogramming of cellular metabolism that is associated with the IDH mutation [35-47]. Using 1H-MRS, we previously investigated cells genetically engineered to express mutant IDH1 (IDH1mut) compared to their isogenic wild-type IDH1 (IDH1wt) counterparts [39]. In addition to the increase in 2-HG, we observed a significant drop in intracellular steady-state levels of glutamate, phosphocholine (PC) and lactate. Using 13C-MRS, complementary studies showed that the drop in glutamate can be explained by a decrease in flux from 13C-labeled glucose that is mediated by a reduction in pyruvate dehydrogenase (PDH) activity [38], as well as a decrease in the flux from α-KG to glutamate mediated by a reduction in the activities of branched chain aminotransferase 1 (BCAT1), aspartate transaminase (AST), and glutamate dehydrogenase (GDH) [47]. Additionally, the changes in PC have been linked to several alterations in lipid metabolism [45, 46]. The 1H- and 13C-MRS findings have also been leveraged to develop hyperpolarized 13C-MRS approaches to image IDH1 status. In particular, the reduced flux to glutamate can be imaged using hyperpolarized [2-13C] pyruvate as well as hyperpolarized [1-13C] α-KG [38, 47]. Hyperpolarized [1-13C] α-KG can also be used to image the increased flux to 2-HG [35]. Collectively, these studies identified an MRS-detectable metabolic signature associated with the IDH1 mutation.
Based on the above-mentioned findings, the goal of this investigation was to examine the hypothesis that our previously identified 1H- and 13C-MRS-detectable metabolic alterations would be reversed with mutant IDH1 inhibition and thus serve as biomarkers for assessing the effect of, and potential response to, mutant IDH inhibitors. Our studies used two orally available small molecule inhibitors which are currently in clinical trials [9]. AG-120 is a potent first-in-class IDH1mut inhibitor [48], while AG-881 is a potent first-in-class, brain penetrant inhibitor of both IDH1mut and IDH2mut [49]. We investigated their intracellular metabolic effects on two genetically engineered IDH1mut-expressing cell lines using 1H-, 13C-, and hyperpolarized 13C-MRS [35, 38, 39, 47] and observed that some, but unexpectedly not all, of our previously identified IDH1mut-associated intracellular metabolic alterations were reversed with treatment. Our studies demonstrate that IDH1mut inhibition induces a unique metabolic profile which is detectable using clinically translatable MRS metabolic imaging and could potentially improve the monitoring of IDH1mut inhibitor treatment for glioma patients.
Materials and Methods
Cell culture and drug treatment
NHA and U87 cell lines expressing the mutant gene IDH R132H (NHAIDH1mut and U87IDH1mut), and an NHA cell line expressing wild-type IDH1 (NHAIDH1wt), were generated and maintained in Dulbecco's Modified Eagle Medium (DMEM; Gibco, USA) supplemented with 10% fetal calf serum, 2 mM glutamine, and 100 U/mL penicillin and streptomycin under normoxic conditions as previously described [39]. Both cell lines were routinely tested for mycoplasma contamination and authenticated by short tandem repeat fingerprinting (Cell Line Genetics, USA) within 6 months of any study.
AG-881 (MedChemExpress, USA) and AG-120 (MedChemExpress, USA) solutions (1000X) were prepared by mixing drug powder with DMSO (Sigma Aldrich, USA). For all experiments, treatment with 1 µM AG-881, 1 µM AG-120, or DMSO (vehicle, 0.1%) began one day after seeding, when cells had adhered to flasks, and cells were treated every 24 h for 72 h. Drug dosages were based on previous publication with a biosimilar [50] and confirmed in our cell models.
Spectrophotometric enzyme assays
All spectrophotometric measurements were performed on an Infinite m200 spectrophotometer (Tecan Systems, Inc., USA). NHAIDH1mut and U87IDH1mut cells were grown and treated as described above, collected, and samples prepared according to manufacturer instructions to quantify enzyme activities.
IDH1mut activity was quantified using a colorimetric assay kit (BioVision, USA). Briefly, ~1.0 × 10⁷ cells were lysed in kit buffer and 25 µL of sample was loaded per well with reaction mix. Absorbance at 450 nm, reflecting NADPH consumption, was measured every 1 min for 1 h at 37 ºC. Enzyme activity was calculated by converting absorbance/min into nmol/min using an NADPH standard and normalizing to cell number as per manufacturer instructions.
Glutamate dehydrogenase (GDH) and aspartate transaminase (AST) activities were measured using assay kits (Abcam, UK). For both assays, ~1.0 × 10⁷ cells were lysed in kit buffer and 50 µL of sample loaded per well. Absorbance at 450 nm was measured every 1 min for 1 h at 37 ºC. Activities of GDH and AST were calculated using standard curves of NADH and glutamate, respectively, and expressed in fmol of NADH/cell/min or fmol of glutamate/cell/min.
The BCAT1 activity assay replicated methods described by Chaumeil et al. [47]. Briefly, ~1.0 × 10⁷ cells were lysed and 20 µL of lysate loaded per well. Absorbance was measured at 340 nm every 30 s for 10 min and reaction rate was calculated for each sample and expressed as fmol NADH/cell/min.
Cell proliferation and clonogenicity
Impact of treatment on cell proliferation was determined by counting the number of cells at the time of extraction. Cells were aliquoted and counted using a Cellometer Mini Automated Cell Counter (Nexcelom Bioscience, USA). Clonogenicity of control and treated NHAIDH1mut and U87IDH1mut cells was determined by seeding ~500 cells per well in 6-well plates containing 2 mL DMEM (Gibco, USA), similar to previous studies [51]. After 24 h, media was replaced and treatment initiated. Cells were treated every 24 h until colonies could be observed (10-15 days depending on cell line) at which point colonies were gently washed, incubated at room temperature with 0.01% crystal violet (Sigma-Aldrich, USA; ref. HT90132-1L) for 30 min and stained colonies were counted.
1H-MRS of cell extracts
Control and treated NHAIDH1mut, U87IDH1mut, and NHAIDH1wt cells were extracted using the dual-phase extraction method as previously described [52]. Briefly, ~3.0 × 10⁷ cells were trypsinized, centrifuged and vortexed in 10 mL of ice-cold methanol followed by 10 mL each of ice-cold chloroform and ice-cold water. Following phase separation, the aqueous phase was lyophilized and resuspended in 400 μL of deuterium oxide (Cambridge Isotope Laboratories, USA). 5 mM sodium 3-(trimethylsilyl)propionate-2,2,3,3-d4 (TSP) (Cambridge Isotope Laboratories, USA) was placed in a coaxial insert and used as an external chemical shift and quantification reference. Aqueous phase spectra (90° flip angle (FA), 3 s repetition time (TR), 384 scans) were acquired using a 500 MHz Bruker Avance spectrometer (Bruker Biospin, Germany). Prior to Fourier transformation, a line broadening of 0.3 Hz was applied to FIDs. All detectable metabolites were then quantified by peak integration following deconvolution of overlapping peaks using Mnova (MestreLab Research, Spain). Peak integrals were corrected for saturation and Nuclear Overhauser effect (NOE) correction factors and normalized to cell number as previously published [39].
13C-MRS of cell extracts
NHAIDH1mut and U87IDH1mut cells were grown in media in which glucose and glutamine were replaced with [1-13C] glucose (5.5 mM) or [3-13C] glutamine (2.2 mM), supplemented with 12C glucose and 12C glutamine to reach normal concentration (25 mM glucose; 6 mM glutamine), and treated as described above. Approximately 1.0 × 10⁸ cells were extracted by dual-phase extraction [52] and prepared as described above. Similarly to our previous studies [38], 13C spectra were acquired with a standard Bruker 1D proton-decoupled 13C sequence (zgpg30) using a 500 MHz Bruker Avance spectrometer (Bruker Biospin, Germany). Spectra were acquired with a 30° flip angle and 3 second relaxation delay with a total of 4000 averages. In addition, a fully relaxed spectrum (90° flip angle, 60 second relaxation delay and broad-band decoupling applied during the acquisition time only) was acquired and used to estimate the saturation and NOE correction factors. Prior to Fourier transformation, a line broadening of 1.0 Hz was applied. All spectral assignments were based on literature reports and quantification of peak integrals was performed after deconvolution of overlapping peaks using Mnova (Mestrelab Research, Spain). Data were then corrected for saturation and NOE, and normalized to an external reference of known concentration (43 mM TSP) and cell number.
Hyperpolarized 13C-MRS
Hyperpolarized [2-13C] pyruvate studies
6 µL of [2-13C] pyruvate solution (14.4 M [2-13C] pyruvate, 19.5 mM OX63 radical, 1.5 mM Dotarem) was polarized using a Hypersense DNP polarizer (Oxford Instruments, UK) for approximately 1 h similar to previous publications [38] (based on previous work we expect ~20-30% polarization ratio [53]). Hyperpolarized [2-13C] pyruvate was then rapidly dissolved in 6 mL Tris-based isotonic buffer and 300 µL was injected into a suspension of ~5.0 × 10⁷ live cells to a final concentration of 5 mM. Dynamic sets of 13C spectra were immediately acquired using a 1.5 Tesla Pulsar (Oxford Instruments, UK) spectrometer (20º FA, 3 s TR, 100 scans).
Hyperpolarized [1-13C] α-KG studies
30 µL of [1-13C] α-KG solution (5.9 M [1-13C] α-KG, 3:1 water:glycerol, 17.3 mM OX63 radical, 0.4 mM Dotarem) was polarized using a Hypersense polarizer (Oxford Instruments, UK) for approximately 1.5 h as previously described [35, 47] (based on previous work we expect ~15% polarization ratio [35]). Hyperpolarized [1-13C] α-KG was rapidly dissolved in 5 mL Tris-based isotonic buffer and 300 µL was injected into a suspension of ~5.0 × 10⁷ live cells to a final concentration of 15 mM. Dynamic sets of 13C spectra were immediately acquired using a 1.5 Tesla Pulsar (Oxford Instruments, UK) spectrometer (20º FA, 3 s TR, 100 scans). In addition, to clearly distinguish the [1-13C] 2-HG product peak from that of the natural abundance [5-13C] α-KG, hyperpolarized [1-13C] α-KG was injected into cell lysates as previously described [35]. Briefly ~1.5 × 10⁸ cells were lysed, placed in a 5 mm NMR tube and mixed with 1 mM each of NADPH and NADH immediately prior to injection of ~500 µL hyperpolarized [1-13C] α-KG solution (15 mM final concentration). Dynamic sets of 13C spectra were immediately acquired using an 11.7 Tesla (Agilent Technologies, USA) spectrometer (13º FA, 3 s TR, 100 scans).
13C spectra were analyzed using Mnova (MestreLab Research, Spain). For dynamic analysis, metabolites were quantified by peak integration for each time point, then normalized to the maximum substrate peak ([2-13C] pyruvate or [1-13C] α-KG) and cell number as previously described [35, 38, 47, 54]. We also quantified the area under the curve for product and normalized to substrate and cell number.
Statistical analysis
All experiments were performed at least 3 times unless otherwise stated and results are expressed as mean ± standard deviation. An unpaired Student's t-test assuming unequal variance with p < 0.05 considered significant was used to compare findings with a statistical power ≥90% except for PC for which power was >80% (*p < 0.05, **p < 0.01, ***p < 0.001 and n.s. not significant). 1H-MRS data was also analyzed using One-Way ANOVA test with multiple comparison (using Bonferroni correction) (Table S1, S2, and S3).
Results
Our studies were performed on two genetically engineered IDH1mut-expressing cell models, NHAIDH1mut and U87IDH1mut. Prior to investigating the metabolic effects of AG-120 and AG-881, we first confirmed the activity of these drugs on our cell models by looking at IDH1mut enzyme activity, cell number, and clonogenicity. As illustrated in Figure 1A, treatment of NHAIDH1mut cells with 1 µM AG-120 (n = 3) or 1 µM AG-881 (n = 3) resulted in a significant 48% drop (p < 0.001) and 44% drop (p < 0.001) respectively in IDH1mut activity, compared to DMSO-treated control cells (n = 9), consistent with a recent publication regarding the enzyme IC50 and inhibitor efficacy at 3-5 times the IC50 [49]. There was no significant change in cell number after treatment with either inhibitor (n = 6) (Figure 1B), indicating that treatment did not alter cell proliferation or result in cell death. However, the inhibition of IDH1mut activity was associated with a significant drop in the number of colonies produced by cells treated with AG-120 and AG-881 by 46% (p < 0.01) and by 44% (p < 0.01), respectively, compared to control cells (n = 3) (Figure 1C). We also confirmed our results in U87IDH1mut cells. Similar to the NHA model, IDH1mut activity was significantly decreased by treatment with AG-120 (n = 4) (71%, p < 0.001) and AG-881 (n = 4) (27%, p < 0.01) (Figure 1A). Treatment with IDH1mut inhibitors did not cause a significant change in cell number (n = 6) (Figure 1B). Additionally, there was a significant drop (41%, p < 0.05; and 42%, p < 0.05) in the number of colonies produced by U87IDH1mut cells treated AG-120 and AG-881, respectively (n = 3 for each) (Figure 1C).
To test the hypothesis that IDH1mut inhibition reverts the MRS-detectable metabolic reprogramming associated with the IDH1 mutation, we used 1H-MRS and quantified steady-state metabolite levels in control and treated NHAIDH1mut (n = 9/5/8 DMSO/AG-120/AG-881) and U87IDH1mut (n = 16/11/11 DMSO/AG-120/AG-881) cells (Table S1, S2 and Figure 2). As expected, our results showed that treatment of NHAIDH1mut cells with AG-120 or AG-881 led to a significant 98% decrease (p < 0.001) and 88% decrease (p < 0.001) in steady-state 2-HG levels, respectively (Figure 2B). In addition, we detected a significant increase in glutamate levels (AG-120: 62%, p < 0.001; AG-881: 85%, p < 0.001) compared with DMSO-treated controls. PC levels also increased (AG-120: 106%, p < 0.01; AG-881: 133%, p < 0.001). However, counter to our expectation, intracellular lactate levels, which were reported to be modulated by the IDH1 mutation, were not significantly altered by treatment (AG-120: p = 0.85, AG-881: p = 0.69). None of the other MR-detectable metabolites previously investigated were altered either (Table S1) [39]. We confirmed our results in U87IDH1mut cells (Table S2 and Figure 2C) and found that treatment with IDH1mut inhibitors also led to a significant decrease in 2-HG (AG-120: 89%, p < 0.001; AG-881: 91%, p < 0.001). We also detected a significant increase in steady-state glutamate levels (AG-120: 71%, p < 0.001; AG-881: 80%, p < 0.001). However, the increase in PC only trended to significance with AG-120 (19%, p = 0.067), although it was significant with AG-881 treatment (58%, p < 0.001). Also, similarly to NHAIDH1mut cells and counter to our expectation, no significant changes in intracellular lactate levels were observed (AG-120: p = 0.15, AG-881: p = 0.67).
Figure 1
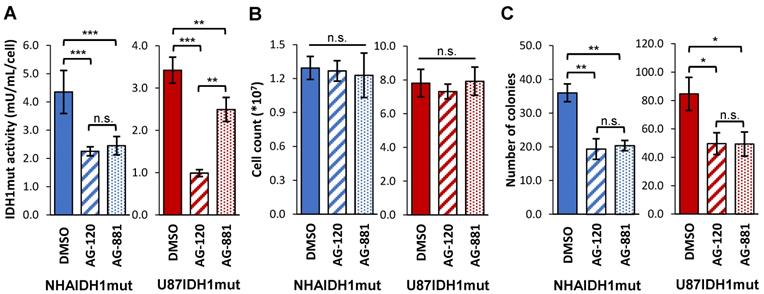
IDH1mut enzyme activity and clonogenicity are affected by IDH1mut-targeted treatment. (A) IDH1mut enzyme activity was reduced after both treatments in both NHA (blue) and U87 (red) IDH1mut cells. (B) Cell number was not affected by IDH1mut inhibitors. (C) Clonogenicity assays show significant decrease in number of colonies following both treatments. IDH1mut: mutant isocitrate dehydrogenase; n.s.: not significant.
Figure 2
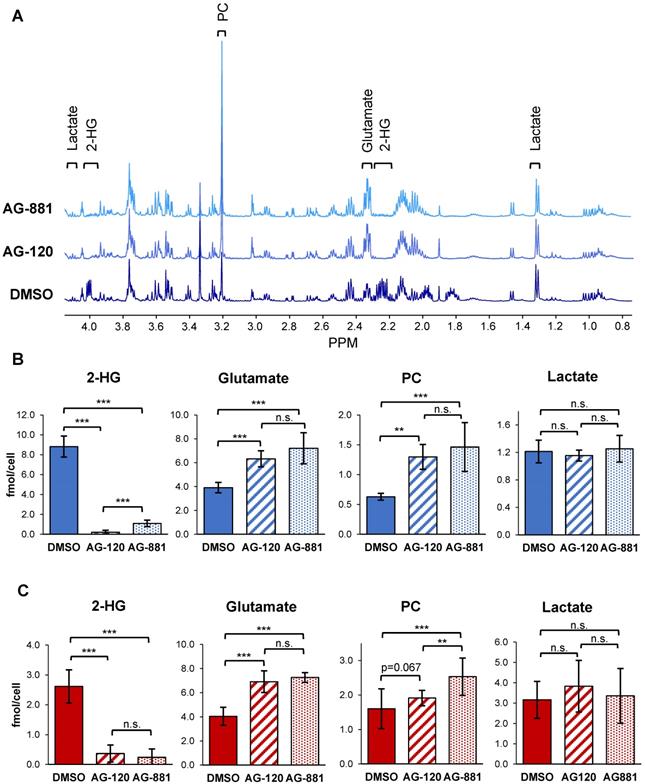
1H-MRS spectra show AG-120 and AG-881 affect intracellular steady-state metabolite levels in IDH1mut cells. (A) Representative 1H-MRS spectra of NHAIDH1mut cells treated with DMSO, (bottom), AG-120 (center), and AG-881 (top). (B) Quantification of steady-state NHAIDH1mut metabolite concentrations. Results illustrate that AG-120 and AG-881 affect 2-HG, PC and glutamate levels, but not lactate. (C) Quantification of steady-state metabolites in U87IDH1mut cells, supporting NHAIDH1mut results. 2-HG: 2-hydroxyglutarate; IDH1mut: mutant isocitrate dehydrogenase; n.s.: not significant; PC: phosphocholine.
To confirm that these metabolic alterations resulted from inhibition of the IDH1mut enzyme specifically, we also examined 1H-MRS-detectable metabolite levels in control and treated NHAIDH1wt cells (n = 3 for each). Unlike the IDH1mut models, we did not observe any significant metabolic alterations after treatment of NHAIDH1wt cells with AG-120 or AG-881, compared with DMSO-treated control cells (Table S3 and Figure S1).
To further confirm our findings, and assess whether hyperpolarized probes previously shown to be informative of IDH1 status [35, 38, 47] could also be used to probe IDH1 inhibition, we next examined how treatment-induced changes in intracellular 2-HG and glutamate were associated with altered metabolic fluxes. To that end, we probed 2-HG and glutamate synthesis from extracellular [1-13C] glucose and [3-13C] glutamine, the main precursors of these metabolites [38] (Figure 3A). Using 13C-MRS, we quantified intracellular [3-13C] 2-HG and [3-13C] glutamate (derived from [3-13C] glutamine) (NHAIDH1mut: n = 7/3/4; U87IDH1mut: n = 4/3/5 DMSO/AG-120/AG-881) (Figure 3B) as well as [4-13C] 2-HG and [4-13C] glutamate (derived from [1-13C] glucose) (NHAIDH1mut: n = 8/3/5; U87IDH1mut: n = 8/4/5 DMSO/AG-120/AG-881) (Figure 3C) and compared the contributions from glucose and glutamine to the total steady-state 2-HG and glutamate pools. In NHAIDH1mut cells, our results showed a significant decrease in the flux to 2-HG from both [1-13C] glucose (AG-120: 100%, p < 0.001; AG-881: 88%, p < 0.001) and [3-13C] glutamine (AG-120: 99%, p < 0.001; AG-881: 85%, p < 0.001) (Figure 3D). In contrast, when considering glutamate, flux from [3-13C] glutamine to glutamate significantly increased in cells treated with AG-120 (64%, p < 0.001) or AG-881 (73%, p < 0.001) while flux from [1-13C] glucose to glutamate was unchanged (p > 0.05) (Figure 3E). Findings in U87IDH1mut cells were similar. We observed a significant drop in the flux to 2-HG from both [1-13C] glucose (AG-120 and AG-881: 100%, p < 0.001) and [3-13C] glutamine (AG-120: 99%, p < 0.01; AG-881: 88%, p < 0.01) (Figure 3D). Unlike the NHAIDH1mut cells, we observed a significant increase in the flux from [1-13C] glucose to glutamate (AG-120: 74%, p < 0.001; AG-881: 88%, p < 0.001). However, similar to NHAIDH1mut, we also observed a significant increase in the flux of [3-13C] glutamine to glutamate in AG-120 (57%, p < 0.001) and AG-881 (67%, p < 0.001) treated cells (Figure 3E).
In light of these changes in metabolic fluxes, we next considered the likely utility of hyperpolarized 13C-MRS as a clinically translatable imaging approach to assess response to therapy in glioma and focused on investigating the more clinically relevant brain-penetrant inhibitor AG-881 [49 and http://investor.agios.com/]. Our 13C-MRS results showed no change in flux from [1-13C] glucose to glutamate following IDH1mut inhibition in NHAIDH1mut cells (Figure 3E). This indicated that hyperpolarized [2-13C] pyruvate would likely not be useful to probe the production of glutamate in our study. We confirmed this hypothesis in a small scale study in the NHAIDH1mut cells (n = 2) where we did not observe a change in flux from [2-13C] pyruvate to [5-13C] glutamate when comparing control (5.75±0.92 AU/ cell) and AG-881 treated (6.25±1.04 AU/cell) cells (Figure S2A-B). There was also no change in [2-13C] pyruvate flux to [2-13C] lactate after AG-881 treatment (from 8.58±0.43 to 7.56±0.87 AU/cell) (Figure S2C). Since our goal was to identify biomarkers common to both our cell models, we did not investigate pyruvate any further.
Next, we considered the utility of hyperpolarized [1-13C] α-KG for detecting the effect of IDH1mut inhibition. Based on our previous studies showing that hyperpolarized [1-13C] α-KG can detect elevated 2-HG synthesis and decreased glutamate synthesis in IDH1mut cells and tumors [35, 47], we hypothesized that this approach could detect a drop in 2-HG and increase in glutamate production following IDH1mut inhibition. We had also shown that the reduced conversion from α-KG to glutamate in mutant IDH1 tumors is mediated by a drop in GDH, BCAT1, and AST activities [47]. Therefore, in support of our hypothesis, we examined the activity of GDH, BCAT1, and AST, and detected a significant increase in the activity of GDH (30%, p < 0.05) in NHAIDH1mut cells treated with AG-881 (Figure S3A), but did not detect any changes in BCAT1 and AST activity (Figure S3B). Based on these findings we next investigated the metabolism of hyperpolarized [1-13C] α-KG to both glutamate and 2-HG.
Injection of hyperpolarized [1-13C] α-KG into control NHAIDH1mut cells resulted in a detectable buildup of glutamate as previously published [47] (Figure 4A) and, importantly, cells treated with AG-881 (n = 3) showed significantly higher flux from α-KG to glutamate compared with DMSO-treated control cells (n = 3; increasing 141%, p < 0.05) (Figure 4B). Investigating cell lysates allowed clear resolution of 2-HG from the naturally abundant [5-13C] α-KG, which resonate at 183.9 ppm and 184 ppm respectively [35] (Figure 4C), and demonstrated a detectable drop in α-KG flux to 2-HG in treated cells (decreasing 67%, p < 0.01) (Figure 4D). Findings in U87IDH1mut were similar to NHAIDH1mut. Flux from hyperpolarized [1-13C] α-KG to glutamate significantly increased in AG-881-treated U87IDH1mut cells (23%, p < 0.05) (Figure 5A) and flux to 2-HG was significantly reduced (43%, p < 0.01) (Figure 5B). Collectively, our data indicate that altered flux to both 2-HG and glutamate can be detected using hyperpolarized [1-13C] α-KG.
Discussion
The IDH1 mutation is found in over 70-90% of LGGs and upgraded GBMs and its inhibition is therefore an attractive therapeutic approach. Targeted inhibitors of IDH1 and pan-IDH1/2 mutations, such as AG-120 and AG-881 respectively, are in clinical trials and have shown promising results [9-11 and http://investor.agios.com/]. Clinical trials with AG-120 have shown substantial 2-HG reduction and disease control in patients with advanced tumors including acute myeloid leukemia (AML) and chondrosarcoma (e.g. clinicaltrials.gov NCT02073994 and NCT02074839) [11, 55], and AG-120 continues to be investigated either alone or in combination with traditional chemotherapies (e.g. clinicaltrials.gov NCT03245424 and NCT03173248). When considering gliomas, AG-120 has shown 2-HG suppression but low brain penetrance in preclinical models indicating that it may not effectively cross the blood brain barrier to treat glioma patients [48]. Thus, it was recently announced that AG-120 will not be moving forward independently in clinical trials for glioma [http://investor.agios.com/]. Nevertheless, the biomarkers we identified in this study could potentially be useful for response assessment in those tumor types which are responsive to AG-120, albeit after further studies to confirm the generality of our findings. AG-881 on the other hand, has shown adequate brain penetration, significantly decreases 2-HG accumulation in gliomas as detected by mass spectrometric measurements of tumor biopsies, and demonstrates promising clinical activity in early clinical trials (e.g. clinicaltrals.gov NCT02481154 and NCT03343197) [49, 56]. As a result, a phase 3 multicenter clinical study using AG-881 in glioma patients was recently initiated and will provide further insight into the efficacy of this novel therapeutic (clinicaltrials.gov NCT04164901).
Figure 3
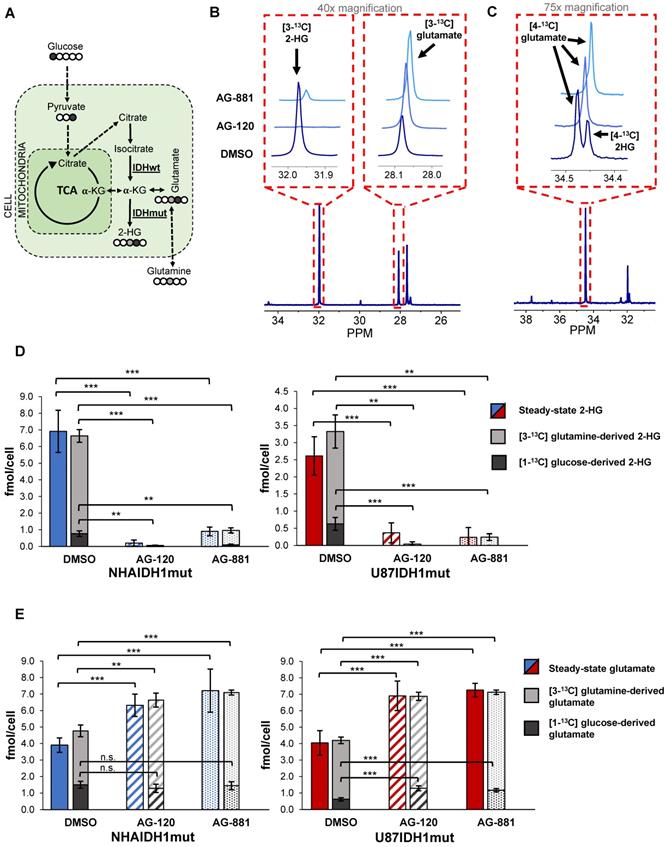
Changes in 2-HG and glutamate steady-state levels are associated with changes in metabolic fluxes. (A) Metabolic pathway showing 13C labeling of glutamate and 2-HG from [1-13C] glucose and [3-13C] glutamine. (B) Representative 13C-MRS spectra of NHAIDH1mut cells labeled with [3-13C] glutamine and (C) labeled with [1-13C] glucose (regions of labeled glutamate and 2-HG peaks expanded) (D) Quantification of 2-HG peaks produced from [1-13C] glucose and [3-13C] glutamine (measured from 13C-MRS data) and total 2-HG levels (measured from 1H-MRS data) shows decreased metabolic flux from both [1-13C] glucose and [3-13C] glutamine to 2-HG in both NHA (blue) and U87 (red) IDH1mut cells. (E) Quantification of 13C glutamate peaks from 13C-MRS and 1H-MRS data shows increased metabolic flux from [3-13C] glutamine to glutamate in both cell lines. There is also an increase in flux from [1-13C] glucose to glutamate in U87IDH1mut cells (red) but not NHAIDH1mut cells (blue). 2-HG: 2-hydroxyglutarate; IDH1mut: mutant isocitrate dehydrogenase; IDHwt: wild-type isocitrate dehydrogenase; n.s.: not significant.
Figure 4
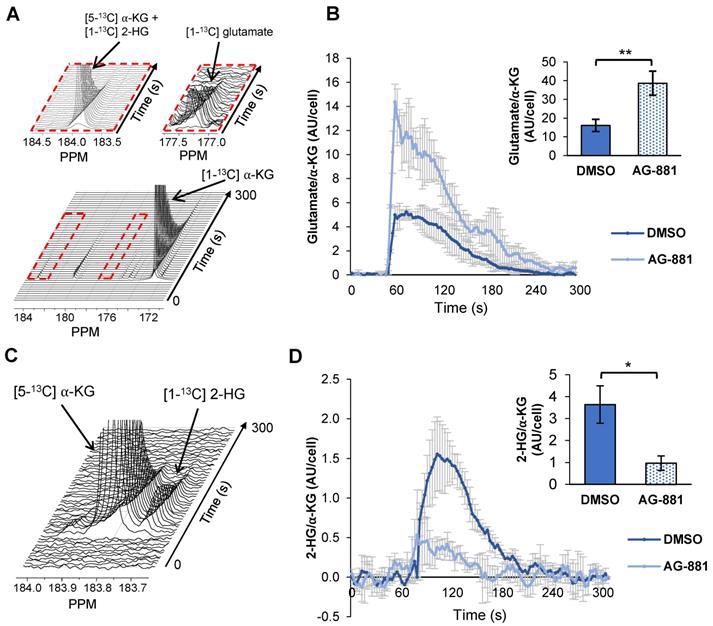
Fluxes from hyperpolarized [1-13C] α-KG to [1-13C] glutamate and [1-13C] 2-HG are altered after AG-881-treatment in NHAIDH1mut cells. (A) Representative 13C-MRS spectral array of [1-13C] glutamate production from hyperpolarized [1-13C] α-KG in live NHAIDH1mut cells acquired at 1.5 Tesla (region of [1-13C] glutamate and [5-13C] α-KG/[1-13C] 2-HG peaks expanded; [5-13C] α-KG and [1-13C] 2-HG peaks overlap). (B) Quantification of 13C-MRS spectra of NHAIDH1mut cells shows increased [1-13C] glutamate production following treatment. (C) 13C-MRS acquisition of hyperpolarized [1-13C] α-KG injection into NHAIDH1mut cell lysates at 11.7 Tesla allows for clear resolution of [1-13C] 2-HG from [5-13C] α-KG peak. (D) Quantification of 11.7 T spectra shows decreased 2-HG production following AG-881 treatment. 2-HG: 2-hydroxyglutarate; α-KG: alpha-ketoglutarate.
Figure 5
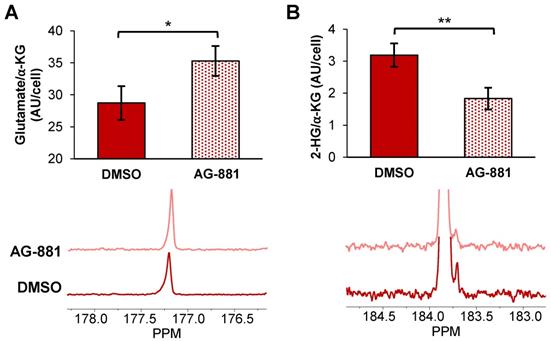
Fluxes from hyperpolarized [1-13C] α-KG to [1-13C] glutamate and [1-13C] 2-HG are altered after AG-881 treatment in U87IDH1mut cells (A) Quantification (top) of summed 13C-MRS spectra (bottom) of live U87IDH1mut cells at 1.5 T shows increased [1-13C] glutamate production from hyperpolarized [1-13C] α-KG following treatment. (B) Quantification (top) of summed 13C-MRS spectra (bottom) of U87DHmut cell lysates at 11.7 T shows decreased [1-13C] 2-HG production from hyperpolarized [1-13C] α-KG following AG-881 treatment. 2-HG: 2-hydroxyglutarate; α-KG: alpha-ketoglutarate.
Importantly however, in vivo studies with AG-881 and other mutant IDH inhibitors have shown that although treatment inhibits tumor growth, reduces cell density [57], and may extend patient survival, there is no evidence of clearly detectable tumor shrinkage [9 and http://investor.agios.com/]. Consistent with this observation, we found that treatment of our cell models with both AG-120 and AG-881 significantly inhibited IDH1mut enzyme activity and led to a 50% drop in clonogenicity but did not affect cell numbers indicating no cell death or inhibition of cell proliferation (Figure 1). These observations appear consistent with the complex, and yet to be fully understood, process through which inhibition of mutant IDH suppresses tumor growth but may not lead to readily detectable tumor shrinkage in vivo [9]. Accordingly, conventional anatomic imaging methods may not effectively assess response to treatment. This highlights the need for early biomarkers of drug delivery, drug action, and likely response to IDHmut inhibition, and our study identifies such potential biomarkers.
Our studies were performed in two genetically engineered cell models. The NHAIDH1mut model, which was generated from immortalized normal human astrocytes [39, 58], provides a robust platform to investigate the role and consequences of mutant IDH1 but is unlikely to reproduce the full complexity of a mutant IDH1 tumor in the patient. In contrast, the U87IDH1mut model was generated from patient U87 glioblastoma cells and, as such, likely harbors oncogenic mutations associated with the clinical development of GBM but not of LGG [39]. The different backgrounds of our models possibly explain some of the small metabolic differences observed in these cell lines following treatment (e.g. there is a change in glucose flux to glutamate for U87IDH1mut but not for NHAIDH1mut). Indeed, small differences in mutant IDH1-associated metabolism have been previously reported in these cell models [12, 38, 39]. It should also be noted that we did not investigate a model of mutant IDH2, which is a much less common mutation in glioma. In spite of the limitations of our models, this investigation identified common metabolic alterations associated with IDH1mut inhibition in both our cell lines. We have previously observed that IDH1-associated biomarkers identified in cells are also detected in orthotopic brain tumors in vivo [12, 35, 47]. This study therefore sets the scene for future investigations in patient-derived orthotopic tumor models in vivo, and ultimately in the clinical setting. Such studies will be essential to assess the value of our findings as translatable metabolic biomarkers of response to therapy.
As mentioned, previous studies in our lab found that genetically engineered IDH1mut cells that differ from IDH1wt cells only in their IDH1 status, have a unique 1H-MRS-detectable metabolic signature distinguished by an increase in steady-state 2-HG, and a decrease in glutamate, PC, and lactate [39] in agreement with other cell studies [42, 59, 60]. In vivo studies comparing mutant IDH glioma biopsies to wild-type IDH GBM biopsies also showed lower glutamate levels, in spite of the vastly disparate genetic landscape of these tumor types, but trends in other metabolites were more complex [40]. Additionally, studies have also shown that glutamate levels are lower in mutant IDH tumors compared to normal brain [61]. When assessing the effect of mutant IDH inhibitors in our cells, we observed that IDH1mut inhibition led to the expected decrease in steady-state 2-HG, in line with prior in vitro, in vivo, and ex vivo studies with AG-120 and AG-881 [9-11, 48, 49, 55, 62-64]. Furthermore, and consistent with our hypothesis that the IDH1mut biomarkers would be reversed with treatment, we also observed a significant increase in steady-state glutamate in both NHAIDH1mut and U87IDH1mut cells. However, counter to our hypothesis, there was no change in lactate in either cell line and there was only a trend to an increase in PC when considering both cell lines and both inhibitors. Taken together, our data thus shows that IDH1mut inhibition leads to a modulation of some, but not all, of the metabolites previously shown to be affected by the IDH1 mutation. This indicates that not all the molecular events downstream of 2-HG are reversed by its treatment-induced reduction and suggests that IDH1mut inhibition induces a distinct 1H-MRS-detectable metabolic profile. Further studies are needed to fully understand the mechanistic underpinnings of these metabolic alterations and investigate any potential correlations between 2-HG and the other MR-detectable changes.
In the clinical setting, several groups have used 1H-MRS to detect 2-HG, glutamate, lactate, and choline-containing metabolites (tCho, which includes choline, PC, and glycerophosphocholine) [27-34, 40, 65]. Indeed, 1H-MRS is currently incorporated into ongoing clinical trials using IDH1mut inhibitors [57] and, importantly, the 1H-MRS detectable metabolic changes observed in the clinic are consistent with our observations [57]. Most notably, a significant drop in 2-HG, and a trend to an inverse correlation between the changes in 2-HG and the changes in the composite glutamate plus glutamine peak (Glx), were observed following treatment with the mutant IDH1 inhibitor IDH305 [57].
It should be noted that quantifying 2-HG requires the use of specifically optimized MRS sequences due its proximity to glutamine and glutamate [27-34]. Similarly, glutamate is reliably quantified at 7 Tesla, but at lower clinical fields strengths (1.5 and 3 Tesla) it resonates close to, and is typically measured together with, glutamine as Glx, or quantified through the use of a dedicated optimized sequence [57, 61, 66]. Thus, care should be taken in acquiring and interpreting the clinical data. Nonetheless, in our study, no changes in intracellular steady-state glutamine levels were detected, suggesting that monitoring Glx at a lower magnetic field could offer an indirect reading of changes in glutamate levels and confirm the effects of treatment.
Another metabolic change reported in the clinical study [57] was a trend to a small 9% increase in lactate. Our data in cells did not identify a significant change in lactate levels. However, it is important to note that our data reflects intracellular lactate levels only, whereas the in vivo patient data captures both the intra- and extracellular compartments. Thus, the trend towards a small increase in lactate in patients could be indicative of changes in extracellular lactate accumulation.
Similarly, the discrepancy between our cellular PC data, which trended to an increase, and the early clinical observation that tCho (choline, PC, and glycerophosphocholine) is not significantly altered in treated patients, is likely reflective of the complexity of factors that modulate tCho levels, especially in the in vivo clinical setting. On one hand, an increase in intracellular tCho levels can be due to oncogenic mutations, or as shown in this study, response to mutant IDH inhibitors [67-69]. On the other hand, tCho levels are associated with tumor cellularity and will therefore drop when cell numbers drop in response to treatment [67, 70]. The clinical study by Andronesi et al. showed that treatment with a mutant IDH inhibitor led to an increase in diffusion, indicating a decrease in cellular density [57]. Since the in vivo tCho signal reflects both cell density and intracellular metabolite levels, any potential increase in intracellular PC levels might therefore not be detectable because of the overall reduction in cell number. This highlights the likely limitation of PC and tCho as in vivo biomarkers for monitoring response to mutant IDH inhibitors.
A complementary method to 1H-MRS, which probes steady-state metabolite levels, is hyperpolarized 13C-MRS, which provides a tool to monitor metabolic fluxes in real-time. Hyperpolarized 13C-MRS requires both additional expertise and equipment that is currently only available in large research and medical centers. Nonetheless, over the past decade, several hyperpolarized 13C agents have been developed and applied to the imaging of normal and diseased cells, animal models and patients in vivo [18-20, 35, 47, 71-73]. Most notably, hyperpolarized [1-13C] pyruvate and [2-13C] pyruvate are currently in clinical trials for glioma patients [20, 74]. Additionally, multiple earlier studies with different chemotherapeutic agents and targeted therapies have used hyperpolarized [1-13C] pyruvate in animal models as well as in prostate cancer patients and have shown that a drop in its flux to lactate is associated with response to therapy [19, 75-79]. However, as shown in this study, the utility of pyruvate to assess response to mutant IDH1 inhibitors is likely to be limited (Figure S2).
Since our 13C-MRS studies showed a significant increase in glutamine flux to glutamate following mutant IDH1 inhibition, we considered using hyperpolarized glutamine to probe this pathway. Studies using hyperpolarized [5-13C] glutamine have been described in multiple tumor models [80-82]. However, for our purposes, [5-13C] glutamine would likely be inadequate due to peak overlap for the C5 of glutamate and the C5 of 2-HG [83]. Furthermore, work with hyperpolarized glutamine also presents a challenge due to the short T1 of the substrate (~8 s at 3T) and the rapid degradation of glutamine to glutamate [15], which would disrupt our ability to clearly quantify its metabolism to glutamate. A recent study described using hyperpolarized [1-13C] glutamine to probe 2-HG production in IDH1mut chondrosarcoma cells [83] and this approach could be considered. However, we chose to use hyperpolarized [1-13C] α-KG to probe our metabolic alterations because our group has previously shown its utility in IDH1mut tumors [35, 47] and it is being considered for clinical studies (Dan Vigneron, UCSF, personal communication).
Quantification of 2-HG production from hyperpolarized [1-13C] α-KG in vivo can be challenging due to the close resonance of the [1-13C] 2-HG and [5-13C] α-KG peaks. Nevertheless, studies in our lab using a 3T scanner, and thus a relatively long polarization for the 13C-labeled carbonyl, have demonstrated in vivo imaging of both [1-13C] 2-HG and [1-13C] glutamate production from hyperpolarized [1-13C] α-KG to distinguish IDH1mut tumors from IDH1wt in an orthotopic glioma rat model [35, 47]. These studies used optimized sequences which maximized product signal and minimized substrate signal, allowing for detection of [1-13C] 2-HG via analysis of a bimodal temporal evolution of the overlapping peak [35]. Further improvements could potentially be achieved by acquiring data at a single time point when the product 2-HG signal is expected to be maximal while the substrate hyperpolarized [5-13C]-α-KG would have decayed significantly.
Our study shows that hyperpolarized α-KG can be used to monitor IDH1mut inhibition by probing both the drop in 2-HG production and the increase in glutamate (Figure 4 and 5). The presence of these two hyperpolarized biomarkers, rather than only one, potentially allows for a more robust method of analysis. With one metabolite upregulated following treatment and the other downregulated, each biomarker confirms the validity of the other and reduces potential analytical bias. Such findings, combined with a 1H-MRS-detected increase in glutamate or Glx, would thus further strengthen the observation of a drop in 2-HG. These observations could also potentially address the challenges previously reported in AML where suppression of 2-HG alone was not sufficient to predict response to therapy [84], and potentially help in those cases when 2-HG levels are below detection, or in the small subset of IDH1mut glioma patients that lose the IDH1wt or IDH1mut allele resulting in loss of 2-HG production [85].
Further studies are required to confirm the application of our methods in vivo in animal models and most importantly in the clinical setting. Nonetheless, collectively, our MRS detectable metabolic changes could provide a set of complementary biomarkers to help assess the delivery and drug action of mutant IDH1 inhibitors, possibly predicting response to treatment.
Conclusion
In summary, this study confirms the utility of 1H-MRS and identifies potential complementary hyperpolarized 13C-MRS biomarkers for assessing response to IDH1mut inhibition. Our observation that IDH1mut inhibition is associated with a unique MRS-detectable metabolic signature identifies a translational imaging approach that could be exploited for early non-invasive monitoring of response to IDH1mut inhibitor therapies in glioma patients.
Abbreviations
2-HG: 2-hydroxyglutarate; α-KG: alpha-ketoglutarate; AML: acute myeloid leukemia; AST: aspartate transaminase; BCAT1: branched chain aminotransferase 1; CT: computerized axial tomography; dDNP: dissolution dynamic nuclear polarization; GBM: glioblastoma; GDH: glutamate dehydrogenase; HIF: hypoxia-inducible factor; IDH: isocitrate dehydrogenase; IDH1mut: mutant isocitrate dehydrogenase 1; IDH1wt: wild-type isocitrate dehydrogenase 1; LGG: low-grade glioma; MRI: magnetic resonance imaging; MRS: magnetic resonance spectroscopy; NHA: normal human astrocyte; PDH: pyruvate dehydrogenase; PC: phosphocholine; WHO: world health organization.
Supplementary Material
Supplementary figures and tables.
Acknowledgements
This work was supported by NIH R01CA172845, NIH R01CA1972254, UCSF Brain Tumor Center Loglio Collective, UCSF NICO project, ABTA BRF1700006 and center grant P41EB013598.
Author Contributions
A.M. and C.N. designed, performed and analyzed the experiments and wrote the paper. A.L., E.S., G.B., and A.M.G helped to perform experiments and reviewed the paper. P.V., M.R., and R.O.P. helped design experiments and reviewed the manuscript. S.M.R. conceived the study, designed the experiments and wrote the paper.
Competing Interests
The authors have declared that no competing interest exists.
References
1. Ostrom QT, Cioffi G, Gittleman H, Patil N, Waite K, Kruchko C. et al. CBTRUS statistical report: primary brain and other central nervous system tumors diagnosed in the United States in 2012-2016. Neuro Oncol. 2019;21:v1-v100
2. Huse JT, Phillips HS, Brennan CW. Molecular subclassification of diffuse gliomas: seeing order in the chaos. Glia. 2011;59:1190-1199
3. Louis DN, Perry A, Reifenberger G, von Deimling A, Figarella-Branger D, Cavenee WK. et al. The 2016 world health organization classification of tumors of the central nervous system: a summary. Acta Neuropathol. 2016;131:803-820
4. Wen PY, Kesari S. Malignant gliomas in adults. N Engl J Med. 2008;359:492-507
5. Claus EB, Walsh KM, Wiencke JK, Molinaro AM, Wiemels JL, Schildkraut JM. et al. Survival and low-grade glioma: the emergence of genetic information. Neurosurg Focus. 2015;38:E6
6. Dang L, White DW, Gross S, Bennett BD, Bittinger MA, Driggers EM. et al. Cancer-associated IDH1 mutations produce 2-hydroxyglutarate. Nature. 2010;465:966
7. Yang H, Ye D, Guan KL, Xiong Y. IDH1 and IDH2 mutations in tumorigenesis: mechanistic insights and clinical perspectives. Clin Cancer Res. 2012;18:5562-5571
8. Turcan S, Rohle D, Goenka A, Walsh LA, Fang F, Yilmaz E. et al. IDH1 mutation is sufficient to establish the glioma hypermethylator phenotype. Nature. 2012;483:479-483
9. Karpel-Massler G, Nguyen TTT, Shang E, Siegelin MD. Novel IDH1-targeted glioma therapies. CNS drugs. 2019;33:1155-1166
10. Fujii T, Khawaja MR, DiNardo CD, Atkins JT, Janku F. Targeting isocitrate dehydrogenase (IDH) in cancer. Discov Med. 2016;21:373-380
11. Golub D, Iyengar N, Dogra S, Wong T, Bready D, Tang K. et al. Mutant isocitrate dehydrogenase inhibitors as targeted cancer therapeutics. Front Oncol. 2019;9:417
12. Batsios G, Viswanath P, Subramani E, Najac C, Gillespie AM, Santos RD. et al. PI3K/mTOR inhibition of IDH1 mutant glioma leads to reduced 2HG production that is associated with increased survival. Sci Rep. 2019;9:10521
13. Wallin JJ, Edgar KA, Guan J, Berry M, Prior WW, Lee L. et al. GDC-0980 is a novel class I PI3K/mTOR kinase inhibitor with robust activity in cancer models driven by the PI3K pathway. Mol Cancer Ther. 2011;10:2426-2436
14. Chaumeil MM, Lupo JM, Ronen SM. Magnetic resonance (MR) metabolic imaging in glioma. Brain Pathol. 2015;25:769-780
15. Najac C, Ronen SM. MR molecular imaging of brain cancer metabolism using hyperpolarized 13C magnetic resonance spectroscopy. Top Magn Reson Imaging. 2016;25:187-196
16. Viswanath P, Chaumeil MM, Ronen SM. Molecular imaging of metabolic reprograming in mutant IDH cells. Front Oncol. 2016;6:60
17. Ardenkjaer-Larsen JH, Fridlund B, Gram A, Hansson G, Hansson L, Lerche MH. et al. Increase in signal-to-noise ratio of > 10,000 times in liquid-state NMR. Proc Natl Acad Sci U S A. 2003;100:10158-10163
18. Nelson SJ, Kurhanewicz J, Vigneron DB, Larson PE, Harzstark AL, Ferrone M. et al. Metabolic imaging of patients with prostate cancer using hyperpolarized [1-(1)(3)C]pyruvate. Sci Transl Med. 2013;5:198ra08
19. Kurhanewicz J, Vigneron DB, Ardenkjaer-Larsen JH, Bankson JA, Brindle K, Cunningham CH. et al. Hyperpolarized (13)C MRI: path to clinical translation in oncology. Neoplasia. 2019;21:1-16
20. Park I, Larson PEZ, Gordon JW, Carvajal L, Chen HY, Bok R. et al. Development of methods and feasibility of using hyperpolarized carbon-13 imaging data for evaluating brain metabolism in patient studies. Magn Reson Med. 2018;80:864-873
21. Elkhaled A, Jalbert L, Constantin A, Yoshihara HA, Phillips JJ, Molinaro AM. et al. Characterization of metabolites in infiltrating gliomas using ex vivo (1)H high-resolution magic angle spinning spectroscopy. NMR Biomed. 2014;27:578-593
22. Gillies RJ, Morse DL. In vivo magnetic resonance spectroscopy in cancer. Annu Rev Biomed Eng. 2005;7:287-326
23. Horska A, Barker PB. Imaging of brain tumors: MR spectroscopy and metabolic imaging. Neuroimaging Clin N Am. 2010;20:293-310
24. Li Y, Park I, Nelson SJ. Imaging tumor metabolism using in vivo magnetic resonance spectroscopy. Cancer J. 2015;21:123-128
25. Van der Graaf M. In vivo magnetic resonance spectroscopy: basic methodology and clinical applications. Eur Biophys J. 2010;39:527-540
26. Oz G, Alger JR, Barker PB, Bartha R, Bizzi A, Boesch C. et al. Clinical proton MR spectroscopy in central nervous system disorders. Radiology. 2014;270:658-679
27. Andronesi OC, Kim GS, Gerstner E, Batchelor T, Tzika AA, Fantin VR. et al. Detection of 2-hydroxyglutarate in IDH-mutated glioma patients by in vivo spectral-editing and 2D correlation magnetic resonance spectroscopy. Sci Transl Med. 2012;4:116ra4
28. Choi C, Ganji SK, DeBerardinis RJ, Hatanpaa KJ, Rakheja D, Kovacs Z. et al. 2-hydroxyglutarate detection by magnetic resonance spectroscopy in IDH-mutated patients with gliomas. Nat Med. 2012;18:624-629
29. Elkhaled A, Jalbert LE, Phillips JJ, Yoshihara HA, Parvataneni R, Srinivasan R. et al. Magnetic resonance of 2-hydroxyglutarate in IDH1-mutated low-grade gliomas. Sci Transl Med. 2012;4:116ra5
30. Emir UE, Larkin SJ, de Pennington N, Voets N, Plaha P, Stacey R. et al. Noninvasive quantification of 2-hydroxyglutarate in human gliomas with IDH1 and IDH2 mutations. Cancer Res. 2016;76:43-49
31. Kalinina J, Carroll A, Wang L, Yu Q, Mancheno DE, Wu S. et al. Detection of oncometabolite 2-hydroxyglutarate by magnetic resonance analysis as a biomarker of IDH1/2 mutations in glioma. J Mol Med (Berl). 2012;90:1161-1171
32. Pope WB, Prins RM, Albert Thomas M, Nagarajan R, Yen KE, Bittinger MA. et al. Non-invasive detection of 2-hydroxyglutarate and other metabolites in IDH1 mutant glioma patients using magnetic resonance spectroscopy. J Neurooncol. 2012;107:197-205
33. Branzoli F, Di Stefano AL, Capelle L, Ottolenghi C, Valabregue R, Deelchand DK. et al. Highly specific determination of IDH status using edited in vivo magnetic resonance spectroscopy. Neuro Oncol. 2018;20:907-916
34. Shen X, Voets NL, Larkin SJ, de Pennington N, Plaha P, Stacey R. et al. A Noninvasive comparison study between human gliomas with IDH1 and IDH2 mutations by MR spectroscopy. Metabolites. 2019;9(2):35
35. Chaumeil MM, Larson PE, Yoshihara HA, Danforth OM, Vigneron DB, Nelson SJ. et al. Non-invasive in vivo assessment of IDH1 mutational status in glioma. Nat Commun. 2013;4:2429
36. Esmaeili M, Hamans BC, Navis AC, van Horssen R, Bathen TF, Gribbestad IS. et al. IDH1 R132H mutation generates a distinct phospholipid metabolite profile in glioma. Cancer Res. 2014;74:4898-907
37. Izquierdo-Garcia JL, Cai LM, Chaumeil MM, Eriksson P, Robinson AE, Pieper RO. et al. Glioma cells with the IDH1 mutation modulate metabolic fractional flux through pyruvate carboxylase. PLoS One. 2014;9:e108289
38. Izquierdo-Garcia JL, Viswanath P, Eriksson P, Cai L, Radoul M, Chaumeil MM. et al. IDH1 mutation induces reprogramming of pyruvate metabolism. Cancer Res. 2015;75:2999-3009
39. Izquierdo-Garcia JL, Viswanath P, Eriksson P, Chaumeil MM, Pieper RO, Phillips JJ. et al. Metabolic reprogramming in mutant IDH1 glioma cells. PLoS One. 2015;10:e0118781
40. Jalbert LE, Elkhaled A, Phillips JJ, Neill E, Williams A, Crane JC. et al. Metabolic profiling of IDH mutation and malignant progression in infiltrating glioma. Sci Rep. 2017;7:44792
41. Mayers JR, Vander Heiden MG. BCAT1 defines gliomas by IDH status. Nat Med. 2013;19:816-817
42. Reitman ZJ, Jin G, Karoly ED, Spasojevic I, Yang J, Kinzler KW. et al. Profiling the effects of isocitrate dehydrogenase 1 and 2 mutations on the cellular metabolome. Proc Natl Acad Sci USA. 2011;108:3270-3275
43. Viswanath P, Najac C, Izquierdo-Garcia JL, Pankov A, Hong C, Eriksson P. et al. Mutant IDH1 expression is associated with down-regulation of monocarboxylate transporters. Oncotarget. 2016;7:34942-34955
44. Chesnelong C, Chaumeil MM, Blough MD, Al-Najjar M, Stechishin OD, Chan JA. et al. Lactate dehydrogenase A silencing in IDH mutant gliomas. Neuro Oncol. 2014;16:686-695
45. Viswanath P, Radoul M, Izquierdo-Garcia JL, Luchman HA, Gregory Cairncross J, Pieper RO. et al. Mutant IDH1 gliomas downregulate phosphocholine and phosphoethanolamine synthesis in a 2-hydroxyglutarate-dependent manner. Cancer Metab. 2018;6:3
46. Viswanath P, Radoul M, Izquierdo-Garcia JL, Ong WQ, Luchman HA, Cairncross JG. et al. 2-hydroxyglutarate-mediated autophagy of the endoplasmic reticulum leads to an unusual downregulation of phospholipid biosynthesis in mutant IDH1 gliomas. Cancer Res. 2018;78:2290-2304
47. Chaumeil MM, Larson PE, Woods SM, Cai L, Eriksson P, Robinson AE. et al. Hyperpolarized [1-13C] glutamate: a metabolic imaging biomarker of IDH1 mutational status in glioma. Cancer Res. 2014;74:4247-4257
48. Popovici-Muller J, Lemieux RM, Artin E, Saunders JO, Salituro FG, Travins J. et al. Discovery of AG-120 (Ivosidenib): A first-in-class mutant IDH1 inhibitor for the treatment of IDH1 mutant cancers. ACS Med Chem Lett. 2018;9:300-305
49. Konteatis Z, Artin E, Nicolay B, Straley K, Padyana AK, Jin L. et al. Vorasidenib (AG-881): A first-in-class, brain-penetrant dual inhibitor of mutant IDH1 and 2 for treatment of glioma. ACS Med Chem Lett. 2020;11:101-107
50. Johannessen TA, Mukherjee J, Viswanath P, Ohba S, Ronen SM, Bjerkvig R. et al. Rapid conversion of mutant IDH1 from driver to passenger in a model of human gliomagenesis. Mol Cancer Res. 2016;14:976-983
51. Rafehi H, Orlowski C, Georgiadis GT, Ververis K, El-Osta A, Karagiannis TC. Clonogenic assay: adherent cells. J Vis Exp. 2011;49:2573
52. Ronen SM, Jackson LE, Beloueche M, Leach MO. Magnetic resonance detects changes in phosphocholine associated with Ras activation and inhibition in NIH 3T3 cells. Br J Cancer. 2001;84:691-696
53. Chaumeil MM, Najac C, Ronen SM. Studies of metabolism using (13)C MRS of hyperpolarized probes. Methods Enzymol. 2015;561:1-71
54. Seth P, Grant A, Tang J, Vinogradov E, Wang X, Lenkinski R. et al. On-target inhibition of tumor fermentative glycolysis as visualized by hyperpolarized pyruvate. Neoplasia. 2011;13:60-71
55. Tap WD, Villalobos VM, Cote GM, Burris H, Janku F, Mir O. et al. Phase I study of the mutant IDH1 inhibitor Ivosidenib: safety and clinical activity in patients with advanced chondrosarcoma. J Clin Oncol. 2020;38:1693-1701
56. Yen K, Konteatis Z, Sui Z, Artin E, Dang L, Straley K. et al. Abstract B126: AG-881, a brain penetrant, potent, pan-mutant IDH (mIDH) inhibitor for use in mIDH solid and hematologic malignancies. Mol Cancer Ther. 2018;17:B126
57. Andronesi OC, Arrillaga-Romany IC, Ly KI, Bogner W, Ratai EM, Reitz K. et al. Pharmacodynamics of mutant-IDH1 inhibitors in glioma patients probed by in vivo 3D MRS imaging of 2-hydroxyglutarate. Nat Commun. 2018;9:1474
58. Sonoda Y, Ozawa T, Hirose Y, Aldape KD, McMahon M, Berger MS. et al. Formation of intracranial tumors by genetically modified human astrocytes defines four pathways critical in the development of human anaplastic astrocytoma. Cancer Res. 2001;61:4956-4960
59. Garrett M, Sperry J, Braas D, Yan W, Le TM, Mottahedeh J. et al. Metabolic characterization of isocitrate dehydrogenase (IDH) mutant and IDH wildtype gliomaspheres uncovers cell type-specific vulnerabilities. Cancer Metab. 2018;6:4
60. Grassian AR, Parker SJ, Davidson SM, Divakaruni AS, Green CR, Zhang X. et al. IDH1 mutations alter citric acid cycle metabolism and increase dependence on oxidative mitochondrial metabolism. Cancer Res. 2014;74:3317-3331
61. Choi C, Ganji S, Hulsey K, Madan A, Kovacs Z, Dimitrov I. et al. A comparative study of short- and long-TE (1)H MRS at 3 T for in vivo detection of 2-hydroxyglutarate in brain tumors. NMR Biomed. 2013;26:1242-1250
62. Mellinghoff IK, Touat M, Maher EA, DeLaFuente M, Cloughesy TF, Holdhoff M. et al. ACTR-46. AG120, a first-in-class mutant IDH1 inhibitor in patients with recurrent or progressive IDH1 mutant glioma: results from the phase 1 glioma expansion cohorts. Neuro Oncol. 2017;19:vi10-vi11
63. Nicolay B, Narayanaswamy R, Aguado E, Nagaraj R, Murtie J, Liu G. et al. EXTH-59. The IDH1 mutant inhibitor AG-120 shows strong inhibition of 2-HG production in an orthotopic IDH1 mutant glioma model in vivo. Neuro Oncol. 2017;19:vi86
64. Sellers K, Sleger T, Ronseaux S, Narayanaswamy R, Hudson C, Roddy T. et al. Abstract 3607: Inhibition of mutant IDH enzymes reduces production of 2-HG but does not restore wild-type IDH activity in vitro or in vivo. Cancer Res. 2019;79:3607
65. Kurhanewicz J, Vigneron DB, Nelson SJ. Three-dimensional magnetic resonance spectroscopic imaging of brain and prostate cancer. Neoplasia. 2000;2:166-189
66. Tkac I, Andersen P, Adriany G, Merkle H, Ugurbil K, Gruetter R. In vivo 1H NMR spectroscopy of the human brain at 7 T. Magn Reson Med. 2001;46:451-456
67. Glunde K, Bhujwalla ZM, Ronen SM. Choline metabolism in malignant transformation. Nat Rev Cancer. 2011;11:835-848
68. Cancer Genome Atlas Research N. Comprehensive genomic characterization defines human glioblastoma genes and core pathways. Nature. 2008;455:1061-1068
69. Choi S, Yu Y, Grimmer MR, Wahl M, Chang SM, Costello JF. Temozolomide-associated hypermutation in gliomas. Neuro Oncol. 2018;20:1300-1309
70. McKnight TR, Smith KJ, Chu PW, Chiu KS, Cloyd CP, Chang SM. et al. Choline metabolism, proliferation, and angiogenesis in nonenhancing grades 2 and 3 astrocytoma. J Magn Reson Imaging. 2011;33:808-816
71. Chung BT, Chen HY, Gordon J, Mammoli D, Sriram R, Autry AW. et al. First hyperpolarized [2-(13)C]pyruvate MR studies of human brain metabolism. J Magn Reson. 2019;309:106617
72. Hundshammer C, Braeuer M, Muller CA, Hansen AE, Schillmaier M, Duwel S. et al. Simultaneous characterization of tumor cellularity and the Warburg effect with PET, MRI and hyperpolarized (13)C-MRSI. Theranostics. 2018;8:4765-4780
73. Sriram R, Nguyen J, Santos JD, Nguyen L, Sun J, Vigneron S. et al. Molecular detection of inflammation in cell models using hyperpolarized (13)C-pyruvate. Theranostics. 2018;8:3400-3407
74. Miloushev VZ, Granlund KL, Boltyanskiy R, Lyashchenko SK, DeAngelis LM, Mellinghoff IK. et al. Metabolic imaging of the human brain with hyperpolarized (13)C pyruvate demonstrates (13)C lactate production in brain tumor patients. Cancer Res. 2018;78:3755-3760
75. Radoul M, Najac C, Viswanath P, Mukherjee J, Kelly M, Gillespie AM. et al. HDAC inhibition in glioblastoma monitored by hyperpolarized (13) C MRSI. NMR Biomed. 2019;32:e4044
76. Park I, Bok R, Ozawa T, Phillips JJ, James CD, Vigneron DB. et al. Detection of early response to temozolomide treatment in brain tumors using hyperpolarized 13C MR metabolic imaging. J Magn Reson Imaging. 2011;33:1284-1290
77. Park I, Mukherjee J, Ito M, Chaumeil MM, Jalbert LE, Gaensler K. et al. Changes in pyruvate metabolism detected by magnetic resonance imaging are linked to DNA damage and serve as a sensor of temozolomide response in glioblastoma cells. Cancer Res. 2014;74:7115-7124
78. Day SE, Kettunen MI, Cherukuri MK, Mitchell JB, Lizak MJ, Morris HD. et al. Detecting response of rat C6 glioma tumors to radiotherapy using hyperpolarized [1- 13C]pyruvate and 13C magnetic resonance spectroscopic imaging. Magn Reson Med. 2011;65:557-563
79. Aggarwal R, Vigneron DB, Kurhanewicz J. Hyperpolarized 1-[(13)C]-pyruvate magnetic resonance imaging detects an early metabolic response to androgen ablation therapy in prostate cancer. Eur Urol. 2017;72:1028-1029
80. Cabella C, Karlsson M, Canape C, Catanzaro G, Colombo Serra S, Miragoli L. et al. In vivo and in vitro liver cancer metabolism observed with hyperpolarized [5-(13)C]glutamine. J Magn Reson. 2013;232:45-52
81. Canape C, Catanzaro G, Terreno E, Karlsson M, Lerche MH, Jensen PR. Probing treatment response of glutaminolytic prostate cancer cells to natural drugs with hyperpolarized [5-(13) C]glutamine. Magn Reson Med. 2015;73:2296-2305
82. Gallagher FA, Kettunen MI, Day SE, Lerche M, Brindle KM. 13C MR spectroscopy measurements of glutaminase activity in human hepatocellular carcinoma cells using hyperpolarized 13C-labeled glutamine. Magn Reson Med. 2008;60:253-257
83. Salamanca-Cardona L, Shah H, Poot AJ, Correa FM, Di Gialleonardo V, Lui H. et al. In vivo imaging of glutamine metabolism to the oncometabolite 2-hydroxyglutarate in IDH1/2 mutant tumors. Cell Metab. 2017;26:830-41 e3
84. Amatangelo MD, Quek L, Shih A, Stein EM, Roshal M, David MD. et al. Enasidenib induces acute myeloid leukemia cell differentiation to promote clinical response. Blood. 2017;130:732-741
85. Mazor T, Chesnelong C, Pankov A, Jalbert LE, Hong C, Hayes J. et al. Clonal expansion and epigenetic reprogramming following deletion or amplification of mutant IDH1. Proc Natl Acad Sci USA. 2017;114:10743-10748
Author contact
![]() Corresponding author: Sabrina M. Ronen, 1700 4th Street, Byers Hall 3rd floor Suite, University of California San Francisco, San Francisco, CA 94143. Email: sabrina.ronenedu Phone: +1 415 514 4839
Corresponding author: Sabrina M. Ronen, 1700 4th Street, Byers Hall 3rd floor Suite, University of California San Francisco, San Francisco, CA 94143. Email: sabrina.ronenedu Phone: +1 415 514 4839
Citation styles
APA
Molloy, A.R., Najac, C., Viswanath, P., Lakhani, A., Subramani, E., Batsios, G., Radoul, M., Gillespie, A.M., Pieper, R.O., Ronen, S.M. (2020). MR-detectable metabolic biomarkers of response to mutant IDH inhibition in low-grade glioma. Theranostics, 10(19), 8757-8770. https://doi.org/10.7150/thno.47317.
ACS
Molloy, A.R.; Najac, C.; Viswanath, P.; Lakhani, A.; Subramani, E.; Batsios, G.; Radoul, M.; Gillespie, A.M.; Pieper, R.O.; Ronen, S.M. MR-detectable metabolic biomarkers of response to mutant IDH inhibition in low-grade glioma. Theranostics 2020, 10 (19), 8757-8770. DOI: 10.7150/thno.47317.
NLM
Molloy AR, Najac C, Viswanath P, Lakhani A, Subramani E, Batsios G, Radoul M, Gillespie AM, Pieper RO, Ronen SM. MR-detectable metabolic biomarkers of response to mutant IDH inhibition in low-grade glioma. Theranostics 2020; 10(19):8757-8770. doi:10.7150/thno.47317. https://www.thno.org/v10p8757.htm
CSE
Molloy AR, Najac C, Viswanath P, Lakhani A, Subramani E, Batsios G, Radoul M, Gillespie AM, Pieper RO, Ronen SM. 2020. MR-detectable metabolic biomarkers of response to mutant IDH inhibition in low-grade glioma. Theranostics. 10(19):8757-8770.
This is an open access article distributed under the terms of the Creative Commons Attribution License (https://creativecommons.org/licenses/by/4.0/). See http://ivyspring.com/terms for full terms and conditions.