Theranostics
13.3
Impact Factor
 Global reach, higher impact
Theranostics 2021; 11(4):1780-1794. doi:10.7150/thno.51931 This issue Cite
Research Paper
Functional roles of antisense enhancer RNA for promoting prostate cancer progression
Chun-Wu Pan1 ![]() *, Simeng Wen2*, Lei Chen1, Yulei Wei3, Yuanjie Niu2, Yu Zhao4
*, Simeng Wen2*, Lei Chen1, Yulei Wei3, Yuanjie Niu2, Yu Zhao4 ![]()
1. Department of Urology, Renji Hospital, School of Medicine, Shanghai Jiao Tong University, Shanghai, 200127, China.
2. Department of Urology, The Second Hospital of Tianjin Medical University, Tianjin Medical University, Tianjin, 300211, China.
3. Department of Gynecology and Obstetrics, Tianjin First Central Hospital, Tianjin, 300192, China.
4. Department of Biochemistry and Molecular Biology, Mayo Clinic College of Medicine, Rochester, MN 55905, USA.
*These authors contributed equally to this work.
Received 2020-8-13; Accepted 2020-11-6; Published 2021-1-1
Citation:
Pan CW, Wen S, Chen L, Wei Y, Niu Y, Zhao Y. Functional roles of antisense enhancer RNA for promoting prostate cancer progression. Theranostics 2021; 11(4):1780-1794. doi:10.7150/thno.51931. https://www.thno.org/v11p1780.htm
Other stylesAbstract

Rationale: Enhancer RNA (eRNA) bi-directionally expresses from enhancer region and sense eRNA regulates adjacent mRNA in cis and in trans. However, it has remained unclear whether antisense eRNAs in different direction are functional or merely a reflection of enhancer activation.
Methods: Strand-specific, ribosome-minus RNA sequencing (RNA-seq) were performed in AR positive prostate cancer cells. RNA-seq, GRO-seq, ChIP-seq, 4C-seq and DNA-methylation-seq that published in our and other labs were re-analyzed to define bi-directional enhancer RNA and DNA methylation regions. Molecular mechanisms were demonstrated by 3C, ChIP, ChIRP, CLIP, RT-PCR and western blot assays. The biological functions of antisense-eRNA were assessed using mice xenograft model and RT-PCR analysis in human tissues.
Results: In this study, we identified that antisense eRNA was regulated by androgen receptor (AR) activity in prostate cancer cells. Antisense eRNA negatively regulated antisense ncRNA in AR-related target genes' loci, through recruiting DNMT1 on the antisense enhancer in the gene-ending regions and elevating DNA methylation. Importantly, the chromatin exhibited a double looping manner that facilitated sense-eRNA to promoter and antisense-eRNA to gene-ending region in cis. Depletion of antisense eRNA impaired its neighbor mRNA expression, cancer growth and invasion. The expressions of antisense eRNA were correlated with biochemical recurrence and clinical marker PSA's levels in patients' tissues.
Conclusions: The findings indicated that antisense eRNA was a functional RNA and may be a novel target that when suppressed improved prostate cancer therapy and diagnosis. New chromatin interaction among enhancer, promoter and gene-ending region might provide new insight into the spatiotemporal mechanism of the gene transcription and acting of bi-directional eRNAs.
Keywords: Antisense eRNA, Enhancer RNA, Antisense RNA, Looping, DNA methylation
Introduction
Cells respond to changes in their environment through changes in tissue specific gene expression during development or in pathological changes [1, 2]. Hormones, growth factors and neurotransmitters trigger programs of new gene expression temporally and spatially controlled by trans-acting transcription factors that binds to cis-acting DNA regulatory elements including promoters and enhancers [2, 3]. Bidirectional non-coding RNAs (ncRNAs) are transcribed on enhancers, and are referred to as enhancer RNAs (eRNAs) [4-7]. The observation is that eRNAs are produced from the enhancer region marked by histone H3 lysine 4 monomethylation (H3K4me1) and lysin 27 acetylation (H3K27ac) [4, 8]. The activity of eRNAs increase the expression of not only neighboring but also intra-chromosomally distant genes, which transfer full enhancer activity to a or some target promoter(s) [6, 9-13]. eRNA was reported to associate with the cohesin complex and facilitated estrogen receptor-α (ERα) induced enhancer and promoter looping [5, 7]. Besides the looping, eRNA also enhance the RNA polymerase (Pol)-II elongation through removing the NELF and activating p-TEFb complex [14, 15]. Thus, eRNA positively regulates neighboring messenger RNA (mRNA) expression in the same direction. The functional importance of the same-directional eRNA in regulated gene expression is well established. However, it has remained unclear whether antisense eRNAs in different direction are functional or merely a reflection of enhancer activation.
Antisense RNAs are unique DNA transcripts. Some of they are small, noncoding, and diffusible molecules, containing 19-23 nucleotides that complement mRNA [16-20]. These small antisense RNAs included microRNA (miRNA) [21]. Another particular group of ncRNAs are natural antisense transcripts (NATs) [16, 22, 23]. They are widespread in eukaryotes and are transcribed in the opposite direction to protein coding transcripts. The first examples of bidirectional transcripts were detected as early as in the 1980s [24]. These antisense transcripts have been found to originate from independent promoters, shared bidirectional promoters that are situated within genes. According to their orientation, they can be classified as head-to-head, tail-to-tail or internal. Most of bidirectional eRNAs are tail-to-tail manners [4]. The antisense transcripts in gene coding region are complementary to a coding transcript from the opposite strand [16, 25]. And then double-stranded RNA induces the degradation by Dicer system or inhibits splicing and translation [23, 26, 27]. Moreover, nascent antisense transcript ANRIL1 recruits Polycomb repressive complex 2(PRC2) to inhibit transcription of CDKN2A [28]. HOX transcript antisense RNA (HOTAIR) silences the homeoboxD (HOXD) locus in trans- through PRC2 recruitment [29]. However, tail-to-tail bidirectional eRNAs have no complementary sequences and are not complementary to each other. The function of antisense eRNA remains still unestablished.
In this study, we identified sense eRNAs and antisense eRNAs were regulated by androgen receptor (AR) activity in prostate cancer cells. Antisense eRNA downregulated antisense ncRNA in PSA, KLK2, FKBP5 and TMPRSS2 loci, through recruiting DNMT1 on the antisense enhancer and enlarging DNA methylation in the gene-ending regions. Importantly, the chromatin exhibited a double looping manner that facilitated sense eRNA to promoter and antisense eRNA to gene-ending region in cis. Collectively, the findings in this study suggest that antisense eRNA was a functional RNA and may be novel target for cancer therapy and diagnosis. Accordingly, we reported a new interaction that enhancer, promoter and gene-ending region exhibited a spatiotemporally conformation acting mechanism through bi-directional eRNAs.
Methods
Cell lines, cell culture and reagents
Prostate cancer LNCaP cell lines were purchased from the American Type Culture Collection (ATCC). Prostate cancer C4-2 cell line was purchased from UroCorpoation. Cells were cultured in RPMI 1640 medium supplemented with 10% charcoal-stripped fetal bovine serum (FBS) or FBS (Invitrogen) (androgen-depleted medium) and 100 µg/ml penicillin-streptomycin-glutamine (Invitrogen) at 37°C with 5% CO2. For androgen stimulation experiments, LNCaP and C4-2 cells were grown in medium supplemented with charcoal-stripped serum for 48 h and then stimulated with 10 nM or 100 nM DHT (Sigma-Aldrich) for 24 h. For androgen receptor (AR) inhibition experiments, cells were grown with 10 µM or 20 µM enzalutamide (ENZ) (Sigma-Aldrich) for 24 h. siRNA control and siRNA for ERG were purchased from Dharmacon.
Plasmids and antibodies
Flag-tagged DNMT1 WT and mutation were generated by cloning the corresponding cDNAs into pcDNA3.1 vector. TMPRSS2-ERG fusion gene (T1-E4) was generated by cloning the corresponding VCaP cDNAs into pcDNA3.1 vector. The cDNA fragments were amplified by Phusion polymerase (NEB) using Phusion High-Fidelity PCR Master Mix. PSA luciferase and ARE luciferase plasmids were described previously [15]. The primers for cloning were shown in Supplementary Table 1. The insert and deletion mutants were constructed using KOD-plus-Mutagenesis Kit (TOYOBO, Japan). Antibodies: AR (Santa Cruz), DNMT1 (Abcam), DNA 5mC (Abcam), Flag (Sigma-Aldrich).
Human prostate cancer specimens and RNA isolation from human tissues
Formalin-fixed paraffin-embedded (FFPE) or fresh hormone-naïve primary prostate cancer and castration resistant prostate cancer (CRPC) tissues were randomly selected from the Tianjin Medical Hospital and Shanghai Renji Hospital. Hormone-naïve patients with biopsy-proven prostate cancer have been treated at Shanghai Renji Hospital by radical retropubic prostatectomy between January 2005 and December 2016 without neoadjuvant therapy. 60 patients with CRPC were recorded the PSA levels every year. These samples with biochemical information were used for biochemical recurrence analysis and correlation analysis of PSA antisense eRNA and mRNA. 72 human single nucleotide polymorphisms (SNP) samples were used for RNA level measurement. The study was approved by the Tianjin Medical Hospital and Shanghai Renji Hospital Institutional Review Board (Ethical approval number: KY2019K036). FFPE tissues were collected and total RNAs were isolated using a RecoverAll Total Nucleic Acid Isolation Kit (Life Technologies). Isolation of RNAs from frozen human prostate cancer tissues was performed as described previously [30].
RNA isolation from cultured cells, reverse transcription PCR (RT-PCR) and real-time PCR
RNA was extracted from tissues and cultured cells using TRIzol reagent (Invitrogen) or the RNeasy Plus Mini Kit (Qiagen) for human tissues according to the manufacturer's instructions. First-strand cDNA was synthesized with the PrimeScript Reverse Transcriptase Kit (Invitrogen). Reverse transcription and real-time PCR were performed as described previously [31]. The PCR primers for genes are listed in Supplementary Table 1.
Biotin-labeled RNA pull-down and western blot analysis
Biotin-labeled RNAs were in vitro transcript using Biotin RNA Labeling Mix (Roche) and T7 polymerase (New England Biolabs). C4-2 cells cultured in androgen-depleted medium were lysed in modified Binding buffer (150 mM NaCl, 50 mM Tris-HCl pH7.5, 1% NP-40, 0.1% SDS and 1% protease inhibitor cocktails). Cell lysates were incubated with biotin-labelled RNAs and streptavidin beads at 4ºC for 12 h. The beads were washed in wash buffer (50 mM Tris, pH 7.4; 150 mM NaCl; 0.05% Nonidet P-40 (NP-40); 1 mM MgCl2) at 4°C six times. The samples were subjected to western blot analyses as described previously [31]. Briefly, protein samples were denatured and subjected to SDS-polyacrylamide gel electrophoresis (SDS/PAGE), and were transferred to nitrocellulose membranes (Bio-Rad). The membranes were immunoblotted with specific primary antibodies, horseradish peroxidase-conjugated secondary antibodies, and visualized by SuperSignal West Pico Stable Peroxide Solution (Thermo Fisher).
Chromatin immunoprecipitation (ChIP) and methylated DNA immunoprecipitation (MeDIP)
ChIP was performed following our previous protocol as described [15, 32]. MeDIP was performed following previous protocol as described [33]. The qPCR analysis was performed using the primers listed in Supplementary Table 1.
RNA-seq and data analysis
Total RNA was extracted from LNCaP and C4-2 cells cultured in androgen-depleted media for 72 h or ENZ treatment for 48 h. RNAs were harvested using the miRNeasy kit (Qiagen) and RNA quality was assessed using an Agilent Bioanalyzer. High quality (Agilent Bioanalyzer RIN >7.0) total RNAs were employed for the preparation of sequencing libraries using Illumina TruSeq Stranded Total RNA/Ribo-Zero Sample Prep Kit. A total of 500-1,000 ng of riboRNA-depleted total RNA was fragmented by RNase III treatment at 37°C for 15 min and RNase III was inactivated at 65°C for 10 min. Size selection (50 to 150 bp fragments) was performed using the FlashPAGE denaturing PAGE-fractionator (Life Technologies) prior to ethanol precipitation overnight. The resulting RNA was directionally ligated, reverse-transcribed and RNase H treated.
Samples with biological duplicates were sequenced using the Illumina HiSeq2000 platform at the Mayo Genome Core Facility. Pre-analysis quality control was performed using FastQC (http://www.bioinformatics.babraham.ac.uk/projects/fastqc/) and RSeQC software [34] to ensure that raw data are in excellent condition and suitable for downstream analyses. Pair-end raw reads were aligned to the human reference genome (GRch37/hg19) using Tophat [35]. Genome-wide coverage signals were represented in BigWig format to facilitate convenient visualization using the UCSC genome browser. Gene expression was measured using RPKM (Reads Per Kilo-base exon per Million mapped reads) as described previously [36]. Correlation analyses between eRNA and mRNA expression were performed using Python and R scripts. EdgeR [37] was used to identify genes that were differentially expressed between CRPC and primary prostate tumors. Raw and processed data have been analyzed from NCBI Gene Expression Omnibus with accession number GSE55032.
Cross-linking immunoprecipitation (CLIP)
5 × 10⁶ C4-2 cells treated with 100 µM 4-Thiouridine (4SU) for 8 h were washed with cold PBS one time and cells were irradiated once with 150 mJ/cm2 at 365 nm using a Startalinker [38]. Cells were lysed in lysis buffer (50 mM Tris-HCL, pH 7.4, 100 mM NaCl, 1% NP-40, 0.1% SDS, 0.5% sodium deoxycholate, protease inhibitor cooktail and RNase inhibitors) with protease inhibitors (1 mL) and transferred to 1.5 mL microtubes. Lysate was partially digested by 1 U/µL RNaseT1/A for 15 min at 22°C. RNA was immunoprecipitated with DNMT1 or Flag antibodies and protein A/G beads for 16 h at 4°C. After washed for 6 times, RNA was phosphorylated by T4 PNK and ligated RNA between 3' and 5' ends by RNA T4 ligase. SDS-PAGE loading buffer was added and the mixture was incubated at 70°C for 10 min. After running the SDS-PAGE gel, the RNA-protein complexes were transferred from gel to a nitrocellulose membrane using a wet transfer apparatus (30 V for 1 h). The membrane with target protein was cut up, and the targeted membrane piece was incubated with Proteinase K for de-crosslink. After de-crosslink, RNA was reverse transcribed into cDNA and subjected to real-time qPCR analysis.
Quantitative real-time Reverse Transcription polymerase chain reaction (qRT-PCR) analysis
Relative RNA levels determined by qRT-PCR were measured on a Bio-Rad CFX96 Real-Time PCR System, using Taqman Mix (Invitrogen) or SYBG Mix (BioRad). Different probes were used to distinguish the sense and antisense RNAs. All primers were obtained from Rebio Pharmaceuticals (Guangzhou, China), and gene-specific sequences-probes are listed in Supplementary Table 1. The relative expression of RNAs was calculated using the -ΔΔCt method [15, 39]. GAPDH was used as an internal control for quantification of gene targets.
Locked nucleic acids (LNA)-mediated knockdown
LNAs targeting antisense RNAs were designed and obtained from Rebio Pharmaceuticals (Guangzhou, China). Transfections with LNAs (50 µM) were performed with Lipofectamine RNAiMAX (Thermofisher) or siRNAs were performed with Lipofectamine 2000 (Invitrogen) according to the manufacturer's instructions. RNAs and protein were harvested for analysis 72 h after transfection.
Chromatin isolation by RNA purification (ChIRP)
The ChIRP experiment was performed essentially following the original protocol as described previously [15]. The online Biosearch Technologies' Stellaris FISH Probe Designer was used to design antisense oligo probes tiling PSA and FKBP5 antisense eRNA. The probe oligos were synthesized with a 3'-Biotin-TEG modification and purified by HPLC. The ChIRP probes are shown in Table S1.
Design and screening of antisense oligonucleotides (ASOs)
The ASOs were designed using a full phosphorothioate backbone and a 10-base 2′-deoxynucleoside gap flanked by 2′-O-methyl (cMt)-modified nucleotides. The motif for the ASOs targeting the eRNAs tested was mmm-10-mmm, where m represents cMt modification and -10- represents the 10-base DNA gap. ASOs were synthesized and purified as described previously [40]. A large number of ASOs were screened by BGI Genomics Inc. (Shenzhen, China) for high efficient reduction of RNA.
Mouse xenograft generation and tumor growth measurement
The mouse study was approved by Tianjin Medical University Institutional Animal Care and Use Committee. Six-week- old NSG male mice were injected with 5 × 10⁶ of cancer cells infected with lentivirus or shRNAs and/or expression vectors in 100 μl PBS with 100 μl of Matrigel matrix (BD Bioscience) in right flanks. After the tumor became about 100 mm3, the 100 mg/kg ASOs were injected by intraperitoneal (IP) every week. Tumors were monitored until they reach maximum tumor volumes of 1,000 mm3 and tumor growth was measured with caliper every 3 days.
Western blotting
Prostate cancer cells were harvested and lysed by RIPA buffer on ice, the supernatant was quantified by BCA protein quantification assay (Bio-Rad, USA). Equal amounts of protein sample were added to 4× sample buffer and boiled for 10 min. The sample was subjected to SDS-PAGE analysis and transferred to nitrocellulose membrane. The membrane was blocked by 5% milk for 2 h at room temperature and incubated with primary antibody at 4°C overnight. The second day, the membrane was washed three times with 1 × TBST and incubated with horseradish peroxidase-conjugated secondary antibodies for 1 h at room temperature. The protein bands were visualized by super signal West Pico Stable Peroxide Solution (Thermo Fisher Scientific, USA).
Quantitative chromosome conformation capture (3C) assay
3C assays were performed following our protocol as described previously [15]. Briefly, the cross-linked chromatin was digested with specific restriction enzymes overnight. The crosslinking was reversed and ligated DNA was purified. The qPCR analyses need additionally 3% DMSO in the final buffer. The qPCR analysis was performed using the primers listed in Supplementary Table 1.
MTT assay and colony formation assay
3-(4,5-dimethylthiazol-2-yl)-2,5-diphenyltetrazolium bromide (MTT) was used for MTT assay as previously description [41, 42]. Briefly, 500 cells were plated into each well of 6-well plate. Approximately 14 days later, the colonies were fixed with methanol: acetic acid (7:1) for 30 min in room temperature and stained with (0.5% w/v) trypan blue for 1 h. The colonies with more than 50 cells were counted.
Invasion assay
Cell invasion assay in vitro was performed with Corning matrigel invasion chamber assay according to manufacturer's instructions as previously described [38]. Briefly, cells were diluted to 3 × 10⁴ cells per well in serum-free medium and plated to the inside of matrigel chamber in 24-well plates, outside the chamber was added the medium with 10% FBS. After 24 h, cells were fixed in methanol for 20 min and then stained with 1 mg/ml crystal violet staining for 30 min. The membranes of chamber were covered by coverslip and observed using microscope after 6 times washing. Wells were repeated in triplicate, and the invaded cells were quantified per field of view. Eight fields of three independent replicates were recorded and analyzed.
Statistical analysis
Experiments were carried out with three or more replicates unless otherwise stated. Statistical analyses were performed using ANOVA test and Student t test for most comparisons. P < 0.05 is considered statistically significant. Non-parametric Kolmogorov-Smirnov (KS) test was used to evaluate statistical significance of differential expression between primary prostate cancers.
Results
Antisense eRNA downregulates antisense ncRNA on AR target loci
Notably, RNA polymerase II (RNAPII) at enhancers transcribes bi-directionally the class of eRNAs within enhancer region and eRNAs also express in bi-directional in the enhancer region [4, 7, 8]. To further study the eRNAs expressed profiles, we chose androgen stimulated androgen receptor (AR) and AR-related eRNA as model systems. To further study the different direction of transcripts, we performed strand-specific, ribosome-minus RNA sequencing (RNA-seq) in AR positive prostate cancer cells. In parallel, we used AR, H3K4me1 [3, 43], H3K4me2 [3], H3K4me3 [3] and H3K27ac [44] chromatin immunoprecipitation and sequencing (ChIP-seq) to define the AR related enhancer and promoter region in genome. We totally found 6,001 AR related eRNAs in AR-bound enhancer in C4-2 cells and approximated 30% of eRNAs were bi-directionally observed by strand-specific RNA-seq (Figure S1A and top 600 (FDR<0.001) eRNAs in Table S2). AR related eRNAs can be upregulated by androgen (dihydrotestosterone (DHT)) or impaired by enzalutamide (ENZ) [42, 45-47]. However, it remains unclear whether both directional eRNAs can be regulated by AR activity. A meta-analysis of both global nuclear run-on sequencing (GRO-seq) [8] and our strand-specific RNA-seq indicated that bi-directional PSA eRNAs (sense eRNAs and antisense eRNAs) were upregulated by DHT in GRO-seq data (Figure S1B) and were deterred by ENZ in RNA-seq data (Figure 1A). Furthermore, we found that bi-directional eRNAs simultaneously be regulated by ENZ in FKBP5, KLK2 and TMPRSS2 loci (Figure 1A and Figure S1C). Based on the GRO-seq and RNA-seq in LNCaP cells [8, 15, 48], we observed that antisense ncRNA also expressed in PSA, FKBP5, KLK2 and TMPRSS2 gene coding region (Figure 1A, S1A and S1C) which were more than 10-fold lower than sense transcripts as previous reported [49]. However, the internal control ACTB and GAPDH failed to be regulated by DHT or ENZ in RNA-seq and RT-PCR data (Figure S1D and S1E), which ruled out the possibility that levels of antisense eRNAs and ncRNAs were changed because of different RNA inputs. To confirm these observations, we performed the bi-directional eRNAs, antisense ncRNAs and mRNAs' expressions in C4-2 cells by RT-qPCR. Consistent with GRO-seq and RNA-seq, we found that bi-directional eRNAs and mRNAs were increase with DHT treatment in dose-dependent manner (Figure 1B and S1F). Interestingly, antisense ncRNAs in PSA gene coding region were decrease with DHT treatment in dose-dependent manner (Figure 1B). Consistently, bi-directional eRNAs and mRNAs were downregulated by AR antagonist ENZ and antisense ncRNAs were upregulated by ENZ in dose-dependent manner (Figure 1C and S1F). To further search the antisense eRNA's function, we knocked down PSA antisense eRNA by siRNA mixture pool. The data showed that sense eRNA was no significant change with antisense eRNA knocking down (KD) (Figure 1D). However, PSA mRNA was downregulated and PSA antisense ncRNA was upregulated by antisense eRNA KD (Figure 1D). Sense eRNA mediated the same directional mRNA through affecting enhancer-promoter looping and RNA polymerase II (Pol II) ser2 phosphorylation [14, 15]. Our data showed that PSA antisense eRNA KD had no effect in impairing enhancer-promoter looping and Pol II phosphorylation (Figure S1G). Using specific single-strand locked nucleic acids (LNA) to block antisense ncRNA of PSA indicated that antisense eRNA failed to mediate PSA mRNA without PSA antisense ncRNA expression (Figure S1H). Taken together, these data suggest that PSA antisense eRNA mediated mRNA through inhibiting antisense ncRNA at PSA gene locus.
Figure 1
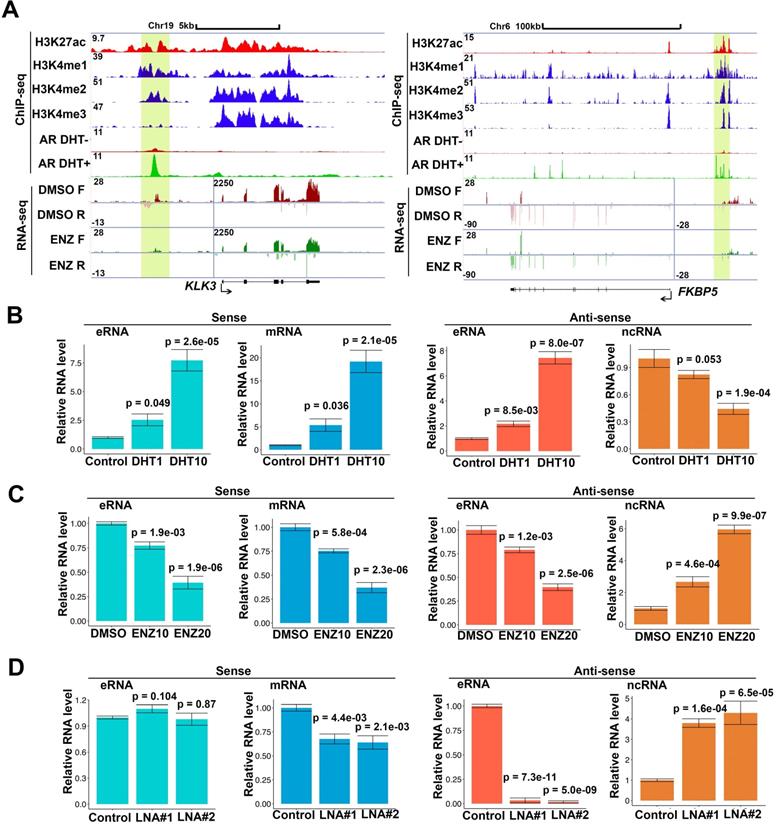
Antisense eRNA is negatively related with antisense mRNA on AR target loci. (A) Screen shots from UCSC genome browser showing signal profiles of eRNA and mRNA expression in LNCaP. ChIP-seq in LNCaP and C4-2 were shown as a reference. PSA (KLK3) was in left panel; FKBP5 was in right panel. The enhancer regions were highlighted in yellow box. (B) Sense eRNA, sense mRNA, antisense eRNA (as-eRNA) and antisense ncRNA expressions of PSA were measured by qRT-PCR in C4-2 cells treated with DHT. Means and standard deviations (error bar) were determined from three replicates. Error bars represented mean ± SD for triplicate experiments. P values were shown in the figures. GAPDH as internal control. (C) Sense eRNA, sense mRNA, antisense eRNA (as-eRNA) and antisense ncRNA expressions of PSA were measured by qRT-PCR in C4-2 cells treated with enzalutamide (ENZ). Means and standard deviations (error bar) were determined from three replicates. Error bars represented mean ± SD for triplicate experiments. P values were shown in the figures. GAPDH as internal control. (D) Sense eRNA, sense mRNA, antisense eRNA (as-eRNA) and antisense ncRNA expressions of PSA were measured by qRT-PCR in C4-2 cells knocked down with antisense eRNA LNAs. Means and standard deviations (error bar) were determined from three replicates. Error bars represented mean ± SD for triplicate experiments. P values were shown in the figures. GAPDH as internal control.
Antisense eRNAs increase DNA methylation in the gene-ending region to block antisense ncRNA transcript
Because PSA antisense eRNA KD had no effect in impairing enhancer-promoter looping and RNA Pol II phosphorylation in the PSA locus, there should be another molecular mechanism that PSA antisense eRNA regulated the antisense ncRNA. To study the new mechanism for antisense ncRNA regulating, we analyzed the methylated DNA immunoprecipitation sequencing (MeDIP-seq) in LNCaP and LNCaP-abl cells [33]. The AR activity is higher in castration resistant LNCaP-abl cell line than hormone-naïve line LNCaP cells. We found that 5-methylcytosine (5 mC) levels were increase in the ending of gene body region of top 100 eRNA-adjacent mRNAs in LNCaP-abl cells compared to LNCaP cells (Figure S2A). It is an interesting phenomenon because high level of 5mC in promoter and enhancer means inhibition of the related neighbor gene [33, 50, 51]. Thus, we hypothesized that the gene-ending region may be the promoter or enhancer region of antisense ncRNA (Figure 2A, yellow box). To test our hypothesis, we searched the enhancer and promoter makers in the gene-ending region through ChIP-seq data. Interestingly we found that there were enhancer makers H3K4me1 in the gene-ending regions of PSA, FKBP5, KLK2 and TMPRSS2 loci, and also androgen-stimulated AR binding in the same loci (Figure 2A and S2B). Importantly, there were significant 5mC peaks overlapped with H3K4me1 and AR peaks in the gene-ending regions of PSA, FKBP5, KLK2 and TMPRSS2 loci (Figure 2A and S2B), suggesting that DNA methylation play a critical role for antisense ncRNA. Next, we confirmed that DNA methylation were downregulated with antisense eRNA KD by LNA in PSA and FKBP5 loci (Figure 2B). Furthermore, ChIRP assay demonstrated that antisense eRNA KD impaired the RNA binding to gene-ending regions of PSA and FKBP5 loci (Figure 2C). It has been reported that DNMT1 interacts with ncRNA to increase 5mC in specific genes' promoters [52, 53]. To verify the interaction between DNMT1 and antisense eRNAs, we performed CLIP assay to demonstrate them for PSA and FKBP5 antisense eRNAs. CLIP assay showed that PSA and FKBP5 antisense eRNAs associated with DNMT1, and KD of PSA and FKBP5 antisense eRNAs decreased the interaction between DNMT1 and antisense eRNAs (Figure 2D). Furthermore, KD of PSA and FKBP5 antisense eRNAs downregulated the DNMT1 binding to gene-ending region of PSA and FKBP5 loci (Figure 2E). These data suggest that antisense eRNAs recruited DNMT1 to gene-ending region of PSA and FKBP5 and increased 5mC levels on PSA and FKBP5 loci.
Antisense eRNAs interacts with DNMT1 through specific secondary structure
DNMT1 binds to ncRNA through its RNA recognized motif (RRM) [54]. To verify whether antisense eRNAs bound to DNMT1 through the same region, we generated the RRM deletion mutant of DNMT1 plasmid. Biotin labeled RNA pull-down assay showed that DNMT1 wild type (WT) was able to interact with PSA and FKBP5 antisense eRNAs, but RRM deletion mutant failed to bind to antisense eRNAs (Figure 3A). These data indicated that DNMT1 bound to antisense eRNAs through the same RRM. To further understand the detailed domain of antisense eRNA being responsible for binding to DNMT1, we predicted the four secondary structures of PSA, FKBP5, KLK2 and TMPRSS2. We found that there was Cytosine (C)-rich stem loop in all these antisense eRNAs (Figure S3A-D and 3B). To test the function of C-rich region, we transcript PSA and FKBP5 WT and C-rich region deleted antisense eRNAs in vitro and transcript/translated Flag-DNMT1 through T7 promoter in vitro. In vitro Flag pull-down assay showed that Flag-DNMT1 bound to PSA and FKBP5 WT antisense eRNAs, but not C-rich domain deleted antisense eRNAs (Figure 3C). Furthermore, to test whether interaction between DNMT1 and antisense eRNA relies on C-rich domain, we overexpressed WT and C-rich-deletion mutant antisense eRNA in C4-2 cells and measured them using primers on plasmids to rule out the endogenous RNA contamination. CLIP assay showed that C-rich domain-deletion antisense eRNAs lose about 90% interaction with DNMT1 compared to antisense eRNAs WT in C4-2 cells (Figure 3D). To measure the effect of C-rich domain on antisense eRNAs and mRNA expression, we overexpressed PSA and FKBP5 antisense eRNAs in C4-2 cells with or without C-rich region-deletion in genome by CRISPR system (Figure S3E). DHT upregulated PSA or FKBP5 mRNA levels in C4-2 cells, but DHT failed to increase mRNAs in C-rich domain deletion cells (Figure 3E). These data indicated that C-rich domain was the key domain for antisense eRNA binding to DNMT1 and antisense eRNA's function.
Two-looping interaction facilities the spatial targeting of antisense eRNAs to gene-ending region
Sense eRNAs mainly mediate adjacent mRNA in cis [5, 6]. The question is how antisense eRNAs recognize and play a role in cis. To solve this question, we analyzed the genome spatial interaction meta-data published previously [55-57]. Circularized chromatin conformation capture (4C)-seq data in AR-positive GM12878 and LNCaP cells showed that the promoters of PSA, FKBP5, KLK2 and TMPRSS2 had potential interacted peaks with the enhancer regions and also with gene-ending regions related to promoters (Figure 4A and S4A). To confirm these chromatin conformation interactions, we completed chromatin conformation capture (3C) assay in C4-2 cells. We found that the digest sites near the enhancer regions and gene-ending regions interaction with promoters were stimulated by DHT in C4-2 cells in PSA, FKBP5, KLK2 and TMPRSS2 loci (Figure 4B, 4C, S4B and S4C). These data indicated that there were two interacted sites near the promoter of these AR target genes. eRNAs play the important role in chromatin interaction [5, 15, 58, 59]. To test the functional roles of sense eRNAs and antisense eRNAs in chromatin interaction, we knocked down them by LNAs in C4-2 cells. We found that KD of sense eRNAs impaired enhancer-promoter interaction and promoter-gene-ending interaction in PSA locus (Figure 4D). However, KD of antisense eRNA did not affect these chromatin interaction (Figure 4D). We concluded that antisense eRNA mediated mRNA through binding to DNMT1, but not chromatin interaction. Promoter-gene-ending interaction increased the specific location of antisense eRNA targeting to gene-ending region.
Figure 2
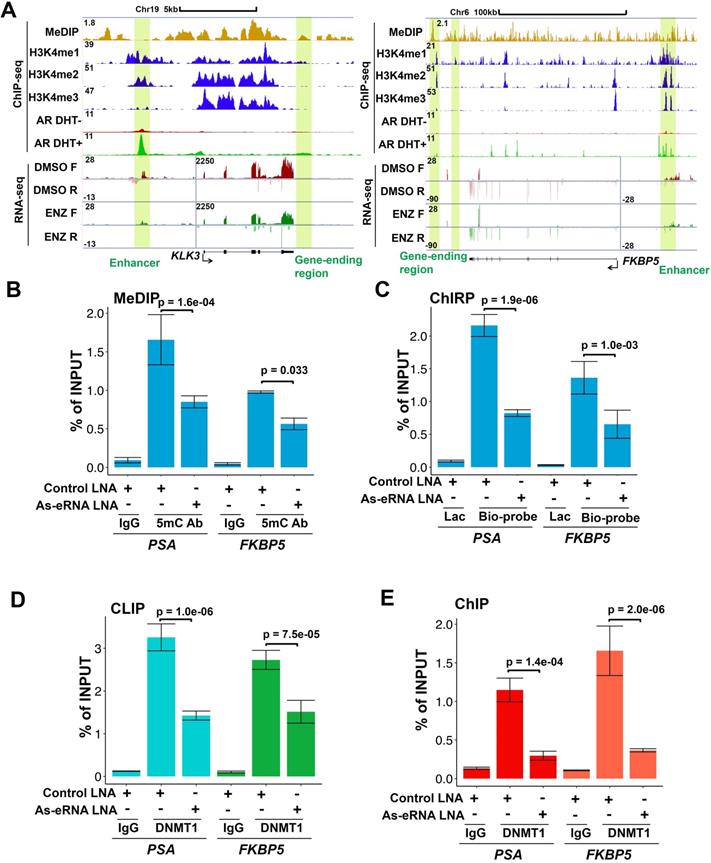
DNA methylation in antisense promoter is critical for expression of antisense ncRNA. (A) Screen shots from UCSC genome browser showing signal profiles of eRNA and mRNA expression in LNCaP and C4-2. MeDIP-seq in Abl cells are shown as a reference. PSA is in left panel; FKBP5 is in right panel. The enhancer regions are highlighted in yellow box. (B) Quantitative PCR verification of MeDIP results on the antisense enhancer (gene-ending region) of KLK3 and FKBP5 with DNA 5mC antibody against the 5mC sites in C4-2 cells. Means and standard deviations (error bar) were determined from three replicates. Error bars represented mean ± SD for triplicate experiments. P values were shown in the figures. (C) ChIRP assay using biotin-labeled LacZ or antisense eRNA (KLK3 or FKBP5)-specific DNA probes and streptavidin beads. Pull-down DNA was analyzed by real-time PCR. All data shown were mean values ± SD (error bar) from three replicates. P values were shown in the figures. (D) CLIP-qPCR analysis of DNMT1 binding at the KLK3 and FKBP5 antisense RNA in C4-2 cells transfected with control or antisense-specific LNAs. Immunoprecipitated RNAs were detected by real-time PCR. All data shown were mean values ± SD (error bar) from three replicates. P values were shown in the figures. (E) ChIP-qPCR analysis of DNMT1 binding at the KLK3 and FKBP5 gene-ending region in C4-2 cells transfected with control or antisense-specific LNAs. Immunoprecipitated DNAs were detected by real-time PCR. All data shown were mean values ± SD (error bar) from three replicates. P values were shown in the figures.
Figure 3
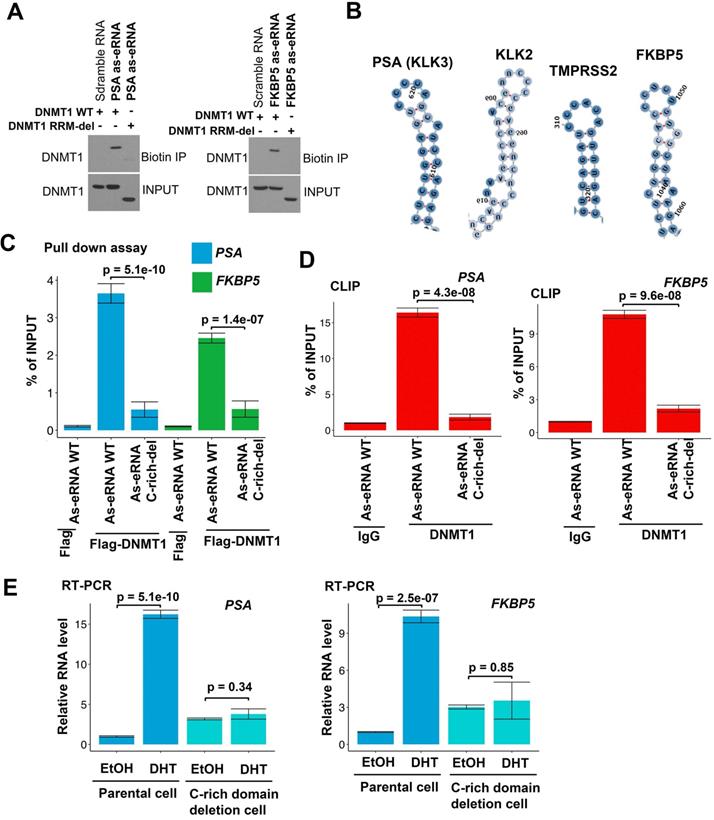
DNMT1 binds to antisense eRNA through secondary structure. (A) Biotin pull‐down assay by incubating biotin‐labeled specific probes targeting PSA and FKBP5 antisense eRNAs (as-eRNAs) with C4-2 cell lysate followed by Western blot with DNMT1 antibodies. (B) Secondary structure of PSA, KLK2, TMPRSS2 and FKBP5 predicted by https://rna.tbi.univie.ac.at. (C) Flag-DNMT1 pull-down antisense eRNA in vitro. Flag-DNMT1 was produced using Quick coupled transcription/translation kit through T7 promoter in vitro. Antisense RNAs was transcribed by T7 polymerase in vitro. The purified proteins were pulled down by Flag antibodies and tested by western blot. (D) CLIP-qPCR analysis of DNMT1 binding at the KLK3 and FKBP5 antisense eRNA (as-eRNAs) in C4-2 cells transfected with WT or mutated antisense eRNAs. Immunoprecipitated RNAs were detected by real-time PCR using primers targeting plasmids to rule out endogenous RNA. All data shown were mean values ± SD (error bar) from three replicates. P values were shown in the figures. (E) The expressions of PSA and FKBP5 are measured by qRT-PCR in C4-2 parental cells and CRISPR-generated antisense eRNA C-rich domain-deletion cells treated with or without DHT. Means and standard deviations (error bar) were determined from three replicates. Error bars represented mean ± SD for triplicate experiments. P values were shown in the figures. GAPDH as internal control.
Antisense eRNAs and antisense-enhancers mediate tumor growth and PSA levels in cells and in tissues
We previously found that sense eRNAs affected adjacent mRNA expression [42] and in this study we found that antisense eRNA regulated mRNA expression. However, what significance of sense eRNA and antisense eRNA for the transcription of mRNA. To further understand which directional eRNA is more important, we knocked down sense eRNA and/or antisense eRNA in C4-2 cells by LNAs. We screened 8 LNAs for PSA antisense eRNA and 9 LNAs for FKBP5 antisense eRNA, and then chose 2 of them for each antisense eRNA (Figure S5A and S5B). The data showed that mono-KD of sense eRNA or antisense eRNA impaired PSA mRNA, and combination KD exhibited more significantly decrease of PSA mRNA by LNAs and ASOs (Figure 5A and 5B). We also observed the similar pattern for FKBP5 mRNA (Figure S5C). In the previous data, we found that ASOs with sense PSA-eRNA blocked approximately 40% growth rates in C4-2 cells [15]. To identify and compare the antisense eRNA effect in prostate cancer cell growth, we measured the cell viability and colony formation in C4-2 cells by antisense PSA eRNA ASOs. The data showed that mono-treatment with ASOs of antisense eRNA downregulated approximated 40% growth rates and 46% colony formation of C4-2 cells (Figure 5C and 5D). Combination treatment with ASOs of sense and antisense PSA eRNAs inhibited more than 70% growth rates of cell viability and colony formation (Figure 5C and 5D). In addition, luciferase assay showed that combination treatment with ASOs of sense and antisense PSA eRNA blocked 30% more than mono-treatment of each ASO (Figure S5D). Furthermore, the invasion is another important part in cancer progression. TMPRSS2-ERG fusion mutation is over 50% in prostate cancer patients and mediates prostate cancer cell metastasis [60, 61]. Thus, we chose the antisense eRNA and mRNA of TMPRSS2 as study model. In the figure 5E and S5E, we found that knocking-down (KD) of antisense eRNA of TMPRSS2 downregulated mRNA levels of TMPRSS2-ERG fusion RNAs and invasion capability of VCaP cell. The invasion-decrease of VCaP cells induced by antisense eRNA KD were rescued by overexpression of TMPRSS2-ERG fusion plasmid (Figure 5E). Thus, we concluded that antisense eRNA controlled prostate cancer cell growth and invasion in vitro.
To further identify the antisense eRNA effect in prostate cancer growth in mice, we treated the mice with ASOs of antisense eRNA by I.P. The results showed that monotherapy with ASOs of antisense eRNA decreased about 30% growth rates of C4-2 cells (Figure 6A). Combination treatment with ASOs of sense and antisense eRNA inhibits more than 60% growth rates of C4-2 xenografts in mice (Figure 6A). Using the cohort in Tianjin Medical University (n=60), we found that high-expressed PSA antisense eRNA exhibited shorter biochemical recurrence than patients with low-expressed PSA antisense eRNA (Figure 6B). The correlation analysis in the same cohort showed that there was a significantly positive correlation between PSA antisense eRNA and mRNA in patients' samples (Figure 6C), suggesting that PSA antisense eRNA was positively correlated with clinical marker PSA's level. These data indicated that antisense eRNAs regulated prostate cancer progression in mice and patients' tissues. To further understand the promoter-gene-ending looping significance in tissues, we collected the human single nucleotide polymorphisms (SNP) samples in gene-ending region. Rs2735839 are about 66% people had G/G nucleotides in two allele in PSA gene-ending region (same SNP in LNCaP and C4-2), and about 33% A/A nucleotides in the same region [62]. It is noticed that patients with AA had more prostate cancer progression and PSA serum levels than CC SNP [62-64]. We found that AA SNP showed less luciferase activity and promoter-ending interaction than CC SNP using luciferase plasmid in C4-2 cells (Figure S6A). It suggests that patients with CC SNP had more promoter-gene-ending interaction than AA patients. Interestingly, we found that PSA mRNA levels were significantly higher in patients with CC SNP than AA SNP, and PSA antisense ncRNA levels were significantly lower in patients with CC SNP than AA SNP (Figure S6B). These data suggest that both antisense eRNA and promoter-gene-ending looping induced mRNA levels and deduced antisense ncRNA levels of the same locus in prostate cancer cells and tissues.
Discussion
In human cells, only approximately 20,000 genes (about 2% of the total DNA) are translated into proteins, and more than 90% of genes are transcribed into ncRNAs in the human genome [65]. Similarly, it is noted that over 98% of RNAs formed in human cells are ncRNAs [66]. eRNAs belongs to ncRNAs and are functional in enhancer-promoter looping and mRNA transcription [5, 15, 54, 58]. The eRNAs usually are the RNAs in enhancer with same direction with mRNAs, however antisense eRNAs with opposite direction with mRNAs are rarely reported. Here, we demonstrated that antisense eRNAs were functional ncRNAs. Firstly, we demonstrated that PSA antisense eRNA mediated mRNA through inhibiting antisense ncRNA at PSA gene locus. Secondly, we found that antisense eRNAs recruited DNMT1 to gene-ending region of PSA, FKBP5, KLK2 and TMPRSS2 and increased 5 mC levels in PSA, FKBP5, KLK2 and TMPRSS2 gene-ending loci. In mechanism, we found that C-rich region is the key domain for antisense eRNA binding to DNMT1 and antisense eRNA's function. Thirdly, we found a new chromatin looping manner that promoter-gene-ending interaction increased the specific attachment of antisense eRNA targeting to gene-ending region. Fourthly, we found KD of antisense eRNA impaired the cancer cell growth and invasion in vitro and cancer progression in tissues (Figures 5 and 6).
Figure 4
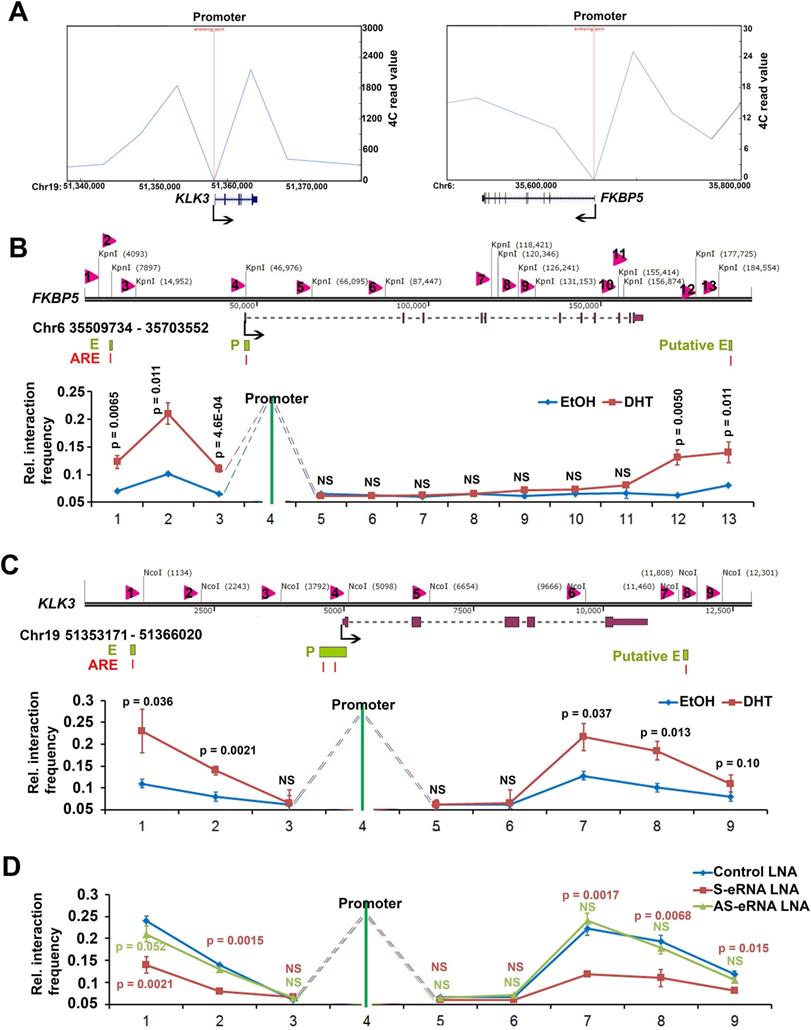
Antisense eRNA's function in cis relies on new two-looping interaction. (A) Virtual circularized chromosome conformation capture (4C)-seq data from http://promoter.bx.psu.edu/hi-c/chiapet.php showing potential signal binding regions with PSA and FKBP5 promoter in NHEK GM12878 and LNCaP cells. (B and C) The diagram showed that chromosome conformation capture (3C) assay with NcoI digesting in PSA locus and KpnI digesting in FKBP5 locus. Evaluation of the enhancer-promoter-antisense enhancer (gene-ending region) interaction at FKBP5 and PSA target gene loci were showed by chromosome conformation capture (3C) assays. Input meant that the genomic DNA was not crossed link with protein, then was digested by NcoI (for PSA) or KpnI (for FKBP5) and ligated randomly. Input DNA meant genomic random ligated DNA. Error bars represented mean ± SD for triplicate experiments (n=3). P values were shown in the figures. NS, no significance. (D) Evaluation of the enhancer-promoter-antisense enhancer (gene-ending region) interaction at PSA target gene loci by 3C assays in sense eRNA (S-eRNA) or antisense eRNA (As-eRNA) knocked down by LNAs. Error bars represented mean ± SD for triplicate experiments (n=3). P values were shown in the figures. NS, no significance.
Figure 5
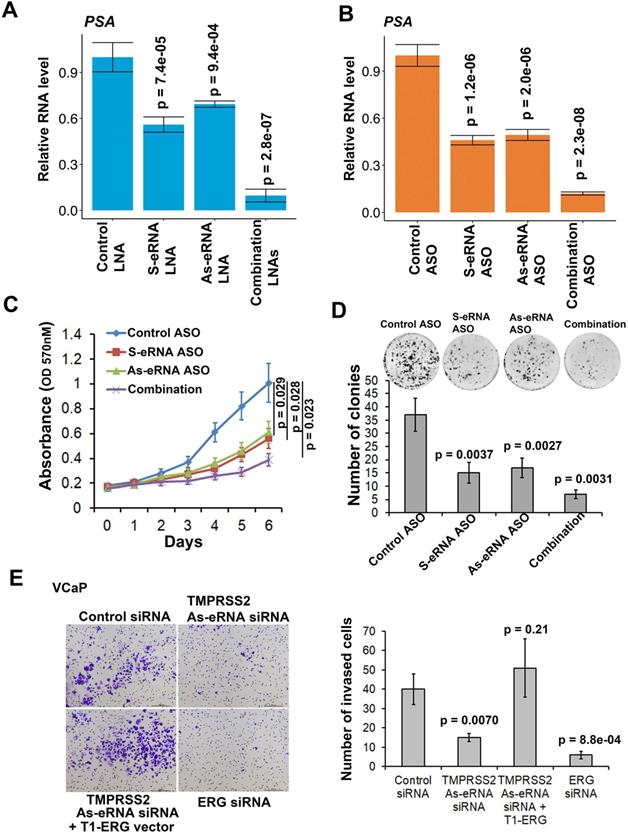
Antisense eRNA and antisense-enhancer mediate mRNA in cells. (A and B) The expressions of PSA are measured by qRT-PCR in C4-2 cells transfected by LNAs (A) or ASOs (B). Means and standard deviations (error bar) were determined from three replicates. Error bars represented mean ± SD for triplicate experiments (n=3). P values were shown in the figures. GAPDH as internal control. (C) C4-2 cells were transfected with control ASO, PSA sense eRNA (S-eRNA) ASO, PSA antisense eRNA (As-eRNA) ASO, or S-eRNA and As-eRNA combination (combination) using lipofectamine (2000 cells for each well). Cell viability conditions were determined by MTT assay. Error bars represented mean ± SD for triplicate experiments (n=6). P values were shown in the figures. (D) C4-2 cells were transfected with control ASO, PSA sense eRNA (S-eRNA) ASO, PSA antisense eRNA (As-eRNA) ASO, or S-eRNA and As-eRNA combination (combination) using lipofectamine (500 cells for each well). After 14 days, cells were fixed and stained by typen blue. Colonies (>50 cells) were calculated for each well. Error bars represented mean ± SD for triplicate experiments (n=3). P values were shown in the figures. (E) 3×10⁴ VCaP cells were cultured in each well of 24-well transwell plate. VCaP cells were transfected with control siRNA, TMPRSS2 antisense eRNA (As-eRNA) siRNA, TMPRSS2 As-eRNA siRNA with TMPRSS2 (exon1)-ERG (exon4) fusion (T1-ERG) plasmids, or ERG siRNAs using lipofectamine (500 cells for each well). After 24 h, cells were fixed and stained by crystal violet. Cells were calculated for each well. Error bars represented mean ± SD for triplicate experiments (n=3). P values were shown in the figures.
Antisense RNAs are transcripts from the opposite direction of sense RNAs. Some of they are small, noncoding, and diffusible molecules, small antisense RNAs included microRNA (miRNA) [21] and NATs [22, 23]. They are widespread in eukaryotes and are transcribed in the opposite direction to mRNA, which inhibit mRNA expression through DNA methylation, histone methylation, or dsRNA system [24, 26-29]. Through the strand-specific RNA-seq, we found that there were some antisense ncRNA in the gene bodies of PSA, FKBP5, KLK2 and TMPRSS2 loci. We also demonstrated that antisense ncRNA of PSA inhibited the PSA mRNA expression. These data were consistent with reports of antisense ncRNA's function [29, 49, 67, 68]. However, the upstream factor of antisense ncRNA remains unclear. The antisense transcripts have been found to originate from independent promoters, shared bi-directional promoters that are situated within genes [16, 21]. In this study, we found some enhancers in the gene-ending region with AR, H3K4me1 and DNA methylation ChIP-seq data. We hypothesized that these may be the cis elements of antisense ncRNAs. Interestingly, we demonstrated that mutation or SNP in these regions impair promoter-gene-ending interaction, antisense ncRNA and mRNA levels in prostate cancer cells and human tissues (Figure S6). Furthermore, we found that antisense eRNA involved into this action and recruited DNMT1 in these gene-ending enhancer regions (Figure 2). Taken together, we found a significant link among antisense ncRNA, antisense eRNA and promoter-gene-ending chromatin interaction. It is a new transcript manner for AR target genes.
Enhancer-promoter has been reported for about two decades. It explained how an enhancer can specific activate far distant promoters [3, 8]. Some groups already found that one enhancer (or promoter) can interact with multiple regions in genome, including promoters, intragenic and intergenic regions in genome [5, 9, 14, 48]. However, people had no idea why promoter interacted with intergenic region. In this study, we found some intergenic region in gene-ending were the new enhancers of antisense ncRNA. Antisense eRNAs recruited DNMT1 there to increased DNA methylation. We analyzed the genome spatial interaction meta-data in published papers [42-44]. 4C-seq data and our 3C data showed that the promoters of PSA, FKBP5, KLK2 and TMPRSS2 had potential interacted peak in the enhancer region and also in gene-ending region related to promoters (Figure 4A and S4A). However, we found that antisense eRNA mediated mRNA through binding to DNMT1, but not chromatin interaction. Promoter-gene-ending interactions increase the specific of antisense eRNA targeting to gene-ending region (Figure 7). These data can explain how bi-directional eRNAs play different roles to separately and spatially regulate looping and antisense ncRNA/mRNA transcript.
Figure 6
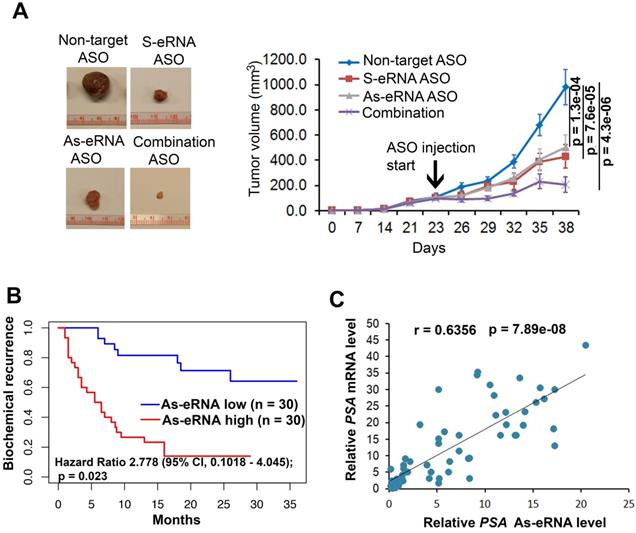
Antisense eRNA and antisense-enhancer mediate mRNA in mice and in tissues. (A) Effect of antisense eRNA ASOs on growth of prostate cancer xenografts. 5x10⁶ C4-2 cells were injected into NSG mice (n=6 each group). The tumor growth was measured every 7 days for 42 days, and the data are shown in the bottom panel. Data shown as means ± SD (n=6). Statistical significance was determined by two-tail Student's t-test. P values were shown in the figures. (B) Kaplan-Meier biochemical recurrence (PSA≥0.2 ng/mL) analysis of the Tianjin Medical University data sets for the relationship between the levels of antisense PSA eRNA, expression of antisense PSA eRNA and biochemical recurrence time in prostate cancers. n=30. Statistical significance is determined by log-rank test. P value and hazard ratio were shown in the figures. (C) Correlation analysis showing PSA mRNA and PSA antisense eRNA expression in prostate cancer tissues. Analysis of Tianjin Medical University data sets for levels of PSA RNA and PSA antisense eRNA were measured by RT-qPCR. n=60. Statistical significance was determined by two-tail Student's t-test. P values were shown in the figures.
Figure 7
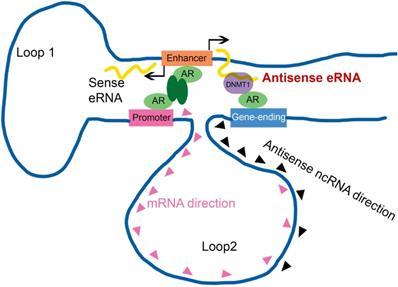
Antisense eRNA activates mRNA through chromatin double-loop interaction. A diagram shows double loop model that enhancer interacts with promoter and gene-ending region to facilitate mRNA and deduce antisense ncRNAs.
Taken together, we identified AR relating sense eRNAs and antisense eRNAs regulated sense mRNA and antisense ncRNA in prostate cancer cells. Antisense eRNA prevented antisense ncRNA expression in PSA, KLK2, FKBP5 and TMPRSS2 loci, through recruiting DNMT1 on the antisense enhancer and enlarge 5 mC DNA methylation on the gene-ending regions. Importantly, the chromatin exhibited a double looping manner that facilitated sense eRNA to promoter and antisense eRNA to gene-ending region in cis. Collectively, we reported a new interaction that enhancer, promoter and gene-ending region exhibited a spatiotemporally conformation acting mechanism of bi-directional eRNAs. In this regard, the spatiotemporally controlled bi-directional eRNAs were the important factors for allowing them to effectively act at promoter, enhancer and gene-ending region.
Supplementary Material
Supplementary figure S1-S3.
Supplementary figure S4-S6.
Supplementary table S1.
Supplementary table S2.
Acknowledgements
We thank the patient donors and their families for their altruism in participating in research studies. We also thank Dr. Hu for reagents, plasmids, and suggestions about DNMT1 and antisense RNA.
Funding
This work was supported in part by grants from the National Natural Science Foundation of China (81772697 to C.P., 81972654 to S.W.), Tianjin International Student Science and Technology Activities (20160014 to S.W.), the Individualized funding (to Y.Z.).
Contributions
CP, SW and YW performed the experiments. SW, YW and YZ prepared all the figures and wrote the manuscript. SW, CP and LC collected the samples. YZ and YN supervised the project. YZ, CP, SW and YN convinced whole project. All authors read and approved the final manuscript.
Competing Interests
The authors have declared that no competing interest exists.
References
1. Rosenfeld MG, Lunyak VV, Glass CK. Sensors and signals: a coactivator/corepressor/epigenetic code for integrating signal-dependent programs of transcriptional response. Genes Dev. 2006;20:1405-28
2. Lee TI, Young RA. Transcription of eukaryotic protein-coding genes. Annu Rev Genet. 2000;34:77-137
3. Heintzman ND, Stuart RK, Hon G, Fu Y, Ching CW, Hawkins RD. et al. Distinct and predictive chromatin signatures of transcriptional promoters and enhancers in the human genome. Nat Genet. 2007;39:311-8
4. Kim TK, Hemberg M, Gray JM, Costa AM, Bear DM, Wu J. et al. Widespread transcription at neuronal activity-regulated enhancers. Nature. 2010;465:182-7
5. Li W, Notani D, Ma Q, Tanasa B, Nunez E, Chen AY. et al. Functional roles of enhancer RNAs for oestrogen-dependent transcriptional activation. Nature. 2013;498:516-20
6. Lam MT, Cho H, Lesch HP, Gosselin D, Heinz S, Tanaka-Oishi Y. et al. Rev-Erbs repress macrophage gene expression by inhibiting enhancer-directed transcription. Nature. 2013;498:511-5
7. Hah N, Danko CG, Core L, Waterfall JJ, Siepel A, Lis JT. et al. A rapid, extensive, and transient transcriptional response to estrogen signaling in breast cancer cells. Cell. 2011;145:622-34
8. Wang D, Garcia-Bassets I, Benner C, Li W, Su X, Zhou Y. et al. Reprogramming transcription by distinct classes of enhancers functionally defined by eRNA. Nature. 2011;474:390-4
9. Hsieh CL, Fei T, Chen Y, Li T, Gao Y, Wang X. et al. Enhancer RNAs participate in androgen receptor-driven looping that selectively enhances gene activation. Proc Natl Acad Sci U S A. 2014;111:7319-24
10. Zhang Z, Lee JH, Ruan H, Ye Y, Krakowiak J, Hu Q. et al. Transcriptional landscape and clinical utility of enhancer RNAs for eRNA-targeted therapy in cancer. Nat Commun. 2019;10:4562
11. Peng BL, Li WJ, Ding JC, He YH, Ran T, Xie BL. et al. A hypermethylation strategy utilized by enhancer-bound CARM1 to promote estrogen receptor alpha-dependent transcriptional activation and breast carcinogenesis. Theranostics. 2020;10:3451-73
12. Qin N, Ma Z, Wang C, Zhang E, Li Y, Huang M. et al. Comprehensive characterization of functional eRNAs in lung adenocarcinoma reveals novel regulators and a prognosis-related molecular subtype. Theranostics. 2020;10:11264-77
13. Wang C, Jia L, Wang Y, Du Z, Zhou L, Wen X. et al. Genome-wide interaction target profiling reveals a novel Peblr20-eRNA activation pathway to control stem cell pluripotency. Theranostics. 2020;10:353-70
14. Schaukowitch K, Joo JY, Liu X, Watts JK, Martinez C, Kim TK. Enhancer RNA facilitates NELF release from immediate early genes. Mol Cell. 2014;56:29-42
15. Zhao Y, Wang L, Ren S, Wang L, Blackburn PR, McNulty MS. et al. Activation of P-TEFb by Androgen Receptor-Regulated Enhancer RNAs in Castration-Resistant Prostate Cancer. Cell Rep. 2016;15:599-610
16. Pelechano V, Steinmetz LM. Gene regulation by antisense transcription. Nat Rev Genet. 2013;14:880-93
17. Werner A, Swan D. What are natural antisense transcripts good for? Biochem Soc Trans. 2010;38:1144-9
18. Zhang Y, Huang YX, Wang DL, Yang B, Yan HY, Lin LH. et al. LncRNA DSCAM-AS1 interacts with YBX1 to promote cancer progression by forming a positive feedback loop that activates FOXA1 transcription network. Theranostics. 2020;10:10823-37
19. Logotheti S, Marquardt S, Gupta SK, Richter C, Edelhauser BAH, Engelmann D. et al. LncRNA-SLC16A1-AS1 induces metabolic reprogramming during Bladder Cancer progression as target and co-activator of E2F1. Theranostics. 2020;10:9620-43
20. Lin YX, Wang Y, Blake S, Yu M, Mei L, Wang H. et al. RNA Nanotechnology-Mediated Cancer Immunotherapy. Theranostics. 2020;10:281-99
21. Faghihi MA, Zhang M, Huang J, Modarresi F, Van der Brug MP, Nalls MA. et al. Evidence for natural antisense transcript-mediated inhibition of microRNA function. Genome Biol. 2010;11:R56
22. Lehner B, Williams G, Campbell RD, Sanderson CM. Antisense transcripts in the human genome. Trends Genet. 2002;18:63-5
23. Shendure J, Church GM. Computational discovery of sense-antisense transcription in the human and mouse genomes. Genome Biol. 2002;3:RESEARCH0044
24. Beiter T, Reich E, Williams RW, Simon P. Antisense transcription: a critical look in both directions. Cell Mol Life Sci. 2009;66:94-112
25. Baulcombe D. RNA silencing in plants. Nature. 2004;431:356-63
26. Burnett JC, Rossi JJ. RNA-based therapeutics: current progress and future prospects. Chem Biol. 2012;19:60-71
27. Agrawal N, Dasaradhi PV, Mohmmed A, Malhotra P, Bhatnagar RK, Mukherjee SK. RNA interference: biology, mechanism, and applications. Microbiol Mol Biol Rev. 2003;67:657-85
28. Yu W, Gius D, Onyango P, Muldoon-Jacobs K, Karp J, Feinberg AP. et al. Epigenetic silencing of tumour suppressor gene p15 by its antisense RNA. Nature. 2008;451:202-6
29. Rinn JL, Kertesz M, Wang JK, Squazzo SL, Xu X, Brugmann SA. et al. Functional demarcation of active and silent chromatin domains in human HOX loci by noncoding RNAs. Cell. 2007;129:1311-23
30. Jiao L, Deng Z, Xu C, Yu Y, Li Y, Yang C. et al. miR-663 induces castration-resistant prostate cancer transformation and predicts clinical recurrence. J Cell Physiol. 2014;229:834-44
31. Wang L, Zeng X, Chen S, Ding L, Zhong J, Zhao JC. et al. BRCA1 is a negative modulator of the PRC2 complex. The EMBO journal. 2013;32:1584-97
32. Boyer LA, Lee TI, Cole MF, Johnstone SE, Levine SS, Zucker JP. et al. Core transcriptional regulatory circuitry in human embryonic stem cells. Cell. 2005;122:947-56
33. Kim JH, Dhanasekaran SM, Prensner JR, Cao X, Robinson D, Kalyana-Sundaram S. et al. Deep sequencing reveals distinct patterns of DNA methylation in prostate cancer. Genome Res. 2011;21:1028-41
34. Wang L, Wang S, Li W. RSeQC: quality control of RNA-seq experiments. Bioinformatics. 2012;28:2184-5
35. Trapnell C, Pachter L, Salzberg SL. TopHat: discovering splice junctions with RNA-Seq. Bioinformatics. 2009;25:1105-11
36. Mortazavi A, Williams BA, McCue K, Schaeffer L, Wold B. Mapping and quantifying mammalian transcriptomes by RNA-Seq. Nature methods. 2008;5:621-8
37. Robinson MD, Oshlack A. A scaling normalization method for differential expression analysis of RNA-seq data. Genome Biol. 2010;11:R25
38. Zhao Y, Ding L, Wang D, Ye Z, He Y, Ma L. et al. EZH2 cooperates with gain-of-function p53 mutants to promote cancer growth and metastasis. Embo J. 2019 38
39. Jiang G, Wang X, Sheng D, Zhou L, Liu Y, Xu C. et al. Cooperativity of co-factor NR2F2 with Pioneer Factors GATA3, FOXA1 in promoting ERalpha function. Theranostics. 2019;9:6501-16
40. Seth PP, Siwkowski A, Allerson CR, Vasquez G, Lee S, Prakash TP. et al. Design, synthesis and evaluation of constrained methoxyethyl (cMOE) and constrained ethyl (cEt) nucleoside analogs. Nucleic Acids Symp Ser (Oxf). 2008 p: 553-4
41. Hua Q, Mi B, Xu F, Wen J, Zhao L, Liu J. et al. Hypoxia-induced lncRNA-AC020978 promotes proliferation and glycolytic metabolism of non-small cell lung cancer by regulating PKM2/HIF-1alpha axis. Theranostics. 2020;10:4762-78
42. Zhao Y, Wang L, Ren S, Blackburn PR, McNulty MS, Gao X. et al. Activation of P-TEFb by Androgen Receptor-Regulated Enhancer RNAs in Castration-Resistant Prostate Cancer. Cell Rep. 2016;15:599-610
43. Heintzman ND, Hon GC, Hawkins RD, Kheradpour P, Stark A, Harp LF. et al. Histone modifications at human enhancers reflect global cell-type-specific gene expression. Nature. 2009;459:108-12
44. Visel A, Blow MJ, Li Z, Zhang T, Akiyama JA, Holt A. et al. ChIP-seq accurately predicts tissue-specific activity of enhancers. Nature. 2009;457:854-8
45. Heemers HV, Regan KM, Dehm SM, Tindall DJ. Androgen induction of the androgen receptor coactivator four and a half LIM domain protein-2: evidence for a role for serum response factor in prostate cancer. Cancer Res. 2007;67:10592-9
46. Zhang Y, Pitchiaya S, Cieslik M, Niknafs YS, Tien JC, Hosono Y. et al. Analysis of the androgen receptor-regulated lncRNA landscape identifies a role for ARLNC1 in prostate cancer progression. Nat Genet. 2018;50:814-24
47. Tran C, Ouk S, Clegg NJ, Chen Y, Watson PA, Arora V. et al. Development of a second-generation antiandrogen for treatment of advanced prostate cancer. Science. 2009;324:787-90
48. Zhao J, Zhao Y, Wang L, Zhang J, Karnes RJ, Kohli M. et al. Alterations of androgen receptor-regulated enhancer RNAs (eRNAs) contribute to enzalutamide resistance in castration-resistant prostate cancer. Oncotarget. 2016;7:38551-65
49. Ozsolak F, Kapranov P, Foissac S, Kim SW, Fishilevich E, Monaghan AP. et al. Comprehensive polyadenylation site maps in yeast and human reveal pervasive alternative polyadenylation. Cell. 2010;143:1018-29
50. Lister R, Mukamel EA, Nery JR, Urich M, Puddifoot CA, Johnson ND. et al. Global epigenomic reconfiguration during mammalian brain development. Science. 2013;341:1237905
51. Yu M, Hon GC, Szulwach KE, Song CX, Zhang L, Kim A. et al. Base-resolution analysis of 5-hydroxymethylcytosine in the mammalian genome. Cell. 2012;149:1368-80
52. Fukagawa A, Ishii H, Miyazawa K, Saitoh M. deltaEF1 associates with DNMT1 and maintains DNA methylation of the E-cadherin promoter in breast cancer cells. Cancer Med. 2015;4:125-35
53. Hervouet E, Peixoto P, Delage-Mourroux R, Boyer-Guittaut M, Cartron PF. Specific or not specific recruitment of DNMTs for DNA methylation, an epigenetic dilemma. Clin Epigenetics. 2018;10:17
54. Merry CR, Forrest ME, Sabers JN, Beard L, Gao XH, Hatzoglou M. et al. DNMT1-associated long non-coding RNAs regulate global gene expression and DNA methylation in colon cancer. Hum Mol Genet. 2015;24:6240-53
55. Akdemir KC, Le VT, Chandran S, Li Y, Verhaak RG, Beroukhim R. et al. Disruption of chromatin folding domains by somatic genomic rearrangements in human cancer. Nat Genet. 2020;52:294-305
56. Haarhuis JHI, van der Weide RH, Blomen VA, Yanez-Cuna JO, Amendola M, van Ruiten MS. et al. The Cohesin Release Factor WAPL Restricts Chromatin Loop Extension. Cell. 2017;169:693-707 e14
57. Wang Y, Song F, Zhang B, Zhang L, Xu J, Kuang D. et al. The 3D Genome Browser: a web-based browser for visualizing 3D genome organization and long-range chromatin interactions. Genome Biol. 2018;19:151
58. Yang Y, Su Z, Song X, Liang B, Zeng F, Chang X. et al. Enhancer RNA-driven looping enhances the transcription of the long noncoding RNA DHRS4-AS1, a controller of the DHRS4 gene cluster. Sci Rep. 2016;6:20961
59. Rahman S, Zorca CE, Traboulsi T, Noutahi E, Krause MR, Mader S. et al. Single-cell profiling reveals that eRNA accumulation at enhancer-promoter loops is not required to sustain transcription. Nucleic Acids Res. 2017;45:3017-30
60. Grasso CS, Wu YM, Robinson DR, Cao X, Dhanasekaran SM, Khan AP. et al. The mutational landscape of lethal castration-resistant prostate cancer. Nature. 2012;487:239-43
61. Deplus R, Delliaux C, Marchand N, Flourens A, Vanpouille N, Leroy X. et al. TMPRSS2-ERG fusion promotes prostate cancer metastases in bone. Oncotarget. 2017;8:11827-40
62. Klein RJ, Hallden C, Gupta A, Savage CJ, Dahlin A, Bjartell A. et al. Evaluation of multiple risk-associated single nucleotide polymorphisms versus prostate-specific antigen at baseline to predict prostate cancer in unscreened men. Eur Urol. 2012;61:471-7
63. Kote-Jarai Z, Amin Al Olama A, Leongamornlert D, Tymrakiewicz M, Saunders E, Guy M. et al. Identification of a novel prostate cancer susceptibility variant in the KLK3 gene transcript. Hum Genet. 2011;129:687-94
64. Parikh H, Deng Z, Yeager M, Boland J, Matthews C, Jia J. et al. A comprehensive resequence analysis of the KLK15-KLK3-KLK2 locus on chromosome 19q13.33. Hum Genet. 2010;127:91-9
65. Qi P, Du X. The long non-coding RNAs, a new cancer diagnostic and therapeutic gold mine. Mod Pathol. 2013;26:155-65
66. Rusk N. Synthetic biology: RNA that activates transcription. Nat Methods. 2015;12:290
67. Camblong J, Beyrouthy N, Guffanti E, Schlaepfer G, Steinmetz LM, Stutz F. Trans-acting antisense RNAs mediate transcriptional gene cosuppression in S. cerevisiae. Genes Dev. 2009;23:1534-45
68. Camblong J, Iglesias N, Fickentscher C, Dieppois G, Stutz F. Antisense RNA stabilization induces transcriptional gene silencing via histone deacetylation in S. cerevisiae. Cell. 2007;131:706-17
Author contact
![]() Corresponding authors: Yu Zhao, Ph.D. (E-mail: zhao.yuedu) and Chun-Wu Pan, M.D. (E-mail: panchunwucom).
Corresponding authors: Yu Zhao, Ph.D. (E-mail: zhao.yuedu) and Chun-Wu Pan, M.D. (E-mail: panchunwucom).
Citation styles
APA
Pan, C.W., Wen, S., Chen, L., Wei, Y., Niu, Y., Zhao, Y. (2021). Functional roles of antisense enhancer RNA for promoting prostate cancer progression. Theranostics, 11(4), 1780-1794. https://doi.org/10.7150/thno.51931.
ACS
Pan, C.W.; Wen, S.; Chen, L.; Wei, Y.; Niu, Y.; Zhao, Y. Functional roles of antisense enhancer RNA for promoting prostate cancer progression. Theranostics 2021, 11 (4), 1780-1794. DOI: 10.7150/thno.51931.
NLM
Pan CW, Wen S, Chen L, Wei Y, Niu Y, Zhao Y. Functional roles of antisense enhancer RNA for promoting prostate cancer progression. Theranostics 2021; 11(4):1780-1794. doi:10.7150/thno.51931. https://www.thno.org/v11p1780.htm
CSE
Pan CW, Wen S, Chen L, Wei Y, Niu Y, Zhao Y. 2021. Functional roles of antisense enhancer RNA for promoting prostate cancer progression. Theranostics. 11(4):1780-1794.
This is an open access article distributed under the terms of the Creative Commons Attribution License (https://creativecommons.org/licenses/by/4.0/). See http://ivyspring.com/terms for full terms and conditions.