Theranostics
13.3
Impact Factor
- Current Issue
- Advance Articles
- Volume 16; 2026
- Volume 15; 2025
- Volume 14; 2024
- Volume 13; 2023
- Volume 12; 2022
- Archive
- Cover Images
- Cover Suggestion
- Special Issues
Top
Introduction
Results
Discussion
Materials and Methods
Supplementary Material
Acknowledgements
References
Introduction
Results
Discussion
Materials and Methods
Supplementary Material
Acknowledgements
References
International Journal of Biological Sciences
International Journal of Medical Sciences
 Global reach, higher impact

Theranostics 2024; 14(1):176-202. doi:10.7150/thno.85409 This issue Cite
Research Paper
Fibroblast-derived extracellular vesicles as trackable efficient transporters of an experimental nanodrug with fibrotic heart and lung targeting
Jorge RuizdelRio1, Gabriela Guedes2,3, Danielle Novillo1, Elena Lecue1, Ana Palanca4, Aitziber L. Cortajarena2,5, Ana V. Villar1,6 ![]()
1. Instituto de Biomedicina y Biotecnología de Cantabria (IBBTEC), Consejo Superior de Investigaciones Científicas (CSIC)-Universidad de Cantabria (UC), Santander, Spain.
2. Center for Cooperative Research in Biomaterials (CIC biomaGUNE), Basque Research and Technology Alliance (BRTA), Paseo de Miramón 194, Donostia-San Sebastián 20014, Spain.
3. University of the Basque Country (UPV/EHU), 48940 Leioa, Spain.
4. Departamento de Anatomía y Biología Celular, Universidad de Cantabria, Santander, Spain.
5. Ikerbasque, Basque Foundation for Science, 48009 Bilbao, Spain.
6. Departamento de Fisiología y Farmacología, Facultad de Medicina, Universidad de Cantabria, Santander, Spain.
Received 2023-4-19; Accepted 2023-10-26; Published 2024-1-1
Citation:
RuizdelRio J, Guedes G, Novillo D, Lecue E, Palanca A, Cortajarena AL, Villar AV. Fibroblast-derived extracellular vesicles as trackable efficient transporters of an experimental nanodrug with fibrotic heart and lung targeting. Theranostics 2024; 14(1):176-202. doi:10.7150/thno.85409. https://www.thno.org/v14p0176.htm
Other stylesAbstract

The discovery of extracellular vesicles (EVs) as efficient exogenous biotransporters of therapeutic agents into cells across biological membranes is an exciting emerging field. Especially the potential of EVs as targeted delivery systems for diseases with selective treatments, such as fibrosis, whose treatment causes side effects in other organs not involved in the disease. Methods: In this study, we collected embryonic fibroblast-derived EVs from two different centrifugation fractions, 10 K g and 100 K g fractions from a NIH-3T3 cell line loaded with an experimental drug. Mice with fibrotic hearts and lungs were obtained by administration of angiotensin II. We generated fluorescent EVs and bioluminescent drug to observe their accumulation by colocalization of their signals in fibrotic heart and lung. The biodistribution of the drug in various organs was obtained by detecting the Au present in the drug nanostructure. Results: The drug-loaded EVs successfully reduced fibrosis in pathological fibroblasts in vitro, and modified the biodistribution of the experimental drug, enabling it to reach the target organs in vivo. We described the pre-analytical characteristics of EVs related to physical variables, culture and harvesting conditions, crucial for their in vivo application as nanotransporters using a previously validated protein-based antifibrotic drug. The results showed the colocalization of EVs and the experimental drug in vivo and ex vivo and the efficient reduction of fibrosis in vitro. This work demonstrates that 10K-EVs and 100K-EVs derived from fibroblasts can act as effective biotransporters for targeted drug delivery to profibrotic fibroblasts, lungs, or heart.
Conclusion: We observed that fibroblast-derived 10K-EVs and 100K-EVs are useful biotransporters encapsulating a new generation drug leading to a reduction of fibrosis in profibrotic fibroblasts in vitro. In addition, drug containing EVs were shown to reach fibrotic heart and lungs in vivo, enhancing free drug biodistribution.
Keywords: biological antifibrotic nanocarriers, fibrosis, protein-nanomaterial hybrids, extracellular vesicles, in vivo imaging
Introduction
According to the International Society for Extracellular Vesicles (ISEV), extracellular vesicles (EVs) are defined as nanometric particles containing a lipid bilayer that are naturally released by cells to transport their contents. Cell-to-cell communication via EVs can occur both autologously and heterologously linking cells involved in the pathophysiology of different organs. EVs can be divided into three main types: 1) exosomes are originally formed as intraluminal vesicles (ILVs) from multivesicular bodies (MVBs) and with a diameter of approximately 50-150 nm [1]; 2) ectosomes or microparticles are generated by direct budding outside the plasma membrane and can have a diameter of up to 500 nm; and 3) apoptotic bodies, that together with ectosomes and oncosomes, can be larger with a diameter of up to 5 μm [2-4]. The different sizes and intracellular origins of EVs could affect their behaviors as both natural and exogenous biotransporters and therefore their potential clinical application.
These non-replicative vesicles are difficult to purify due to their heterogeneity in size and markers, unless markers of subcellular origin can be established [5]. However, fractions of EVs can be identified based on their size range or complexity when purified using serial centrifugations. Here, we isolated two distinct fractions of EVs corresponding to centrifugations at 10,000 g and at 100,000 g. Labeling of EVs enables their visualization and characterization in vitro and in vivo [6]. There are several successful methods of fluorescence labeling of EVs including insertion of myristoylation, palmitoylation, prenylation sequences, to the fluorescent protein tags [7-8]. Prenylation motifs, present in most Ras family members allows targeting of protein to cell membrane [9]. We have genetically engineered fibroblasts expressing a prenylated far-red fluorescent protein from which fluorescent EVs suitable for fluorescence analysis were isolated [10].
EVs have been defined as a therapeutic strategy or biomarker in various diseases including cardiac [11] and pulmonary [12] pathologies. The ability of EVs to be generated, secreted, and internalized into cells in response to stress or damage signals, directed by growth factors and cytokines, makes them a perfect communicator between lung and heart [13]. Therefore, they have the potential to act as biotransporters of drugs to these highly irrigated organs. For example, in the heart, EVs are already considered an innate drug delivery system [14] since their fibroblasts, a non-myocytic cell type, maintain homeostasis through constant communication with themselves, cardiomyocytes or endothelial cells, especially in stress situations such as hypoxia, infection, inflammation, or fibrosis [15].
We have utilized a model of systemic fibrosis via administration of angiotensin II (Ang II) a potent vasopressor peptide in the pathogenesis of cardiac remodeling [16] and pulmonary hypertension [17]. In the case of the heart, if it is affected by a chronic cardiovascular injury (valve narrowing, cardiomyopathies, tissue necrosis, arterial hypertension, etc.) it will develop fibrosis and hypertrophy as remodeling mechanisms to restore or maintain function [18]. These remodeling features are beneficial in the short term, but in the long term, uncontrolled myocardial fibrosis produced mainly by fibroblasts (target cells), becomes highly damaging and can cause organ failure [19]. Organ failure could be a consequence of cardiac fibrosis due to increased stiffness and decreased distensibility of cardiac tissue. Patients with less fibrosis experienced marked improvement of diseases, such as aortic stenosis after valve replacement, compared to those with high levels of fibrosis, with correlations between left ventricular dysfunction, ventricular fibrosis and worse prognosis [20]. Due to the high level of side effects, there is currently no approved antifibrotic treatment for fibrotic patients of cardiovascular etiology [21]. Clinical treatments to reduce fibrosis of cardiovascular patients are not antifibrotic drugs but antihypertensive agents such as angiotensin-converting enzyme (ACE) inhibitors and angiotensin II receptor antagonists (ARA-II) [22] or drugs against hypercholesterolemia such as statins [23], but in no case are they designed to reduce fibrosis itself.
In the case of the lung, acute lung injury (ALI), acute respiratory distress syndrome (ARDS), chronic obstructive pulmonary disease (COPD) and idiopathic pulmonary fibrosis (IPF) are examples of lung diseases involving reparative processes. When pathophysiological alteration of the lung occurs, cellular components of the microvascular endothelium, alveolar epithelium, and pulmonary interstitium initiate their organ remodeling process. Proliferating fibroblasts are part of the remodeling process and can produce large amounts of profibrotic proteins that accumulate in the interstitial space [24].
We have recently demonstrated that a promising protein-nanomaterial hybrid (CTPRAu), a fluorescent gold nanocluster stabilized by an engineered Consensus Tetratricopeptide Repeat (CTPR) protein and containing an Hsp90-inhibiting module (CTPR390), showed efficient antifibrotic capabilities [25]. Moreover, using high-resolution atomic imaging it was possible to locate this antifibrotic drug in non-apoptotic vesicles inside fibroblasts [26]. This observation indicates that fibroblasts naturally transport CTPRAu as part of endocytic trafficking events, including nutrient uptake, signaling from cell surface receptors, or acquisition of new proteins.
Considering the natural disposition of CTPRAu towards cell uptake and with the aim of exploring the possibility of using a biological carrier to target active fibroblasts in profibrotic cellular environments, we encapsulated CTPRAu into healthy fibroblasts derived EVs to study its antifibrotic potential on profibrotic fibroblasts. Previous studies have shown that CTPRAu primarily accumulates in organs associated with drug elimination, however, it achieves a long-term accumulation (up to 1 week) in fibrotic organs [25]. In this way, by encapsulating CTPRAu in EVs, we intended to alter its biodistribution pattern, enabling it to reach fibrotic sites in vivo in a short amount of time.
Results
Physicochemical differences of 10K and 100K fractions containing fluorescent EVs derived from genetically modified NIH-3T3 fibroblasts
The NIH-3T3 cell line of embryonic fibroblasts is a source of EVs able to interact with other cells and communicate signals important for their homeostasis [27]. Our first objective was to develop a cell line designed to express and anchor the mKate2 fluorescent tag on the membranes of EVs. EVs derived from genetically modified NIH-3T3 fibroblasts allow consistent and easy visualization of EVs at a maximum emission of 635 nm. To this end, we fused the red fluorescent protein mKate2 to the C-terminal end of the CAAX motif where C is Cys; AA are the aliphatic amino acids Val and Leu; and X is Ser (Figure S1A). The CAAX box is recognized by endogenous farnesyltransferase which subsequently transfers a farnesyl group to the thiol group of Cys. Farnesylation of mKate2-Cys-Val-Leu-Ser protein increases its hydrophobicity resulting in its anchoring to the cell membrane [8]. A schematic representation of the mKate2-CAAX vector used for cell line generation is displayed in Figure S1A-B. We obtained images (Figure S1C) and proliferation curves (Figure S1D) of cells with puromycin selection at 0, 1, 2.5, and 5 ng/mL 3 days after transfection with mKate2 vector, and it was observed that 1 ng/mL of puromycin is sufficient to eliminate NIH-3T3 from the culture. After mKate2 NIH-3T3 cell line expressing membrane bound mKate2 was established, the cell viability was measured (Figure S1E). In addition, the cell surface expression of mKate2 was verified through fluorescence studies (Figure S1F). Thus, we established a new genetically engineered NIH-3T3 fibroblasts stable cell line (mKate2 NIH-3T3) that produces fluorescently labeled EVs as shown in Figure 1A. To obtain EVs, mKate2 NIH-3T3 cells were cultured with media supplemented with depleted FBS. Cell supernatant was ultracentrifuged at 10 Kg and 100 Kg (after removing cell debris in a centrifugation at 2,000 g). The use of EVs-free PBS served to define the reliable area of detection of mKate2 EVs in samples with 1:10 dilution, we discarded the PBS-derived powder and selected the EVs zone by cytometry (Figure S2A). We observed that serial dilutions of the EVs samples presented a decrease in counts in the detection by cytometry with a correct signal/sample ratio at 1:10 and 1:100 dilutions (Figure S2B), thus these working dilutions were selected for mKate2 EVs detection. To demonstrate that mKate2 NIH-3T3 supernatant fractions contained EVs, we first checked for the presence of membrane and soluble EV markers by western blot. The EV membrane markers CD-81 and Flotilin-1 and the EV soluble markers, Syntenin-1 and Heat Shock Protein 90 (Hsp90), a protein related to TGFβ signaling cascade in fibroblasts [16, 28], were detected in both 10K and 100K fractions (Figure 1B). Henceforth, we will refer to fractions as 10K-EVs and 100K-EVs respectively. Interestingly, Hsp90 was significantly more abundant in the 10K fraction than in the 100K fraction (signal intensity was normalized to the loading marker), whereas there was no significant difference in the levels of Syntenin-1, CD-81, and Flotilin-1 between the two fractions (Figure 1B). Nanoparticle Tracking Analysis (NTA) was used to measure the EVs diameter in the 10K-EV and 100K-EV fractions, obtaining the size of the particles and particle number from the scattered light in a distillate water suspension. The most abundant populations of 10K-EVs and 100K-EVs showed a diameter of 148.0 ± 15.0 nm and 91.0 ± 11.0 nm respectively (Figure 1C); with mean values of 189.9 ± 74.3 nm and 158.6 ± 90.4 nm respectively (Figure 1D). We further characterized the 10K-EVs and 100K-EVs fractions by transmission electron microscopy (TEM) by taking representative images of EVs with a diameter range similar to that of the most abundant populations and to populations that represent the average diameters in each of the fractions (Figure 1E). TEM images showed that both fractions of EVs present a spherical morphology. We investigated any charge differences between the 10K-EV and the 100K-EV fractions by measuring the zeta potential of each fraction. mKate2 10K-EVs exhibited a negative zeta potential of -5.8 ± 0.1 mV, whereas mKate2100K-EVs exhibited a significantly (**p < 0.005) more negative zeta potential of -8.4 ± 0.7 mV (Figure 1F). These results indicated the presence of two different fractions (10K-EVs and 100K-EVs) in terms of particle distribution, size and charge.
Figure 1
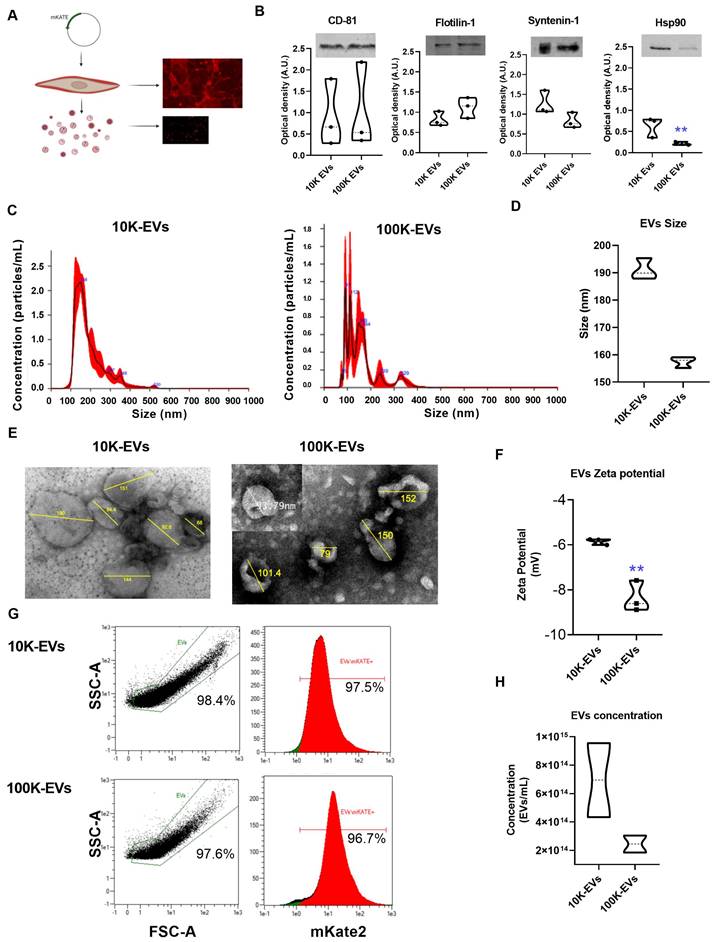
The 10K and 100K fractions extracted from genetically engineered NIH-3T3 embryonic fibroblasts (mKate2 NIH-3T3) contain EVs. A) Drawing depicting the insertion of the m-Kate plasmid into fibroblasts and confocal images of the final fluorescent products, fluorescent NIH-3T3 mKate2 fibroblasts and their derived fluorescent mKate2 EVs. B) Representative images of EV WBs and graphs showing the signal intensity analysis of the WBs (n = 3) of the membrane markers CD-81 and Flotilin-1 and the soluble markers Syntenin-1 and Hsp90 (**p < 0.005) belonging to m-Kate-NIH-3T3 10K and 100K EVs. C) NTA measurements of the concentration and size distribution of usual polydisperse populations of ultracentrifuged EVs. MKate2-NIH-3T3 10K-EVs (left) and mKate2-NIH-3T3 100K-EVs (right); in red the standard deviation of the mean value of the measurements (n = 4). D) NTA mean size of the particles under study n = 4 per type of EV (10K and 100K). E) Representative transmission electron microscopy images of extracellular vesicles (10K-EVs and 100K-EVs) obtained from mKate2 NIH-3T3 cells by centrifugation. F) Charge measurements at a distance from the particle (zeta potential) in mV for 10K-EVs and 100K-EVs (n = 3), **p < 0.005. G) Representative images of the detection of mKate2 10K-EVs and mKate2 100K-EVs by flow cytometry. The graphs are the singlet gate analysis of a dot plot of forward scatter versus side scatter in the 645 nm fluorescent channel (mKate2). The graphs indicate the percentages of EVs detected from the total number of particles in the samples (left panels) and the percentages of mKate2 EVs from the total number of EVs in the samples (right panels). H) NTA Total concentration of EVs/mL (10K-EVs and 100K-EVs) extracted from 12x108 mKate2 NIH-3T3 cells.
Finally, we used an adapted Macs protocol (see methods section) to determine sample labeling efficiency by flow cytometry (Figure S2A). Data obtained below the forward scatter (FSC-A) value of 1e1 were sidelined from any given side scatter value (SSC-A). It was found that 97.5% of the 10K-EVs fraction and 96.7% of the 100K-EVs fraction was fluorescently labeled with mKate2. (Figure 1G). We checked the stability of mKate2 10K-EVs and mKate2 100K-EVs under various temperature and serum experimental conditions. We incubated both types of EVs in depleted FBS at 37 ºC for 1 h (Figure S2C), 2 h (Figure S2D) and 7 days (Figure S2E). By flow cytometry, we observed that the complexity of both EVs samples was maintained, in contrast to broken-sonicated EVs as a negative control (Figure S2F). Signal from EVs-depleted-FBS serum (Figure S2G) and from EVs-depleted-PBS (Figure S2H) were also used as negative controls.
These above results indicate the successful labeling of EVs through insertion of mKate2 into their membranes and their stability. The number of mKate2 EVs obtained per mL of fibroblast supernatant under the conditions of the study (mKate2 NIH-3T3 cultured for five days in depleted medium) was measured by NTA. The number of EVs/mL obtained from 12x108 cells was 7.0x10¹⁴ ± 4.0 x10¹⁰ EVs/mL for 10K-EVs and 2.5x10¹⁴ ± 8.5x10¹³ EVs/mL for 100K-EVs as shown in Figure 1H. MKate2 EVs exhibited the same size and Z-potential of regular NIH-3T3 EVs (Figure 1F). These results demonstrated the presence of mKate2 EVs in both 10K and 100K fractions, as well as the differences in size, charge, and concentration between mKate2 10K-EVs and mKate2 100K-EVs, but not in comparison with the 10K and 100K fractions of EVs from normal NIH-3T3 cells.
Pathological fibroblasts incorporate EVs derived from healthy mKate2 NIH-3T3 cells
Based on the ability of fibroblasts to secrete and capture EVs [29], our hypothesis advocates that EVs can be used as effective biological nanocarriers to reach target fibrotic fibroblasts in vitro. A well-established method for the activation of the synthesis of profibrotic molecules in fibroblasts is the administration of TGFβ, the main cytokine responsible for triggering profibrotic signaling pathways [30]. To demonstrate that EVs from basal (healthy) fibroblasts are useful in reaching and internalizing TGFβ-activated (fibrotic) fibroblasts, we separately administered mKate2 10K-EVs and mKate2-100K EVs to such pathological profibrotic cells (Figure 2A). To activate their profibrotic stage, NIH-3T3 cells were treated with TGFβ (1.0 ng/mL) as previously described [16]. We proceeded to perform a series of in vivo cellular assays to visualize the cellular uptake of mKate2 EVs in TGFβ-activated fibroblasts. We visualized the fluorescent signal of mKate2 EVs purified from basal mKate2 NIH-3T3 fibroblasts after their addition to TGFβ-activated NIH-3T3 fibroblasts. The epifluorescence signal was detected both on the fibroblast membrane (as an indicator that fluorescent EV were entering/passing the cell membrane) and in the conditioned medium of these cells 2-6 min after EV addition. Figure 2B showed a representative image of internalization of mKate2 100K-EVs into NIH-3T3 cells captured during the first min after EVs addition. Fusion of bright field and fluorescence images from confocal microscopy at longer times after EVs addition (10 min) showed localization of fluorescent mKate2 10K-EVs and mKate2 100K-EVs within fibroblasts (Figure 2C-D). The total number of particles incorporated per cell were quantify by identification of the fluorescent dye on the mKate2 protein in randomly selected cells (n = 3-6) (Figure 2C-D). The number of fluorescent particles located inside the cells were quantified by applying a median filter and setting a threshold at the maximum value minus the noise tolerance (see methods section). The fluorescent dots shown, correspond to EVs, which are quantified using ImageJ software (Figure 2C-D). The number of internalized EVs per cell was 50.5 ± 32.5 mKate2-10K EVs/cell and 94.7 ± 22.2 mKate2-100K EVs/cell, 10 min after EVs administration of 7.0x10¹¹ ± 4.0 x10¹¹ EVs/mL for mKate2 10K-EVs and 2.5x10¹¹ ± 8.5x10¹⁰/mL mKate2 100K-EVs, to 10x106 profibrotic fibrotic NIH-3T3 fibroblasts (Figure 2C-D).
Heat shock protein 90 (Hsp90) is a natural partner of the TGFβ signaling cascade, whose chemical inhibition reduces collagen production (fibrosis) [28]. Recently, we demonstrated that inhibition by nanotherapies such as an engineered protein inhibitor (CTPR390) reduces fibrosis in vitro and in vivo [16]. Figure 1B western blots showed the presence of Hsp90 in fibroblast-derived EVs, as a normal trafficking mechanism of a ubiquitous chaperone [16, 28, 31]. Hsp90 presence inside NIH-3T3 TGFβ-activated fibroblasts was evaluated by confocal microscopy (Figure 2E), as Hsp90 is the target protein of the prototype drug (CTPRAu) that would be encapsulated in mKate2 EV as part of this study. These results demonstrate the ability of 10K-EVs and 100K-EVs, derived from basal mKate2 NIH-3T3 fibroblasts, to be internalized in TGFβ-activated fibroblasts.
Figure 2
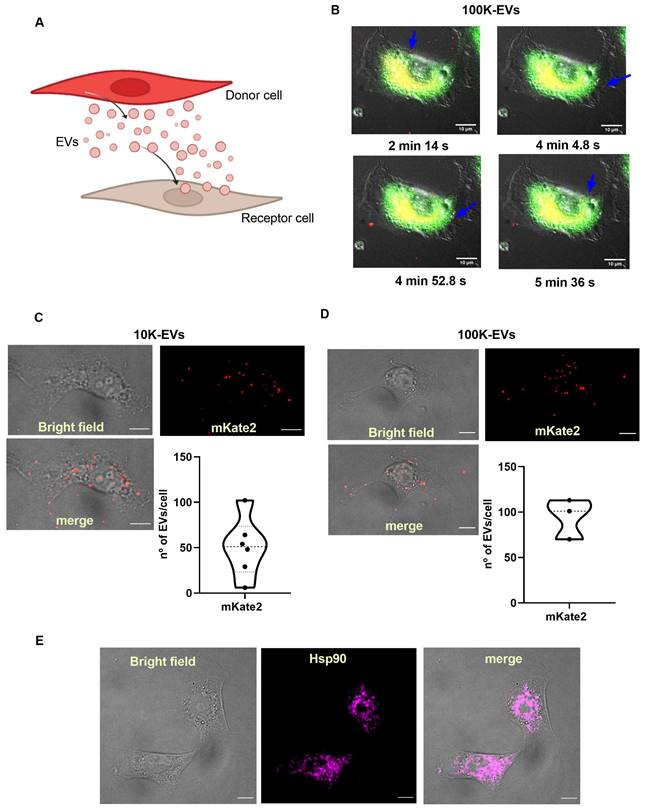
Internalization of mKate2 10K-EVs and mKate2 100K-EVs in NIH-3T3 profibrotic embryonic fibroblasts. A) Vignette depicting the secretion of mKate2 EVs from NIH-3T3 mKate2 cells (Donor cells) and their posterior internalization into profibrotic NIH-3T3 cells (Receptor cells). B) Live-cell images showing mKate2 100K-EVs (red spots) internalized into profibrotic NIH-3T3 cells, stained in green. Images were captured every 5 s for a total time of 10 min live-cell imaging. Blue arrows point to possible single internalization events. Scale bar: 10 μm. C,D) 4 panels images related to TGFβ (1 ng/mL) treated NIH-3T3 cell for 36 h, visualized 10 min after EVs administration of (C) 7.0x10¹¹ ± 4.0x10¹¹ mKate2 10K-EVs/mL or (D) 2.5x10¹¹ ± 8.5x10¹⁰ mKate2 100K-EVs/mL: - brightfield; - confocal microscopy image showing intrinsic fluorescence of mKate2 EVs (red dots); overlay of brightfield and fluorescence of mKate2 EVs; graphs showing the number of mKate2 EVs fluorescent dot count/cell using ImageJ software. n = 3-6 independent cells from cell culture (10x106 cells). E) Representative images of NIH-3T3 cell treated with TGFβ (1 ng/mL), from left to right: - bright field; - immunohistochemistry image visualized with confocal microscopy of Hsp90αβ detection; merge of same bright field and immunohistochemistry images.
Encapsulation of a new generation antifibrotic drug in 10K-EVs and 100K-EVs derived from mKate2 fibroblasts
Therapeutic molecules, including siRNA, miRNA, mRNA, protein-based drugs and chemical drugs can be encapsulated in EVs [32-35]. Encapsulation efficiency is a major challenge of cell-based encapsulating methods, where cargo is delivered into donor cells by cell endocytosis [36], and non-cell-based encapsulating methods, including direct electroporation, sonication, incubation, and transfection of EVs [37]. Despite, the low amount of therapeutics present in EVs, EVs display similar therapeutic effects to those achieved by conventional drug delivery methods [38]. We aim to investigate whether 10K-EVs and 100K-EVs secreted by mKate2 NIH-3T3 fibroblasts would enable the loading of therapeutic molecules and be able to be exploited as biologic drug nanocarriers. For this purpose, we employed the non-cellular encapsulation method of electroporation for the prototype drug CTPRAu (therapeutic protein-Au nanomaterial hybrid) previously tested by our group as an antifibrotic drug [25] (Figure 3A). 1 mM of CTPRAu in PBS was electroporated into EVs (10.0x10¹⁴ EV/mL) by 3 pulses of 400 mV. The experimental set up and fluorimetric detection of EVs, after washing away the supernatant containing the unencapsulated CTPRAu, were evaluated and results are shown in Figure S3A-E. Figure 3B shows the analysis of the number of CTPRAu containing-EVs from the total EVs population (blue spots) using Macs protocol adapted to detect EVs by cytometry. The area under the curve (AUC) of Figure 3B indicates the percentage of CTPRAu loaded in the EVs of a representative assay. After encapsulation, the total EV concentration was of 8.4x10¹⁴ ± 1.6x10¹⁰ 10K EVs/mL and 5.1x10¹⁴ ± 3.3x10¹⁰ 100K EVs/mL (Figure 3C). From the total population shown in Figure 3C, we observed a significant higher percentage of encapsulation in the 100K-EVs (6.1% ± 3.9%) compared to the 10K-EVs (2.6 ± 1.7%) fraction (*p < 0.05) in seven independent encapsulation assays analyzed by flow cytometry (Figure 3D).
To determine if the loading of the EVs with the negatively charged CTPRAu (Z-potential = -25.25 ± 8.173 mV, and hydrodynamic diameter of 4.2 ± 0.5 nm) (Figure S3F-G) affects the previously calculated EV charge (-5.8 ± 1.2 mV for the mKate2 10K-EVs, and -8.4 ± 0.7 mV for the mKate2 100K-EVs) (Figure 1F). We analyzed the Z-potential of mKate2 10K-EV-CTPRAu and mKate2 100K-EV-CTPRAu. Values of -12.8 ± 1.2 mV, and -13.9 ± 2.5 mV for 10K-EVs and 100K-EVs, respectively, was observed (Figure 3E), indicating that CTPRAu loading into EVs reduced their Z-potential almost two-fold in both types of EVs compared to EVs devoid of CTPRAu (*p < 0.05).
As in Figure 1 C-D, we measured the diameter of the total population of EVs including the 2.6 ± 1.7% of 10K EVs and the 6.1% ± 3.9% of 100K-EVs that contained CTPRAu. The mean diameter of 10K-EVs and 100K-EVs populations were 126.6 ± 17.1 nm and 121.5 ± 5.7 nm, with the largest populations measuring 159.0 ± 2.2 nm and 92.0 ± 1.4 nm, respectively (Figure 3F). Transmission Electron Microscopy (TEM) images of samples containing mKate2 10K-EVs-CTPRAu and mKate2 100K-EVs-CTPRAu showed that the morphology of these populations remained unchanged after electroporation and ultracentrifugation (Figure 3G).
To confirm the successful delivery of CTPRAu inside TGFβ-activated NIH-3T3 cells, by CTPRAu containing EVs, CTPRAu was detected by confocal microscopy through the fluorescence of the nanomaterial [25] and colocalization with EVs (mKate2 fluorescence) was determined (Figure 3H). To this end, 4x10⁴ ± 1x101 TGFβ-activated NIH-3T3 cells were treated with 2.5x10⁹ ± 8.5x10⁸ EVs/mL mKate2 100K-EV-CTPRAu; the 100K-EV fraction was chosen because of its better encapsulation efficiency compared to 10K-EVs (Figure 3D). Figure 3H shows a representative example of mKate2 100K-EV-CTPRAu detection in TGFβ-activated NIH-3T3 cells, by confocal microscopy. As in Figure 2C-D, ImageJ software filters were utilized to quantify EVs and CTPRAu by their fluorescent signal intensity (Figure S4A-B). The lower panels of Figure 3H showed mKate2 100K-EV colocalizing with CTPRAu shown by detecting colocalization of both the fluorescent signals and their spectra. Figure S4C showed the analysis to detect the colocalization of EVs (red fluorescence) and CTPRAu (blue fluorescence) showing the spectra of both particles. We quantified the number of internalized mKate2 100K-EVs-CTPRAu in cells from 3 independent assays (Figure 3I). We detected similar internalization values for mKate2 100K-EVs-CTPRAu as for unloaded (CTPRAu void) mKate2 100K-EVs (97.7 ± 34.9 EVs/cell) (Figure 3I). 18.0 ± 13.9 CTPRAu/cell were visualized, of which 4.3 ± 2.1 CTPRAu/cell were co-localized with mKate2 100K-EVs (Figure 3I), 36 h after EV administration onto TGFβ-activated NIH-3T3 cells. To confirm the presence of CTPRAu inside active fibroblasts (10x106 ± 1x10³) transported by mKate2 EVs, we measured the gold content per cell by ICP-MS. The results showed 0.11 ± 0.04 pg of Au/cell treated with 10K-EV and 0.11 ± 0.05 pg of Au/cell that were administered by 100K-EV (Figure 3J).
Figure 3
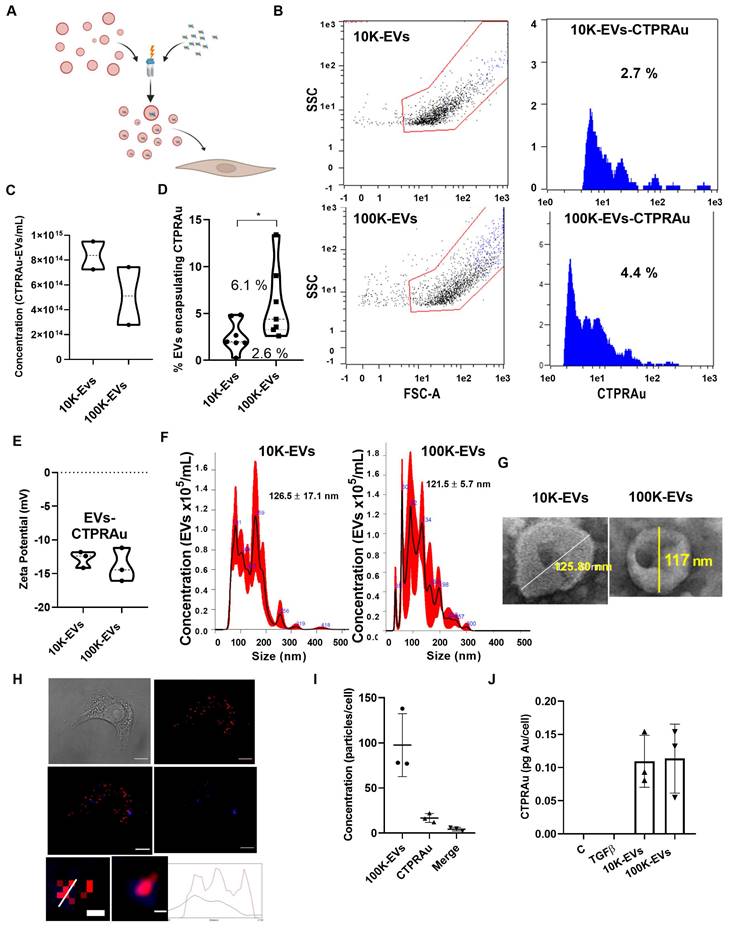
Internalization of mKate2 10K-EVs-CTPRAu and mKate2 100K-EVs-CTPRAu in NIH-3T3 cells. A) Cartoon depicting the encapsulation of CTPRAu in m-Kate EVs and its delivery to TGFβ-activated NIH-3T3 cells. B) Flow cytometry analysis of a representative assay showing the percentage encapsulation of CTPRAu (blue spots and blue area under the curve) in mKate2 10K-EVs (2.7%) and mKate2 100K-EVs (4.4%) after electroporation. C) Violin plot indicating the concentration of EVs (nº of EVs/mL) obtained after encapsulation of CTPRAu. D) Violin plot showing significant differences (*p < 0.05, Mann Whitney test) in percent encapsulation of CTPRAu in mKate2 10K-EVs compared to mKate2 100K-EVs. The results shown are the mean value of 7 independent flow cytometry assays. E) Charge measurements at a distance from the particle (zeta potential) in mV in both types of EVs after CTPRAu encapsulation, mKate2 10K-EVs-CTPRAu and mKate2 100K-EVs-CTPRAu; n = 3 independent experiments. F) NTA measurements of the concentration and distribution of populations in both types of EVs after CTPRAu encapsulation, mKate2 10K-EVs-CTPRAu (left panel) and mKate2 100K-EVs-CTPRAu (right panel); in red the standard deviation of the mean value; n = 4 independent samples measured. G) Representative electron microscopy images of mKate2 10K-EVs-CTPRAu and mKate2 100K-EVs-CTPRAu. The lines indicate the diameter of the EVs in nm. H) Four panels depicting a TGFβ-activated (1 ng/mL) NIH-3T3 cell treated with mKate2 100K-EV-CTPRAu: - brightfield; - confocal microscopy image of mKate2 100K-EVs (red fluorescence); - confocal microscopy image of CTPRAu (blue fluorescence); - merge image of the red and blue fluorescence confocal images. Scale bar: 10 μm. The bottom two panels show a detail representative detail of mKate2 100K- EV-CTPRAu in activated-NIH-3T3 cells pixelated and unpixelated where the red/blue fluorescent signals are merged indicating detection of a mKate2 100K-EV that has encapsulated CTPRAu. Scale bar: 40 nm. Bottom graph showing the variation of fluorescence intensities (red and blue) along the diameter line of the mKate2 100K-EV-CTPRAu. I) Quantification of red and blue fluorescent spots to show the number of mKate2 100K-EVs, mKate2 100K-EV-CTPRAu and CTPRAu molecules detected in NIH-3T3 cells activated with TGFβ (1 ng/mL) and treated with mKate2 100K-EV-CTPRAu. ImageJ software used for quantification (n = 3). J) Quantity of Au detected in mKate2 10K-EVs-CTPRAu and mKate2 100K-EVs-CTPRAu by ICP-MS; results shown are the mean value of 3 independent assays.
To test that 10K-EVs and 100K-EVs are not toxic nanocarriers, and in accordance with the MISEV2018 guidelines, which recommend to systematically report the level of cell viability in cultured cells producing or capturing EVs [5]; we analyzed the cell number in both basal mKate2 NIH-3T3 fibroblasts secreting EVs and TGFβ-activated NIH-3T3 fibroblasts receiving EVs. In both cases, we observed cell proliferation during the assay with a three-fold increase in secreting cells during the 5 days of EVs secretion (Figure S4D). Importantly, the cell number was also unaffected by the administration of EVs or EVs containing the CTPRAu drug, with around 8x10⁵ cells per well in control, TGFβ-activated, or TGFβ-activated-treated with EVs at 36 h post EV administration (Figure S4E). These results showed that cell viability measurements did not reflect any decrease in normal proliferation rates after administration of mKate2 EVs-CTPRAu, nor did the secreting mKate2 EVs. Moreover, we previously demonstrated that direct administration of CTPRAu was not toxic to TGFβ-activated NIH-3T3 cells [26].
We showed that 10K-EVs and 100K-EVs secreted by mKate2 NIH-3T3 fibroblasts were uptaken by TGFβ-activated fibroblasts. Simultaneously, we observed mKate2 EVs transported CTPRAu to the target cells. Although electroporation of EVs altered the charge and size distribution of EVs, the diameters of the most abundant population in both the 10K-EV and 100K-EV fractions were unaffected. The changes observed in the nanocarriers did not alter their internalization capacity in profibrotic fibroblasts.
Antifibrotic action of mKate2-EVs-CTPRAu
Collagen Ia1 (COL I), collagen IIIa1 (COL III), and fibronectin-1 (FN I) are known to be the main fibers overexpressed and accumulated in the extracellular matrix during stressful profibrotic events [39]. Therefore, they can be utilized as specific molecular markers of fibrosis. Thus, the detection of mRNA expression levels of these molecules by qPCR can be a reliable assay to verify the cellular production of profibrotic markers after administration of exogenous particles. We aimed to determine whether administration of mKate2 10K-EVs-CTPRAu and mKate2 100K-EVs-CTPRAu could efficiently reduce fibrosis at the molecular level by measuring the mRNA expression of these three markers in TGFβ-activated receptor fibroblasts.
We separately measured the antifibrotic activity of mKate2 10K-EVs and mKate2100K-EVs in fibrotic fibroblasts. In addition, EVs alone have shown to have therapeutic action in different studies [40], therefore, we also analyzed the antifibrotic effect of unloaded-EVs. COL I, COL III, and FN I mRNA expression was measured in TGFβ-activated NIH-3T3 (4x10⁴ ± 1x101) treated with CTPRAu loaded and unloaded mKate2 100K-EVs (7.0x10⁹ ± 4.0 x10⁷ EVs/mL) or CTPRAu loaded and unloaded mKate2 100K-EVs (2.5x10⁹ ± 8.5x10⁷ EVs/mL). Three assays with three independent qPCRs per condition and each condition measured in triplicate were used to assess the variation of COL I, COL III and FN I gene expression. Our previous research demonstrated that the reduced transcript levels of COL I, COL III, and FN I indicate down-regulation of the profibrotic signaling cascade in TGFβ-activated fibroblasts and therefore a reduction of pathogenic fiber accumulation in the extracellular matrix [16].
Figure 4A-B showed a significant reduction of COL I mRNA levels mediated by 10K-EVs-CTPRAu (**p < 0.005) and by 100K-EVs-CTPRAu (***p < 0.0005), COL III by 10K-EVs-CTPRAu (*p < 0.05) and by 100K-EVs-CTPRAu (****p < 0.0001) and of FN I (*p < 0.05) by both EV fractions, 36 h after EV addition to activated NIH-3T3 cells. We did not find an antifibrotic effect in cells treated with mKate2 10K-EVs (Figure 4A). In contrast, we observed an antifibrotic effect in cells treated with mKate2 100K-EVs (Figure 4B) shown by significant reduction of COL I (*p < 0.05). Moreover, we observed a greater downregulation of COL I (***p < 0.0005), and COL III (****p < 0.0001) in fibroblasts treated with mKate2 100K-EVs-CTPRAu (Figure 4B) than the reduction obtained for COLI (*p < 0.05) and COL III (**p < 0.005) in fibroblasts treated with 10K-EVs-CTPRAu (Figure 4A). The difference in the level of reduction by the two different EV fractions could be due to the higher percentage of mKate2 100K-EVs that successfully encapsulated CTPRAu (Figure 3B-D), a significant different efficacy of mKate2 100K-EVs over mKate2 10K-EVs as an antifibrotic treatment itself p < 0.05* (Figure 4B), or both.
Figure 4
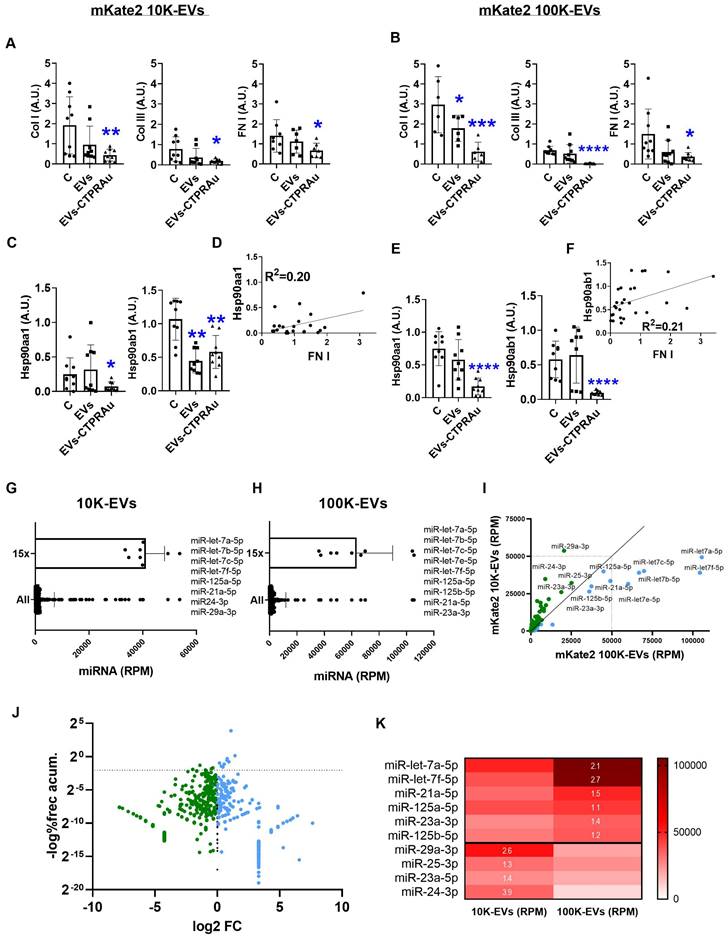
Down-regulation of profibrotic markers after mKate2-CTPRAu EVs treatment of TGFβ-activated NIH-3T3 cells. Analysis of miRNA content of mKate2 EVs. A,B,C,E) Relative gene expression of COL I, COL III, FN I, Hsp90aa1 and Hsp90ab1 36 h after treatment of TGFβ (1 ng/mL) activated NIH-3T3 (4x10⁴) with mKate2 EVs or mKate2 EVs-CTPRAu. (A,C) treatment with mKate2 10K-EV/mL or mKate2 10K-EVs-CTPRAu/mL (7.0x10⁹ ± 4.0 x10⁹) (B,E) treatment with mKate2 100K-EV/mL or mKate2 100K-EVs-CTPRAu/mL (2.5x10⁹ ± 8.5x18). Significant variations were normalized with respect to the internal control (GAPDH gene). Experiments, n = 6-9 assays from n = 3 independent experiments. Mann-Whitney test: *p < .05, **p < .005, ***p < .0005, ****p < .0001; D,F) Linear regression and Pearson correlation analyses showing positive and significant correlation between Hsp90aa1 and FN-1 (Y = 0.1401 * X + 0.01194) (D); Hsp90ab1 and FN I (Y = 0.2026 * X + 0.543) (F) gene expression in TGFβ (1 ng/mL) activated NIH-3T3 cells and treated with mKate2 10K-EVs, or mKate2 10K-EVs CTPRAu. G,H) Bar graph with values of total microRNA (All) and values corresponding to miRNAs 15 times the mean (15x) in mKate2 10K-EVs (G) and mKate2 100K-EVs (H) and in reads per million (RPM). I) XY plot representing all miRNAs tested with a clear visualization of the highest RPM values obtained in mKate2 10K-EVs (green dots) and in mKate2 100K-EVs (blue dots). J) Volcano plot representing the distribution of miRNAs presence highlighting the most abundant and differentially concentrated in mKate2 10K-EVs (green dots) or mKate2 100K-EVs (right) with Y-axis showing the logarithm of the complement of the percentage associated with the cumulative frequency of RPM for each miRNA, and the X-axis showing the log2 of the fold change (FC). Above the dot line a similar distribution as in I panel can be observed. K) Heat map (in RPM) of the selected miRNAs from G and H (15x values) and corresponding to the miRNAs with more than 1.2-fold change (FC) abundance (white numbers inside red boxes indicate FC) in 100K-EVs vs 10K-EVs (upper values) or 10K-EVs vs 100K-EVs (lower values).
As we previously reported, TGFβ-triggered fibrosis in NIH-3T3 by activating the expression of novel TGFβ signaling pathway molecules, including TGFβ's membrane receptors (TGFβRI and TGFβRII), and associated binding partners such as Hsp90 and key cytosolic secondary messengers. These molecules drive the profibrotic signal to the cell nucleus, ultimately leading to the expression and secretion of profibrotic molecules [41]. Among them, Hsp90 has been consistently identified by our group and others as a protein involved in fibrosis progression [16, 42, 31] and has been defined as a target for decreasing fibrotic processes with gene expression modifications in fibrotic models [25]. For this reason, we evaluated the expression of the cytosolic isoforms of Hsp90, Hsp90α stress inducible isoform and Hsp90β constitutively active isoform, in study (Figure 4C-E).
Previously, we described CTPRAu as an inhibitor of Hsp90 in vitro and in vivo [25-26]. Accordingly, here we detected a significant reduction in Hsp90 transcript levels of both isoforms in TGFβ-activated fibroblasts treated with mKate2 10K-EVs-CTPRAu, and a highly significant reduction (****p < 0.0001) by mKate2 100K-EVs-CTPRAu, 36 h after administration of EVs on TGFβ-activated fibroblasts (Figure 4C-E). Notably, both isoforms of Hsp90 are largely reduced (****p < 0.0001) in the presence of 100K-EVs-CTPRAu but not when mKate2 100K-EV are not loaded with CTPRAu (Figure 4E). This result indicates that inhibition of Hsp90β by CTPRAu is affecting its mRNA expression. In contrast, the lower number of 10K-EVs encapsulating CTPRAu (2.6 ± 1.7%) could be behind the absence of significant differences in the reduction of Hsp90ab1 gene expression between mKate2 10K-EVs and mKate2 10K-EVs-CTPRAu treatments (Figure 4A).
To determine whether Hsp90α and/or Hsp90β could serve as new efficacy markers of an antifibrotic treatment using fibroblast-derived EVs, we performed correlations between the mRNA of classical markers studied, such as COL I, COL III and FN I, and the mRNA of both cytosolic isoforms of Hsp90 (Hsp90α and Hsp90β). To this end, gene expression values from the assays shown in Figures 4A-E were analyzed together to test for correlative events. Significant positive correlations were found between Hsp90α (Hsp90aa1 gene) and FN I gene expression in TGFβ-activated fibroblasts treated with mKate2 10K-EVs with and without CTPRAu encapsulation (R2 = 0.20) (Figure 4D). In the case of mKate2 100K-EVs with and without CTPRAu encapsulation correlation was found between Hsp90β (Hsp90ab1 gene) and FN I (R2 = 0.21) (Figure 4F). However, we could not find any correlation between the other profibrotic markers.
These results indicated that mKate2 EVs can efficiently transport CTPRAu into target cells to exert antifibrotic actions. Additionally, the correlation between the expression of Hsp90α and Hsp90β, and FN I suggested that these proteins have the potential to become biochemical markers of the antifibrotic effect of CTPRAu delivered by 10K-EVs and 100K-EVs.
EVs miRNA content related to the antifibrotic action of mKate2 100K-EVs
EVs contain a variety of bioactive molecules, including proteins and nucleic acids (such as miRNAs) which contribute to cell function. MiRNAs are important components of EVs which mediate many of their functional effects. Thus, their detection offers key information regarding cell function regulation. We analyzed the miRNAs content of mKate2 100K-EVs and mKate2 10K-EVs. From the total 681 miRNA detected in mKate2 10K-EVs and the total 515 miRNAs detected in mKate2 100K-EVs, we found that 455 miRNAs were common in both type of EVs. 96 miRNAs were uniquely present in mKate2 10K-EVs and 130 were present only in mKate2 10K-EVs. These type-specific miRNAs were in very low number of reads suggesting a low likelihood of having a key role in the effect of the EVs on cell behavior (Figure S5). We detected a pool of 10 miRNAs (miR-let-7a-5p, miR-let-7b-5p, miR-let-7c-5p, miR-let-7e-5p, miR-let-7f-5p, miR-125a-5p, miR-125b-5p, miR-21a-5p, miR-23a-3p, miR-25-3p) in mKate2 100K-EVs; and a pool of 11 miRNA (miR-let-7a-5p, miR-let-7b-5p, miR-let-7c-5p, miR-let-7e-5p, miR-let-7f-5p, miR-125a-5p, miR-125b-5p, miR-21a-5p, miR24-3p, miR-25-3p, miR-29a-3p) in mKate2 10K-EVs as the most abundant (15x fold over the mean values of miRNA general content) (Figure 4G-H). Within these abundant miRNAs, Figure 4I-K highlighted miR-let-7a-5p and miR-let-7f-5p above 2-fold change in mKate2 100K-EVs vs mKate2 10K-EVs. In previous studies, treatments with miR-let-7a-5p were pointed as an efficient suppressor of fibrosis via reducing TGFβ/SMAD signaling pathway [43]. The other highly abundant miRNA and differentially present in mKate2 100K-EVs compared to 10K-EVs was miRNA miR-let-7f-5p whose defined experimental target is TGFβ-R3 [44]. This is a membrane proteoglycan and TGFβ regulator that often functions as a co-receptor with the ability of modulate TGFβ receptors I and II, and its pro-fibrotic signaling cascade. Moreover, miRNA let-7f downregulates PI3K signaling pathway in fibrosis via targeting of PIK3 [45]. Regarding miRNAs with high abundance and 1.3-1.4 FC (Figure 4K) were miR-23a-3p that also participate in the antifibrotic process by attenuating the fibrosis response [46], and miR-21a-5p and miR125b-5p, which have not previously been described to have antifibrotic activity. The abundant and differential presence of these miRNAs could be part of the antifibrotic differences observed between mKate2 100K-EVs and mKate2 10K-EVs.
Below, we described the over-accumulated miRNA in mKate2 10K-EV compared to mKate2 100K-EV.
In vivo detection of EVs and CTPR cargo in target organs
As we previously demonstrated, in vivo fluorescent detection of drugs in animal models is an important tool to define the systemic behavior of new generation active antifibrotic molecules [16, 25]. The previously reported CTPRAu consists of a protein-nanomaterial hybrid in which Au nanoclusters are stabilized by a metal binding domain based on a CTPR protein mutated to display several cysteines, which was fused the Hsp90-inhibiting module CTPR390. Herein, with the purpose of obtaining a bioluminescent CTPR (bCTPR) that would be compatible with the simultaneous detection of fluorescent EVs, we took advantage of the modularity, stability, and versatility of CTPR repeat proteins and fused CTPR390 and a metal-coordination domain similar to the one present in CTPRAu with NanoLuc luciferase (Figure 5A). NanoLuc was selected as bioluminescence source because it produces high intensity and glow-type luminescence. Additionally, it also presents excellent thermal and pH stability, conserving its activity at temperatures up to 55˚C and in a pH range between 5 and 7 [47]. The purification of bCTPR was confirmed by MALDI-TOF and SDS-PAGE electrophoresis (Figure S6A-B). Moreover, the CD spectrum of bCTPR exhibited the signature α-helical signal for CTPR proteins (Figure S6C), and thermal denaturation curves confirmed the outstanding thermal stability of the designed protein (Figure S6D-E). Figure 5B shows that the fusion of NanoLuc to CTPR did not affect its typical bioluminescence emission. The multifunctional bCTPR also showed good stability in biological media (mouse plasma) (Figure 5C) and in vitro (Figure S6F). The biocompatibility was studied by incubating bCTPR in mouse plasma at the same concentration used for in vivo assays, and it was verified that after 2 h, time point at which the bioluminescence is analyzed in vivo, the bCTPR kept around 81 ± 6% of the initial bioluminescence, maintaining its luminescence until the end of the assay (Figure 5C). In addition, the in vitro biocompatibility of the CTPR was evaluated in cell cultures. NIH-3T3 fibroblast cells were incubated with different concentrations of bioluminescent CTPR under standard cell culture conditions. Following 4 and 24 h of incubation, bCTPR did not present any evident cytotoxicity even at the highest concentration tested (Figure S6F).
To study the in vivo therapeutic effect of EV-encapsulated CTPRAu, the ability of the biotransporters to be imaged in vivo, and whether there was an improvement of the CTPRAu biodistribution, mKate2 EVs CTPRAu were administered to a fibrosis mouse model. To induce heart and lung fibrosis, mice were continuously infused with Ang II for 15 days through a subcutaneous osmotic mini-pump (minipump of Ang II (1.5 mg/kg per day). Sham mice were implanted with a minipump of saline solution. The hypertension promoted by Ang II generated mechanical damage in the heart and lungs as we shown in Figure 5K and Figure 5N. In addition to mechanical stress, Ang II activates pathological remodeling to end-organ damage in the short term. These reparative mechanisms, mainly fibrosis, in the long term, can lead to organ dysfunction, and in the worst-case scenario organ failure [48-49].
Herein, we used a procedure similar to the one recently described by our group [42] to detect fluorescence and bioluminescence signals in vivo. Figure S7 showed detailed description of the IVIS configuration procedure that allowed a clear signal from EVs and bCTPR. To define the most accurate excitation/emission setup, the fluorescence emission was assessed at different excitation wavelengths spanning from 660 nm to 780 nm and distinct emission wavelengths, 710 nm to 845 nm, followed by subtraction of the autofluorescence background (Figure S7A-B). In vivo (abdominal and thoracic areas) and ex vivo (selected organs) delimitations of Regions of Interest (ROI) are shown on Figure S7C-D.
Figure 5
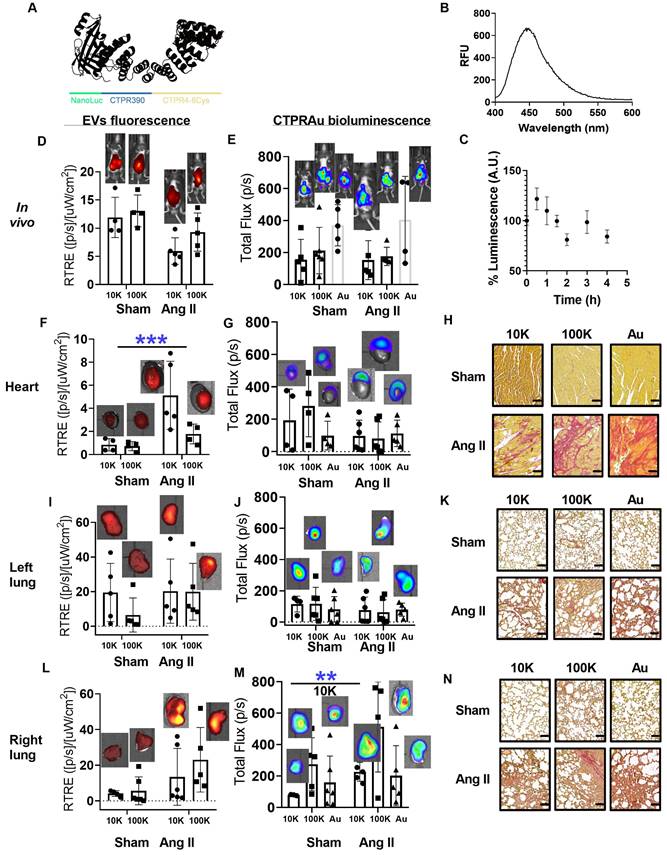
Detection of mKate2 EVs and bCTPR/CTPRAu in vivo and ex vivo in target organs. A) Schematic representation of the novel protein engineered by fusing NanoLuc with CTPR390 and a cysteine-based metal binding module to generate bCTPR. B) Luminescence spectrum of the generated chimeric bCTPR protein (3.8 μM) in the presence of substrate (FFz, 1 μM). C) Graph showing the stability of bCTPR luminescence (in mouse plasma at 37 °C) for 4 h. (D,E,F,G,I,J,L,M) Bar graphs with representative detections of in vivo (D,E) and ex vivo (F,G,I,J,L,M) EVs and bCTPR signals in Ang II group (fibrotic mice with Ang II minipump (1.5 mg/kg per day)) and sham group (healthy mice with saline minipump); n = 4 mice per group. Fluorescent signals were detected 2 h after intraperitoneal administration of 10K EV-bCTPR:CTPRAu/mL (10K) (6.8x10¹¹ ± 1.6x19) and 100K EVs-bCTPR:CTPRAu/mL (100K) (4.1x10⁹ ± 3.3x10⁸) to mice. Fluorescence of mKate2 EVs was detected in live mice, left ventricles of the heart, left lung, and right lung, respectively; n = 4 per group (D,F,I,L). Each point in the graphs corresponded to the relativized total radiant efficiency (RTRE) of the fluorescent signal of mKate2 EVs administered to mice (p/s)/(μWcm2). Each point in the graphs corresponded to the total flux in units (p/s) pertaining to the bioluminescent signal of bCTPR:CTPRAu (1:10) encapsulated in mKate2 EVs or freely administered. Bioluminescence of bCTPR:CTPRAu (1:10) was detected in live mice, left ventricles of the heart, left lung and right lung, respectively (E,G,J,M); n = 4 per group. Statistically significant variations correspond to **p < 0.005 Mann-Whitney test. (H,K,N) Picrosirius red staining showed fibrosis in longitudinal sections of the heart (H), left lung (K), and right lung (N) in all conditions studied (Sham and Ang II mice treated with mKate210K-EVs-bCTPR:CTPRAu, mKate2 100K-EVs-bCTPR:CTPRAu and CTPRAu. Scale bar: 100 μm.
Picrosirius red and Masson's trichrome staining were used to assess diffuse fibrosis in selected organs of Ang II-treated mice (Figure S7E). Figure S7F showed control and fibrotic heart and lungs staining for collagen in histologic preparations using Picrosirius red and Masson's trichrome. We selected the time point after intraperitoneal administration of mKate2 EVs at which in vivo fluorescent signal in the thoracic area was the highest. Figure S7G displayed the fluorescence intensity in the abdominal area (place of absorption) and thoracic area (place of interest where the heart and lungs are located) at different time points (t = 0 h, 30 min, 1 h, 2 h, and 2 h 30 min). We highlighted that the highest fluorescent intensity from EVs was achieved 2 h after EV administration and started decreasing 2 h 30 min after (Figure S7G). We previously demonstrated that a single intraperitoneal administration of free CTPRAu (1.0 mg/g mouse body weight), accumulated in fibrotic hearts of mice 7 days after the CTPRAu administration [25]. The encapsulation of CTPRAu hybrids in EVs and its use as a biological therapeutic system aims to facilitate a faster accumulation of the drug in the target organs, compared to free CTPRAu administration. The presence of bioluminescent bCTPR and fluorescent EVs was evaluated in vivo in Sham (healthy) and Angiotensin II (Ang II) (fibrotic) mice. Bioluminescent CTPR was mixed with CTPRAu (bCTPR:CTPRAu) in a 1:10 ratio and encapsulated in mKate2 10K-EVs and mKate2 100K-EVs or administered free (non-encapsulated). CTPRAu and bCTPR are built on a similar protein scaffold that enables bioluminescence detection of EVs cargo without changing its structure. Using 1:10 bCTPR: CTPRAu ratio enables the detection of the system in vivo fluorescently (EVs) and bioluminescently (bCTPR:CTPRAu). Thus, the combination of bCTPR with CTPRAu allowed simultaneous bioluminescent tracking of the therapeutic cargo and fluorescent tracking of the EVs. In vivo and ex vivo colocalization of EVs and the encapsulated drug was visualized by superimposing fluorescence images of EVs and bioluminescence images of bCTPR in Figure 5D-M. We evaluated the fibrosis generated in the heart (Figure 5H) and lungs (Figure 5K-N) of Ang II mice, and showed the healthy heart and lungs of Sham mice as control tissues. Note that 2 h after treatment with EV-bCTPR:CTPRAu no significant reduction in fibrosis was observed (Figure 5H-N and Figure S7F). This is in agreement with previous studies showing evident antifibrotic effects one week after administration of CTPRAu, with no significant reduction in fibrosis 3 h after CTPRAu administration [25].
To verify whether the encapsulation of CTPRAu in EVs could improve the previously observed low accumulation of CTPRAu in highly irrigated organs such as the heart and lungs [25], we compared the ex vivo signal intensity of the EVs-encapsulated, and free bCTPR:CTPRAu in these organs. Ex vivo measurements revealed that fibrotic mice showed significant accumulation of large EVs in the heart (***p < 0.0005) (Figure 5F). Interestingly, the drug encapsulated within mKate2 10K-EV appeared to accumulate in the upper zone of the heart, corresponding to the atria, giving no significant values when analyzing the total flow of the whole heart but offering significant accumulation of the drug transported in the analysis of the atrium separately (Figure 6A). In addition, we detected accumulation of bCTPR when transported by mKate2 10K-EVs in the right lung (**p < 0.005) (Figure 5M) but not in the left lung (Figure 5J). The mouse right lung has four lobes, and the left lung has one lobe. This difference in the number of lobules may be responsible for the observed differences in terms of cargo accumulation between right and left lungs at this specific time-point. An important observation from these assays is the ability of mKate2 10K-EVs to act as a nanotransporter of the drug to the destination in a short time (2 h) with a significant accumulation (**p < 0.005) of the antifibrotic drug in the fibrotic right lung and accumulation of the mKate2 10K-EVs in the heart. However, it is worth noting that no significant increase in the fluorescent signal from mKate2 10K EVs or in the bioluminescence signal from the bCTPR was observed in the fibrotic left lung.
EVs miRNA content related to the increased targeting action of mKate2 10K-EVs
Within the abundant and differentially increased miRNAs detected in mKate2 10K-EVs vs mKate2 100K-EVs (Figure 4K), miR-24-3p was the most differentially present with a 3.9-fold in mKate2 10K-EVs compared to mKate2 100K-EVs. It has been described that in vivo, EVs containing miR-24 reached damaged hearts with infarct areas improving heart function. Therefore, transferring miR-24 in a paracrine manner through EVs reached the heart providing protective effects against damaged myocardium [50]. The capability of targeting the cardiac endothelium by miR-24 in myocardial infarction has also been previously reported [51]. We observed that fibrotic lung also accumulated mKate2 10K-EVs. Smad2 is a direct target of miR-24. Smad2 becomes a participant in transforming growth factor-β/Smad signaling fibrotic events in skeletal muscle fibrosis. Skeletal muscle fibrosis is a common feature in lung fibrosis [52]. Another miRNA over 2-fold in mKate2 10K-EVs vs. mKate2 100K-EVs is miR-29a-3p (Figure 4K). Since miR-29a-3p has been described as a mayor regulator of genes associated with lung and heart fibrosis [53-54], it would not be surprising that it would target these organs. The other two miRNAs with FC over 1.3 were miR-25-3p (1.3 FC) suggested as a promising molecule for heart regeneration whose target is related to cardiomyocyte proliferation in the heart [55], and lung [56]; and miR-23a-5p (1.4 FC) also associated with proliferation and overexpressed in damaged lungs [57] and targeting PI3K/AKT signaling pathway in the heart [58]. The involvement in regulatory mechanisms related to the heart and lung of these miRNAs could help mKate2 10K-EVs to target these organs. From the rest of the miRNAs, 96 were detected only in mKate2 10K-EV (Figure S5) but the low number of reads detected would not indicate a key role in modifying cell behavior.
Figure 6
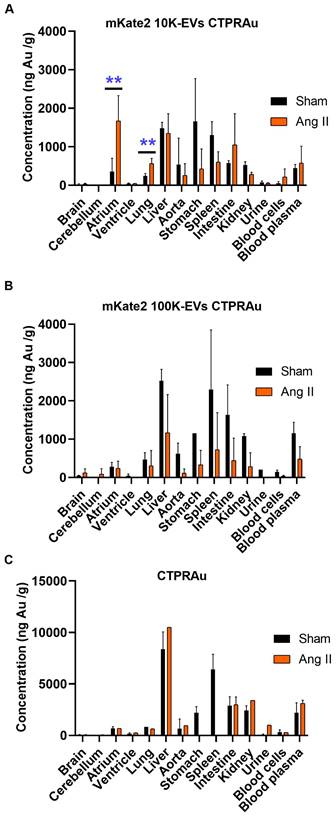
In vivo biodistribution of bCTPR/CTPRAu drug. Au concentration in mice tissues (ng Au/g of tissue) were detected by ICP-MS in samples obtained 2 h after administration of bCTPR/CTPRAu (A) Drug encapsulated in mKate2 10K-EVs, (B) Drug encapsulated in mKate2 100K-EVs, or (C) Drug administered free to healthy (Sham) and fibrotic (Ang II) mice. Data with standard errors from n = 3 measurements of each tissue belonging to all animals studied in Figure 5. Statistically significant variations correspond to **p < 0.005 Mann-Whitney test.
Biodistribution of the drug CTPRAu after administration free or encapsulated in EVs
Current in vivo biodistribution results of EVs in mice are extremely heterogeneous depending on various factors such as EV doses, routes of administration, time points analyzed, tracking methods, EV isolation techniques, and EV size range [59]. Therefore, it is crucial to provide robust biodistribution data. In this study, we performed unequivocal detection of the drug loaded in EVs, taking advantage of the presence of the non-biological metal gold in the CTPRAu. We quantified the amount of Au in different organs 2 h after intraperitoneal injection by ICP-MS (Figure 6). We verified that the ex vivo fluorescent signal detected in the heart and lungs belonged to EVs carrying drug (Figure 5D, Figure 5F, Figure 5I and Figure 5L) and that the ex vivo bioluminescent signal belonged to drug detection (Figure 5E, Figure 5G, Figure 5J, and Figure 5M) by quantifying the gold of the drug loaded in the EVs that reached the heart and lungs of all mice studied. We also provided information on drug accumulation in other organs such as brain, cerebellum, liver, aorta, stomach, spleen, intestine, kidney, blood cells, and internal media such as plasma and urine, of healthy and Ang II-treated mice (Figure 6).
We confirmed that both mKate2 10K-EVs and mKate2 100K-EVs were able to transport the drug encapsulated in them to different organs in healthy and fibrotic mice. Although the biodistribution patterns of drug transported in 10K-EVs and 100K-EVs are similar in healthy mice, in vitro results showed that 100K-EVs are better nanocarriers with higher antifibrotic efficiency. However, the transport of mKate2 10K-EVs is more efficient at achieving early accumulation in the atria and lung. Figure 6A-B showed the increased potential of fibroblast-derived mKate2 10K-EVs compared to mKate2 100K-EVs to reach and accumulate CTPRAu in the atria and lung compared to healthy controls (**p < 0.005). A comparison of the cargo in terms of miRNA contents revealed a significantly higher presence of miR-24 in mKate2 10K-EVs. Being miR-24 direct target (Smad2), overexpressed in fibrotic heart and lung, could be one of the explanations for the difference in biodistribution patterns. Related to the protein content, we observed Hsp90 significantly augmented in mKate2 10K-EVs compared to mKate2 100K-EVs. Numerous client proteins of Hsp90 have been identified in known cardiac and lung disease pathways, including MAPK signaling, PI3K/AKT (PKB)/mTOR, and TNF-α signaling [60].
We obtained similar results to those of a few studies investigating the biodistribution of large EVs administrated by intravenous injection, showing that EVs rapidly localized to lungs, liver, spleen and kidneys [61]. Here, we demonstrated the presence of EVs in the same organs and in addition, were detected in the stomach and intestine, probably due to the intraperitoneal route of administration. Notably, the drug carried by 10K-EVs (Figure 6A) but not by 100K-EVs (Figure 6B) or freely administrated (Figure 6C) was present in significant amounts in the heart and lung of fibrotic mice 2 h after administration. Moreover, CTPRAu transported by 100K-EVs (Figure 6B) or freely administrated was detected mainly in the liver in both control and fibrotic mice.
Discussion
In the present work, we have developed a biological drug delivery system based on trackable extracellular vesicles carrying within them a new generation antifibrotic drug. 100K fractions of fibroblast derived EVs were shown to have innate therapeutic activity on fibrosis models in vitro. Most significantly, 10K and 100K-EV fractions were able to effectively transport the antifibrotic drug to the disease tissue in vivo, thus demonstrating their biological carrier ability. In particular, NIH-3T3 fibroblasts were genetically manipulated to obtain fluorescently labeled EVs, which were further characterized in vitro and in vivo in terms of their cell internalization, accumulation in organs, as well as their antifibrotic activity once therapeutic drugs were encapsulated in these EVs. Fluorescent labeling of EVs allowed for ease of pharmacokinetic analysis in recipient cells [6], as well as in animal models, including the measure of their biodistribution, a critical characteristic for their potential clinical application [62]. Fluorescently label EVs can be successfully produced by genetic manipulating their cell of origin to express fluorescent proteins fused to membranes targeting peptides that would result in the membrane targeted localization of the fluorescent tag [63]. Alterations of the EV membrane can impact their physicochemical properties, surface protein profiles, and cellular uptake functions [64]. In this study, we demonstrated that the encapsulation of a protein-based drug into EVs by electroporation also changed the size, and Z-potential of EVs, but their transport capability was unaffected.
Healthy fibroblast-derived EVs, with a key role in the organization of the extracellular matrix, act as active messengers in higher-order biological functions in pathological tissues [65]. In terms of their biological characteristics, mKate2 NIH-3T3 EVs maintained paracrine behavior that allowed effective cell-cell communication and, in some cases, promoted essential physiological functions, as previously reported by others [65]. This claim is supported by the observed down-regulation of collagen in profibrotic NIH-3T3 cell model treated with mKate2 100K-EVs containing antifibrotic miRNAs.
EVs modifications have been successfully employed to improve their therapeutic characteristics [34]. In this way, the inherent therapeutic action of NIH-3T3 cell-derived 100K-EVs is linked to their carrier function, leading to an antifibrotic therapeutic action that is enhanced by the encapsulation of an antifibrotic drug, CTPRAu within the EVs. As such, the intrinsic antifibrotic action of mKate2 100K-EVs in vitro, including increased deregulation of a key profibrotic marker such as COL I and extending its effect to other important profibrotic fibers such as COL III and FN I, was further enhanced by encapsulating of CTPRAu into the mKate2 100K-EVs. The drug encapsulated mKate2 100K-EVs displays better in vitro antifibrotic activity than CTPRAu encapsulated in mKate2 10K-EVs. MiRNAs are key modulators of complex biological processes modifying cell function [43-46]. The increased abundance of antifibrotic miRNAs in mKate2 100K-EVs (miR-let-7a-5p and miR-let-7f-5p) or the reduced presence of profibrotic proteins such as Hsp90, compared to mKate2 10K-EVs demonstrated a multifactorial antifibrotic action. The higher ability of mKate2 100K-EVs to internalize CTPRAu drug (6.1% ± 3.9% of encapsulated drug for mKate2 100K-EVs vs. 2.6 ± 1.7% for mKate2 10K-EVs), better cellular internalization features of mKate2 100K-EVs (94.7 ± 22.2 mKate2 100K-EVs/cell vs. 50.5 ± 32.5 for mKate2 10K-EVs/cell), and/or the intrinsic antifibrotic behavior observed for mKate2 100K-EVs could explain the better antifibrotic activity of mKate2 100K-EVs compared to mKate2 10K-EVs in vitro. The encapsulation of the CTPRAu antifibrotic drug into EVs showcased the biological magnification of its therapeutic activity. This concept highlights the potential clinical applications of new-generation therapies, where the biological carrier itself contributes to the therapeutic activity of the drug. [66].
The presence of fluorescent markers indicated that target cells were incorporating the purified EVs. It is a challenge to develop models that can accurately predict drug delivery efficacy during treatment. As previously described in other mammalian cells [67], mKate2 EVs were visibly internalized by TGFβ-activated fibroblasts, and antifibrotic effect was observed, as measured by the reduction of COL I, COL III and FN I expression in target cells. In addition, we have provided a new potential marker that can be used to assess the effectiveness of EV-mediated antifibrotic activity.
The key regulator of proteostasis, Hsp90, involved in the correct folding of numerous proteins in eukaryotic cells [68], was shown to be a valuable profibrotic marker in various diseases [16, 42, 69]. We observed significant positive correlations between Hsp90 and FN I in both control and EV-treated activated fibroblasts. Fibronectin fibers are essential for the proper formation of the extracellular matrix, as they contribute to collagen deposition. They also are a key contributor of increased proliferation of profibrotic fibroblasts in heart-related [70] and lung-related [71] diseases, among others.
Interestingly, we found Hsp90 isoform-specific expression correlated with FN I expression, depend on the type of mKate2 EVs fractions used. Hsp90α (the stress-inducible Hsp90 isoform) levels correlated with FN I in cells treated with mKate2 10K-EVs, whereas Hsp90β (the constitutively active Hsp90 isoform) expression levels correlated with FN I levels in cells treated with mKate2 100K-EVs. Although both isoforms possess identical functional activities in chaperone complexes, Hsp90α are often overexpressed and secreted during cellular stress events [72], and they exhibit significantly different behavior with respect to substrate interactions under stress conditions [73]. One interesting link, is the fact that exogenous extracellular Hsp90 has been shown to increase incorporation of FN fragments into fibrils within the ECM, suggesting that Hsp90 may regulate FN matrix assembly through its interaction with N-terminal FN domains [74]. These observations merit further investigation to understand how the expression of Hsp90 isoforms would be crucial in evaluating diseases progression. The basic principle behind the future of personalized medicine is the targeted therapy administration and controlled release of therapeutic drugs. This study aimed to validate a biological method of administrating the therapeutic drug directly to the damaged organ or area, while minimizing the exposure of the rest of the body to the free drug. In this manner, therapeutic doses can be achieved at lower drug concentrations, avoiding side effects due to multi-target interactions, high drug doses, the associated toxicities, and the unnecessary exposure of healthy tissue to the therapeutic drug [75]. For a drug to effectively reach its intended target and positively affect the diseased tissue, it is desirable to design therapeutic systems that interact with a specific organ, cell, or group of cells. The drug carrier must be specially designed for efficient transport of the drug to the pre-selected diseased sites [76]. Ideally, a transporter-drug system is expected to be non-toxic, non-immunogenic, biochemically inert, biodegradable, biocompatible, and physico-chemically stable in vivo and in vitro. Furthermore, within the therapeutic system, the transporter should present a predictable and controllable pattern of drug release that closely mimics the endogenous release of molecules, including the characteristic of being easily and rapidly eliminated from the organism. In this way, the side effects of drugs, which are the main concern in most pharmacological interventions, could be mitigated. One possibility would be encapsulating drugs in effective selective biological nanocarriers, such as EVs [77]. Non-cell-based EV loading methods, also known as exogenous or direct loading, deposits a therapeutic cargo into EVs after isolation. The in vivo efficiency of encapsulated treatments depends on the percentage of encapsulation. Insertion of large amounts of drugs into EVs is still technically challenging [78]. In this study, we achieved low encapsulation rates of CTPRAu. Despite the low rates of encapsulation, the amount of CTPRAu present in EVs were still able to reduce fibrosis in vitro and successfully, reach and accumulate in target tissue, specifically the fibrotic atria of the heart and fibrotic lungs in vivo. Delivery of mKate2 EVs to the heart and lung occurred 2 hours after EV-administration. We hypothesize that distribution of the EVs to these organs is due, in part, to the high irrigation of the heart and lungs as compared to other organs and is less likely due to a specific target molecule that directs these EVs to the heart and lungs.
We describe the successful use of a versatile EV-based drug delivery system that enables in vitro reduction of fibrosis and in vivo detection of the nanocarrier and its encapsulated drug to fibrotic target organs. The precise targeting of EVs to the desired cell type or organ of interest remains a significant obstacle in the successful translation of EVs-based drug delivery systems, in addition to the of off-target drug biodistribution limitations. In vivo efficacy was obtained once the drug-containing EVs reached relevant organs such as lungs and heart. MicroRNA, proteins and the rest of the active molecules present in mKate2 10K-EVs could be behind the mechanism for obtaining a better targeting with this population of EVs, as we envisioned. Regardless of the route of administration and cell source, most systemically injected EVs are rapidly taken up by macrophages in the reticuloendothelial system and eliminated. Depending on the cell source, they could modulate macrophage response, either to promote pro-resolving macrophage phenotype that supports tissue repair [79], as occurs with EVs from cardiosphere-derived cells in myocardial infarction [80]; or to cause little or no effect, as occurs with mesenchymal stem cells-derived EVs in myocardial infarction [81], leading to EVs elimination. Drug delivery problems are largely limited to the pre-systemic distribution to the liver [82] and other elimination related organs, such as spleen and kidney, and could be addressed in preclinical assays by the administration of EVs. Time-dependent changes in EVs accumulation have been observed, consistently showing a significant presence of EVs in the liver shortly after administration [59]. Here we compared the administration of the free drug and its encapsulation in 10K-EVs and 100K-EVs and obtained a better pharmacokinetic biodistribution in organs related to drug elimination, with a clear and significant reduction of drug accumulation in organs such as liver, kidney, and spleen. We also observed a lower accumulation in organs related to gastrointestinal tract absorption, such as the intestine and stomach, after intraperitoneal administration. After systemic administration, such as the intraperitoneal injection used in these studies, we and others [83] have demonstrated that 100K-EVs are rapidly (2 h) cleared from the blood circulation and accumulate in the spleen, liver, kidney, and gastrointestinal tract [59].
The detection of 10K-EVs exhibited a significantly higher presence in the fibrotic heart of mice compared to the healthy heart. The drug transported to the ventricles by 10K-EVs, did not show any difference in CTPR accumulation between healthy and fibrotic left ventricles. This is due to the significant accumulation of the drug in the atria of fibrotic hearts. The occurrence of CTPR accumulation in the atria of fibrotic hearts following the administration of the drug encapsulated in 10K-EVs did not occur after the administration of non-encapsulated CTPR. Previous studies conducted by our group have demonstrated that free CTPRAu can be detected in the hearts of both healthy and fibrotic mice 3 h after its administration. In those studies, we also demonstrated that a significant accumulation of the drug in fibrotic ventricles was observed only after waiting for 5 days following the administration of CTPRAu [25]. We observed CTPR accumulation specifically in the fibrotic right lung when it is transported within 10K-EVs.
We purified fibroblast derived EVs taking into account that delivery of the EVs to the target cell/organ dependent on the selective uptake of EVs by recipient fibroblasts. It has been described that EV uptake occurs mainly when EVs and recipient cells share the appropriate ligand and receptor, which is more likely to occur when the donor cell, from which EVs are isolated from, and the EVs recipient cell, are the same cell type [84]. However, there are also claims that EVs can be non-selectively incorporated into different types of cells [85]. Regardless, we believe that the accumulation of CTPR in the atria and right lung at 2 h is a transient event that is likely to vary at shorter or longer time points after drug administration. We also consider that the presence of multiple lobes of the right lung of mice together with the intraperitoneal administration that might not ensure homogeneity in the distribution of substances, due to processes such as absorption and passage of membranes from the gastrointestinal tract to the circulatory system, might be some of the reasons behind the observed differences in drug accumulation between the right and left lungs.
It is well known that the in vitro efficiency of a new experimental therapeutic strategy can be impaired by poor in vivo biodistribution. This observation holds true for both mKate2 100K-EVs-CTPRAu and free CTPRAu, as studied at a 2 h time point after their administration. The expected biological effects of the experimental drug CTPRAu occurred mainly through internalization by recipient cells via endocytosis pathways, as we previously demonstrated [26], coincident with the mechanism of EVs uptake [84, 86]. Thus, it appears that in vivo transport by mKate2 10K-EVs is better suited for transporting CTPRAu, resembling the natural vesicle-driven internalization detected in previous studies [26].
In conclusion, we have generated a biological trackable system based on EVs loaded with a new antifibrotic theranostic molecule with good antifibrotic functionality in vitro. The translation of this system to in vivo application already showed promising results with the accumulation of the transported drug in fibrotic heart and lung within the first 2 h after administration. This proof of concept allows for the possibility of using other drugs whose encapsulation may be applicable in the reduction of adverse effects, in addition to being a strategy that can be validated for this family of diseases.
Materials and Methods
Plasmid construction
pCDH-f_mKate2 vector including mKate2 into the lentiviral construct includes one of the most common fluorescent proteins, Red Fluorescent Protein attached to the N-terminus of the farnesyl group. Fluorescent farnesyl group incorporates into proteins such as c-Ha-ras, which allows their localization in cell membranes. (pCDH-f_mKate2 vector was a kind gift of Dr. N. Varela, IBBTEC-Universidad de Cantabria, Santander, Spain).
Cell culture and mKate2 NIH-3T3 cell line generation
NIH-3T3 fibroblast cell line were purchased from American Type Culture Collections (Manassas, VA, USA). Cells were grown as monolayer at 37 ºC, under 5% CO2, in humidified incubators cultured in Dulbecco's modified Eagle's medium (DMEM Glutamax, Gibco), with 10% of Fetal bovine Serum (FBS, Gibco), 100 U/mL penicillin and 100 μg/mL streptomycin (Gibco). Cell in between passage 30-40 were assayed to produce membrane targeted and labeled mKate2 stable NIH-3T3 line. The new cell line was obtained by infection with lentiviral pCDH-f_mKate2 vector. Briefly, HEK293T cells were cultured in a 10 cm dish at approximately 20~30% confluence so that they did not reach confluence during the virus production process. 2 μg of pCDH-fmKate2 (plasmid of interest), 1.2 μg of psPAX2 (packaging plasmid) and 1.0 µg of pMD2G (VSVG envelope plasmid) were transfected together using Lipofectamine® LTX & PLUS™ reagent following the manufacturing recommended protocol. 24 h later, the medium was changed. After 24 h, HEK293T medium rich in viral particles was collected, filtered with a 0.45 µm filter and administered to the NIH3T3 culture at a 1:2 dilution in DMEN and with a final concentration of 8 µg/mL polybrene (sc-134220). This process was repeated two days in a row. After 48 h of incubation with viral particles, the medium was refreshed and antibiotic selection was initiated. MKate2 NIH-3T3 puromycin selected final cell line was checked for positive red fluorescence using epifluorescence microscopy. Regular NIH-3T3 regular cell line and mKate2 NIH-3T3 stable population are routinely tested using Myco detection Kit (Eurofins) for mycoplasma contamination. Only mycoplasma negative cells were used for experiments presented herein.
EVs isolation
300,000 NIH-3T3 cells in passage 30-40 were plated per twenty-three 150 mm culture plates. Four days after, when 65% confluence was reached, the cells were washed twice with PBS and the medium was replaced with 14 mL of DMEM medium supplemented with 10% exosome-depleted FBS (Gibco A27208-01), 100 U/mL penicillin and 100 μg/mL streptomycin (Gibco). Five days after adding exosome depleted FBS medium, with cells at 80~90% confluence, we began the EVs isolation. Cells were counted and cell viability was determined using Trypan Blue (Invitrogen). Experiments were performed with cells showing viability ≥ 65%. To isolate EVs, conditioned media were collected and centrifuged at 2,000 g for 20 min at 4 °C to remove dead cells and debris. The resulting supernatant was centrifuged at 10,000 g for 90 min at 4 °C to obtain the 10K-EVs fraction. Subsequently, to obtain the 100K-EVs fraction, the supernatant was ultracentrifuged in 50 mL centrifuge tubes (3139-0050 Thermo Scientific™ Nalgene™) at 100,000 g for 90 min at 4 °C, using a Beckman Avanti J-30 ultracentrifuge. The 10K and 100K pellets were concentrated respectively using a 1.5 mL tube ultracentrifuge 082393315 OPTIMA MAX XP TABLETOP ULTRACENTRIFUGE. The 10K and 100K fractions were washed in 1 mL EVs-free PBS (by ultracentrifugation 100,000 g 90 min) and pelleted again in EVs-free PBS for further use.
Western blot
40 µg of total protein from mKate2 10K-EVs and mKate2 100K-EVs (Nanodrop) were lysed using NuPAGE™ LDS buffer (Invitrogen™ NP0007). After boiling 5 min at 95 °C, samples were resolved on a 12% SDS-PAGE gel without reducing conditions. Resulting gels were then transferred to Nitrocellulose blotting membranes (Amersham™ Protan™ Premium 0.45 µm NC). The membranes were blocked with bovine serum albumin (Sigma-Aldrich A7906-50G) in TBS containing 0.1% Tween-20 (TBST) for 1 h at room temperature. After blocking, the membranes were incubated with the following primary antibodies diluted in 2% bovine serum albumin in TBS at 4 °C overnight: anti-CD-81 (1:150 dilution, monoclonal serum kindly gifted by Doctor Sanchez Madrid), anti-flotillin-1 (dilution 1:5000, sc-133153), anti-Syntenin-1 (dilution 1:500, sc-515538) anti-Hsp90 (dilution 1:1000, abcam ab13492). IRDye 800 CW and IRDye 680RD-conjugated secondary antibodies were used for immunodetection. The blots were visualized with the Odyssey® CLx Imager imaging system (LI-COR). Protein detection in the blots was quantified using ImageJ imaging software. Quantifications were normalized to total intensity.
Flow cytometry
Flow cytometry measurements were performed using the MACSQuant® Analyzer 10 (#0130-096-343). Parameters were adjusted following the manufacturer's recommended protocol adapted for exosome population characterization: low flow rate (~10 µL/min), trigger on SSC at 4, all channels on hyper logarithmic scale, voltage set to 264 V for FSC and 219 V for SSC. EVs-free ultracentrifuged PBS (negative for Flotilin-1-1, Syntenin, and CD-81 assayed by WB) was used to evaluate buffer fluorescence background. MACSQuantify 2.11.1907.19925 software was used for analysis.
Fluorescence Live Cell Imaging
4x10⁵ NIH3T3 cells were culture in 35 mm microscopy dishes (Ibidi µ-Dish 35 mm high Glass Bottom 81158). 36 h later, cells were washed and medium was replaced by Leibovitz microscopy medium (Gibco™ 21083027) and TGFβ (1 ng/mL). One minute of time laps was captured as baseline control. MKate2-10K or mKate2 100K-EVs were added to the cells. Cell images were recorded for up to 5 min.
Nikon eclipse Ti2 were used for live image acquisition with Orca flash 4 as a camera. A 60X oil objective was used with an opening of 1.4 mm. MKate2 (excitation: 588 nm, emission 633 nm) detection channel was mCherry channel using an exposure time of 100 ms, Led 575 nm 10% intensity excitation filter 578/21 nm (SPECTRA X lumencor) each 0.5 s. Differential interference contrast (DIC), with an exposure time of 30 ms, was taken every 3 pictures. After the time laps, cells were washed vigorously and fixed with 4% paraformaldehyde for further confocal microscopy.
Immunochemistry of Hsp90αβ
Cells previously fixed were permeabilized for 30 min with 0.05% Triton-X in PBS. An overnight incubation at 4 ºC with anti-Hsp90 antibody (1:100 dilution, ab13492) was performed. The samples were washed with 0.05% Tween 20 in PBS, incubated for 1 h at room temperature with a secondary antibody (anti-mouse Cy5), washed in PBS. Fixed cells were stored in PBS at 4 ºC for subsequent confocal imaging.
Confocal fluorescence microscopy
Leica SP5 confocal, 63X oil objective, 1.4 mm aperture and 2.5 zoom was used. Fluorescence of mKate2 EVs (excitation: 588 nm, emission 633 nm) was taken using mKate2 channel with 594 nm laser, 49% intensity, 610 nm excitation filter and 660 nm emission filter; CTPRAu (excitation: 390 nm, emission: 488 nm), DAPI channel, laser 405 nm, intensity 27%, excitation filter 415 nm, emission filter 500 nm; Cy5 from anti-Hsp90 immunofluorescence (excitation 633 nm, emission 647 nm), Far Red channel, laser 633 nm, intensity 43%, excitation filter 648 nm, emission filter 698 nm. Seven z-slices were acquired with a step size of 1.13 μm. LAS AF software was used to capture images.
At least three cells were captured from each condition to obtain representative images of the total number of EVs per cell. The images were analyzed using ImageJ software. A median filter was applied to each channel and a maximum intensity z-projection was performed for each channel separately. Once brightness and contrast were adjusted, the images were converted to binary to count the number of EVs in each cell using the find maxima tool. This tool determines the local maxima in an image and creates a binary image of the same size with particle per maximum. Analysis is performed on the existing selection of the cell analyzed. To select the EVs, Noise Tolerance is adjusted. Maxima are ignored if they do not stand out from the surroundings by more than this value. These adjustments set a threshold at the maximum value minus noise tolerance. The contiguous area around the maximum above the threshold is analyzed. For accepting a maximum, this area must not contain any point with a value higher than the maximum. Only one maximum within this area is accepted. Under these conditions the colocalization of mKate2 EVs and CTPRAu fluorescence was measured.
Transmission Electron Microscopy
Negative staining was performed to be imaged by a JEOL- JEM 1011 transmission electron microscope (TEM) with a high-resolution Gatan digital camera. 3 μL of EVs in PBS were placed on a parafilm sheet so the formvar coated nickel grid was placed formvar side down on top of the sample for 5 min at room temperature. After that, grid was removed, blotted with filter paper, and placed into another drop of 0.5% uranyl acetate for 5 s, blotted again, washed two times with two drops of dionized water and air dried until observation. Transmission Electron Microscopy (TEM) images of mKate2 10K-EVs and mKate2 100K-EVs were recorded at an accelerating voltage of 80 kV and with magnifications ranging from 6000× to 29,000× using a GatanUltraScan 100 slow-scan CCD camera and software Gatan.
Measurement of particle size distribution and particle number by Nanoparticle Tracking Analysis (NTA)
The particle size distribution and the number of particles in the collected EV suspension were measured using nano particle tracking analysis device (Malvern Panalytical NanoSight NS300 Instrument, UK). Briefly, EV suspensions were diluted in MilliQ distilled water (1:100) and loaded into measurement cassettes. The measurements have been carried out at room temperature, using 532 nm (green) laser source. The concentration and mean size were calculated for each sample based on three captures (each 60 s) and a total of 1489 frames. The calculations have been done via built-in software version NTA 3.4 Build 3.4.4.
Surface potential of mKate2 10K-EVs and mKate2 100K-EVs
MKate2 EVs samples diluted in 1 mL of depleted PBS to reach a final concentration of 5x10⁶ particles/mL. Samples were added to the adapted cuvette for the Zeta Potential Analyzer (NANOTRAC WAVE II Microtrac analysis technology) during the preparation process. MKate2 EVs were measured thrice at 25 °C under the following settings: sensitivity of 85 a shutter value of 70, and a frame rate of 30 frames per s. ZetaView software was used to collect and analyze data.
bCTPR design, cloning and molecular biology
CTPR390 and CTPR proteins were produced and characterized as described previously [87-90]. CTPR390 was fused to CTPR4-8Cys by a block cloning strategy, resulting in CTPRAu [25]. Then, to generate bCTPR, CTPR390-CTPR4-8Cys was fused to NanoLuc by isothermal assembly [91]. The DNA encoding NanoLuc was kindly provided by Prof. Barbara Montanini group. The final DNA sequence, NanoLuc- CTPR390-CTPR4-8Cys, named bCTPR was cloned in a pET-HT vector and was confirmed by Sanger sequencing (Stab Vida).
bCTPR expression and purification
Overnight cultures of Escherichia coli C41 (DE3) transformed either with NanoLuc-CTPR390-CTPR4-8Cys or CTPR8-24Cys-CTPR390 (bCTPR), were inoculated in a dilution of 1:100 in LB medium containing 0.1 mg/mL of ampicillin. Bacteria were grown under agitation at 37 °C until optical density of the culture was 0.6. Protein expression was then induced by the addition of 1 mM isopropyl β-d-thiogalactoside (IPTG). The bacterial cultures were then incubated overnight at 20 °C and finally centrifuged for 15 min at 4,500 rpm to obtain a cell pellet that was next resuspended in 50 mM Tris, 500 mM NaCl, pH 8.0 and frozen. The cell pellets were lysed by sonication and centrifuged for 1 h at 10,000 rpm. The soluble proteins were purified by affinity chromatography using a 5 mL HisTrap Q column (GE Healthcare). The His6-tag was then digested from the designed proteins by the Tobacco Etch Virus (TEV) overnight treatment at room temperature, and then purified once again by affinity chromatography (proteins of interest eluted in the flowthrough). The protein concentration was determined by measuring the absorbance at 280 nm, using extinction coefficients calculated from the amino acid composition of each protein. Purity and size of the proteins was confirmed by acrylamide electrophoresis gel (12%) imaged by GelDoc EZ Imager (BioRad), and by Matrix-Assisted Laser Desorption/Ionization-Time of Flight (MALDI-TOF). The sample preparation consisted of mixing 1 μL of sample with 2 μL of sinapinic acid matrix (in 50:50 water/acetonitrile with 0.01% TFA). The mass spectra were acquired by an Applied Biosystems Voyager Elite MALDI-TOF mass spectrometer with delayed extraction (Applied Biosystems, Framingham, MA, USA). This equipment is equipped with a pulsed N2 laser (λ = 337 nm) and it was used at an extraction voltage of 20 kV. The spectrum was obtained in positive reflection mode using delayed extraction with an average of 50-100 laser shots. The secondary structure was verified by circular dichroism using a Jasco J-815 (JASCO Corporation, Tokyo, Japan). CD spectra were obtained at 2.5 μM of protein using a cuvette with 1 mm path length. The thermal denaturation spectra were obtained by measuring the CD signal at 222 nm at the different temperatures with a gradient of 1 °C and measured after 5 s of the sample being at the target temperature.
bCTPR bioluminescence
The bCTPR bioluminescence generation was evaluated using a BioTek Synergy H1 hybrid microplate reader after incubating 3.8 μM of bCTPR with 2 μM of its substrate, FFz in a final volume of 30 μL (phosphate-buffered saline, PBS, 20 mM Na2HPO4, 1.8 mM KH2PO4, 140 mM NaCl, 1.8 mM KCl, pH 7.4) in a black 384-well plate. The luminescence emission spectrum was recorded in RLU (Relative Light Unit) against wavelength (nm) plots through a monochromator (1 s of integration time), by top read, reading height of 7 mm, and gain of 100.
Stability measurements of the bCTPR chimera protein
To mimic in vivo conditions, bCTPR was incubated with mice plasma at a final concentration of 3.8 μM. The protein and plasma mixture were incubated at 37 °C for 4 h under mild agitation. To measure the stability of bCTPR bioluminescence under these conditions, several samples of this mixture were withdrawn at the different time points (0, 0.5, 1, 1.5, 2, 3, and 4 h). Each sample was incubated with 1 μM of FFz and its bioluminescence measured under the same parameters mentioned above. The percentage of luminescence was calculated setting the bioluminescence signal of the sample time point 0 (right after adding the protein to the plasma) as 100%.
In vitro cytotoxicity of bCTPR
To evaluate the cytotoxicity of bCTPR, NIH-3T3 fibroblasts at 80% confluence were treated with several concentrations of bCTPR for 4 and 24 h. After the treatment, the cells underwent 3 washes with DPBS. Subsequently, they were incubated with 0.1% resazurin (1 mg/mL in DPBS), which was diluted in DMEM medium at 37 °C and 5% CO2, for a duration of 3 h. The fluorescence intensity of resorufin (reduced resazurin) was then measured using a BioTek Synergy H1 hybrid microplate reader (λexc = 570 nm, λem = 600 nm), using a black well plate. The percentage of cell viability was calculated using non-treated/ control cells as 100% viability.
Synthesis of protein-stabilized gold nanoclusters (CTPRAu)
CTPRAu were synthesized through biomineralization, by optimizing a protocol previously described [92]. Initially the protein buffer was changed to 150 mM of NaCl, 50 mM phosphate buffer at pH 11.2 using a PD-10 desalting column. Then, 1 mL of protein at 10 μM was incubated with 48 equivalents of Au per protein (3.2 μL of HAuCl4 at 150 mM) at 50 °C for 72 h. After the synthesis, CTPRAu were centrifuged at 16,400 rpm for 1 h and subsequently concentrated using an Amicon filter with pore size of 10 kDa. Finally, the nanomaterials were purified using a PD-10 desalting column and the buffer changed to PBS for further storage and use.
Electroporation of mKate2 10K-EV and mKate2 100K-EV for CTPRAu encapsulation
Once isolated, populations of mKate2 10K-EVs and mKate2 100K-EVs were resuspended in 500 µL of EV-free PBS and mixed with 500 µL of 1 mM CTPRAu. After 15 min shaking at room temperature, two electroporation pulses of 0.9-1.0 s were applied. The electroporation parameters set were 400 V, 125 µF. After electroporation, the EVs populations were isolated by consecutive centrifugations at 10,000 g and 100,000 g to get rid of unencapsulated CTPRAu.
Generation of the bCTPR:CTPRAu mixture and its encapsulation into EVs for in vivo and ex vivo studies
To visualize in vivo (bioluminescence) and quantify ex vivo (Au detection) the CTPR390-CTPR4-8Cys protein structure loaded into EV, we generated the bCTPR:CTPRAu mixture in a ratio of 1:10. The bCTPR:CTPRAu cargo was created by mixing 300 µL of bCTPR (0.1 mM) and 500 µL of CTPRAu (1 mM). Next, populations of mKate2 10K-EVs or mKate2 100K-EVs resuspended in 200 µL of EV-free PBS were added to the bCTPR:CTPRAu mixture to obtain a final volume of 1 mL. The encapsulation protocol explained in the previous section was then applied. It should be noted that the ex vivo quantification by Au detection of the total CTPR390-CTPR4-8Cys present in the tissue measured 90% of the total CTPR390-CTPR4-8Cys molecules (bCTPR:CTPRAu, ratio 1:10).
In vitro treatment with mKate2 10K-EVs and mKate2 100K-EVs void or loaded with CTPRAu
4x10⁴ NIH-3T3 acceptor cells were seeded in 12 well plates and incubated at 37 °C with 5% CO2. After 24 h, around 65% confluence was reached. At this point, 1 ng/mL of TGFβ and mKate2 10K-EVs or mKate2 100K-EVs at a final concentration of 7.0x10⁹ ± 4.0x10⁹ EVs/mL and 2.5x10⁹ ± 8.5x10⁸/mL respectively, were added to cells. 24 h and 36 h later, the medium was removed, and cells were stored at -80 °C for further experiments.
Quantitative PCR analysis of cell samples
The total RNA from NIH-3T3 cells was obtained with TRIzol® reagent (Gibco BRL, Grand Island, NY). Complementary DNA was prepared from 0.5 μg total RNA by random priming using a first-strand cDNA synthesis kit (Promega Corp). Primers sequence for the Sybr green QPCR of COL Ia1, COL IIIaI, FN, Hsp90aa1, Hsp90ab1 were: COL Ia1 forward: TGGGGCAAGACAGTCATCGAATA; reverse: GGGTGGAGGGAG TTTACACG. COL IIIa1 forward: ACCCCATGATGTGTTTTGTGGCA; reverse: CAGGTCCTCGGAAGCCACTA. FN forward: CACCCACATGGCAGCTCACA; revers: ATGGGAACCCTGAAGCCAGC. Hsp90α forward: TTCCAGAAGATG AAGAGGAAAA; reverse: GTCACCAGTCGGTTTGACAC. Hsp90β forward: TCTACTTCATGGCTGGGTCA; reverse: AACTCGGGAAGAGCCTGAAT. The target mRNA expression levels were normalized to 14S levels, 14S forward: AGTGACTGGTGGGATGAAGG; reverse: CTTGGTCCTGTTTCCTCC TG. Relative quantification was expressed as fold-induction compared to control 14S in triplicate of three independent experiments.
MicroRNA sequencing of mKate2 10K-EVs and mKate2 100K-EVs
Total small RNA from mKate2 10K-EVs (190 μL of 2.9x10¹⁵ EVs/mL) and mKate2 100K-EVs (190 μL of 1.9x10¹⁴ EVs/mL) was isolated with the isolation kit (Thermo fisher, ref.:4478545) following the specifications for enriching the sample in small RNAs. Final miRNA concentration obtained from mKate2 10K-EVs (4.4 ng/µL) and mKate2 100K-EVs (3.4 ng/mL) was measured with the Qubit miRNA assay kit (Invitrogen™ ref.: Q32880). Next Generation Sequencing of miRNA was performed by Macrogene Company (dna.macrogene.com) following this manufacturer's protocol. The construction of sequencing libraries by polyadenylation of the isolated RNA were used to provide a priming sequence for SMART smRNA Oligos 5´ and 3´. PrimeScript Reverse Transcriptase generated cDNA by adding non-templated nucleotides bound by the SMART smRNA Oligo-enhanced. Locked nucleic acid (LNA) technology was used for greater sensitivity. PCR amplification included full-length Illumina adapters. Resulting library cDNA molecules include sequences required for clustering on an Illumina flow cell. The libraries were validated by checking the size, purity, and concentration on the Agilent Bioanalyzer. The libraries were pooled in equimolar amounts and sequenced on an Illumina NovaSeq instrument. Image decomposition and quality value calculation were performed using the modules of the Illumina pipeline. Procedure for data analysis included: -Adapter trimming using cutadapt program [93]. Trimmed reads, whose length is longer than 18 bp, and non-adapter reads were combined and regarded as processed reads for downstream analysis. -Clustering of the reads whose sequences and length are the same to minimize the sequence redundancy. -Ribosomal RNA filtering in order to eliminate rRNA. -Identification of known miRNA reads using miRDeep2 software algorithm to assign scores representing the probability that hairpins are true miRNA precursors [94]. Normalization is performed using an R package called edgeR.
Care of the mice
Live animal studies were approved by the University of Cantabria Institutional Laboratory Animal Care and Use Committee in compliance with the Guide for the Care 11 and Use of Laboratory Animals (ILAR, 1985) and were conducted in accordance with the “European Directive for the Protection of Vertebrate Animals Used for Experimental and Other Scientific Purposes” (European Communities Council Directive 86/606/EEC). Male C57BL6 mice between 16-20 weeks old used for this study, were housed in a 22 °C room with 12:12 h light/dark cycle and provided with food and water ad libitum.
Subcutaneous implantation of osmotic minipumps and antifibrotic treatment administration
Random selection of 6 littermate mice was selected to generate the following groups under study.
- Sham group: Osmotic minipump implantation loaded with saline solution.
- Fibrotic group: Osmotic minipump implantation loaded with Ang II solution.
- Sham mKate2 100K-EVs CTPRAu treated group: Osmotic minipump implantation loaded with saline solution and intraperitoneal administration of 50 μL of mKate2 EVs encapsulating (100 μM) CTPRAu + bCTPR (1 μM) solution.
- Sham CTPRAu treated group: Osmotic minipump implantation loaded with saline solution and intraperitoneal administration of 50 μL of 1x10⁶ mKate2 EVs encapsulating CTPRAu (100 μM) + bCTPR (1 μM) solution.
- Fibrotic mKate2 100K-EVs treated group: Osmotic minipump implantation loaded with Ang II solution and intraperitoneal administration of 50 μL of 1x10⁶ mKate2 EVs encapsulating (100 μM) CTPRAu + bCTPR (1 μM) solution.
- Fibrotic treated group: Osmotic minipump implantation loaded with Ang II solution and intraperitoneal administration of 50 μL of 100 μM CTPRAu + bCTPR (1 μM) solution.
The osmotic minipumps containing Ang II or saline solution (sham) were implanted subcutaneously as follows. Mice were anesthetized with 2.5% isoflurane in 1.5 L/min O2 for the duration of the surgical implantation procedure. A mid-scapular incision is made, and a subcutaneous pocket is created for the micro-osmotic pump to be inserted. The minipump was previously filled with an aqueous solution of angiotensin II (0.70 mg) to infuse a dose of Ang II of 1.5 mg/kg per day with a time-regimen of 0.25 μL per h, 14 days, (Alzet) to the “Fibrotic” groups or saline to “sham” groups. The wound was closed with a suture. Mice were monitored daily for any discomfort and they were euthanized at the endpoint (1 week after surgery).
Under 2.5% isoflurane anesthesia in 1.5 L/min O2, mice were injected intraperitoneally with 100 μL of mKate2 EVs (6.8x10¹¹ ± 1.6x10⁹ 10K EV-bCTPR:CTPRAu/mL and 4.1x10⁹ ± 3.3x10⁸ 100K EVs-bCTPR:CTPRAu/mL) or free bCTPR:CTPRAu at a concentration of 100 μM in a 1:10 bCTPR:CTPRAu ration (10 μM:90 μM). The percent encapsulation of bCTPR:CTPRAu in a 100 μM:1 mM ratio was 6.1% ± 3.9% for 100K-EVs and 2.6 ± 1.7% for 10K-EVs.
At the end of the study, organs and fluids were collected, flash frozen and stored at -80 °C until ICP-MS assays were performed. Blood was collected in heparinized tubes. To separate the plasma from the cellular content, a centrifugation for 10 min at 2,000 g 4 °C was carried out. Plasma and blood cells were stored at -80 °C.
In vivo and ex vivo fluorescence imaging (IVIS)
Populations of mKate2 EVs described in the previous section were stained with the lipophilic fluorescent dye DiR (Invitrogen D12731) in order to visualize them with the in vivo imaging system (IVIS), as the excitation/emission wavelengths of mKate2 are not optimal for this equipment. We settled the in vivo region of interest (ROI) through oval circles delimiting the total signal detected with a long diameter of 5.68 cm and a short diameter of 3.44 cm in all mice studied. In vivo fluorescence and bioluminescence images were obtained with the Xenogen in vivo imaging system (IVIS, PerkinElmer). Mice were anesthetized with 2.5% isoflurane in 1.5 L/min O2 and were placed into the IVIS chamber.
Fluorescence images were obtained with excitation/emission filters 660/710 nm, 680/790 nm, 700/790 nm, 720/790 nm, 740/790 nm, 760/845 nm, 780/845 nm to generate the spectrum and perform spectral unmixing to remove the signal from tissue autofluorescence for visualization of DiR-stained EV populations both in vivo and ex vivo. The exposure time set in “auto-expose”. Adaptive FL Background subtraction correction and spectral unmixing were performed to eliminate auto fluorescence signal. In vivo bioluminescence from bCTPR was measured by acquiring total bioluminescence, exposure time “auto-expose”. To detect bioluminescence 50 μL of 0.22 µmol of Nano-Glo® In Vivo Substrate, FFz (Promega CS320501) was injected 15 min before imaging.
Following in vivo Imaging, mice were sacrificed and ex vivo fluorescence and bioluminescence photos were taken from heart and lungs. We set the ex vivo ROI through circles delimiting the total signal detected with a diameter of 1.76 cm. All organs were flash frozen and stored at -80 °C until ICP-MS assays were performed.
Acquired images were analyzed using the Live Image 4.7.2 software. Fluorescence from each mice and organ was quantified by relative total radiance efficiency RTRE [p/s] / [µW/cm²]. Bioluminescence was measured in total flux [p/s]. All measurements were normalized to each control.
Histological analysis
Longitudinal heart and lung sections (4 µm) were obtained from treated mice (control and fibrotic). Organs were fixed in 4% paraformaldehyde, followed by gradient alcohol dehydration and paraffin embedding. COL fibers were stained with Masson's trichrome stain as well as Picrosirious red stain. Masson's trichrome staining was performed using Harrys' hematoxylin (Merk ref.:1.09253) and staining with Fuchina Ponceau (Acid fuchsine, merk ref.: 1.05231; and Xylidine Ponceau, sigma ref.: P2395) was used as contrast stain. Phosphomolybdic acid (Pancrea ref.: 1310031.1608) was used to label the collagen with light green (Merck ref.: 1.15941).
Picrosirious staining was performed by incubating Harrys' hematoxylin (Merk ref.:1.09253) as a contrast stain followed by Picrosirious red solution (SctTek ref.: SRS500) to stain the collagens. Complete scanning of all sections was performed in bright field with the Zeiss Axioscan Z1 scanner using the ×10/0.45 Plan Apo objective. Images were exported as JPG files with a pixel size of 0.884 mm/ pixel and analyzed with ImageJ 1.52i software.
Inductively coupled plasma mass spectrometry (ICP-MS) of mKate2 EVs, cells and organs
Au (CTPRAu) concentration present in CTPRAu treated cells and mice was determined by ICP-MS. Briefly, NIH-3T3 pellet was obtained via centrifugation at 3,000 rpm for 10 min at room temperature of a trypsin detached and counted 10 cm2 culture plate at 100% confluent. The cell pellet was frozen and thawed several times to help lyse the cell membrane. Then, 500 μL of freshly prepared aqua regia (HNO3:HCl = 1:3) was added and left to react overnight. Mice organs and fluids (brain, cerebellum, atrium, ventricles, lungs, liver (two main lobules), aorta, stomach, spleen, intestine, kidneys, urine, blood cells and blood plasma) were frozen and lyophilized. The dried tissue samples were weighed and immersed in 1.2 or 8 mL of fresh aqua regia, depending on the tissue weight. The tissues were then submitted to a microwave digestion process using a Speedwave XPERT Microwave Digestion System (Berghof). Initially the samples were heated to 160 °C at 30 bar with a 10 min ramp, and held for 10 min. Then, the temperature was increased to 190 °C and 30 bar, with a ramp of 5 min and held in these conditions for 20 min. The solution was then cooled to room temperature. Subsequently, the samples were diluted with 2% HNO3 and analyzed by inductively coupled plasma mass spectrometry (ICP-MS). All experiments were performed in triplicate. The Au concentration in each sample was determined by iCAP-Q ICP-MS (Thermo Scientific, Bremen, Germany) equipped with an autosampler ASX-520 (Cetac Technologies Inc., NE, USA) (n = 3) and QtegraTM v 2.6 (Themo Scientific).
Supplementary Material
Supplementary figures.
Acknowledgements
This work was partially supported by Agencia Estatal de Investigación, Spain PID2021-125702OB-I00; RTI2018-095214-B-I00). A.L.C. acknowledges support by the European Research Council grant ERC-CoG-648071-ProNANO; the Agencia Estatal de Investigación Grant PDC2021-120957-I00 funded by MCIN/AEI/ 10.13039/501100011033 and by the “European Union NextGenerationEU/PRTR” and Grant PID2019-111649RB-I00-ProTools funded by MCIN/AEI/ 10.13039/501100011033; and the Basque Government (RIS3-2019222005). G.G. thanks the financial support of “la Caixa” Foundation (ID100010434, fellowship: LCF/BQ/DI20/11780020). This work was performed under the Maria de Maeztu Units of Excellence Program from the Spanish State Research Agency - Grant No. MDM-2017-0720 (CIC biomaGUNE). We thank Dr. L Martin-Jaular, and the Institut Curie EV platform, for helpful discussion. We thank Dr. S Mobini and Dr. M.U. González for their collaboration with the tracking analysis studies. We express our gratitude to Dr. V Gabarra for her valuable advice and assistance in finalizing the text.
Author Contributions
Conceptualization, A. L. C., and A. V. V.; methodology, JRdR., A. P., D. N., E. L., G. G.; formal analysis, JRdR, A. V. V., and A. L. C.; investigation: protein hybrid synthesis and characterization and analytical studies G. G.; investigation: in vitro and in vivo studies, JRdR., A. P., D. N., E. L., and A. V. V.; investigation; writing-original draft preparation, JRdR., G. G., A. P., A. L. C., and; A. V. V., funding acquisition, A. V. V. and A. L. C. All the authors have read and agreed to the published version of the manuscript.
Competing Interests
The authors have declared that no competing interest exists.
References
1. Yáñez-Mó M, Siljander PRM, Andreu Z, Zavec B, Borràs FE, Buzas EI. et al. Biological properties of extracellular vesicles and their physiological functions. J Extracell Vesicles. 2015;4:27066
2. van Niel G, D'Angelo G, Raposo G. Shedding light on the cell biology of extracellular vesicles. Nat Rev Mol Cell Biol. 2018;19(4):213-228
3. Cocozza F, Grisard E, Martin-Jaular L, Mathieu M, Théry C. Snapshot: extracellular vesicles. Cell. 2020;182(1):262-262
4. Taylor DD, Gercel-Taylor C. The origin, function, and diagnostic potential of RNA within extracellular vesicles present in human biological fluids. Front Genet. 2013;4:142
5. Théry C, Witwer KW, Aikawa K, Alcaraz MJ, Anderson JD, Andriantsitohaina R. et al. Minimal information for studies of extracellular vesicles 2018 (MISEV2018): a position statement of the international society for extracellular vesicles and update of the MISEV2014 guidelines. J Extracell Vesicles. 2018;7:1
6. Dehghani M, Gaborski TR. Fluorescent labeling of extracellular vesicles. Methods Enzymol. 2020;645:15-42
7. Roberts-Dalton HD, Cocks A, Falcon-Perez JM, Sayers EJ, Webber JP, Watson P. et al. Fluorescence labelling of extracellular vesicles using a novel thiol-based strategy for quantitative analysis of cellular delivery and intracellular traffic. Nanoscale. 2017;9(36):13693-13706
8. Shen B, Wu N, Yang JM, Gould SJ. Protein targeting to exosomes/microvesicles by plasma membrane anchors. J Biol Chem. 2011;286(16):14383-95
9. Apolloni A, Prior IA, Lindsay M, Parton RG, Hancock JF. H-ras but not K-ras traffics to the plasma membrane through the exocytic pathway. Mol Cell Biol. 2000;20(7):2475-87
10. Silva AM, Lázaro-Ibáñez E, Gunnarsson A, Dhande A, Daaboul G, Peacock B. et al. Quantification of protein cargo loading into engineered extracellular vesicles at single-vesicle and single-molecule resolution. J Extracell Vesicles. 2021;10(10):2
11. Owen A, Stary CM, Gross ER. Exosomes as perioperative therapeutics to limit organ injury: Br J Anaesth. 2023; 130(3):248-250.
12. Lobb RJ, Visan KS, WuLY, Norris EL, Hastie ML, Everitt S. et al. An epithelial-to-mesenchymal transition induced extracellular vesicle prognostic signature in non-small cell lung cancer. Commun Biol. 2023;6(1):022-04350
13. Han C, Yang J, Zhang E, Jiang Y, Qiao A, Du Y. et al. Metabolic labeling of cardiomyocyte-derived small extracellular-vesicle (sEV) miRNAs identifies miR-208a in cardiac regulation of lung gene expression. J Extracell Vesicles. 2022;11(10):12246
14. Okamura A, Yoshioka Y, Saito Y, Ochiya T. Can Extracellular vesicles as drug delivery systems be a game changer in cardiac disease? Pharm Res. 2022;40(4):889-908
15. Fang J, Zhang Y, Chen D, Zheng Y, Jiang J. Exosomes and exosomal cargos: a promising world for ventricular remodeling following myocardial infarction. Int J Nanomedicine. 2022;17:4699-4719
16. Cáceres RA, Chavez T, Maestro D, Palanca AR, Bolado P, Madrazo F. et al. Reduction of cardiac TGFbeta-mediated profibrotic events by inhibition of Hsp90 with engineered protein. J Mol Cell Cardiol. 2018;123:75-87
17. Imai Y, Kuba K, Ohto-Nakanishi T, Penninger JM. Angiotensin-converting enzyme 2 (ACE2) in disease pathogenesis. Circ J. 2010;74(3):405-10
18. Frangogiannis NG. Cardiac fibrosis. Cardiovasc Res. 2021;117(6):1450-1488
19. Milano AD, Faggian G, Dodonov M, Golia G, Tomezzoli A, Bortolotti U. et al. Prognostic value of myocardial fibrosis in patients with severe aortic valve stenosis. J Thorac Cardiovasc Surg. 2012;144(4):830-837
20. Weidemann F, Herrmann S, Störk S, Niemann M, Frantz S, Lange V. et al. Impact of myocardial fibrosis in patients with symptomatic severe aortic stenosis. Circulation. 2009;120(7):577-584
21. Fan Z, Guan J. Antifibrotic therapies to control cardiac fibrosis. Biomater Res. 2016;20(13):016-0060
22. Kachboura S, Halima AB, Elhadj ZI, Marrakchi S, Chrigui R, Kammoun I. et al. Cardiac resynchronization therapy allows the optimization of medical treatment in heart failure patients. Ann Cardiol Angeiol. 2014;63(1):17-22
23. Chang YY, Wu YW, Lee JK, Lin YM, Lin YT, Kao HL. et al. Effects of 12 weeks of atorvastatin therapy on myocardial fibrosis and circulating fibrosis biomarkers in statin-naïve patients with hypertension with atherosclerosis. J Investig Med. 2016;64(7):194-199
24. Wang S, Liang Y, Dai C. Metabolic Regulation of Fibroblast Activation and Proliferation during Organ Fibrosis. Kidney Dis. 2022;8(2):115-125
25. Aires A, Maestro D, Ruiz Del Rio J, Palanca AR, Lopez-Martinez E, Llarena I. et al. Engineering multifunctional metal/protein hybrid nanomaterials as tools for therapeutic intervention and high-sensitivity detection. Chem Sci. 2020: 12(7): 2480-2487.
26. Groen J, Palanca A, Aires A, Conesa JJ, Maestro D, Rehbein S. et al. Correlative 3D cryo X-ray imaging reveals intracellular location and effect of designed antifibrotic protein-nanomaterial hybrids. Chem Sci. 2021;12(45):15090-15103
27. Charoenviriyakul C, Takahashi Y, Morishita M, Matsumoto A, Nishikawa M, Takakura Y. Cell type-specific and common characteristics of exosomes derived from mouse cell lines: Yield, physicochemical properties, and pharmacokinetics. Eur J Pharm Sci. 2017;96:316-322
28. Garcia R, Merino D, Gomez JM, Nistal JF, Hurle MA, Cortajarena AL. et al. Extracellular heat shock protein 90 binding to TGFbeta receptor I participates in TGFbeta-mediated collagen production in myocardial fibroblasts. Cell Signal. 2016;28(10):1563-1579
29. Hohn J, Tan W, Carver A, Barrett H, Carver W. Roles of Exosomes in Cardiac Fibroblast Activation and Fibrosis. Cells. 2021;10:11
30. Burgos Villar KN, Liu X, Small EM. Transcriptional regulation of cardiac fibroblast phenotypic plasticity. Curr Opin Physiol. 2022;28(100556):3
31. Sontake V, Wang Y, Kasam RK, Sinner D, Reddy GB, Naren AP. et al. Hsp90 regulation of fibroblast activation in pulmonary fibrosis. JCI Insight. 2017;2(4):91454
32. O'Loughlin AJ, Mäger I, de Jong OG, Varela MA, Schiffelers RM, El Andaloussi S. et al. Functional Delivery of Lipid-Conjugated siRNA by Extracellular Vesicles. Mol Ther. 2017;25(7):1580-1587
33. Jeyaram A, Lamichhane TN, Wang S, Zou L, Dahal E, Kronstadt SM. et al. Enhanced loading of functional miRNA cargo via pH gradient modification of extracellular vesicles. Mol Ther. 2020;28(3):975-985
34. Murphy DE, de Jong OG, Brouwer M, Wood MJ, Lavieu G, Schiffelers RM. et al. Extracellular vesicle-based therapeutics: natural versus engineered targeting and trafficking. Exp Mol Med. 2019;51(3):1-12
35. de Jong OG, Kooijmans SAA, Murphy DE, Jiang L, Evers MJW, Sluijter JPG. et al. Drug delivery with extracellular vesicles: from imagination to innovation. Acc Chem Res. 2019;52(7):1761-1770
36. Kanada M, Bachmann MH, Hardy JW, Frimannson DO, Bronsart L, Wang A. et al. Differential fates of biomolecules delivered to target cells via extracellular vesicles. Proc Natl Acad Sci U S A. 2015: 112(12): 23.
37. Familtseva A, Jeremic N, Tyagi SC. Exosomes: cell-created drug delivery systems. Mol Cell Biochem. 2019;459(1-2):1-6
38. Han Y, Jones TW, Dutta S, Zhu Y, Wang X, Narayanan SP. et al. Overview and update on methods for cargo loading into extracellular vesicles. Processes. 2021;9(2):15
39. Calabresi C, Arosio B, Galimberti L, Scanziani E, Bergottini R, Annoni G. et al. Natural aging, expression of fibrosis-related genes and collagen deposition in rat lung. Exp Gerontol. 2007;42(10):1003-11
40. Song Y, Kim Y, Ha S, Sheller-Miller S, Yoo J, Choi C. et al. The emerging role of exosomes as novel therapeutics: Biology, technologies, clinical applications, and the next. Am J Reprod Immunol. 2021;85(2):12
41. Algeciras L, Palanca A, Maestro D, RuizdelRio J, Villar AV. Epigenetic alterations of TGFβ and its main canonical signaling mediators in the context of cardiac fibrosis. J Mol Cell Cardiol. 2021;159:38-47
42. RuizdelRio J, Muñoz P, Carreira P, Maestro D, Pablos JL, Palanca A. et al. Profibrotic role of inducible heat shock protein 90α isoform in systemic sclerosis. J Immunol. 2022;209(1):38-48
43. Zhang Y, Guo J, Li Y, Jiao K. Let-7a suppresses liver fibrosis via TGFβ/SMAD signaling transduction pathway. Exp Ther Med. 2019;17(5):3935-3942
44. Chen CY, Choong OK, Liu LW, Cheng YC, Li SC, Yen CYT. et al. MicroRNA let-7-TGFBR3 signalling regulates cardiomyocyte apoptosis after infarction. EBioMedicine. 2019;46:236-247
45. Zhao W, Cheng J, Luo Y, Fu W, Zhou L, Wang X. et al. MicroRNA let-7f-5p regulates PI3K/AKT/COX2 signaling pathway in bacteria-induced pulmonary fibrosis via targeting of PIK3CA in forest musk deer. PeerJ. 2022;5:10
46. Sheng S, Zou M, Yang Y, Guan M, Ren S, Wang X. et al. miR-23a-3p regulates the inflammatory response and fibrosis in diabetic kidney disease by targeting early growth response 1. In Vitro Cell Dev Biol Anim. 2021;57(8):763-774
47. Hall MP, Unch J, Binkowski BF, Valley MP, Butler BL, Wood MG. et al. Engineered luciferase reporter from a deep sea shrimp utilizing a novel imidazopyrazinone substrate. ACS Chem Biol. 2012;7(11):1848-57
48. Segura AM, Frazier OH, Buja LM. Fibrosis and heart failure. Heart Fail Rev. 2014;19(2):173-85
49. Uray KS, Peng Z, Cattano D, Eltzschig HK, Doursout MF. Development of pulmonary fibrosis after heart failure induced by elevated left atrial pressure. Am J Transl Res. 2020;12(8):4639-4647
50. Minghua W, Zhijian G, Chahua H, Qiang L, Minxuan X, Luqiao W. et al. Plasma exosomes induced by remote ischaemic preconditioning attenuate myocardial ischaemia/reperfusion injury by transferring miR-24. Cell Death Dis. 2018;9(3):018-0274
51. Fiedler J, Jazbutyte V, Kirchmaier BC, Gupta SK, Lorenzen J, Hartmann D. et al. MicroRNA-24 regulates vascularity after myocardial infarction. Circulation. 2011;124(6):720-30
52. Sun Y, Wang H, Li Y, Liu S, Chen J, Ying H. MiR-24 and miR-122 Negatively Regulate the Transforming Growth Factor-β/Smad Signaling Pathway in Skeletal Muscle Fibrosis. Mol Ther Nucleic Acids. 2018;11:528-537
53. Cushing L, Kuang PP, Qian J, Shao F, Wu J, Little F. et al. MiR-29 is a major regulator of genes associated with pulmonary fibrosis. Am J Respir Cell Mol Biol. 2011;45(2):287-94
54. Liu MN, Luo G, Gao WJ, Yang SJ, Zhou H. MiR-29 family: A potential therapeutic target for cardiovascular disease. Pharmacol Res. 2021;166(105510):18
55. Wang B, Xu M, Li M, Wu F, Hu S, Chen X. et al. MiR-25 Promotes Cardiomyocyte Proliferation by Targeting FBXW7. Mol Ther Nucleic Acids. 2020;19:1299-1308
56. Wu T, Hu H, Zhang T, Jiang L, Li X, Liu S. et al. MiR-25 Promotes cell proliferation, migration, and invasion of non-small-cell lung cancer by targeting the LATS2/YAP ignaling pathway. Oxid Med Cell Longev. 2019;18:9719723
57. Chen YF, Hu F, Wang XG, Tang Z, Tang HX, Xu M. MicroRNA-23a-5p is involved in the regulation of lipopolysaccharide-induced acute lung injury by targeting HSP20/ASK1. Oxid Med Cell Longev. 2021;11:9942557
58. Huang J, Jiang R, Chu X, Wang F, Sun X, Wang Y. et al. Overexpression of microRNA-23a-5p induces myocardial infarction by promoting cardiomyocyte apoptosis through inhibited of PI3K/AKT signalling pathway. Cell Biochem Funct. 2020;38(8):1047-1055
59. Kang M, Jordan V, Blenkiron C, Chamley LW. Biodistribution of extracellular vesicles following administration into animals: A systematic review. J Extracell Vesicles. 2021;10(8):24
60. Qi S, Yi G, Yu K, Feng C, Deng S. The role of HSP90 inhibitors in the treatment of cardiovascular diseases. Cells. 2022;11:21
61. Di Rocco G, Baldari S, Toietta G. Towards therapeutic delivery of extracellular vesicles: strategies for in vivo tracking and biodistribution analysis. Stem Cells Int. 2016 5029619(10): 23
62. Tolomeo AM, Zuccolotto G, Malvicini R, De Lazzari G, Penna A, Franco C. et al. Biodistribution of intratracheal, intranasal, and intravenous injections of human mesenchymal stromal cell-derived extracellular vesicles in a mouse model for drug delivery studies. Pharmaceutics. 2023;15:2
63. Richter M, Vader P, Fuhrmann G. Approaches to surface engineering of extracellular vesicles. Adv Drug Deliv Rev. 2021;173:416-426
64. Zhang J, Brown A, Johnson B, Diebold D, Asano K, Marriott G. et al. Genetically engineered extracellular vesicles harboring transmembrane scaffolds exhibit differences in their size, expression levels of specific surface markers and cell-uptake. Pharmaceutics. 2022;14:12
65. Li M, Zhang A, Li J, Zhou J, Zheng Y, Zhang C. et al. Osteoblast/fibroblast coculture derived bioactive ECM with unique matrisome profile facilitates bone regeneration. Bioact Mater. 2020;5(4):938-948
66. Kadota T, Yoshioka Y, Fujita Y, Araya J, Minagawa S, Hara H. et al. Extracellular vesicles from fibroblasts induce epithelial-cell senescence in pulmonary fibrosis. Am J Respir Cell Mol Biol. 2020;63(5):623-636
67. Hirose H, Hirai Y, Sasaki M, Sawa H, Futaki S. Quantitative analysis of extracellular vesicle uptake and fusion with recipient cells. Bioconjug Chem. 2022;33(10):1852-1859
68. Schopf FH, Biebl MM, Buchner J. The HSP90 chaperone machinery. Nat Rev Mol Cell Biol. 2017;18(6):345-360
69. Zhang X, Huang W, Ge X. The role of heat shock proteins in the regulation of fibrotic diseases. Biomed Pharmacother. 2021;135(111067):28
70. Valiente-Alandi I, Potter SJ, Salvador AM, Schafer AE, Schips T, Carrillo-Salinas F. et al. Inhibiting fibronectin attenuates fibrosis and improves cardiac function in a model of heart failure. Circulation. 2018;138(12):1236-1252
71. Colunga Biancatelli RML, Solopov P, Gregory B, Catravas JD. HSP90 Inhibition and Modulation of the Proteome: Therapeutical Implications for Idiopathic Pulmonary Fibrosis (IPF). Int J Mol Sci. 2020;21:15
72. Sager RA, Khan F, Toneatto L, Votra SD, Backe SJ, Woodford MR. et al. Targeting extracellular Hsp90: A unique frontier against cancer. Front Mol Biosci. 2022;9:982593
73. Taherian A, Krone PH, Ovsenek N. A comparison of Hsp90alpha and Hsp90beta interactions with cochaperones and substrates. Biochem Cell Biol. 2008;86(1):37-45
74. Chakraborty A, Boel NM, Edkins AL. Edkins, HSP90 Interacts with the Fibronectin N-terminal Domains and Increases Matrix Formation. Cells. 2020;9:2
75. Yesilkent EN, Ceylan H. Investigation of the multi-targeted protection potential of tannic acid against doxorubicin-induced kidney damage in rats. Chem Biol Interact. 2022;365(110111):18
76. Tewabe A, Abate A, Tamrie M, Seyfu A, Abdela Siraj E. Targeted drug delivery - from magic bullet to nanomedicine: principles, challenges, and future perspectives. J Multidiscip Healthc. 2021;14:1711-1724
77. Zhang Y, Feng S, Cheng X, Lou K, Liu X, Zhuo M. et al. The potential value of exosomes as adjuvants for novel biologic local anesthetics. Front Pharmacol. 2023;14:1112743
78. Kooijmans SAA, Stremersch S, Braeckmans K, de Smedt SC, Hendrix A, Wood MJA. et al. Electroporation-induced siRNA precipitation obscures the efficiency of siRNA loading into extracellular vesicles. J Control Release. 2013;172(1):29-238
79. Cambier L, de Couto G, Ibrahim A, Echavez AK, Valle J, Liu W. et al. Y RNA fragment in extracellular vesicles confers cardioprotection via modulation of IL-10 expression and secretion. EMBO Mol Med. 2017;9(3):337-352
80. de Couto G, Gallet R, Cambier L, Jaghatspanyan E, Makkar N, Dawkins JF. et al. Exosomal microRNA transfer into macrophages mediates cellular postconditioning. Circulation. 2017;136(2):200-214
81. Walravens AS, Smolgovsky S, Li L, Kelly L, Antes T, Peck K. et al. Mechanistic and therapeutic distinctions between cardiosphere-derived cell and mesenchymal stem cell extracellular vesicle non-coding RNA. Sci Rep. 2021;11(1):021-87939
82. Dowdy SF. Overcoming cellular barriers for RNA therapeutics. Nat Biotechnol. 2017;35(3):222-229
83. Smyth T, Kullberg M, Malik N, Smith-Jones P, Graner MW, Anchordoquy TJ. Biodistribution and delivery efficiency of unmodified tumor-derived exosomes. J Control Release. 2015;199:145-55
84. Mulcahy LA, Pink RC, Carter DR. Routes and mechanisms of extracellular vesicle uptake. J Extracell Vesicles. 2014;3:4
85. Horibe S, Tanahashi T, Kawauchi S, Murakami Y, Rikitake Y. et al. Mechanism of recipient cell-dependent differences in exosome uptake. BMC Cancer. 2018;18(1):017-3958
86. Mathieu M, Martin-Jaular L, Lavieu G, Théry C. Specificities of secretion and uptake of exosomes and other extracellular vesicles for cell-to-cell communication. Nat Cell Biol. 2019;21(1):9-17
87. Cortajarena AL, Kajander T, Pan W, Cocco MJ, Regan L. Protein design to understand peptide ligand recognition by tetratricopeptide repeat proteins. Protein Eng Des Sel. 2004;17(4):399-409
88. Main ER, Xiong Y, Cocco MJ, D'Andrea L, Regan L. Design of stable alpha-helical arrays from an idealized TPR motif. Structure. 2003;11(5):497-508
89. Kajander T, Cortajarena AL, Main ER, Mochrie SG, Regan L. A new folding paradigm for repeat proteins. J Am Chem Soc. 2005;127(29):10188-90
90. Cortajarena AL, Yi F, Regan L. Designed TPR modules as novel anticancer agents. ACS Chem Biol. 2008;3(3):161-6
91. Gibson DG, Young L, Chuang RY, Venter JC, Hutchison CA, Smith HO. Enzymatic assembly of DNA molecules up to several hundred kilobases. Nat Methods. 2009;6(5):343-5
92. Aires A, Sousaraei A, Möller M, Cabanillas-Gonzalez J, Cortajarena AL. Boosting the Photoluminescent Properties of Protein-Stabilized Gold Nanoclusters through Protein Engineering. Nano Lett. 2021;21(21):9347-9353
93. Kechin A, Boyarskikh U, Kel A, Filipenko M. Cutprimers: a new tool for accurate cutting of primers from reads of targeted next generation sequencing. J Comput Biol. 2017;24(11):1138-1143
94. Friedländer MR, Mackowiak SD, Li N, Chen W, Rajewsky N. MiRDeep2 accurately identifies known and hundreds of novel microRNA genes in seven animal clades. Nucleic Acids Res. 2012;40(1):37-52
Author contact
![]() Corresponding author: Professor, Ana V. Villar Instituto de Biomedicina y Biotecnología de Cantabria (IBBTEC), Consejo Superior de Investigaciones Científicas (CSIC)-Universidad de Cantabria (UC), c/Albert Einstein 22, Santander, Spain; Tel: +34 942 206799; Fax: +34 942 266399; e-mail: villaraves.
Corresponding author: Professor, Ana V. Villar Instituto de Biomedicina y Biotecnología de Cantabria (IBBTEC), Consejo Superior de Investigaciones Científicas (CSIC)-Universidad de Cantabria (UC), c/Albert Einstein 22, Santander, Spain; Tel: +34 942 206799; Fax: +34 942 266399; e-mail: villaraves.
Citation styles
APA
RuizdelRio, J., Guedes, G., Novillo, D., Lecue, E., Palanca, A., Cortajarena, A.L., Villar, A.V. (2024). Fibroblast-derived extracellular vesicles as trackable efficient transporters of an experimental nanodrug with fibrotic heart and lung targeting. Theranostics, 14(1), 176-202. https://doi.org/10.7150/thno.85409.
ACS
RuizdelRio, J.; Guedes, G.; Novillo, D.; Lecue, E.; Palanca, A.; Cortajarena, A.L.; Villar, A.V. Fibroblast-derived extracellular vesicles as trackable efficient transporters of an experimental nanodrug with fibrotic heart and lung targeting. Theranostics 2024, 14 (1), 176-202. DOI: 10.7150/thno.85409.
NLM
RuizdelRio J, Guedes G, Novillo D, Lecue E, Palanca A, Cortajarena AL, Villar AV. Fibroblast-derived extracellular vesicles as trackable efficient transporters of an experimental nanodrug with fibrotic heart and lung targeting. Theranostics 2024; 14(1):176-202. doi:10.7150/thno.85409. https://www.thno.org/v14p0176.htm
CSE
RuizdelRio J, Guedes G, Novillo D, Lecue E, Palanca A, Cortajarena AL, Villar AV. 2024. Fibroblast-derived extracellular vesicles as trackable efficient transporters of an experimental nanodrug with fibrotic heart and lung targeting. Theranostics. 14(1):176-202.
This is an open access article distributed under the terms of the Creative Commons Attribution License (https://creativecommons.org/licenses/by/4.0/). See http://ivyspring.com/terms for full terms and conditions.