Theranostics
13.3
Impact Factor
- Current Issue
- Advance Articles
- Volume 16; 2026
- Volume 15; 2025
- Volume 14; 2024
- Volume 13; 2023
- Volume 12; 2022
- Archive
- Cover Images
- Cover Suggestion
- Special Issues
Top
Introduction
Results
Discussion
Materials and Methods
Supplementary Material
Acknowledgements
References
Introduction
Results
Discussion
Materials and Methods
Supplementary Material
Acknowledgements
References
International Journal of Biological Sciences
International Journal of Medical Sciences
 Global reach, higher impact

Theranostics 2024; 14(5):1956-1965. doi:10.7150/thno.93856 This issue Cite
Research Paper
H-ferritin-nanocaged gadolinium nanoparticles for ultra-sensitive MR molecular imaging
Jianlin Zhang1,2#, Chang Yuan1#, Lingfei Kong3#, Feiyan Zhu1, Wanzhong Yuan4, Junying Zhang1, Juanji Hong1, Fang Deng1, Qi Chen1, Chen Chen1, Tao Wang4 ![]() , Zhentao Zuo5
, Zhentao Zuo5 ![]() , Minmin Liang1
, Minmin Liang1 ![]()
1. Experimental Center of Advanced Materials, School of Materials Science & Engineering, Beijing Institute of Technology, Beijing, 100081, China.
2. Center of Basic Medical Research, Institute of Medical Innovation and Research, Peking University Third Hospital, Beijing, China.
3. National Laboratory of Biomacromolecules, Institute of Biophysics, Chinese Academy of Sciences, Beijing, China.
4. Department of Neurosurgery, Peking University Third Hospital, Beijing, 100191, China.
5. State Key Laboratory of Brain and Cognitive Science, Institute of Biophysics, Chinese Academy of Sciences, Beijing, 100101, China.
#These three authors contributed equally.
Received 2024-1-3; Accepted 2024-2-15; Published 2024-2-24
Citation:
Zhang J, Yuan C, Kong L, Zhu F, Yuan W, Zhang J, Hong J, Deng F, Chen Q, Chen C, Wang T, Zuo Z, Liang M. H-ferritin-nanocaged gadolinium nanoparticles for ultra-sensitive MR molecular imaging. Theranostics 2024; 14(5):1956-1965. doi:10.7150/thno.93856. https://www.thno.org/v14p1956.htm
Other stylesAbstract

Rationale: Magnetic resonance imaging (MRI) is a powerful diagnostic technology by providing high-resolution imaging. Although MRI is sufficiently valued in its resolving morphology, it has poor sensitivity for tracking biomarkers. Therefore, contrast agents are often used to improve MRI diagnostic sensitivity. However, the clinically used Gd chelates are limited in improving MRI sensitivity owing to their low relaxivity. The objective of this study is to develop a novel contrast agent to achieve a highly sensitive tracking of biomarkers in vivo.
Methods: A Gd-based nanoprobe composed of a gadolinium nanoparticle encapsulated within a human H-ferritin nanocage (Gd-HFn) has been developed. The specificity and sensitivity of Gd-HFn were evaluated in vivo in tumor-bearing mice and apolipoprotein E-deficient mice (Apoe-/-) by MRI.
Results: The Gd-HFn probe shows extremely high relaxivity values (r1 = 549 s-1mM-1, r2 = 1555 s-1mM-1 under a 1.5-T magnetic field; and r1 = 428 s-1mM-1 and r2 = 1286 s-1mM-1 under a 3.0-T magnetic field), which is 175-fold higher than that of the clinically standard Dotarem (Gd-DOTA, r1 =3.13 s-1mM-1) under a 1.5-T magnetic field, and 150-fold higher under a 3.0-T magnetic field. Owing to the substantially enhanced relaxivity values, Gd-HFn achieved a highly sensitive tracking for the tumor targeting receptor of TfR1 and enabled the in vivo MRI visualization of tumors approaching the angiogenic switch.
Conclusions: The developed Gd-HFn contrast agent makes MRI a more powerful tool by simultaneously providing functional and morphological imaging information, which paves the way for a new perspective in molecular imaging.
Keywords: magnetic resonance imaging, human H-ferritin, contrast agent, relaxivity value, molecular imaging
Introduction
Magnetic resonance imaging (MRI) is emerging as a powerful noninvasive clinical diagnostic technology that provides high-resolution anatomic images of living organisms on a microscopic and macroscopic scale [1,2]. However, the diagnostic sensitivity of MRI is relatively low and thus 40-50% of clinical MRI examinations have used contrast agents to enhance the detection sensitivity. Signal intensity in MRI is related to the proton relaxation rates of H2O in the surroundings tissues and can be enhanced by the administration of paramagnetic contrast agents prior to imaging. These administrated paramagnetic agents improve MRI anatomical images on the basis of their ability to increase the relaxation rates of nearby water proton spins. Gd chelates are by far the most commonly employed commercial MRI contrast agents in the clinic because of their strong paramagnetic properties [3,4]. However, their limited relaxivities, lack of selectivity, and difficulty in further functionalization prevent their further involvement in improving MRI sensitivity [5,6]. In addition, due to the toxicity of Gd ion (LD50 = 0.2 mmol kg -1 in mice), the induced high risks of nephrogenic systemic fibrosis for patients with renal dysfunction and Gd deposition disease also severely impede the further clinical applications of Gd chelates [7,8]. Therefore, it is critical to develop high-performance and safe Gd-based contrast agents by stabilizing toxic Gd ion while keeping the hydration number high and the water exchange rate optimal.
Ferritin is a spherical iron storage protein shell composed of 24 self-assembled subunits of two types, H-chain ferritin (heavy chain, 21 kDa, HFn) and L-chain ferritin (light chain, 19 kDa, LFn). Ferritin self-assembles naturally into a hollow protein cage with a 12 nm of outer diameter and an 8 nm diameter of interior hollow cavity [9]. The interior cavity of ferritin protein cage has been extensively employed as a natural template for preparing highly monodisperse and water-soluble metallic nanoparticles (NPs) [10-13]. We have previously reported that human HFn could specifically accumulate into tumors and atherosclerotic plaques via transferrin receptor 1 (TfR1)-mediated specific targeting followed by rapid internalization [14-19]. Herein, we synthesized a highly monodisperse Gd core within the interior cavity of HFn nanocage and achieved a sensitive MRI tracking of TfR1 with a remarkable enhanced relaxivity of water protons. The protein entrapment of Gd nanoparticle within HFn nanocage allows a substantively increased dipolar interactions of Gd with H2O molecules nearby and significantly enhanced proton relaxation within the interior confined space of HFn protein nanocage. In addition, we further demonstrated the feasibility of simultaneously acquiring functional parameters using this highly sensitive contrast agent, in addition to high-resolution anatomic MRI information.
So far, several Gd chelate complexes, including Gd-DTPA [20], Gd-Me(2)DO2A [21], and GdHPDO3A [22,23] have been loaded or conjugated to ferritin for MRI study. However, due to the unchanged fundamental coordination chemistry of the chelated Gd ions, only less than 10-fold enhancement in relaxivities has been achieved and the main parameters that affect their efficacy as a proton relaxation agent have rarely been changed. Very recently, Cigler et al. reported that the released Gd3+ ions from Gd chelates administrated intravenously bind to the iron oxyhydroxide core inside ferritin capsules under physiological conditions [24]. Yang et al. recently synthesized a Gd3+ compound and packaged it into ferritin nanocages for MRI imaging and multimodal therapy of tumors simultaneously [25]. These two works suggest a new strategy to develop Gd-based contrast agents by empolying ferritin platform. In this study, we show a bioengineered HFn-nanocaged Gd nanocore that achieved simultaneous MRI functional and morphological imaging, which paves the way for a new perspective in MRI molecular imaging.
Results
Development and characterization of Gd-HFn
Recombinant human HFn nanocages were expressed and purified from E. coli, as descried previously [14]. Gd-HFn NPs were prepared by loading Gd3+ into the cavities of HFn nanocages through the ion channel at the threefold axis of HFn nanocage, followed by the formation of Gd nanoparticle within the nucleation site (Figure 1A). After purification, the obtained Gd-HFn NPs were thoroughly characterized. Cryo-electron microscopy (cryo-EM) images first showed that the formation of the uniformly and monodispersed Gd NPs with an average diameter of ~1.0 nm that are clearly encapsulated within the HFn protein nanocages (Figure 1B-D). Inductively coupled plasma optical emission spectrometry (ICP-OES) quantitatively determined the amount of encapsulated Gd to be 37± 2 gadolinium per HFn nanocage (Figure S1). Dynamic light scattering (DLS) analysis further confirmed that the bioengineered Gd-HFn NPs are highly monodispersed with identical diameters before and after forming Gd NPs within HFn protein nanocages (Figure 1E). Size exclusion chromatography (SEC) characterization showed HFn and Gd-HFn NPs were eluted at the same volume, indicating that HFn nanocages are assembled intactly after encapsulating Gd3+ cations (Figure S2). Moreover, the CD spectra result of Gd-HFn NPs was identical to that of HFn nanocages (Figure 1F), further confirming that Gd3+ loading did not significantly perturb the secondary structure of HFn protein nanocages, showing that HFn nanocages refold into their native state upon the loading process. The stability of the prepared Gd-HFn was next evaluated by incubating Gd-HFn with 10% mouse serum at 37 °C, and monitored for Gd release using ICP-OES. Less than 10% Gd release was detected within 60 h of incubation (Figure S3), suggesting that the Gd-HFn NPs is sufficiently stable to retain Gd during transit through the systemic circulation. Further cell viability, necrosis, and apoptosis assays show no obvious cell toxicity even at a very high concentration of Gd-HFn (containing 2 mM Gd), which could cause significant toxicity while 2 mM of free Gd-DOTA was added (Figure S4), confirming the biosafety of Gd-HFn.
MR contrast properties of Gd-HFn
The MR contrast properties of the biosynthesized Gd-HFn NPs were evaluated in vitro at room temperature. The longitudinal (T1) and transverse (T2) relaxation times were measured respectively at different concentrations of Gd-HFn, and the relaxivities were determined to be r1 = 549 s-1mM-1, r2 = 1555 s-1mM-1 per Gd under a 1.5-T magnetic field, and r1 = 428 s-1mM-1, r2 = 1286 s-1mM-1 per Gd under a 3.0-T magnetic field (Figure 2), surpassing any previously reported relaxivity values to the best of our knowledge [26]. Gd-HFn showed about 175-fold higher r1 relaxivity than that of the clinically standard Gd-based T1 contrast agent Dotarem (Gd-DOTA, 3.13 s-1mM-1) under a 1.5-T magnetic field, and about 150-fold higher under a 3.0-T magnetic field (Figure 2A, B). The measured r2/r1 ratio of Gd-HFn were 2.8 and 3.0, respectively under the magnetic field strength of 1.5-T and 3.0-T, which is lower than 5, demonstrating that Gd-HFn should be a high-performance T1 contrast agent at 1.5-T and 3-T magnetic field [27]. The extremely high relaxivity values are likely due to the nanoscale confinement effect from HFn protein nanocage that contributes to their high MR contrast effect, which influences the paramagnetic behavior of the encapsulated Gd ions [28-30].
Figure 1
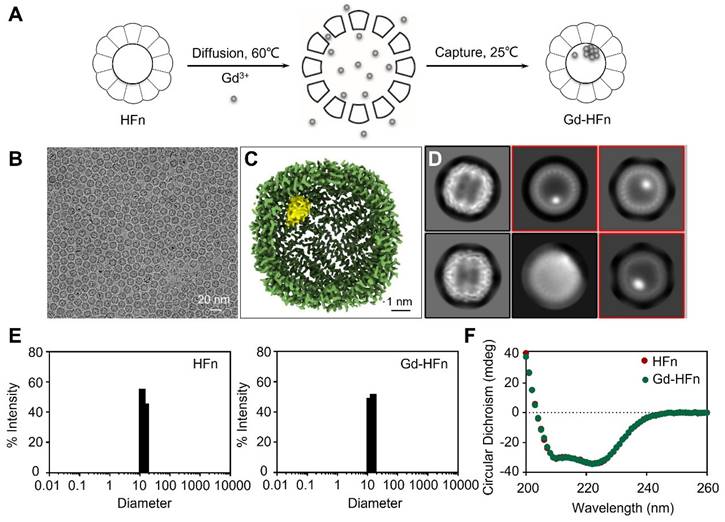
Preparation and characterization of Gd-HFn. (A) Schematic illustration of the preparation process of Gd-HFn NPs. (B) Cryo-EM images of the as-synthesized Gd-HFn. (C) Cryo-EM density map of the as-synthesized Gd-HFn determined at 3.6 Å resolution. HFn is coloured in Green, Gd are coloured in yellow. Scale bar represents 1 nm. (D) 2D class averages of Gd-HFn. Selected 2D classes are boxed in red. (E) DLS analysis of HFn nanocages (left) and Gd-HFn (right). (F) Circular dichroism spectra of HFn and Gd-HFn.
MR imaging of small tumors
We have previously reported that HFn protein can selectively bind to human tumors and significantly accumulate into tumor cells via TfR1-mediated specific targeting and the subsequent robust internalization [14,15]. The prepared HFn nanocages thus should be able to deliver the confined Gd NPs into tumor cells and perform Gd-based tumor MR imaging. We next investigated the specific uptake of Gd-HFn NPs into tumor cells. As shown in Figure 3A, Gd-HFn NPs substantially bound to MDA-MB-231 human breast cancer cells and the binding was significantly blocked by adding an excess of anti-TfR1 monoclonal antibody (mAb) as determined by flow cytometric analysis, confirming a specific binding of Gd-HFn to TfR1 on MDA-MB-231 tumor cells. The further saturation binding curve and Scatchard analysis demonstrate that the Kd value for Gd-HFn binding to MDA-MB-231 tumor cells is 55.8 nM and the total binding capacity Bmax is 39.4 × 10⁻¹⁹ mol/cell (Figure 3B), showing that Gd-HFn has a high binding affinity and capacity for TfR1-positive tumor cells. The next confocal images further show that the specific targeting of Gd-HFn NPs to MDA-MB-231 tumor cells leads to the further internalization and the subsequent trafficking of Gd-HFn into lysosomes (Figure 3C). We next quantitatively investigated the specific cell uptake of Gd-HFn in TfR1-positive MDA-MB-231 and TfR1-negtive MX-1 cells. We incubated MDA-MB-231 and MX-1 cells with 40 μg/mL of Gd-HFn for 8 h at 37 °C with constant motion. After the incubated cells were washed with PBS, the Gd uptake was determined using ICP measurements after digesting the cells. The results show that MDA-MB-231 internalized about 80 pmol of Gd per 106 cells (Figure S5). In contrast, a slight uptake was observed at TfR1-negtive MX-1 cells, indicating the TfR1-mediated specific selectivity.
Figure 2
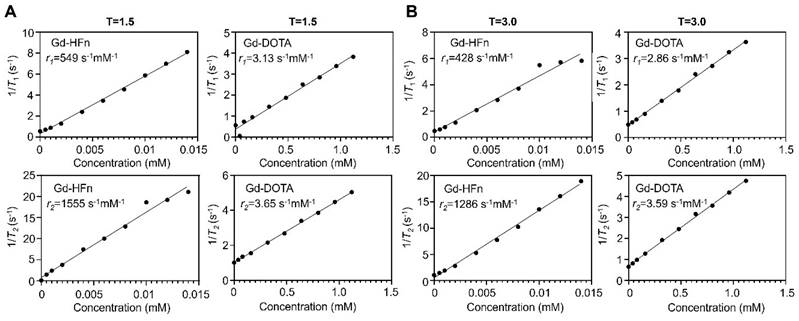
MR contrast properties of Gd-HFn. (A) 1/T1 and 1/T2 relaxation time plot of Gd-HFn and Gd-DOTA at different concentrations under a 1.5-T magnetic field. (B) 1/T1 and 1/T2 relaxation time plot of Gd-HFn and Gd-DOTA at different concentrations under a 3.0-T magnetic field.
We next evaluated the MR performance of Gd-HFn in vivo by T1-weighted MR imaging on MDA-MB-231 tumor-bearing mice with an MRI scanner. We employed an orthotopic breast tumor model in which we implanted Luciferase-transfected human MDA-MB-231 breast cells (Luciferase+ MDA-MB-231) in the mammary fat pad of female mice. When the tumor diameters reached about 2 mm, we injected tumor-bearing mice (n=5) through tail vein with Gd-HFn and performed MR imaging on each mouse before injection and at 10 min, 20 min, 30 min, 40 min and 50 min after injection, respectively (Figure 4). The images from after the injection demonstrated clear visualization of the tumors (Figure 4A). In parallel to the MR imaging of the mice, we also acquired optical images using the fluorescence signals from Luciferase+ MDA-MB-231 that were co-registered with the MRI image (Figure 4B), showing good colocalization between the MR and optical imaging. Image of the single tumor excised from the mice after the imaging showed the tumors for MR imaging were about 2 mm (Figure 4C). Quantification of the signal in the region of interest (ROI) of the tumors showed a significantly increase in the MR imaging as compared to before the injection of Gd-HFn (Figure 4D). The MR imaging signal-to-noise ratio increased from 10.4±0.5 before injection to maximum 18.0±0.6 at 20 min after injection. The contrast enhancement of Gd-HFn-based imaging became more remarkable when used for imaging large tumors (Figure S6). The in vivo imaging results showed that the high MR sensitivity of Gd-HFn enables the MR visualization of tumors as small as ~2 mm in diameter, which is approaching the angiogenic switch (1~2 mm) [31-33], the transition from diffusion-limited nutrition to neovascularization. The results indicate a meaningful tumor imaging of small numbers of malignant cells because tumor growth typically shows Gompertzian kinetics [34] with a lag phase starting from the single cell stage, and a log phase heralded by angiogenesis that promote tumor further progression and metastasis [35]. Gd-HFn thus shows the potential of imaging the smallest possible number of tumor cells before the angiogenic switch.
MR imaging of atherosclerotic plaques
Progressive inflammation drives atherosclerotic plaque formation, progression and rupture and are the compelling diagnostic targets for identifying high-risk plaques [36-38]. We have previously reported TfR1 receptors are overexpressed on a subset of the macrophage population in high-risk plaques [16]. Moreover, increased expression of HFn have been found in the macrophages after infiltrated into human high-risk plaques [39,40]. The developed Gd-HFn contrast agents thus can be employed for MR imaging of plaque vulnerability. We first evaluated the feasibility of MR imaging of atherosclerotic plagues by using Gd-HFn in apolipoprotein E-deficient mice (Apoe-/-) fed with a high-fat diet for 19, 25, and 34 weeks, respectively, to develop varying degrees of atherosclerosis. Wild-type C57/BL6 mice were employed as disease controls. The progressive development of atherosclerosis in Apoe-/- mice was evaluated by Oil Red O staining of the aortas excised from Apoe-/- mice (Figure 5A, B). We performed MR imaging on atherosclerotic and control mice before injection and at 10 min, 20 min, 30 min, 40 min and 50 min post-intravenous injection of Gd-HFn (Figure 5C). The images from after the injection showed clear visualization of atherosclerotic plaques in the aortas of atherosclerotic mice both in the transversal and coronal planes. In contrast, only indistinct images of atherosclerotic plaques in the aortas were observed from before the injection. The MRI signal-to-noise ratio of atherosclerotic plaques for transversal and coronal planes increased respectively from 11.1±0.7 and 11.9±0.2 before intravenous injection to maximum 16.8±1.1 and 18.4±1.1 at 30 min after injection of Gd-HFn NPs (Figure 5D). The results demonstrated the feasibility of MR imaging atherosclerotic plaques with Gd-HFn.
We next evaluated the in vivo toxicity of Gd-HFn in healthy BALB/c mice by detecting the loss of mice body weight after intravenous injection at the same dose of Gd-HFn (0.016 mmol Gd/kg body weight). Gd-HFn at 0.016 mmol Gd/kg body weight was well tolerated with no significant weight loss as compared with PBS controls during imaging procedures (Figure S7). We next assessed the biosafety of Gd-HFn NPs by pathological analysis of the main organs (including heart, liver, spleen, lung and kidney) from healthy mice after intravenous injection of Gd-HFn at the MR imaging dose (Figure S8). No abnormal organ pathological abnormality was found in the main organs of mice treated with Gd-HFn, showing the safety of Gd-HFn imaging at the tested doses.
Figure 3
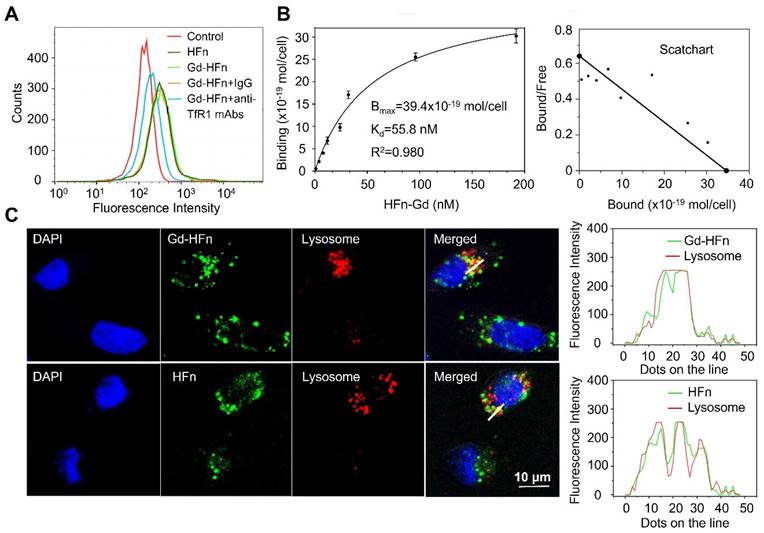
Characterization of Gd-HFn binding to tumor cells. (A) Flow cytometric analysis of the specific binding of Gd-HFn to MDA-MB-231 breast cancer cells. (B) FITC-conjugated Gd-HFn bound to MDA-MB-231 cancer cells with a Kd value of 55.8 nM and a total binding capacity Bmax of 39.4 × 10⁻¹⁹ mol/cell. (n=3 independent measurements, error bars represent mean ± s.d.). (C) Confocal images of the intracellular location of HFn and Gd-HFn in the lysosomes of MDA-MB-231 tumor cells. The right panels show the fluorescent signal profiles of the lysosome and the HFn or Gd-HFn along the lines drawn in the Merged pictures.
Figure 4
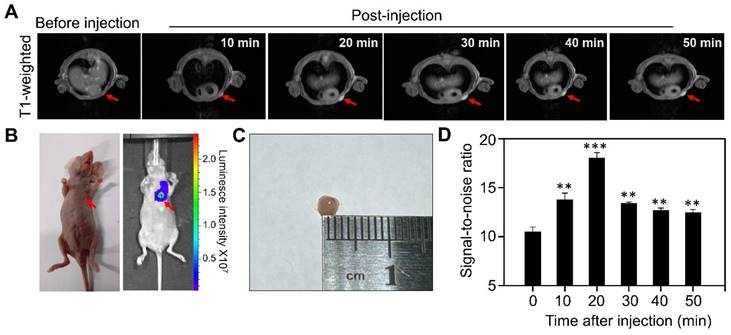
MR imaging of Micro tumors in living mice with Gd-HFn. (A) Representative MR imaging of the cross section of the MDA-MB-231 tumors implanted in mice before and after the injection of Gd-HFn. Arrows mark the tumor location. (B) Optical imaging of MDA-MB-231tumors implanted mice. (C) Image of the single tumor excised from the mice after the imaging. (D) Quantitative analysis of the signals in the tumor (marked by the arrows) showing a significantly increase as compared to before the injection. (n=5 independent measurements, error bars represent mean ± s.d., unpaired Student's t-test, **P < 0.01, ***P < 0.001 versus before injection).
Figure 5
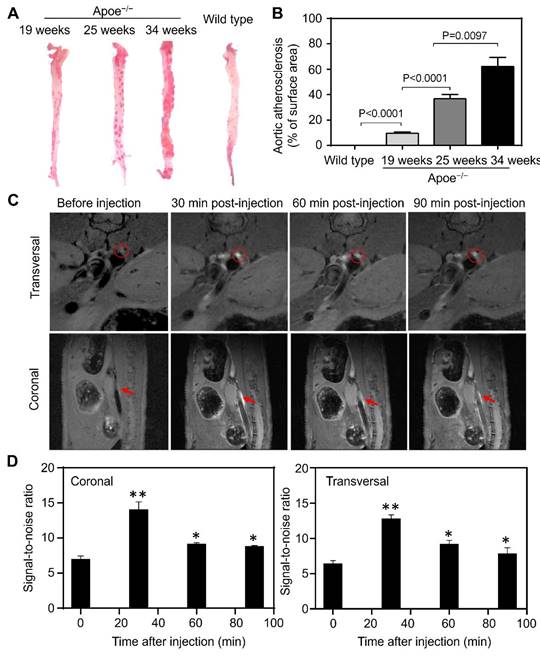
MR imaging of atherosclerotic plaques in living mice with Gd-HFn. (A) Representative ex vivo images of Oil Red O staining of aortas from Apoe-/- and control mice. (B) Quantitative analysis of the atherosclerotic plaque area of the entire aorta. (n=5 independent measurements, error bars represent mean ± s.d., unpaired Student's t-test). (C) Representative MR imaging of Apoe-/- mice carrying atherosclerotic plaques before and after the injection of Gd-HFn. Red circles and arrows indicate atherosclerotic plaques. (D) Quantitative analysis of the signals in the atherosclerotic plaques (marked by the red circles or arrows) showing a significantly increase as compared to before the injection. (n=5 independent measurements, error bars represent mean ± s.d., unpaired Student's t-test, *P < 0.05, **P < 0.01 versus before injection).
We next evaluated the pharmacokinetics and biodistribution of Gd-HFn in healthy BALB/c mice. The elimination blood half-life (t(1/2)β) of Gd-HFn was found to be 126 ± 7.0 min, whereas the blood half-life of Gd-DOTA was 24 ± 3.1 min (Figure S9A). The significantly longer blood half-life indicates improved drug retention in the systemic circulation and facilitates time-dependent Gd-HFn accumulation in disease targets. In addition, the background Gd concentration in major healthy organs decreased over the period of evaluation (Figure S9B), indicating a rapid clearance of Gd-HFn from the whole body, which thus provides a clear background for imaging targets. Moreover, the next blood chemistry data also exhibited no significant differences as compared with the PBS-treated control group (Table S1), further confirming the biosafety of Gd-HFn imaging at the tested doses. The results demonstrate that by encapsulating Gd into HFn protein nanocages significantly improves the biosafety of heavy metal Gd and thus increases the absolute concentration of Gd into the target lesion.
Discussion
We designed and tested a unique MRI contrast agent that represents an advance for MRI technique and may have a potential impact for the following reasons: (1) High relaxivity: Gd-HFn is, to our knowledge, the MRI contrast agent with the extremely high relaxivity values (r1 = 549 s-1mM-1 and r2 = 1555 s-1mM-1 under a 1.5-T magnetic field, and r1 = 428 s-1mM-1 and r2 = 1286 s-1mM-1 under a 3.0-T magnetic field), which is about 175-fold higher r1 relaxivity than that of the clinically standard Dotarem (Gd-DOTA, 3.13 s-1mM-1) under a 1.5-T magnetic field, and about 150-fold higher r1 relaxivity under a 3.0-T magnetic field. The r1 and r2 values are much better when compared to most Gd-based contrast agents described in the literature (Table S2). (2) Specificity: Human HFn specifically binds to TfR1, which has been found overexpressed in many pathological conditions such as tumors [14,15] and high-risk atherosclerotic plaques [16,18,41]. With the significantly improved relaxivity, Gd-HFn thus could achieve a sensitive biomarker tracking of TfR1 and enabled the in vivo visualization of tumors and high-risk atherosclerotic plaques via TfR1-mediated specific targeting. (3) Biocompatibility: The employed HFn nanocage is an iron storage protein that naturally exists in the human body and thus exhibits excellent biocompatibility when used in vivo. Moreover, HFn protein nanocages require no further functionalization with extra targeting ligands that might induce immune responses against the bioengineered Gd-HFn NPs. In addition, the toxic Gd ions are encapsulated within HFn nanocages and sufficiently stable passing through the systemic circulation. Nevertheless, the following systematic evaluation is still need to evaluate the biosafety of Gd-HFn for in vivo MR imaging. (4) Simplicity and easy scaling-up: HFn is expressed and produced from E. coli at high yield and the Gd ion payload process within HFn nanocage is simple and efficient. Importantly, the intrinsic target binding property of Gd-HFn with no need of extra surface modification enables a large-scale of reproducibility and further facilitates future clinical translation.
In summary, we report here an effective Gd-loaded HFn contrast agent for MR imaging. The bioengineered Gd-HFn showed good stability, safety, and high-sensitive tracking of the biomarker TfR1. This Gd-HFn contrast agent exhibited extremely high relaxivity values and enabled the in vivo MRI visualization of plaque vulnerability and ultra-small tumors approaching the angiogenic switch (~2 mm). We believe clinical MRI would demonstrate superior imaging characteristics by employing the developed Gd-HFn contrast agent.
Materials and Methods
Materials
Anhydrous calcium chloride, anhydrous sodium carbonate, and ethyl alcohol were purchased from Sinopharm Chemical Reagent Co. Ltd (Shanghai, China). Poly(acrylic acid) (PAA, Mw ≈ 1800) was purchased from Aldrich. Gadolinium nitrate (cat. no. 05660), Fluorescein isothiocyanate isomer I (FITC, cat. no. F7250), RPMI-1640 medium (cat. no. 11875093) and fetal bovine serum (FBS, cat. no. A5669501) was from Sigma. Gadolinium trinitrate (cat. no. R053801) was from Shaghai Rhawn Chemical Reagent Co., Ltd (Shanghai, China). All reagents were used as received without further purification. The commercially used Dotarem (Gd-DOTA) was produced by Guangdong Consun Pharmaceutical Group, China. BCA Protein Assay Kit (cat. no. A55864) was from Thermo Scientific.
Biosynthesis of Gd-HFn
Recombinant human HFn was expressed in E. coli and purified as descried previously [17]. The Gd-HFn NPs were prepared as follows. Briefly, gadolinium trinitrate was diluted to 120 μM and then added dropwise at a speed of 100 μL/min into 1 mL of stirring HFn solution (1 mg/mL; in 20 mM Tris-HCl, pH 8.0 containing 0.1 M NaCl) which was kept at 60 ℃ in a water bath. The dropping time was set as 30 min, 60 min, 90 min, 120 min, 150 min, 180 min, 210 min, 240 min. After the dropping was finished, the solution was stirred for another 120 min. The reaction vessel was then removed from the water bath and cooled naturally to the room temperature. The obtained solution was then dialyzed against the buffer of 20 mM Tris-HCl (pH 8.0) containing 0.1 M NaCl overnight to remove the free Gd cations.
Characterization
Transmission electron microscopy (TEM) (JEM-1400 Flash, Nippon Electronics, Japan) of HFn and Gd-HFn NPs was performed on TF20 high-resolution EM (FEI). Size-exclusion chromatography (SEC) (GE Healthcare, UK) analysis was performed on a HiLoad 16/600 Superdex 200 prep grade size exclusion chromate-graphy column (GE Healthcare, UK) connected to an AKTA avant 150 system (GE Healthcare, UK). Dynamic light scattering (DLS) (Wyatt Technology, USA) analysis of HFn and Gd-HFn NPs was performed on a DynaPro Titan system DLS instrument at 25 ℃. Circular Dichroism (CD) (Applied Photophysics, UK) spectra HFn and Gd-HFn nano-particles was performed on an Applied Photophysics Chirascan Plus spectrometer at 25 ℃.
Gadolinium quantification
Gadolinium quantification was measured using inductively coupled plasma optical emission spectrometry (ICP-OES, Thermo Scientific, model no. iCAP6300). Briefly, 0.2 mL of HFn-Gd NPs (0.5 mg/mL) were first digested in nitric acid at 150 ℃ in a metal bath thermostat for 10 min to dissolve HFn protein and the gadolinium content inside the cavity, and then 2% nitric acid was added to make the final reaction volume up to 10 mL. ICP-OES was settled as below: the radio frequency power is 1.0 KW, the carrier gas is Argon, the plasma flow is 15 L/min, the auxiliary gas flow is 1.5 L/min, the nebulizer gas flow is 0.75 L/min, the detector mode is axial mode, and the calibration type is linear. The duration of the process is 15 min. The digested HFn-Gd solution was analyzed for Gd using the ICP-OES. The standard curve of Gd was established using gadolinium nitrate with concentrations of 0.0, 0.1, 0.3, 0.5, 1.0, and 2.0 mg/mL. The Gd content was finally calculated according to the established standard curve.
Labeling of HFn and Gd-HFn
Fluorescein isothiocyanate isomer I (FITC) was dissolved in DMSO to 80 μM, and then added to HFn or Gd-HFn solution (4 μM in the buffer of 100 mM carbonate pH 9.0). The mixture was incubated at 4 ℃ overnight, and then purified with a PD MiniTrap G25 column (GE Healthcare) to remove the free FITC. The concentration of conjugated FITC was determined by measuring its optical density at 492 nm, the concentration of the HFn protein was determined using a BCA Protein Assay Kit.
Cell binding assay
MDA-MB-231 human breast cancer cells were from American Type Culture Collection (ATCC, NM-R03) and were cultured in RPMI-1640 medium containing 10% FBS. Flow cytometry was used to evaluate the specific binding of HFn or Gd-HFn NPs to MDA-MB-231 cells. In brief, 100 μL of cell suspension (1×10⁷ cells/mL) was incubated with 10 μg/mL FITC-HFn or FITC-Gd-HFn nano-particles on ice for 30 min. Mouse anti-human TfR1 antibody (10 μg/mL) or mouse IgG (10 μg/mL) was added in the mixture when needed. After rinsed in cold PBS for three times, the cells were analyzed immediately using a FACSCalibur flow cytometry system (Becton Dickinson).
Cellular uptake and distribution
The cellular uptake and distribution of HFn and Gd-HFn NPs were studied using a confocal laser scanning microscope (Olympus). In brief, MDA-MB-231 cells were incubated with FITC-HFn or FITC-Gd-HFn NPs (10 μg/mL) for 2 h at 37℃ in cell incubator. Then the cells were fixed with cold 4% paraformaldehyde for 30 min. 0.5% Triton X-100 was used to permeabilized the cells. After incubated with 5% goat serum, the cells were exposed to the primary anti-Lamp1 antibody (1:200; clone H4A3; Invitrogen), and then incubated with Alexa flour 647R-conjugated goat anti-mouse secondary antibodies (1:500, Invitrogen). Finally, the cells were stained with 4′,6-diamidino-2-phenylindole (DAPI) and observed under a fluorescence microscope.
In vitro MRI study
MRI experiments were performed on 1.5-T (Siemens Esensa) and 3.0-T clinical MRI scanner (Siemens Prisma) equipped with a microsurface coil. Spin-Lattice and Spin-Spin relaxation times (T1 and T2) were measured for different concentrations of HFn-Gd and Gd-DOTA in PBS at room temperature using the following parameters: field of view (FOV) = 22 cm × 22 cm, matrix = 320 × 320, repetition time (TR) = 5000 ms, echo time (TE) = 10, 20, 30, 40, 50, 60, 70, 80, 90, 100..., 320 ms (T2), TR = 4000 ms, and TE = 7.8 ms (T1). The longitudinal (r1) and transverse (r2) relaxivies were calculated from r2 = (1/Ti-1/T0)/c, where c is the concentration of HFn-Gd or Gd-DOTA in mM, Ti is the relaxation time at concentration c, T0 is the relaxation time of PBS, and i = 1 and 2 for T1 and T2, respectively.
In vivo MRI study
All animal experiments were performed in compliance with the guidelines for the care and use of laboratory animals and were approved by the biomedical research ethics committee of the Beijing Institute of Technology under the accreditation number V20200118. Female Balb/c nude mice (5-6 weeks, Charles River) were administered by injecting 0.2 mL of MDA-MB-231 cell suspension (1×10⁷ cells/mL) at their second pair of mammary fat pads to establish the in situ mammary cancer model. When the tumor grew to 2-mm, MRI was performed on the tumor-bearing mice in the small-animal systems of the Bruker Biospec MRI scanner. 1.5% isoflurane in pure oxygen was used to anesthetize the mice. Gd-HFn NPs were injected through the tail vein of the mice at a dose of 0.016 mmol Gd/kg animal body weight. A RARE sequence was continuously used for T1-weighted imaging for 1.5 h post-injection. The parameters for the mice were as follows: FOV = 4.0 cm × 4.0 cm, matrix = 256 × 256, TR = 550 ms, TE = 6.5 ms, and 8 slices at 1 mm thicknesses without gap. MR images were acquired by using Paravision 360 preclinical MRI software.
ApoE-/- mice (5-6 weeks, Charles River) were developed atherosclerosis by high-fat feeding (21% (wt/wt) fat; 0.15% (wt/wt) cholesterol) for 25 weeks. Oil red O staining was used to conform the existence of atherosclerotic plaques on the aorta. In brief, the aorta was cut from the mouse body and then was split. After being fixed by 10% formalin for 10 min, the split aorta was stained with oil red O for 30 min at 37 °C. The atherosclerotic plaques were taken pictures using a digital camera. After conforming the development of atherosclerosis, the mice in the same group were taken to MRI. The administrations of the mice and the MRI conditions are the same as the described above for the MRI of the tumor-bearing mice. A RARE sequence was continuously used for T1-weighted imaging for 1.5 h post-injection. The parameters for the mice were as follows: FOV = 2.56 cm × 2.56 cm, matrix = 256 × 256, TR = 920 ms, TE = 6.5 ms, and 8 slices at 0.5 mm thicknesses with 0.5 mm gap. MR images were acquired by using Paravision 360 preclinical MRI software.
Biodistribution and histopathological examinations
For biodistribution study, healthy BALB/c mice were administered by injecting Gd-HFn through the tail vein at a dose of 0.016 mmol Gd/kg animal body weight. At 1, 3, 9 and 24 h post-injection, the mice were sacrificed. The major tissues (including heart, liver, spleen, lung, kidney and brain) were collected, weighted and homogenized with an addition of 1:10 (wt/vol) acidified isopropanol in a tissue homogenizer on ice and extracted overnight at -20 ℃. All homogenate samples were then centrifuged at 4 °C for 10 min at 18,000 × g. The supernatant was removed and the remaining Gd cations in each sample was measured using ICP-OES. The results were presented as percentage of injected dose (%ID) per gram of tissue. Values are expressed as means ± s.d. for a group of five mice.
For histopathological examinations, healthy BALB/c mice were administered by injecting Gd-HFn NPs through the tail vein at a dose of 0.016 mmol Gd/kg animal body weight. At 2 weeks post-injection, the mice were killed. The major tissues (including heart, liver, spleen, lung, and kidney) were collected and fixed in 4% paraformaldehyde. A routine paraffin-embedded hematoxylin and eosin (H&E) histopathology staining procedure was performed for histopathological examinations.
Pharmacokinetics study
To determine the pharmacokinetic behavior, healthy BALB/c mice were administered by injecting Gd-HFn (0.016 mmol Gd/kg body weight) or Gd-DOTA (0.016 mmol Gd/kg body weight) through the tail vein (n = 5 for each group). At various times after injection, blood samples were collected from the tail vein and the plasma was separated and analyzed for Gd concentration using ICP-OES.
Statistical analysis
All statistical analyses were performed with GraphPad Prism 5.01 (GraphPad Software Inc.) software. Results were expressed as mean ±s.d. Unpaired Student's t tests were performed to evaluate the significance of differences between groups. A value of P < 0.05 was considered statistically difference (*P<0.05, **P < 0.01, ***P < 0.001).
Supplementary Material
Supplementary figures and tables.
Acknowledgements
J. Zhang, C. Yuan and L. Kong contributed equally to this work. This work was supported by the National Natural Science Foundation of China (T2225026, 82172087, 82071308), the National Key R&D Program of China (2022YFA1205801) and Beijing Institute of Technology Research Fund Program for Young Scholars.
Competing Interests
The authors have declared that no competing interest exists.
References
1. Senders ML, Calcagno C, Tawakol A, Nahrendorf M, Mulder WJ, Fayad ZA. PET/MR imaging of inflammation in atherosclerosis. Nat Biomed Eng. 2023;7(3):202-220
2. Zhou Z, Yang L, Gao J, Chen X. Structure-relaxivity relationships of magnetic nanoparticles for magnetic resonance imaging. Adv Mater. 2019;31(8):1804567
3. Qiu T, Wu T, Lu M, Xie Y, Zhang M, Luo D. et al. Reticular chemistry of the fcu-type Gd(III)-doped metal-organic framework for T1 -weighted magnetic resonance imaging. Small. 2023 2303063
4. Clough TJ, Jiang L, Wong KL, Long NJ. Ligand design strategies to increase stability of gadolinium-based magnetic resonance imaging contrast agents. Nat Commun. 2019;10(1):1420
5. Stinnett G, Taheri N, Villanova J, Bohloul A, Guo X, Esposito EP. et al. 2D gadolinium oxide nanoplates as T1 magnetic resonance imaging contrast agents. Adv Healthc Mater. 2021;10(11):2001780
6. Hsu JC, Tang Z, Eremina OE, Sofias AM, Lammers T, Lovell JF. et al. Nanomaterial-based contrast agents. Nat Rev Methods Primers. 2023;3(1):30
7. Li H, Meade TJ. Molecular magnetic resonance imaging with Gd(III)-based contrast agents: challenges and key advances. J Am Chem Soc. 2019;141(43):17025-17041
8. Mathur M, Jones JR, Weinreb JC. Gadolinium deposition and nephrogenic systemic fibrosis: a radiologist's primer. RadioGraphics. 2020;40(1):153-162
9. Theil EC. Ferritin: structure, gene regulation, and cellular function in animals, plants, and microorganisms. Annu Rev Biochem. 1987;56(1):289-315
10. Douglas T, Young M. Host-guest encapsulation of materials by assembled virus protein cages. Nature. 1998;393(6681):152-155
11. Lin X, Xie J, Zhu L, Lee S, Niu G, Ma Y. et al. Hybrid ferritin nanoparticles as activatable probes for tumor imaging. Angew Chem Int Ed Engl. 2011;50(7):1569
12. Zhang X, Zhang Y, Zhang R, Jiang X, Midgley AC, Liu Q. et al. Biomimetic design of artificial hybrid nanocells for boosted vascular regeneration in ischemic tissues. Adv Mater. 2022;34(14):2110352
13. Chen H, Tan X, Han X, Ma L, Dai H, Fu Y. et al. Ferritin nanocage based delivery vehicles: from single-, co-to compartmentalized-encapsulation of bioactive or nutraceutical compounds. Biotechnol Adv. 2022;61:108037
14. Fan K, Cao C, Pan Y, Lu D, Yang D, Feng J. et al. Magnetoferritin nanoparticles for targeting and visualizing tumour tissues. Nat Nanotechnol. 2012;7(7):459-464
15. Liang M, Fan K, Zhou M, Duan D, Zheng J, Yang D. et al. H-Ferritin-nanocaged doxorubicin nanoparticles specifically target and kill tumors with a single-dose injection. Proc Natl Acad Sci. 2014;111(41):14900-14905
16. Liang M, Tan H, Zhou J, Wang T, Duan D, Fan K. et al. Bioengineered H-ferritin nanocages for quantitative imaging of vulnerable plaques in atherosclerosis. ACS Nano. 2018;12(9):9300-9308
17. Zhang J, Cheng D, He J, Hong J, Yuan C, Liang M. Cargo loading within ferritin nanocages in preparation for tumor-targeted delivery. Nat Protoc. 2021;16(10):4878-4896
18. Wang T, He J, Duan D, Jiang B, Wang P, Fan K. et al. Bioengineered magnetoferritin nanozymes for pathological identification of high-risk and ruptured atherosclerotic plaques in humans. Nano Res. 2019;12(4):863-868
19. Song N, Zhang J, Zhai J, Hong J, Yuan C, Liang M. Ferritin: a multifunctional nanoplatform for biological detection, imaging diagnosis, and drug delivery. Acc Chem Res. 2021;54(17):3313-3325
20. Cai Y, Wang Y, Zhang T, Pan Y. Gadolinium-labeled ferritin nanoparticles as T1 contrast agents for magnetic resonance imaging of tumors. ACS Appl Nano Mater. 2020;3(9):8771-8783
21. Makino A, Harada H, Okada T, Kimura H, Amano H, Saji H. et al. Effective encapsulation of a new cationic gadolinium chelate into apoferritin and its evaluation as an MRI contrast agent. Nanomedicine Nanotechnol Biol Med. 2011;7(5):638-646
22. Aime S, Frullano L, Geninatti Crich S. Compartmentalization of a gadolinium complex in the apoferritin cavity: a route to obtain high relaxivity contrast agents for magnetic resonance imaging. Angew Chem Int Ed. 2002;41(6):1017-1019
23. Conti L, Lanzardo S, Ruiu R, Cadenazzi M, Cavallo F, Aime S. et al. L-ferritin targets breast cancer stem cells and delivers therapeutic and imaging agents. Oncotarget. 2016;7(41):66713
24. Neburkova J, Rulseh AM, Chang SL, Raabova H, Vejpravova J, Dracinsky M. et al. Formation of gadolinium-ferritin from clinical magnetic resonance contrast agents. Nanoscale Adv. 2020;2(12):5567-5571
25. Man X, Yang T, Li W, Li S, Xu G, Zhang Z. et al. Developing a gadolinium (III) compound based on apoferritin for targeted magnetic resonance imaging and dual-modal therapy of cancer. J Med Chem. 2023;66(11):7268-7279
26. Jenista ER, Wendell DC, Azevedo CF, Klem I, Judd RM, Kim RJ. et al. Revisiting how we perform late gadolinium enhancement CMR: insights gleaned over 25 years of clinical practice. J Cardiovasc Magn Reson. 2023;25(1):18
27. Zhou Z, Zhao Z, Zhang H, Wang Z, Chen X, Wang R. et al. Interplay between longitudinal and transverse contrasts in Fe3O4 nanoplates with (111) exposed surfaces. ACS Nano. 2014;8(8):7976-7985
28. Ananta JS, Godin B, Sethi R, Moriggi L, Liu X, Serda RE. et al. Geometrical confinement of gadolinium-based contrast agents in nanoporous particles enhances T1 contrast. Nat Nanotechnol. 2010;5(11):815-821
29. Johnson NJ, He S, Nguyen Huu VA, Almutairi A. Compact micellization: a strategy for ultrahigh T1 magnetic resonance contrast with gadolinium-based nanocrystals. ACS Nano. 2016;10(9):8299-8307
30. Hatakeyama W, Sanchez TJ, Rowe MD, Serkova NJ, Liberatore MW, Boyes SG. Synthesis of gadolinium nanoscale metal-organic framework with hydrotropes: manipulation of particle size and magnetic resonance imaging capability. ACS Appl Mater Interfaces. 2011;3(5):1502-1510
31. Gabarra-Niecko V, Schaller MD, Dunty JM. FAK regulates biological processes important for the pathogenesis of cancer. Cancer Metastasis Rev. 2003;22(4):359-374
32. Zhong L, Li Y, Xiong L, Wang W, Wu M, Yuan T. et al. Small molecules in targeted cancer therapy: advances, challenges, and future perspectives. Signal Transduct Target Ther. 2021;6(1):201
33. Abdalla AM, Xiao L, Ullah MW, Yu M, Ouyang C, Yang G. Current challenges of cancer anti-angiogenic therapy and the promise of nanotherapeutics. Theranostics. 2018;8(2):533
34. Norton L, Simon R, Brereton HD. Predicting the course of gompertzian growth. Nature. 1976;264:542-545
35. Frangioni JV. New technologies for human cancer imaging. J Clin Oncol. 2008;26(24):4012-4021
36. Robbins CS, Hilgendorf I, Weber GF, Theurl I, Iwamoto Y, Figueiredo JL. et al. Local proliferation dominates lesional macrophage accumulation in atherosclerosis. Nat Med. 2013;19(9):1166-1172
37. Hutcheson JD, Goettsch C, Bertazzo S, Maldonado N, Ruiz JL, Goh W. et al. Genesis and growth of extracellular-vesicle-derived microcalcification in atherosclerotic plaques. Nat Mater. 2016;15(3):335-343
38. Dweck MR, Jones C, Joshi NV, Fletcher AM, Richardson H, White A. et al. Assessment of valvular calcification and inflammation by positron emission tomography in patients with aortic stenosis. Circulation. 2012;125(1):76-86
39. Li W, Xu LH, Forssell C, Sullivan JL, Yuan XM. Overexpression of transferrin receptor and ferritin related to clinical symptoms and destabilization of human carotid plaques. Exp Biol Med. 2008;233(7):818-826
40. Kraml P, Potockova J, Koprivova H, Stipek S, Crkovska J, Zima T. et al. Ferritin, oxidative stress and coronary atherosclerosis. Vnitrní Lékarství. 2004;50(3):197-202
41. Terashima M, Uchida M, Kosuge H, Tsao PS, Young MJ, Conolly SM. et al. Human ferritin cages for imaging vascular macrophages. Biomaterials. 2011;32(5):1430-1437
Author contact
![]() Corresponding authors: E-mail: wangtaoedu.cn; E-mail: zuoztac.cn; E-mail: mmliangedu.cn.
Corresponding authors: E-mail: wangtaoedu.cn; E-mail: zuoztac.cn; E-mail: mmliangedu.cn.
Citation styles
APA
Zhang, J., Yuan, C., Kong, L., Zhu, F., Yuan, W., Zhang, J., Hong, J., Deng, F., Chen, Q., Chen, C., Wang, T., Zuo, Z., Liang, M. (2024). H-ferritin-nanocaged gadolinium nanoparticles for ultra-sensitive MR molecular imaging. Theranostics, 14(5), 1956-1965. https://doi.org/10.7150/thno.93856.
ACS
Zhang, J.; Yuan, C.; Kong, L.; Zhu, F.; Yuan, W.; Zhang, J.; Hong, J.; Deng, F.; Chen, Q.; Chen, C.; Wang, T.; Zuo, Z.; Liang, M. H-ferritin-nanocaged gadolinium nanoparticles for ultra-sensitive MR molecular imaging. Theranostics 2024, 14 (5), 1956-1965. DOI: 10.7150/thno.93856.
NLM
Zhang J, Yuan C, Kong L, Zhu F, Yuan W, Zhang J, Hong J, Deng F, Chen Q, Chen C, Wang T, Zuo Z, Liang M. H-ferritin-nanocaged gadolinium nanoparticles for ultra-sensitive MR molecular imaging. Theranostics 2024; 14(5):1956-1965. doi:10.7150/thno.93856. https://www.thno.org/v14p1956.htm
CSE
Zhang J, Yuan C, Kong L, Zhu F, Yuan W, Zhang J, Hong J, Deng F, Chen Q, Chen C, Wang T, Zuo Z, Liang M. 2024. H-ferritin-nanocaged gadolinium nanoparticles for ultra-sensitive MR molecular imaging. Theranostics. 14(5):1956-1965.
This is an open access article distributed under the terms of the Creative Commons Attribution License (https://creativecommons.org/licenses/by/4.0/). See http://ivyspring.com/terms for full terms and conditions.