Theranostics
13.3
Impact Factor
- Current Issue
- Advance Articles
- Volume 16; 2026
- Volume 15; 2025
- Volume 14; 2024
- Volume 13; 2023
- Volume 12; 2022
- Archive
- Cover Images
- Cover Suggestion
- Special Issues
Top
Introduction
Materials and Methods
Results and Discussion
Conclusions
Supplementary Material
Acknowledgements
References
Introduction
Materials and Methods
Results and Discussion
Conclusions
Supplementary Material
Acknowledgements
References
International Journal of Biological Sciences
International Journal of Medical Sciences
 Global reach, higher impact

Theranostics 2014; 4(2):163-174. doi:10.7150/thno.7064 This issue Cite
Research Paper
Gold Nanocage-Photosensitizer Conjugates for Dual-Modal Image-Guided Enhanced Photodynamic Therapy
Avinash Srivatsan1*, Samir V. Jenkins2*, Mansik Jeon3,4*, Zhijin Wu5, Chulhong Kim3,4 ![]() , Jingyi Chen2
, Jingyi Chen2 ![]() , Ravindra K. Pandey1
, Ravindra K. Pandey1 ![]()
1. Photodynamic Therapy Center, Roswell Park Cancer Institute Buffalo, NY 14263 (USA);
2. Department of Chemistry and Biochemistry, University of Arkansas, Fayetteville, AR 72701 (USA);
3. Department of Biomedical Engineering, The State University of New York, Buffalo, NY 14260 (USA).
4. Departments of Electrical Engineering and Creative IT Engineering, Pohang University of Science and Technology, Pohang 790-784 (Republic of Korea).
5. Department of Biostatistics, Brown University, Providence, RI 02912 (USA).
* These authors equally contributed on this work.
Received 2013-7-1; Accepted 2013-11-4; Published 2014-1-5
Citation:
Srivatsan A, Jenkins SV, Jeon M, Wu Z, Kim C, Chen J, Pandey RK. Gold Nanocage-Photosensitizer Conjugates for Dual-Modal Image-Guided Enhanced Photodynamic Therapy. Theranostics 2014; 4(2):163-174. doi:10.7150/thno.7064. https://www.thno.org/v04p0163.htm
Other stylesAbstract

We have demonstrated that gold nanocage-photosensitizer conjugates can enable dual image-guided delivery of photosensitizer and significantly improve the efficacy of photodynamic therapy in a murine model. The photosensitizer, 3-devinyl-3-(1'-hexyloxyethyl)pyropheophorbide (HPPH), was noncovalently entrapped in the poly(ethylene glycol) monolayer coated on the surface of gold nanocages. The conjugate is stable in saline solutions, while incubation in protein rich solutions leads to gradual unloading of the HPPH, which can be monitored optically by fluorescence and photoacoustic imaging. The slow nature of the release in turn results in an increase in accumulation of the drug within implanted tumors due to the passive delivery of gold nanocages. Furthermore, the conjugate is found to generate more therapeutic singlet oxygen and have a lower IC50 value than the free drug alone. Thus the conjugate shows significant suppression of tumor growth as compared to the free drug in vivo. Short-term study showed neither toxicity nor phenotypical changes in mice at therapeutic dose of the conjugates or even at 100-fold higher than therapeutic dose of gold nanocages.
Keywords: Gold Nanostructures, Drug Delivery, Fluorescence Imaging, Photoacoustic Imaging, Cancer Treatment.
Introduction
Gold nanostructures are an emerging class of promising multifunctional platforms for cancer theranostics due to their superior optical properties, chemically modifiable surface, and biological inertness.(1-3) They strongly scatter and absorb light at a tunable resonance frequency, known as localized surface plasmon resonance (LSPR). The LSPR enables enhanced contrast for a variety of optical imaging modalities including optical coherent tomography (OCT),(4-7) multi-photon photoluminescence imaging,(8-11) and photoacoustic tomography (PAT).(12-16) Furthermore, they can act directly as therapeutic agents by converting the light into heat for photothermal treatment of diseases.(17-19) When combined with drug molecules, Au nanostructures are widely applicable carriers for delivery of therapeutics to the target region, both passively and actively.(20-22) Drug molecules can be conjugated to the surface of Au nanostructures covalently or non-covalently via chemical bonds or intermolecular interactions, respectively. The latter is particularly appealing because the drug molecules remain unmodified, thereby minimizing the potential for alterations in drug efficacy and pharmacokinetics.(23) Hydrophobic interactions are an effective strategy to noncovalently incorporate lipophilic drug molecules within nanoparticle surface coating for drug delivery. Different types of surface coating have been demonstrated for this purpose including amphiphilic molecules(24) and polymers containing non-polar groups (e.g. poly(ethylene glycol), PEG).(25-27) Herein, we incorporate a hydrophobic photosensitizer, 2-devinyl-2-(1-hexyloxyethyl)pyropheophorbide (HPPH), into PEG covered on Au nanocages (AuNCs) as a theranostic agent for enhanced photodynamic therapy (PDT).
Photodynamic therapy is a known therapeutic modality that relies on the use of light to excite a photosensitizer molecule which in turn transfers the energy to local O2 molecules, changing them from the ground, triplet state to an excited, singlet state (1O2). The 1O2 molecules are highly sensitive to the environment and have an intracellular lifetime on the order of 3 μs.(28, 29) At the therapeutic dosage, their reaction with biomolecules leads to apoptosis and necrosis of cells.(30) Because of its transient nature, effective generation of 1O2 at the target site is important for the success of PDT. Several methods to improve PDT efficacy have been developed that use nanocarrier-based delivery, including liposomes,(31) polymeric micelles,(32, 33) pure nanocrystal forms,(34) silica nanoparticles,(35, 36) and polymeric nanoparticles.(37, 38) Recently, PEGylated Au nanoparticles have been demonstrated as nanocarriers to efficiently deliver photosensitizers for PDT.(25, 27) The hydrophobic photosensitizers were entrapped inside the PEG monolayer close to the surface of the Au nanoparticles and released rapidly at the tumor site within hours. In this case, the Au nanoparticles were used only as delivery vehicles because their LSPR peak was located in the visible region where light penetration is relatively superficial. By replacing spherical particles with nanorods, the LSPR maximum was shifted to the near-infrared (NIR) region where light penetrates deeper into biological tissue, enabling PDT to be coupled with photothermal therapy (PTT) to enhance the cancer treatment efficacy.(39, 40) More recently, multi-modal imaging has been demonstrated to monitor the delivery and treatment of particle-assemblies loaded with photosensitizers for cancer theranostics.(41) The loading efficiency was double that of nanorods because the hollow nature of the assemblies overcomes the limitation of the surface loading.The size of the particle-assemblies, however, was around 280 nm, which may be unfavaorable for in vivo delivery.
In this work, we develop AuNC-HPPH conjugates that incorporate the hydrophobic HPPH into the PEG monolayer on the AuNC surface. The size of the AuNC is relatively small with edge length of ~50 nm and hollow interior. The LSPR peak of AuNCs has been tuned to the NIR region, which enables in vivo tracking of the conjugate delivery by both fluorescence (FL) and photoacoustic (PA) imaging modalities. A “see and treat” approach has been established with the dual-modal imaging capability that provides complementary features to guide PDT. The FL imaging monitors the release of HPPH from the AuNC surface by distinguishing the aggregated (quenched) and non-aggregated (fluorescent) states of HPPH. The PA imaging reveals the volumetric distribution of AuNC in the tumor and monitors the therapeutic response of the treatment. More importantly, the efficacy of the PDT has been significantly improved by the presence of AuNCs because of local electromagnetic field enhancement of 1O2 generation and efficient delivery of the drug. Additionally, no observable toxiciy of the conjugates at therapeutic dose was found in the short-term study.
Materials and Methods
Synthesis and PEGylation of AuNCs: The AuNCs were synthesized by a two-step process using Ag cubes as a sacrificial template in the galvanic replacement reaction.(42) The LSPR peak of the AuNCs was tuned to 798 nm as monitored using a UV-vis-NIR spectrometer (Agilent HP8453). The size of the AuNCs was estimated by TEM analysis (JEOL 100cx). The composition of the the AuNCs was measured by atomic absorption spectrometer (GBC 932). The surface of the AuNCs was then derivatized with amine-terminated PEG thiol (HS-PEG-NH3+, M.W. = 5,000, JenKem). Briefly, 4 mg HS-PEG-NH3+ was dissolved in 4 mL water in a 20 mL vial. The solution was placed in an ice bath with stirring for 5 min. To this solution, 8 mL of 1 nM AuNC suspension was added dropwise over 5 min. The vial was flushed with argon for 10 min and allowed to stir overnight in the dark. After conjugation, the excess PEG was removed by washing the PEGylated AuNCs (AuNC-PEG) with water 3 times. The AuNC-PEG were redispersed in phosphate buffered saline (PBS) at a concentration of ~3 nM. The hydrodynamic diameter and zeta potential were determined using dynamic light scattering instrument (Brookhaven ZetaPALS).
Entrapment of photosensitizers to AuNC-PEGs: The photosensitizer, 3-devinyl-3-(1'-hexyloxyethyl)pyropheophorbide (HPPH) prepared in Dr. Pandey's laboratory,(43) was used in this study. The HPPH (7 mg, 11 μmol) was dissolved in 2.5 mL DMSO at a concentration of 4.5 mM as a stock solution. This stock solution (0.25 mL) was diluted in 4 mL of PBS to a concentration of ~0.3 mM. The diluted HPPH solution was flushed with Ar for 5 min and allowed to mix for an additional 5 min. The AuNC-PEG solution (3 nM, 2 mL) was added dropwise to the HPPH solution, and the reaction was allowed to stir overnight under the protection of argon in the dark. The product, containing noncovalently-incorporated HPPH on AuNC-PEG (AuNC-HPPH), was then washed with PBS three times and redispersed in PBS at a concentration of 6 nM with a loading efficiency of ~1 × 10⁵ HPPHs per AuNC.
The release of HPPH was monitored by fluorescence (Horiba FluoroLog3), optical absorbance, and PA amplitude in serum. The PA measurement was performed using a home-made PA imaging system.(44, 45) Briefly, a tunable OPO laser (Surelite OPO PLUS, Continuum), pumped by a Q-switched Nd:YAG laser (SLII-10, Continuum), produced laser pulses with 5 ns pulse widths at a rate of 10 Hz. The illumination was focused on a Tygon tube filled with an aqueous suspension of AuNC-HPPH conjugates with serum. The resultant PA waves were detected by a 5 MHz ultrasound transducer (V308, Panametrics-NDT). For each data point, the PA signals were averaged from 10 B-scan images of the same solution at multiple positions at wavelengths of 665 and 685 nm.
Measurement of singlet oxygen generation: The production of 1O2 was monitored with singlet oxygen sensor green® (SOSG, Invitrogen). Measurements were carried out in D2O (Cambridge Isotope Laboratories) to increase 1O2 lifetime. Briefly, SOSG was dissolved in MeOH at a concentration of ~5 mM as a stock solution and then diluted in 2 mL of PBS in D2O to give a final concentration of ~10 μM. Equimolar HPPH as free HPPH or AuNC-HPPH was added to the SOSG solution. Each sample was irradiated for 20 min by a Xenon lamp (Newport) with a 650-680 nm filter and a fluence of 15 J/cm2. After irradiation, AuNCs were digested by addition of 10 μL of 0.5 M KCN for 10 min to advoid interference. Fluorescence spectra of SOSG were acquired using λex = 488 nm.
Cell line and animal model: The Colon-26 cell line was cultured in RPMI medium (Invitrogen) supplemented with 10% fetal bovine serum (FBS, Hyclone) at 37 oC with 5% CO2. BALB/c mice, aged 6-8 weeks, were obtained from the National Cancer Institute (NCI). The Colon-26 tumor model was generated by subcutaneous injection of ~1 × 10⁶ Colon-26 cells in 100 μL PBS into the right rear flank. Animals used in the studies had a tumor volume of 50-60 mm3 (typically 5-7 days after inoculation). All animal experiments were conducted in compliance with the guidelines for the care and use of research animals established by the Animal Studies Committee of Roswell Park Cancer Institute or the State University of New York at Buffalo.
Evaluation of PDT efficacy in vitro: The Colon-26 cells were reseeded in 96-well plates at a density of 3 × 10³ cells/well. After overnight incubation, equimolar HPPH as free HPPH or AuNC-HPPH were added to the wells and incubated at 37°C with 5% CO2 for 24 h in the dark. Before PDT treatment, the medium was replaced with fresh drug-free medium. The cells were then illuminated by the argon-pumped dye laser at a wavelength of 665 nm and a fluence of 0.25 J/cm2. After PDT treatment, the cells were incubated for another 48 h at 37°C with 5% CO2 in the dark. The cell viability was assessed by 3-[4, 5-dimethylthiazol-2-yl]-2,5-diphenyltetrazoliumbromide (MTT) assay. Briefly, 10 µL of 4 mg/mL MTT in PBS was added to each well and incubated for 4 h. After incubation, the solution was completely removed, and then 100 µL DMSO was added to dissolve the formazan crystals in each well. The absorbance at 570 nm was read using a microplate reader (BioTek ELx800). Each experiment was performed with three replicates.
Fluorescence imaging in vivo: Six tumor-bearing mice (~ 20 g) were randomly divided into two groups (n = 3). The mice were anesthetized by inhalation of isoflurane (2% in 100% oxygen). The mice in Groups 1 and 2 were injected intravenously with 0.3 µmol/kg HPPH as free HPPH and AuNC-HPPH, respectively. Prior to fluorescence imaging, the hair at the tumor region was depilated using a hair-removal lotion. The mice were imaged using a Nuance optical imaging system (Cambridge Research) with excitation wavelength at 665 nm. Fluorescence images were acquired using a 700 nm long pass filter. The fluorescence intensity of the region of interest (ROI) encompassing the tumor was analyzed for each image using the Image J (NIH) software.
Evaluation of PDT efficacy in vivo: Fourteen tumor-bearing mice (~ 20 g) were randomly divided into three groups. The mice in Groups 3 (n = 4) and 4 (n = 5) were intravenously injected with 0.3 µmol/kg HPPH as AuNC-HPPH and free HPPH, respectively. The mice in Group 5 (n = 5) were administered with 100 μL of PBS as a control. At 24 h post-injection, each mouse was positioned in a specially-designed mouse holder and exposed to laser irradiation at a wavelength of 665 nm with a fluence of 135 J/cm2 at a rate of 75 mW/cm2 under the non-anesthetic condition. After irradiation, the tumor regrowth of each mouse was monitored. Mice were monitored up to 60 days post-treatment and euthanized once the tumor volume reached 400 mm3. The results were plotted as Kaplan Meier curve using Graphpad Prism software.
PA monitoring of PDT in vivo: The in vivo PA experiments were carried out using the same system as described previously for monitoring the release kinetics. To enhance the spatial resolution, a 10-MHz-single-element ultrasound transducer was used with the resolutions of 125 μm and 140 μm in the axial and transverse directions, respectively. Each volumetric image with a field of view (FOV) of 1.4 × 1.4 cm2 took ~25 min with a fluence of 1 mJ/cm2. The mice were initially anesthetized by intraperitoneal injection of a mixture of ketamine (85 mg/kg of body weight) and xylazine (15 mg/kg). Prior to imaging, the hair at the tumor region was depilated using a hair-removal lotion. The mouse was placed on top of an animal holder and positioned under the water container. During PA imaging process, the mice were anesthetized by inhalation of isoflurane (0.75 % in 1 L/min oxygen). PA imaging was performed on tumor-bearing mice (~ 20 g) before and after intratumoral injection of 100 μL of 10 nM AuNC-HPPH. The mice were then treated with PDT with a dose of 135 J/cm2, followed by PA imaging at various time points up to 9 days after treatment.
Biodistribution and toxicity studies: For biodistribution studies, nine BALB/c mice (~ 20 g) were randomly divided into three groups (n = 3). The mice in Groups 6, 7 and 8 were injected intravenously with 100 μL of 10, 30 and 100 nM AuNCs, respectively. At 24-h post-injection, animals were euthanized and necropsy was performed to isolate major organs (i.e., spleen, liver, kidney, heart, and lung). Organs were placed on a glass plate for ex vivo PA imaging. The organs harvested from mice without treatment were used as controls. For toxicity studies, eighteen BALB/c mice (~ 20 g) were randomly divided into three groups (n = 3). The mice in Groups 9, 10 and 11 were injected intravenously with 100 μL of 10, 30 and 100 nM AuNCs, respectively. Groups 12 and 13 were injected intraveneously with therapeutic dose of AuNC-HPPH (0.3 μmol/kg HPPH). Group 14 was the control without treatment. The animals were monitored for 28 days to investigate the phenotypical response. During this period, physical examinations, including weights and behaviors, were performed regularly. At the end of the study period, the mice were euthanized and necropsy was performed to harvest the major organs (i.e., spleen, liver, kidney, heart and lung), which were then fixed and stained with hematoxylin and eosin (H&E) for histology studies.
Results and Discussion
The multifunctional platform consists of AuNCs coated with a PEG layer (AuNC-PEG) in which HPPH is noncovalently loaded (AuNC-HPPH) (Fig. 1A). The AuNCs were synthesized using galvanic replacement between Ag nanocubes and HAuCl4, resulting in a composition of 91% Au and 9% Ag by mass. The average edge length of the AuNCs was 52.6 ± 8.2 nm, and the LSPR maximum was at 801 nm after PEGylation (Fig. 1B). The hydrodynamic diameter of the as-prepared AuNC coated with PVP was 91.8 ± 7.1 nm and the zeta potential was -16.7 ± 1.4 mV in 1 mM KCl aqueous solution. PEGylation was accomplished using heterobifunctional PEG with a thiol group at one terminus and an amine at the other (HS-PEG-NH3+). The HS-PEG-NH3+ was anchored to the surface of AuNC through the Au-thiol bond, while the exposed amine formed a cationic surface that can be further functionalized. The hydrodynamic diameter of AuNC-PEG was 98.6 ± 0.9 nm and the zeta potential was positive (+4.79 ± 0.23 mV) in 1 mM KCl aqueous solution, indicating the success of PEGylation. The loading mechanism is based on the hydrophobic interaction between the porphyrin and the -CH2-CH2- group of PEG.(46) After incorporation of HPPH, the LSPR peak was red-shifted to 829 nm (Fig. 1C) due to the refractive index change of the surface layer.(47) The peaks at 517, 550, 624, and 684 nm, as well as the shoulder at 669 nm, were attributed to absorption by the HPPH molecules, and the slight red-shifting can be attributed to a change in electron density as a result of conjugation. The hydrodynamic diameter of the HPPH incorporated AuNC-PEG (AuNC-HPPH) remains unchanged (100 ± 1.1 nm), while the zeta potential of the conjugates became negative (-25.73 ± 1.23 mV) in 1 mM KCl aqueous solution. The discrepancy in the zeta potential before and after loading of HPPH could be due to the influence of the negatively-charged carboxylate group on the HPPH at neutral pH. Quantification of AuNC concentration has been well-established in our previous publications.(48, 49) The concentration of AuNCs is estimated from an extinction-concentration curve derived from measurement of the average size and the atomic Au and Ag concentration of AuNCs (Supplementary Material: Fig. S1). The final HPPH loading concentration was determined to be approximately 1 × 10⁵ HPPHs per AuNC based on the recovered fluorescence after dissolution of a known amount of AuNCs using KCN (Fig. 1D and Supplementary Material: Fig. S2).
Figure 1
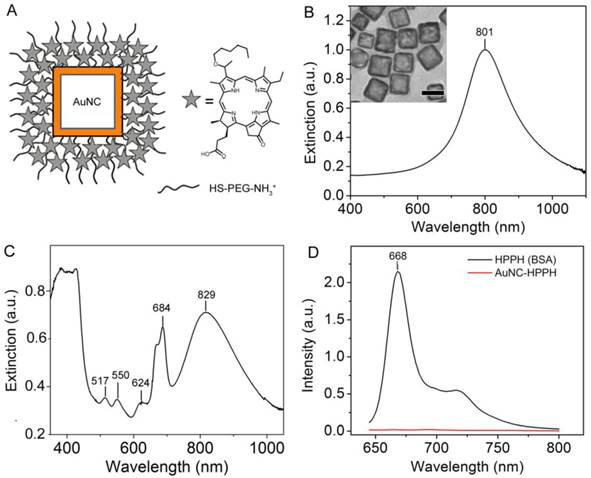
(A) Schematic illustration of AuNC-HPPH conjugate. The UV-vis-NIR spectra of the AuNCs with an LSPR peak at 801 nm and an edge length of 52.6 ± 8.2 nm before (B) and after (C) loading with HPPH. Inset of (B) shows the TEM image of the AuNCs with a scale bar of 50 nm. (D) Fluorescence spectra of AuNC-HPPH before (red) and after KCN etching (black).
The release of HPPH from the AuNC-HPPH was studied in serum to better understand the conjugate's interaction with blood and interstitial environments. The AuNC-HPPH suspensions were incubated in serum or PBS over 24 h. Fluorescence was gradually recovered in the protein-containing serum (Supplementary Material: Fig. S3A) but barely recovered in PBS. The lack of fluorescence in PBS primarily results from HPPH aggregation.(34) For this reason, the release in PBS was also monitored by measuring the absorption spectra of the supernatant at various times (Supplementary Material: Fig. S3B). It was found that while over 80% of the drug was unloaded by the serum within 24 h, only 3% of the payload was released in PBS (Fig. 2A).
The release profile can also be monitored using PA amplitude since both AuNC and HPPH can function as exogenous PA contrast agents.(13, 50) As the amplitude of PA signal is proportional to the light absorption,(44) extinction spectra were acquired and compared with the change of PA signal during the release. The extinction spectrum of AuNC-HPPH initially included two convoluted peaks at 665 and 685 nm (Fig. 2B) which could be attributed to the high local concentration of HPPH,(51) metalation of the pheophorbide ring,(52) metal-HPPH interactions,(53) or a combination thereof. During release, the peak at 685 nm disappeared while the peak at 665 nm was augmented. Figure 2, C and D, shows the changes of PA signals over the period of 30 h at 665 and 685 nm in serum. As expected, the PA signal at 685 nm decreased as a function of time due to the decrease of light absorption at this wavelength. Surprisingly, the PA signal decreased over time at 665 nm in contrast to the increase of absorbance. This discrepancy is attributed to the fluorescence recovery of HPPH, which offers a competitive relaxation pathway (i.e. emission) to the nonradiative decay. At close proximity to AuNC, the fluorescence of HPPH was quenched through energy transfer to the metal surface. As a result, the energy dissipated nonradiatively as heat whose conversion efficiency was linearly proportional to the amplitude of the PA pressure waves. During the release of HPPH from the metal surface, the recovery of quenched fluorescence led to the reduction of the nonradiative energy decay, and thus the decrease of PA signal. After 30 h, the signal at 685 nm decreased to less than 50%, while the signal at 665 nm leveled off at 60%. The slower decay rate of PA signal at 665 nm was the result of the near-doubling of the light absorption compared to that at 685 nm.
Figure 2
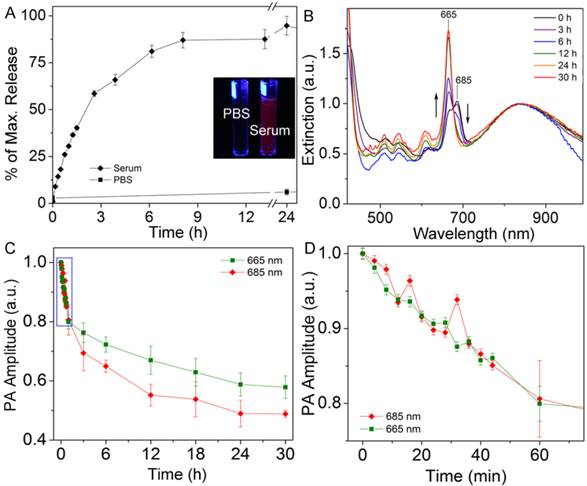
(A) Comparison of 24 h release kinetics of AuNC-HPPH in serum (diamonds) and PBS (squares). Inset depicts photograph of vials containing AuNC-HPPH in PBS (left) and serum (right) under UV light illumination. (B) UV-vis-NIR spectra of AuNC-HPPH in serum at different time periods, with PA wavelengths marked. Spectra are normalized to the AuNC LSPR peak. (C) Plot of normalized PA signal amplitude of AuNC-HPPH in serum as a function of time at λ = 665 nm (green square) and 685 nm (red diamond). (D) Blow-up view of the box region in (C).
Figure 3
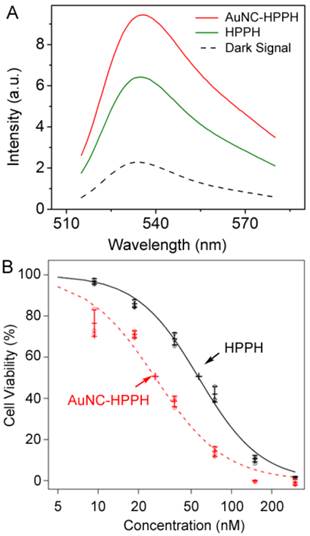
(A) Fluorescence spectra of SOSG in PBS/D2O after different treatments: in the dark as a control (black dashes), and after light irradiation at 665 nm with a dose of 15 J/cm2 and treatment with AuNC-HPPH (red) or HPPH (green). (B) Plot of cell viability as a function of concentration after treatment with free HPPH (black) and AuNC-HPPH (red), followed by light irradiation at a fluence of 0.25 J/cm2. The dose response curves were fitted using the method of least squares (p < 0.05).
Photodynamic therapy relies on photoexcited molecules to generate reactive oxygen species, mainly 1O2, for destruction of malignant cells. To investigate the potential efficacy of AuNC-HPPH for PDT, SOSG was used to qualitatively measure the 1O2 generation.(54) Interestingly, 73% enhancement of 1O2 signal was observed for the AuNC-HPPH conjugates as compared to the same amount of free HPPH upon light irradiation at 665 nm with a fluence of 15 J/cm2 (Fig. 3A). As control experiments (Supplementary Material: Fig. S4A), SOSG in absence of drugs shows no change in the fluorescence signal following irradiation, confirming that the sensor alone does not directly respond to the light. On the other hand, the 1O2 generation from AuNC alone is negligible upon light irradiation at the 1 pM concentration. The results implied that the HPPH in proximity to AuNCs could enhance the probability of 1O2 generation upon irradiation as compared to free HPPH. This enhancement is possibly due to the overlap between the LSPR of AuNCs (~800 nm) and the phosphorescence emission of HPPH (750-800 nm).(55, 56) Replacing the aqueous solution with MeOH, the enhancement fell to 26% as compared to free HPPH (Supplementary Material: Fig. S4B). The decrease of 1O2 signal is attributed to the near-complete release of HPPH from the AuNC-HPPH conjugate in methanol. Interestingly, the 1O2 signal of AuNC-HPPH and a combination of AuNC and HPPH was nearly identical; suggesting that the prescence of the AuNCs in the tumor would continue to enhance 1O2 generation after HPPH is released.
The efficacy of PDT was evaluated in vitro using Colon-26 cell line. The cells were incubated with the free drug and the AuNC-HPPH at equimolar HPPH concentrations. After 24 h incubation, the cells were irradiated with 665 nm light at a fluence of 0.25 J/cm2, followed by incubation for another 48 h. Cell viability was then assessed by MTT assay. Figure 3B shows the plot of cell viability as a function of HPPH concentration under different conditions. The dose response curves were fitted by the method of least squares. The estimated IC50 concentrations were 57 and 27 nM for HPPH and AuNC-HPPH, respectively (p < 0.05). The relatively-high potency of the AuNC-HPPH could be the result of the increased 1O2 generation and/or the increased uptake of the AuNC-HPPH by the tumor cells as compared to the free HPPH.
The delivery of HPPH to the tumor was further monitored by fluorescence imaging in vivo using a Colon-26 tumor-bearing mouse model. Two groups of Colon-26 tumor-bearing BALB/c mice (3 mice per group) were intravenously administered with free HPPH and HPPH-AuNCs using equal HPPH amounts (0.3 µmol/kg). The fluorescence intensity of the tumor region was monitored up to 48 h post-injection. Figure 4, A-F and G-L show the fluorescence images of representative mice injected by AuNC-HPPH and HPPH, respectively. In either case, the fluorescence at the tumor region increased with time and reached a peak at 24 h post-injection. The strong fluorescence signal was mainly localized at the tumor region for the AuNC-HPPH treated mouse whereas the fluorescence intensity was relatively weak at the tumor site and elevated in other organs for the HPPH treated mouse. The fluorescence intensity of the tumor region was further plotted as a function of post-injection time for the two groups (Fig. 4M). A linear model is fitted to the fluorescence data, resulting in p < 0.05 for all time points. At 2 h post-injection, the fluorescence intensity for the HPPH was higher than that for the AuNC-HPPH. This discrepancy could be attributed to two factors: different accumulation rates for small molecules and nanoparticles and/or fluorescence quenching of HPPH at close proximity to the AuNC surface. At 8 h post-injection, the fluorescence intensity for the HPPH was significantly lower than that of the AuNC-HPPH, suggesting that the HPPH gradually released from the conjugates in agreement with the release profile in serum discussed earlier. At the same time, the AuNC-HPPH was accumulated more efficiently within the tumor as compared to the HPPH alone due to the enhanced permeability and retention (EPR) effect.(57)
Figure 4
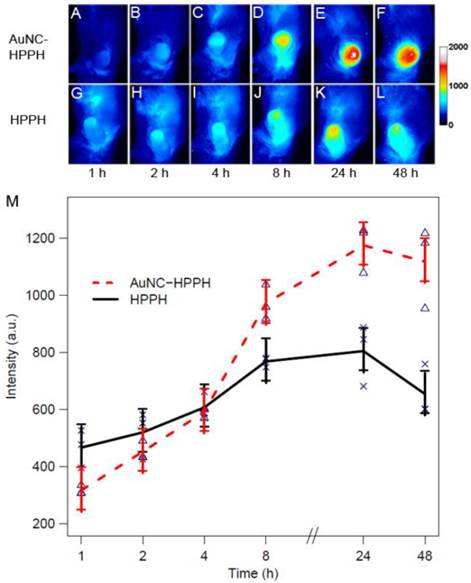
In vivo whole body fluorescence images of Colon-26 tumor-bearing mice acquired after intravenous injection of 0.3 µmol/kg of HPPH as AuNC-HPPH (A-F) and HPPH (G-L). (M) Plot of fluorescence intensity of the tumor region as a function of time for two groups of mice (3 mice per group) intravenously administered with AuNC-HPPH (red) and HPPH (black). The mean values and the standard errors were obtained by fitting the raw data using a linear model (p < 0.05). The measurements at each time point were labeled for AuNC-HPPH (triangles) and HPPH (crosses).
The PDT efficacy was evaluated in vivo using Colon-26 tumor-bearing mouse model. Two groups of tumor-bearing mice (5 mice per group) were intravenously injected with HPPH (0.3 µmol/kg) as free HPPH or AuNC-HPPH. As a control group, 5 mice were intravenously injected with PBS. Guided by FL imaging, the mice were treated with 665-nm laser irradiation for 30 min with a total light dose of 135 J/cm2 at 24 h post-injection when the accumulation of the conjugates reached the peak. After the PDT treatment, tumor growth was monitored by measuring the tumor size for up to 60 days. The mice were euthanized when the tumor grew to 400 mm3. Figure 5 shows the Kaplan-Meier plot (percent survival versus time) that compares the in vivo PDT efficacies of three groups treated with different conditions. Of the mice treated with free HPPH, only 1 of the 5 mice remained alive with tumor size < 400 mm3 (20% survival) at 60 days post-treatment. Of the mice treated with AuNC-HPPH, 3 of 5 mice survived with tumor size remained < 400 mm3 (60% survival) at 60 days post-treatment. In contrast, no mouse in the control group with PBS injection survived beyond 15 days post-treatment. These results suggest that the survival rate of the AuNC-HPPH treated mice is higher than the HPPH-treated mice under the same irradiation condition, indicating the higher potency of AuNC-HPPH as compared to the equal amount of free HPPH.
Figure 5
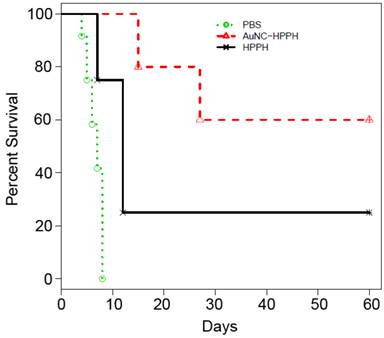
Kaplan-Meier plot of percent survival of Colon-26 tumor-bearing mice after intravenous injection of PBS (green), HPPH (0.3 µmol HPPH/kg, black), and AuNC-HPPH (0.3 µmol HPPH/kg, red), followed by light irradiation with a fluence of 135 J/cm2.
The high potency of the AuNC-HPPH formulation could be attributed to the increased accumulation of HPPH to the tumor region through the EPR effect of the nanocarriers, as well as the enhanced 1O2 generation in the presence of AuNC. Due to the high HPPH loading per AuNC (1 × 10⁵ HPPHs per AuNC), the AuNC dose is on the order of 30 pM which is nearly three orders of magnitude lower than that of PTT (10 nM).(58) Under PDT conditions (75 mW/cm2 for 30 min), the temperature rise of ~0.1 nM AuNC-HPPH was negligible (Supplementary Material: Fig. S5A). In this case, the photothermal effect on the PDT efficacy could be ruled out. Additionally, the entrapped HPPH has essentially no influence on the photothermal capability of the AuNCs (Supplementary Material: Fig. S5B). Potentially, the PDT and PTT can be combined to further improve the survival rate of cancer.
Photoacoustic imaging was used to further assess the PDT efficacy in vivo. This method was demonstrated on a tumor-bearing BALB/c mouse which was imaged before and after intratumoral injection of AuNC-HPPH, followed by PDT treatment. Figure 6, A-E, shows photographs of the tumor taken before and over nine days following PDT post injection of AuNC-HPPH. Prior to intratumoral injection of AuNC-HPPH, a control PA image was acquired at an optical wavelength of 829 nm (Fig. 6F). The tumor boundary and tumor-feeding vasculature were clearly visualized. After injection of AuNC-HPPH, the distribution of AuNC-HPPH within the tumor was clearly mapped (Fig. 6G) and served as background signal of AuNCs. After PDT, a series of PA images were obtained at 3, 7 and 9 days post-treatment (Fig. 6, H-J). The PA amplitude increased significantly after PDT treatment, suggesting that the contrast mainly resulted from the necrotic effect due to the draining of AuNCs from tumor region over a long period of time. Thus, mapping of the PA signal provides information about the necrotic region after PDT treatment. At 7 days post-treatment, the PA signal amplitude further increased in the tumor necrotic region whose boundary matched well with the corresponding photograph. Figure 6, K-O, shows the respective depth-sensitive cross-sectional PA B-scan images of Figure 6, F-J. The imaging depth information of Fig 6, K-O, was further mapped using pseudo color as shown in Figure 6, P-T, respectively. The bottom of the tumor necrotic regions was around 3-4 mm from the skin surface.
Figure 6
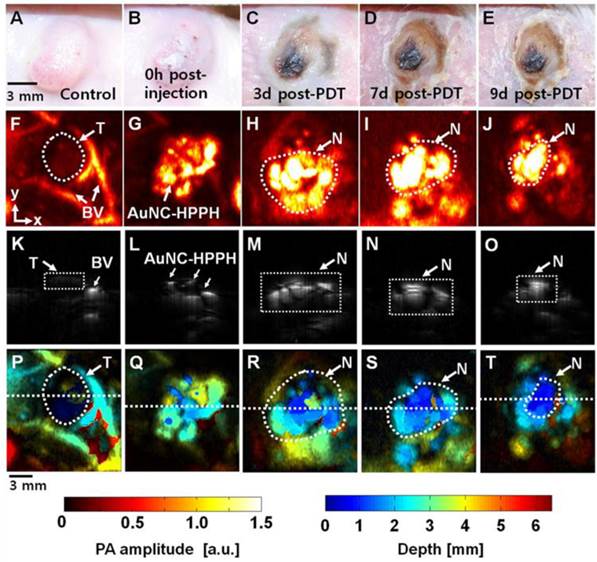
(A-E) Photograph of the tumor taken before and after PDT with an injection of AuNC-HPPH at various time points up to 9 days. PA images acquired (F) before intratumoral injection of AuNC-HPPH, (G) after injection, and (H-J) 3, 7, and 9 days post-treatment. (K-O) Depth-resolved PA B-scan images cut along the dotted lines in (F-J), respectively. (P-T) Depth-encoded PA images of (F-J), respectively. BV, blood vessels; T, Tumor boundary; and N, tumor necrotic region.
In order to translate the conjugate to clinic, the biocompatibility of AuNCs is important from a clinical perspective. The biosafety of AuNCs has yet to be understood or well-studied in animals, although several studies have been performed on therapeutic Au-based nanoparticles such as spherical particles,(59) SiO2@Au core-shell particles,(60) and nanorods.(61) In this study, we investigate the biodistribution and short-term toxicity of AuNC-PEG at therapeutic or higher dose. AuNC is an excellent exogenous contrast agent for PA imaging with a detection limit of 4.5 pM (or ~9 × 10-21 mol of AuNCs per imaging voxel). We have demonstrated the use of PA to quantify the accumulation of AuNC-PEGs ex vivo 24 h post-injection.(13) Three groups of BALB/c mice (n = 3 per group) were intravenously injected with a dose of 100 µL AuNCs with three different concentrations, 10, 30, and 100 nM (1, 3, and 10 pmol). For comparison, the corresponding organs from untreated mice were used as controls. Figure 7A shows the photograph of the four excised spleens with injections of 0, 1, 3, and 10 pmol of AuNCs, and their corresponding PA images (Fig. 7B). The PA signal of the spleen increases with the injection dose. The PA amplitude of the spleen collected from the mouse after injection of AuNC at a dose of 10 pmol was ~740 % stronger than that from a non-treated mouse. The PA amplitude from the different organs was plotted in Figure 7C. The PA signal intensity is dose-dependent, and the change of signal was low at the therapeutic dose (1 pmol) as compared to the control. The AuNC-PEG mainly accumulated in the liver and spleen, which agrees well with previous data.(62)
The short-term toxicity was also performed for both the therapeutic dose of AuNC-HPPH and high dose of AuNC-PEG. In this study, mice were monitored for 28 days after injection of therapeutic dose of AuNC-HPPH (0.3 μmol/kg HPPH) and three different doses of AuNC-PEG (1, 3, and 10 pmol) to examine any phenotypical changes. During the course of the experiment, neither weight loss nor abnormal behavior was observed in any of the mice. After 28 day post-treatment, histological analysis was performed on five organs including spleen, liver, kidney, lung, and heart (Fig. 8). No tissue toxicity or visible differences were found with therapeutic dose of AuNC-HPPH compared to the control mice without treatment. Similar result was found in 7 day post-treatment without any observable difference (Supplementary Material: Fig. S6). When the dose of AuNC-PEG (10 pmol) was increased to ~100 times of the therapeutic dose (~0.1 pmol), scattered macrophages with multiple dark granules in the cytoplasm were found, indicating the presence of AuNCs in the spleen of the mice. Macrophages are known sites for nanoparticle accumulation and actively take up various nanoparticles.(63) Similar uptake by the macrophages was observed in the liver, however, no dark granules were found in the Kupffer cells in the same mouse. No dark granules were found in the kidney, lung, and heart of the mouse at the dose of 10 pmol. These results suggest that there was no observable toxicity at the therapeutic dose of AuNC-HPPH or even at 100-fold higher than therapeutic dose of AuNC-PEG in the 28-day study.
Figure 7
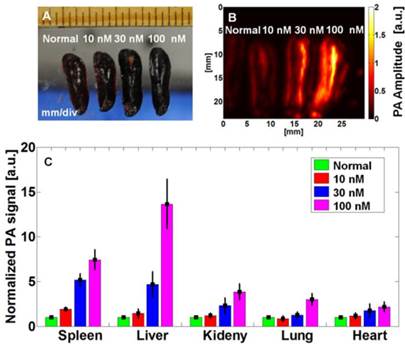
Biodistribution study of mice that were intravenously injected with 100 μL of AuNC-PEGs at different concentrations for 24 h. (A) Photographs of excised spleens, (B) ex vivo PA images of excised spleens acquired at 700 nm, and (C) biodistribution of AuNCs in different excised organs.
Figure 8
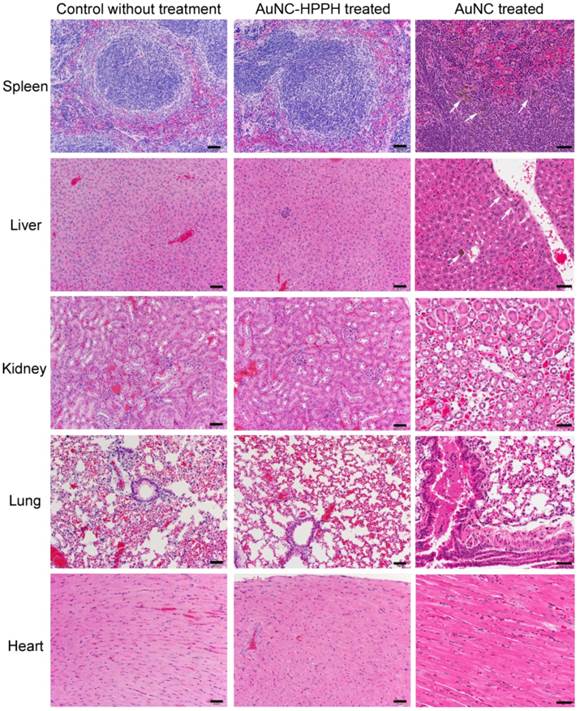
Photographs of representative H&E staining tissue sections of mice after 28 days of different treated conditions: Control mouse without treatment (left column), AuNC-HPPH treated at 0.3 μmol/kg of HPPH (middle column), and AuNC treated at a dose of 10 pmol (right column). The scale bars are 50 μm.
Conclusions
We have demonstrated AuNC-HPPH conjugates as a multifunctional agent for enhanced PDT. HPPH entrapped within a PEG layer can be delivered more effectively to the tumor as compared to free HPPH. The presence of the AuNCs enhances the 1O2 generation and the phototoxicity of the HPPH in vitro. The growth of the tumor in vivo was suppressed possibly due to the combination of the effective delivery and the enhanced phototoxicity of the AuNC-HPPH conjugates. In addition, the FL and PA imaging were demonstrated as an informative tool to monitor the progression of delivery and tumor treatment following PDT. A short-term study showed a relatively-low toxicity of the therapeutic-dose conjugates and high-dose AuNCs. This AuNC-HPPH system could potentially be translated from bench-top research to preclinical and clinical trials.
Supplementary Material
Fig.S1 - Fig. S6.
Acknowledgements
This work was supported by the pilot project fund from Roswell Park Alliance to R.K.P. and C.K.; startup fund from the University of Arkansas, the fund from the Arkansas Biosciences Institute to J.C.; as well as NRF grant of Korea government (MSIP) (2011-0030075), and MSIP (Ministry of Science, ICT and Future Planning), Korea, under the “IT Consilience Creative Program” (NIPA-2013-H0203-13-1001) supervised by the NIPA (National IT Industry Promotion Agency) to C.K.
Competing Interests
The authors have declared that no competing interest exists.
References
1. Dreaden EC, Alkilany AM, Huang X, Murphy CJ, El-Sayed MA. The golden age: gold nanoparticles for biomedicine. Chem Soc Rev. 2012;41:2740-79
2. Bardhan R, Lal S, Joshi A, Halas NJ. Theranostic Nanoshells: From Probe Design to Imaging and Treatment of Cancer. Acc Chem Res. 2011;44:936-46
3. Xia Y, Li W, Cobley CM, Chen J, Xia X, Zhang Q. et al. Gold Nanocages: From Synthesis to Theranostic Applications. Acc Chem Res. 2011;44:914-24
4. Loo C, Lin A, Hirsch L, Lee M-H, Barton J, Halas N. et al. Nanoshell-Enabled Photonics-Based Imaging and Therapy of Cancer. Tech Cancer Res & Treatment. 2004;3:33-40
5. Chen J, Saeki F, Wiley BJ, Cang H, Cobb MJ, Li Z-Y. et al. Gold Nanocages: Bioconjugation and Their Potential Use as Optical Imaging Contrast Agents. Nano Lett. 2005;5:473-7
6. Cang H, Sun T, Li Z-Y, Chen J, Wiley BJ, Xia Y. et al. Gold Nanocages as Contrast Agents for Spectroscopic Optical Coherence Tomography. Opt Lett. 2005;30:3048-50
7. Oldenburg AL, Hansen MN, Ralston TS, Wei A, Boppart SA. Imaging Gold Nanorods in Excised Human Breast Carcinoma by Spectroscopic Optical Coherence Tomography. J Mater Chem. 2009;19:6407-11
8. Park J, Estrada A, Sharp K, Sang K, Schwartz JA, Smith DK. et al. Two-Photon-Induced Photoluminescence Imaging of Tumors using Near-Infrared Excited Gold Nanoshells. Opt Express. 2008;16:1590-9
9. Au L, Zhang Q, Cobley CM, Gidding M, Schwartz AG, Chen J. et al. Quantifying the Cellular Uptake of Antibody-Conjugated Au Nanocages by Two-Photon Microscopy and Inductively Coupled Plasma Mass Spectrometry. ACS Nano. 2009;4:35-42
10. Tong L, Cobley CM, Chen J, Xia Y, Cheng J-X. Bright Three-Photon Luminescence from Gold/Silver Alloyed Nanostructures for Bioimaging with Negligible Photothermal Toxicity. Angew Chem Int Ed. 2010;49:3485-8
11. Gao L, Fei J, Zhao J, Li H, Cui Y, Li J. Hypocrellin-Loaded Gold Nanocages with High Two-Photon Efficiency for Photothermal/Photodynamic Cancer Therapy in Vitro. ACS Nano. 2012;6:8030-40
12. Kim C, Favazza C, Wang LV. In Vivo Photoacoustic Tomography of Chemicals: High-Resolution Functional and Molecular Optical Imaging at New Depths. Chem Rev. 2010;110:2756-82
13. Kim C, Cho EC, Chen J, Song KH, Au L, Favazza C. et al. In Vivo Molecular Photoacoustic Tomography of Melanomas Targeted by Bioconjugated Gold Nanocages. ACS Nano. 2010;4:4559-64
14. Akers WJ, Kim C, Berezin M, Guo K, Fuhrhop R, Lanza GM. et al. Noninvasive Photoacoustic and Fluorescence Sentinel Lymph Node Identification using Dye-Loaded Perfluorocarbon Nanoparticles. ACS Nano. 2010;5(1):173-82
15. Lozano N, Al-Jamal WT, Taruttis A, Beziere N, Burton NC, Van den Bossche J. et al. Liposome-Gold Nanorod Hybrids for High-Resolution Visualization Deep in Tissues. J Am Chem Soc. 2012;134:13256-8
16. Kim C, Song H-M, Cai X, Yao J, Wei A, Wang LV. In vivo photoacoustic mapping of lymphatic systems with plasmon-resonant nanostars. J Mater Chem. 2011;21:2841-4
17. Hirsch LR, Stafford RJ, Bankson JA, Sershen SR, Rivera B, Price RE. et al. Nanoshell-mediated near-infrared thermal therapy of tumors under magnetic resonance guidance. Proc Nat Acad Sci. 2003;100:13549-54
18. Huang X, El-Sayed IH, Qian W, El-Sayed MA. Cancer Cell Imaging and Photothermal Therapy in the Near-Infrared Region by Using Gold Nanorods. J Am Chem Soc. 2006;128(6):2115-20
19. Chen J, Wang D, Xi J, Au L, Siekkinen A, Warsen A. et al. Immuno Gold Nanocages with Tailored Optical Properties for Targeted Photothermal Destruction of Cancer Cells. Nano Lett. 2007;7:1318-22
20. Peer D, Karp JM, Hong S, Farokhzad OC, Margalit R, Langer R. Nanocarriers as an Emerging Platform for Cancer Therapy. Nat Nanotech. 2007;2:751-60
21. Ghosh P, Han G, De M, Kim CK, Rotello VM. Gold nanoparticles in delivery applications. Adv Drug Delivery Rev. 2008;60:1307-15
22. Rana S, Bajaj A, Mout R, Rotello VM. Monolayer Coated Gold Nanoparticles for Delivery Applications. Adv Drug Del Rev. 2012;64:200-16
23. Knop K, Hoogenboom R, Fischer D, Schubert US. Poly(ethylene glycol) in Drug Delivery: Pros and Cons as Well as Potential Alternatives. Angew Chem Int Ed. 2010;49:6288-308
24. Kim CK, Ghosh P, Pagliuca C, Zhu Z-J, Menichetti S, Rotello VM. Entrapment of Hydrophobic Drugs in Nanoparticle Monolayers with Efficient Release into Cancer Cells. J Am Chem Soc. 2009;131:1360-1
25. Cheng YC. Samia A, Meyers JD, Panagopoulos I, Fei B, Burda C. Highly Efficient Drug Delivery with Gold Nanoparticle Vectors for in Vivo Photodynamic Therapy of Cancer. J Am Chem Soc. 2008;130:10643-7
26. Cheng Y, Samia AC, Li J, Kenney ME, Resnick A, Burda C. Delivery and Efficacy of a Cancer Drug as a Function of the Bond to the Gold Nanoparticle Surface. Langmuir. 2009;26:2248-55
27. Cheng Y, Meyers JD, Broome A-M, Kenney ME, Basilion JP, Burda C. Deep Penetration of a PDT Drug into Tumors by Noncovalent Drug-Gold Nanoparticle Conjugates. J Am Chem Soc. 2011;133:2583-91
28. Kuimova MK, Yahioglu G, Ogilby PR. Singlet Oxygen in a Cell: Spatially Dependent Lifetimes and Quenching Rate Constants. J Am Chem Soc. 2008;131:332-40
29. Egorov SY, Kamalov VF, Koroteev NI, Krasnovsky Jr AA, Toleutaev BN, Zinukov SV. Rise and decay kinetics of photosensitized singlet oxygen luminescence in water. Measurements with nanosecond time-correlated single photon counting technique. Chem Phys Lett. 1989;163(.):421-4
30. Jarvi MT, Niedre MJ, Patterson MS, Wilson BC. Singlet Oxygen Luminescence Dosimetry (SOLD) for Photodynamic Therapy: Current Status, Challenges and Future Prospects. Photochem Photobiol. 2006;82:1198-210
31. Derycke ASL, de Witte PAM. Liposomes for photodynamic therapy. Adv Drug Delivery Rev. 2004;56(.):17-30
32. van Nostrum CF. Polymeric micelles to deliver photosensitizers for photodynamic therapy. Adv Drug Delivery Rev. 2004;56:9-16
33. Cinteza LO, Ohulchanskyy TY, Sahoo Y, Bergey EJ, Pandey RK, Prasad PN. Diacyllipid Micelle-Based Nanocarrier for Magnetically Guided Delivery of Drugs in Photodynamic Therapy. Mol Pharm. 2006;3(.):415-23
34. Baba K, Pudavar HE, Roy I, Ohulchanskyy TY, Chen Y, Pandey RK. et al. New Method for Delivering a Hydrophobic Drug for Photodynamic Therapy Using Pure Nanocrystal Form of the Drug. Mol Pharm. 2007;4:289-97
35. Ohulchanskyy TY, Roy I, Goswami LN, Chen Y, Bergey EJ, Pandey RK. et al. Organically Modified Silica Nanoparticles with Covalently Incorporated Photosensitizer for Photodynamic Therapy of Cancer. Nano Lett. 2007;7:2835-42
36. Kim S, Ohulchanskyy TY, Pudavar HE, Pandey RK, Prasad PN. Organically Modified Silica Nanoparticles Co-encapsulating Photosensitizing Drug and Aggregation-Enhanced Two-Photon Absorbing Fluorescent Dye Aggregates for Two-Photon Photodynamic Therapy. J Am Chem Soc. 2007;129:2669-75
37. Bechet D, Couleaud P, Frochot C, Viriot M-L, Guillemin F, Barberi-Heyob M. Nanoparticles as vehicles for delivery of photodynamic therapy agents. Trends Biotech. 2008;26:612-21
38. Wang S, Fan W, Kim G, Hah HJ, Lee Y-EK, Kopelman R. et al. Novel Methods to Incorporate Photosensitizers Into Nanocarriers for Cancer Treatment by Photodynamic Therapy. Lasers Surg Med. 2001;43:686-95
39. Jang B, Park J-Y, Tung C-H, Kim I-H, Choi Y. Gold Nanorod-Photosensitizer Complex for Near-Infrared Fluorescence Imaging and Photodynamic/Photothermal Therapy In Vivo. ACS Nano. 2011;5(2):1086-94
40. Choi WI, Kim J-Y, Kang C, Byeon CC, Kim YH, Tae G. Tumor Regression In Vivo by Photothermal Therapy Based on Gold-Nanorod-Loaded, Functional Nanocarriers. ACS Nano. 2011;5(3):1995-2003
41. Lin J, Wang S, Huang P, Wang Z, Chen S, Niu G. et al. Photosensitizer-Loaded Gold Vesicles with Strong Plasmonic Coupling Effect for Imaging-Guided Photothermal/Photodynamic Therapy. ACS Nano. 2013
42. Skrabalak SE, Au L, Li X, Xia Y. Facile Synthesis of Ag Nanocubes and Au Nanocages. Nat Protoc. 2007;2:2182-90
43. Pandey RK, Sumlin AB, Constantine S, Aoudia M, Potter WR, Bellnier DA. et al. Alkyl Ether Analogs of Chlorophyll-a Derivatives: Part 1. Synthesis, Photophysical Properties and Photodynamic Efficacy. Photochem Photobiol. 1996;64:194-204
44. Cho EC, Kim C, Zhou F, Cobley CM, Song KH, Chen J. et al. Measuring the Optical Absorption Cross Sections of Au-Ag Nanocages and Au Nanorods by Photoacoustic Imaging. J Phys Chem C. 2009;113:9023-8
45. Kim C, Jeon M, Wang LV. Nonionizing photoacoustic cystography in vivo. Opt Lett. 2011;36(18):3599-601
46. Li Y-C, Rissanen S, Stepniewski M, Cramariuc O, Róg T, Mirza S. et al. Study of Interaction Between PEG Carrier and Three Relevant Drug Molecules: Piroxicam, Paclitaxel, and Hematoporphyrin. J Phys Chem B. 2012;116:7334-41
47. Wilets KA, Duyne RPV. Localized Surface Plasmon Resonance Spectroscopy and Sensing. Ann Rev Phys Chem. 2007;58:267-97
48. Chen J, Wiley B, Li ZY, Campbell D, Saeki F, Cang H. et al. Gold Nanocages: Engineering Their Structure for Biomedical Applications. Advanced Materials. 2005;17(18):2255-61
49. Xia X, Yang M, Zheng Y, Li Q, Chen J, Xia Y. Quantifying the Coverage Density of Poly(ethylene glycol) Chains on the Surface of Gold Nanostructures. ACS Nano. 2012;6:512-22
50. Lovell JF, Jin CS, Huynh E, Jin H, Kim C, Rubinstein JL. et al. Porphysome nanovesicles generated by porphyrin bilayers for use as multimodal biophotonic contrast agents. Nat Mater. 2011;10:324-32
51. de Paula JC, Robblee JH, Pasternack RF. Aggregation of chlorophyll a probed by resonance light scattering spectroscopy. Biophys J. 1995;68:335-41
52. Hartwich G, Fiedor L, Simonin I, Cmiel E, Schäfer W, Noy D. et al. Metal-Substituted Bacteriochlorophylls. 1. Preparation and Influence of Metal and Coordination on Spectra. J Am Chem Soc. 1998;120:3675-83
53. Postlethwaite TA, Hutchison JE, Hathcock KW, Murray RW. Optical, Electrochemical, and Electrocatalytic Properties of Self-Assembled Thiol-Derivatized Porphyrins on Transparent Gold Films. Langmuir. 1995;11(10):4109-16
54. Gollmer A, Arnbjerg J, Blaikie FH, Pedersen BW, Breitenbach T, Daasbjerg K. et al. Singlet Oxygen Sensor Green: Photochemical Behavior in Solution and in a Mammalian Cell. Photochem Photobiol. 2011;87:671-9
55. Ostrowski JC, Mikhailovsky A, Bussian DA, Summers MA, Buratto SK, Bazan GC. Enhancement of Phosphorescence by Surface-Plasmon Resonances in Colloidal Metal Nanoparticles: The Role of Aggregates. Adv Funct Mater. 2006;16:1221-7
56. Previte MJR, Aslan K, Zhang Y, Geddes CD. Metal-Enhanced Surface Plasmon-Coupled Phosphorescence. J Phys Chem C. 2007;111:6051-9
57. Fang J, Nakamura H, Maeda H. The EPR effect: Unique features of tumor blood vessels for drug delivery, factors involved, and limitations and augmentation of the effect. Adv Drug Delivery Rev. 2011;63:136-51
58. Chen J, Glaus C, Laforest R, Zhang Q, Yang M, Gidding M. et al. Gold Nanocages as Photothermal Transducers for Cancer Treatment. Small. 2010;6:811-7
59. Goel R, Shah N, Visaria R, Paciotti GF, Bischof JC. Biodistribution of TNF-α-coated gold nanoparticles in an in vivo model system. Nanomedicine. 2009;4(4):401-10
60. Gad SC, Sharp KL, Montgomery C, Payne JD, Goodrich GP. Evaluation of the Toxicity of Intravenous Delivery of Auroshell Particles (Gold-Silica Nanoshells). Int J Toxicol. 2012;31:584-94
61. Alkilany A, Murphy C. Toxicity and cellular uptake of gold nanoparticles: what we have learned so far? J Nanoparticle Res. 2010;12:2313-33
62. Zhang XD, Wu D, Shen X, Liu PX, Yang N, Zhao B. et al. Size-Dependent In Vivo Toxicity of PEG-Coated Gold Nanoparticles. Inter J Nanomed. 2011;6:2071-81
63. Walkey CD, Olsen JB, Guo H, Emili A, Chan WCW. Nanoparticle Size and Surface Chemistry Determine Serum Protein Adsorption and Macrophage Uptake. J Am Chem Soc. 2011;134:2139-47
Author contact
![]() Corresponding author: Ravindra Pandey: Pavindra.Pandeyorg (photodynamic therapy), Jingyi Chen: chenjedu (drug delivery), and Chulhong Kim: chulhongedu (photoacoustic tomography).
Corresponding author: Ravindra Pandey: Pavindra.Pandeyorg (photodynamic therapy), Jingyi Chen: chenjedu (drug delivery), and Chulhong Kim: chulhongedu (photoacoustic tomography).
Citation styles
APA
Srivatsan, A., Jenkins, S.V., Jeon, M., Wu, Z., Kim, C., Chen, J., Pandey, R.K. (2014). Gold Nanocage-Photosensitizer Conjugates for Dual-Modal Image-Guided Enhanced Photodynamic Therapy. Theranostics, 4(2), 163-174. https://doi.org/10.7150/thno.7064.
ACS
Srivatsan, A.; Jenkins, S.V.; Jeon, M.; Wu, Z.; Kim, C.; Chen, J.; Pandey, R.K. Gold Nanocage-Photosensitizer Conjugates for Dual-Modal Image-Guided Enhanced Photodynamic Therapy. Theranostics 2014, 4 (2), 163-174. DOI: 10.7150/thno.7064.
NLM
Srivatsan A, Jenkins SV, Jeon M, Wu Z, Kim C, Chen J, Pandey RK. Gold Nanocage-Photosensitizer Conjugates for Dual-Modal Image-Guided Enhanced Photodynamic Therapy. Theranostics 2014; 4(2):163-174. doi:10.7150/thno.7064. https://www.thno.org/v04p0163.htm
CSE
Srivatsan A, Jenkins SV, Jeon M, Wu Z, Kim C, Chen J, Pandey RK. 2014. Gold Nanocage-Photosensitizer Conjugates for Dual-Modal Image-Guided Enhanced Photodynamic Therapy. Theranostics. 4(2):163-174.
This is an open access article distributed under the terms of the Creative Commons Attribution (CC BY-NC) License. See http://ivyspring.com/terms for full terms and conditions.