Impact Factor
- Issue 13; 2026
- Issue 12; 2026
- Issue 11; 2026
- Issue 10; 2026
- Issue 9; 2026
- Volume 16; 2026
- Advance Articles
- Past Issues
- Cover Images
- Cover Suggestion
- Index & Coverage
- Special Issues
Introduction
Materials and methods
Results and Discussion
Conclusion
Supplementary Material
Acknowledgements
References
International Journal of Biological Sciences
International Journal of Medical Sciences
 Global reach, higher impact

Theranostics 2015; 5(2):188-195. doi:10.7150/thno.10302 This issue Cite
Research Paper
In situ High Throughput Scattering Light Analysis of Single Plasmonic Nanoparticles in Living Cells
Zhen Gu1, 2, Chao Jing2, Yi-Lun Ying2, Pingang He1 ![]() , Yi-Tao Long2
, Yi-Tao Long2 ![]()
1. Department of Chemistry, East China Normal University, 500 Dongchuan Road, Shanghai, 200241, P. R. CHINA,
2. Key Laboratory for Advanced Materials & Department of Chemistry, East China University of Science and Technology, 130 Meilong Road, Shanghai, 200237, P. R. CHINA.
Received 2014-8-9; Accepted 2014-9-15; Published 2015-1-1
Abstract

Plasmonic nanoparticles have been widely applied in cell imaging, disease diagnosis, and photothermal therapy owing to their unique scattering and absorption spectra based on localized surface plasmon resonance (LSPR) property. Recently, it is still a big challenge to study the detailed scattering properties of single plasmonic nanoparticles in living cells and tissues, which have dynamic and complicated environment. The conventional approach for measuring the scattering light is based on a spectrograph coupled to dark-field microscopy (DFM), which is time-consuming and limited by the small sample capacity. Alternatively, RGB-based method is promising in high-throughput analysis of single plasmonic nanoparticles in dark-field images, but the limitation in recognition of nanoparticles hinders its application for intracellular analysis. In this paper, we developed an automatic and robust method for recognizing the plasmonic nanoparticles in dark-field image for RGB-based analysis. The method involves a bias-modified fuzzy C-means algorithm, through which biased illumination in the image could be eliminated. Thus, nearly all of the gold nanoparticles in the recorded image were recognized both on glass slide and in living cells. As confirmed, the distribution of peak wavelength obtained by our method is well agreed to the result measured by conventional method. Furthermore, we demonstrated that our method is profound in cell imaging studies, where its advantages in fast and high-throughput analysis of the plasmonic nanoparticles could be applied to confirm the presence and location of important biological molecules and provide efficiency information for cancer drug selection.
Keywords: Cell imaging, Bias-modified fuzzy C-means algorithm, localized surface plasmon resonance, plasmonic nanoparticle.
Introduction
Plasmonic nanoparticles (Au, Ag, Cu), owing to their unique optical and physical properties, have become promising materials in the field of biology, chemistry and photonics [1-3]. The localized surface plasmon resonance (LSPR) induced by interactions between surface electrons on nanoparticles and incident light could significantly amplify their scattering and absorption of light [4]. Since LSPR band is impacted by size, shape, composition, surrounding medium, and electron density of the nanoparticle, it provides wide approaches for construction of functional sensors [5-7]. Moreover, due to the excellent biocompatibility [8], photostability [9] and facile modification [10, 11] of gold nanoparticles (GNPs), they have been applied in cell imaging [12-15], drug delivery [7, 16] disease diagnosis [17-19], etc. For example, a highly sensitive ATP sensor has been developed based on the scattering spectra shift of a single GNP [20]. By conjugating with antibodies, spectra shift of GNP could be used to distinguish between cancerous and noncancerous cells [21]. The highly enhanced absorption of incident light also allows plasmonic nanoparticle serving as efficient agent for photothermal therapy [22-24].
Recently, advances in optical techniques such as dark-field microscopy (DFM) and differential interference contrast (DIC) microscopy makes it possible to acquire plasmon resonance scattering light of individual nanoparticles [25, 26]. In particular, dark-field microscopy coupled with spectrograph has high signal-noise ratio which has been widely applied in the studies of LSPR-based detections at single-nanoparticle level. The concentration of NADH in the cells could be obtained according to the scattering spectra shift of the intracellular plasmonic nanoparticles [27]. However, the DFM approach has several limitations for intracellular analysis. First, the spectrograph could only measure a few nanoparticles at a time. Since a large number of nanoparticles are incubated in the cell, the result of arbitrarily selected nanoparticles may be unreliable for an experiment [28]. Second, it is a time-consuming process in acquiring the spectra of numerous nanoparticles, which is insufficient to study fast chemical reactions in pure samples, much less rapid biological process [29]. Third, the conventional single-nanoparticle spectrograph has the difficulties in focusing on floating nanoparticles and endures the intense scattering interference of organisms in cells [27, 30]. Previous studies in our group have introduced a RGB-based method for monitoring plasmonic nanoparticles in the dark-field images [28, 31], which holds potential for high throughput analysis. Development of digital cameras enables acquiring images at high speed (more than 100 f/s). In RGB-based method, scattering spots of individual nanoparticles in the cells are segmented from the dark-field image by naked eye, the RGB value of pixels in the spots is subsequently applied to evaluate peak wavelength of scattering light and estimate the size of gold nanoparticles. Nonetheless, it is still a challenge to recognize the scattering spots of nanoparticles in living cells, which have dynamic and complicated environment. Though the scattering spots are able to be recognized by naked eyes, we found it would cause individual bias, particularly for intracellular analysis with significant scattering interference. Moreover, it is still inefficient and impossible to recognize every individual scattering spots and their alternation by naked eye. Consequently, the above limitations has hindered the DFM to achieve detailed and reliable scattering information of intracellular plasmonic nanoparticles. Another method has been developed based on dual wavelength difference imaging for analysis of intracellular GNPs, which requires a special light source with two laser beams [30].
Here, we present an automatic, robust and high-throughput method for studying the resonance scattering light of single plasmonic nanoparticles in dark-field image for intracellular analysis. A bias-modified fuzzy C-means (BM-FCM) algorithm is introduced to eliminate disturbance of scattering light in the image, which is a useful method in the field of pattern recognition for image segmentation [32, 33]. The recognized pixels in the image is subsequently clustered by a region growth method. Therefore, peak wavelength of every individual nanoparticle could be calculated through the RGB-based method. To testify the accuracy of our method in recognizing the nanoparticles, gold nanoparticles (GNPs) on glass slide and in living cells were used as model samples. Almost all the scattering spots of the plasmonic nanoparticles in the recorded image could be recognized and clustered through our method. We confirm that the distribution of calculated peak wavelengths of GNPs is consistent with the result measured by conventional spectrograph. And the result of cell experiment agrees with the previous study. Furthermore, we demonstrate that our method allows to obtain detailed and reliable information for monitoring the distribution of NADH in cancer cells, and estimating efficiency of cancer drug.
Materials and methods
Materials
All reagents were of analytical grade. Taxol (AR), 3-mercaptopropyl trimethoxysilane (95% v/v) and the reagents for cell culture were purchased from Sigma-Aldrich Co. Ltd. (USA). Absolute ethanol (AR), acetone (AR), and copper chloride (AR) were purchased from J&K Scientific Ltd. (China).Ultrapure water with a resistivity of 18.2 MΩ·cm was produced using a Milli-Q apparatus (Millipore, USA) and used in the preparation of all the solutions. The indium tin oxide (ITO) slides were purchased from Geao Co. Ltd. (China). Gold nanoparticles used in the experiments were prepared as described previously [27]. Scanning Electron Microscopy (JSM-6360LV, JEOL, Japan) and a Ocean optical USB 2000+ UV-vis spectrometer were used to characterize the GNPs.
Preparation of the Samples
For bulk solution experiment, gold nanoparticles were immobilized on the glass slide. The surfaces of ITO slides were cleaned by ultrasonic bath in both ethanol and water for more than 1h, respectively. To modify the clean ITO slides (20 mm×10 mm ×1.1 mm) with thiol, the slides were soaked in a solution of 1% v/v 3-mercaptopropyl trimethoxysilane in ethanol for 12 h and then rinsed with ethanol several times and dried under a stream of nitrogen. GNPs were modified on the slide by Au-S chemical adsorption after placing the slides in diluted gold colloid solution (10 times) for 15 min. The GNP-functionalized ITO slides were rinsed with water and dried under a stream of nitrogen prior to the dark-field observation.
For intracellular experiment, HeLa cells were selected as model sample. The cells were cultured in Dulbecco's modified Eagle's medium (DMEM), supplemented plus 10% heat-inactivated fetal bovine serum (FBS) and antibiotics (100 mg/mL streptomycin and 100 U/mL penicillin) at 37ºC in the humidified atmosphere under 5% CO2. The Cells were seeded in 6 cm dishes at a density of 6×10⁵ cells/dish and grew for 12 h. Then cells were incubated with fresh media containing 0.15 nM GNPs (v/v, 8:1) for 24 h. As control experiments, 10 µM of taxol solution was added to the culture medium, followed by incubation at 37ºC for 5 h. Then cells were rinsed by Tris-buffered saline (TBS, 10 mM, pH = 7.3, 0.15 M NaCl). After recording the original spectra of GNPs in cell, 20 µM CuCl2solution were added to the media to form the Au@Cu core-shell structure.
Measurement with Dark-Field Microscopy and Scattering Spectroscopy
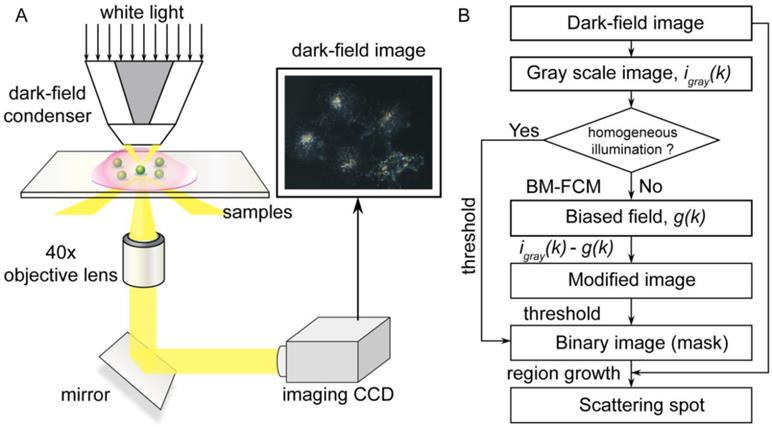
As shown in Figure 1A, the dark-field measurements were carried out on an inverted microscope (eclipse Ti-U, Nikon, Japan) that was equipped with a dark-field condenser (0.8 < NA < 0.95) and a 40× objective lens (NA = 0.8). The GNP-functionalized slides were immobilized on a platform, and the white light source (a 100 W halogen lamp) was used to excite the GNPs and generate plasmon resonance scattering light. A true-color digital camera (Nikon DS-fi, Japan) was used to capture the dark-field images. The scattering light of gold nanoparticle was split by a monochromator (ActonSP2300i, PI, USA) that was equipped with a grating (grating density: 300 lines/mm; blazed wavelength: 500nm) and recorded by a spectrometer CCD (pixis 400, PI, USA) to obtain the scattering spectra.
(A) Setup of the dark-field microscope. The light that scatters from GNPs is captured by the imaging CCD. (B) Flow diagram of the data process.
Results and Discussion
Process of Dark Field Image Analysis
The flow diagram of data process is depicted in Figure 1B. Firstly, the recorded dark-field image is converted to gray scale image. If the image has homogeneous illumination, the gray scale image could be directly converted to binary image through a threshold. Otherwise, for images with biased illumination field such as scattering interference of cells and their contents, it is hard to find an appropriate threshold to segment the scattering spots of nanoparticles. Therefore, a bias-modified fuzzy C-means (BM-FCM) algorithm is used to evaluate the influence of biased illumination at each pixel. The model of dark-field image based on the premise that the influence of biased field at each pixel is represented as a gain factor to the intensity with homogeneous illumination, as Equation 1,
(1)
(2)
where  ,
,  ,
,  are the intensity of gray scale image, the intensity with homogeneous illumination and the gain factor representing the biased field at position (p, q) in the image which has a size of m×n. To fit the form of BM-FCM, 2D description of the image was rearranged to a 1D column vector, and taking logarithmic transformation into Equation 2. Then the object function of BM-FCM was given by Equation 3,
(3)
where parameter c is the number of classifications; m≥1 is a custom weighting exponent; control parameter α is set according to the signal-noise rate. In the following applications, we use the configuration of c=3, m=2, α=0.2. u(j,k) describes the fuzziness of a pixel to the clustering center v1(j) and v2(j); the operation  is the Euclidean norm.
  is the averaged intensity of the k-th pixel's neighborhood. The third term in Equation 3 is a restriction formula, in which λ is a Lagrange multiplier. The process for evaluating the parameters follows an iterative method as reported previously [32]. The estimated g(k) was subsequently subtracted from the gray scale image to achieve a modified image with homogeneous illumination. Then the modified image is converted into binary image through a threshold. The binary image informs whether a pixel in the image is recognized for a scattering spot. It could be applied as a mask for the dark-field image. To clustering the recognized pixels, a region growth algorithm is used to scan throughout the masked image [35]. Finally, wavelength peak of each scattering spot is calculated through the RGB-based method as described previously [31]. For spots whose peak wavelength is lower than 500 nm were filtered as they may contribute to the dirt on the slide or organ in the cells. The whole process is realized in a Matlab program.
Analysis of GNPs on Clean Glass Slide
In this section, we testified presented method by analyzing the scattering of GNPs on clean glass slide, whose spectra could be accurately acquired by spectrograph. Figure 2A shows the dark-field image of GNPs (approximately 52 nm in diameter, Supplementary Material: Figure S1) immersed in water. The dark-field image was firstly converted to a gray scale image. Due to the homogeneous illumination of the dark-field image, the scattering spots of GNPs were able to be discriminated on the basis of the intensity of pixels in the image. Thus, the gray scale image was directly converted to a binary image through a threshold. In the binary image, pixels in the scattering spots of plasmonic nanoparticles have been segmented from the background. Those recognized pixels were clustered into groups through the region growth algorithm, as shown in Figure 2B. Therefore, the scattering spots of nanoparticles could be analyzed individually in the further step. Since the threshold highly impacts the result of recognition, it should be carefully set. Here, an automatic threshold detection process as the Otsu method was used to obtain an optimal threshold [34]. We confirmed that nearly all of the GNPs in the image were accurately recognized by our method (Supplementary Material: Figure S2).
(A) DFM image of GNPs immersed in water on glass slide. (B) Detailed view of the DFM image and the localized scattering spots are marked by red rectangle. (C) Histogram of localized GNPs' peak wavelength in the DFM image fitted to a Gaussian function. (D) Scattering spectra of 15 different single GNPs measured by spectrograph in the DFM image.
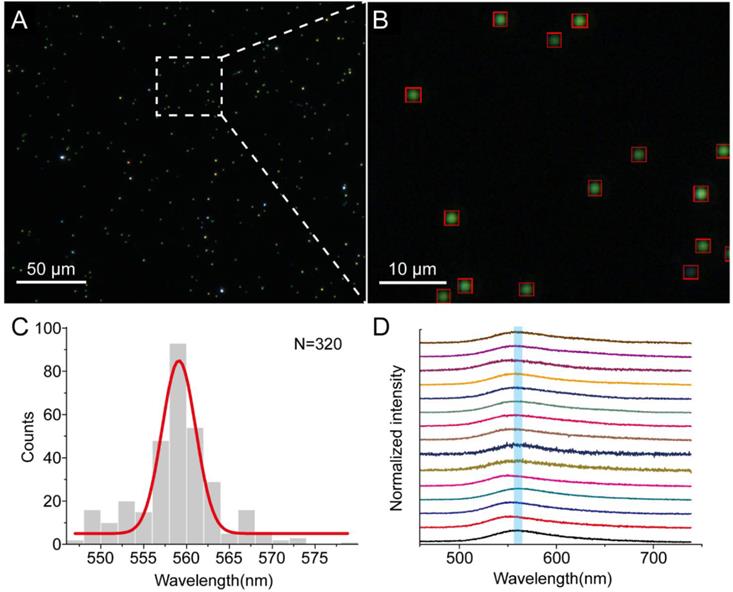
After the recognition, peak wavelength of all the localized GNPs were automatically calculated through the RGB-based method. The distribution histogram of the calculated result was perfectly fitted to a Gaussian function (Figure 2C) centered at 558 nm. To examine the accuracy of our method, we acquired scattering spectra of 15 GNPs in the image by the spectrometer CCD as shown in Figure 2D. The mean value of the peak wavelengths of the spectra is 559 nm which is comparable to the calculated result. This result suggests that our method is appropriate to recognize the scattering spots of GNPs. Furthermore, the distribution of peak wavelength could inform the purity of the nanoparticles, and give a comprehensive description of the sample at single particle level. Whereas, the spectrometer-based method is easily influenced by the selection of nanoparticle. It is also notable that our method is very fast to obtain these scattering spots and evaluate their peak wavelengths. A rough comparison of presented method with conventional method on analysis speed has been given in the Supplementary Material.
Analysis of GNPs in Living Cells
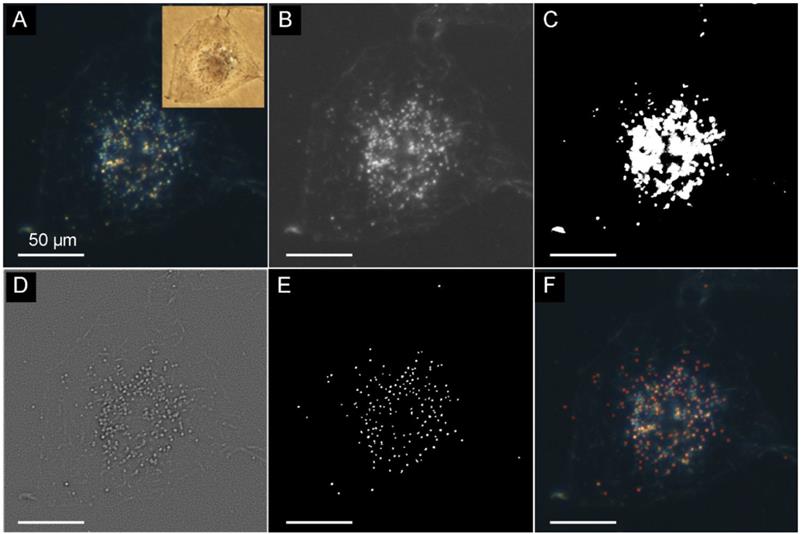
The difficulty for localizing the scattering spot originates from the scattering interference of cells and their containers, which would produce a biased illumination field in dark-field image of GNPs. Therefore, it is insufficient to segment the scattering spots of gold nanoparticles according to the intensity of gray scale image. Here, we used a dark-field image of intracellular GNPs as an example (Figure 3A). The scattering light from cells overlapped with the scattering spots of GNPs obviously. By directly applying a threshold to the gray scale image (Figure 3B), the binary image was obtained as shown in Figure 3C. In the binary image, white pixels reflects to the recognized region, in which part of the pixels belongs to the scattering of cells and have been merged with the pixels of scattering spots. As a result, most of the scattering spots have not been well segmented. This unsatisfied result is mainly due to the high intensity of biased field caused by the cell scattering. To solve this problem, it is necessary to estimate the biased field in the image, which could be realized by the bias-modified fuzzy C-means (BM-FCM) algorithm in our method. Consequently, a modified image was obtained as shown in Figure 3D by subtracting the biased field from the gray scale image. It is clear that scattering of cells has been removed in the modified image. Figure 4D shows the binary image converted from the modified image through a threshold. Since the recognized pixels have not been merged with the pixels of cell scattering, the region growth method could cluster them into groups of individual scattering spots. By applying this method, a total number of 264 nanoparticles were recognized and marked in red rectangle as depicted in Figure 3F. Because of the benefit of the BM-FCM, the scattering spots have been well segmented. To evaluate whether the presented method can be used for real-time detection in cells, we have studied the time dependent behavior of the nanoparticles in cells. The results supported that our method could be used in the complex environment (see the Supplementary Material: Figure S3).
(A) Dark-field image of HeLa cell incubated with GNPs and the corresponding bright-field image (insertion). (B) Gray scale image converted from the original image. (C) Binary image converted from the gray scale image through a threshold. (D) Modified image by substrate the biased illumination from the gray scale image. (E) Binary image converted from the modified image through a threshold. (F) Result of recognition, scattering spots of GNPs are framed by red rectangle. Scale bars in (B)-(F) is 50 μm. The thresholds are calculated by the Otsu method, respectively.
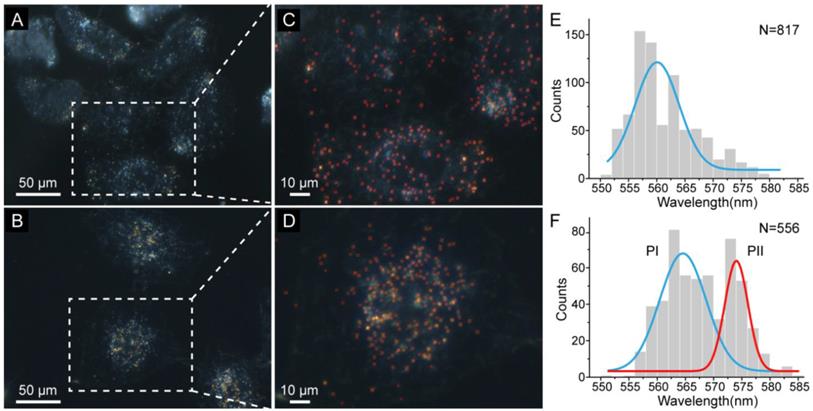
(A) DFM images of GNPs in HeLa cells which have been treated with taxol (10 μM) and then incubated in a TBS solution that contains 20 μM CuCl2 for 3 h. (B) DFM images of GNPs in HeLa cells that have not undergone treatment with taxol. (C and D) Detailed views of the DFM images in (A) and (B), respectively. Scattering spots of GNPs were localized by the presented method and marked by red rectangles. (E) Distribution of the GNPs' peak wavelength in (A) fitted by a Gaussian function showing a peak at 559 nm. (F) Distribution of the GNPs' peak wavelength in (B) fitted to two Gaussian peaks labeled as PI and PII.
Application in Cancer Drug Screening
In a previous study, we demonstrated an application of GNPs as nanoprobes for investigating the efficiency of cancer drug, based on the scattering properties of gold and copper nanoparticles which are able to detect NADH in living Hela cells using DFM [27]. GNPs with diameter of approximately 50 nm were incubated in living cells for 24 h. After treatment with copper ions for 3 h, NADH in the cells reduced copper ions to copper atoms, which would adsorb onto the surface of gold nanoparticles to form the Au@Cu core-shell structure. This formation of core-shell structure led to an obvious red shift in the scattering wavelength of the nanoparticles. On the contrary, with the addition of cancer drug taxol which could confine the generation of NADH, the reduction process of copper ions was prevented. As a result, the structure of most GNPs in the cells was unchanged, which indicates that the cancer drug was effective. In the analysis part, only several nanoparticles were measured to evaluate the shifts in scattering spectra through the spectrometer CCD. If we could recognize and monitor the GNPs in the cells, the result of drug efficiency would be more reliable, and the mapping of the cancer drugs that targets NADH in the cell is able to be achieved.
Dark-field images of HeLa cells with and without treatment of the taxol are depicted in Figure 4A and Figure 4B, respectively. It is difficult to identify the difference between the nanoparticles in the two images by naked eyes. Our method was applied to automatically recognize the scattering spots of GNPs in these cells, and calculate their peak wavelengths through the RGB-based method. As a result, the biased field was eliminated and most of the GNPs were recognized (Figure 4C and Figure 4D). The total number of recognized GNPs in dark-field images of HeLa cells with and without treatment of the taxol were 817 and 556, respectively (Supplementary Material: Figure S4 and Figure S5). Determined peak wavelengths of GNPs in Figure 4A were distributed following a Gaussian function centered at 559 nm (Figure 4E), which illustrated that most of the GNPs did not show obvious red shift of the peak wavelength. Without treatment of taxol, the peak wavelengths of GNPs in Figure 4B fall into two populations labeled as PI at 564 nm and PII at 574 nm (Figure 4F). For the population PI, a limited red shift of the peak wavelength (less than 5 nm) was observed. While the population PII has a significant red shift (more than 10 nm), which indicates that the generation of NADH was not suppressed near the GNPs.
We attribute the histogram peak in Figure 4E to the GNPs surrounded by low concentration of NADH in the cells. The inhibited generation of NADH implies that the cancer drug has effected around the GNPs, which is consistent with the previous results. The histogram obtained by our method also informs that about 13% of the GNPs in a cell underwent red shift more than 10 nm. This result could not be concluded by the conventional spectrograph-based approach, because of the small sample capacity. The GNPs with significant red shift have probably turned into Au@Cu core-shell structure due to the high concentration of NADH, which indicates few cancer drugs existed nearby. This new observation of intracellular cancer drug achieved by our method is supported by the nature of heterogeneous distribution of cancer drug in cells. Hence, our high throughput method is promising to map the distributions of drugs and drug targets in cells. Moreover, compared with the conventional spectrograph-based approach, the results obtained by our method is more reliable and comprehensive.
Conclusion
In summary, we developed an automatic method for analyzing plasmonic nanoparticles for intracellular studies based on the DFM image. To our best knowledge, it is for the first time to apply a bias-modified fuzzy C-means to eliminate the scattering interference in dark-field images. The peak wavelengths of plasmonic nanoparticles obtained by our method agreed well with the results measured by conventional spectrograph. Due to its advantage of high throughput and fast analysis speed, the method could provide distributions information of peak wavelengths, which could be extremely useful in analysis of complicated samples that consists of nanoparticles with different peak wavelengths. The drug screening experiments showed that our method could be utilized to analyze the efficiency of cancer drug and confirm the presence and location of NADH in the living cells. Furthermore, our method does not require any improvements of the device, which ensures its popularity in any DFM instruments. We believe that this novel method could promote the applications of plasmonic nanoparticles in studying fast chemical reactions and biological processes in living cells.
Supplementary Material
Figures S1 - S5.
Acknowledgements
The authors acknowledge funding of 973 Program (2013CB733700) and the National Natural Science Foundation of China (21327807). Y.-T. Long is grateful for funds from the National Science Fund for Distinguished Young Scholars of China (21125522).
Competing Interests
The authors declare no competing financial interest.
References
1. Li Y, Jing C, Zhang L. et al. Resonance scattering particles as biological nanosensors in vitro and in vivo. Chem Soc Rev. 2012;41:632-642
2. Anker JN, Hall WP, Lyandres O. et al. Biosensing with plasmonic nanosensors. Nat Mater. 2008;7:442-453
3. Jing C, Rawson FJ, Zhou H. et al. New Insights into Electrocatalysis Based on Plasmon Resonance for the Real-time Monitoring of Catalytic Events on Single Gold Nanorods. Anal Chem. 2014;86:5513-5518
4. Catchpole K, Polman A. Plasmonic solar cells. Opt Express. 2008;16:21793-21800
5. Mayer KM, Hafner JH. Localized surface plasmon resonance sensors. Chem Rev. 2011;111:3828-3857
6. Ling J, Huang CZ. Energy transfer with gold nanoparticles for analytical applications in the fields of biochemical and pharmaceutical sciences. Anal Methods. 2010;2:1439-1447
7. Ghosh P, Han G, De M. et al. Gold nanoparticles in delivery applications. Adv Drug Deliv Rev. 2008;60:1307-1315
8. Eustis S, El-Sayed MA. Why gold nanoparticles are more precious than pretty gold: noble metal surface plasmon resonance and its enhancement of the radiative and nonradiative properties of nanocrystals of different shapes. Chem Soc Rev. 2006;35:209-217
9. Homola J. Surface plasmon resonance sensors for detection of chemical and biological species. Chem Rev. 2008;108:462-493
10. Khlebtsov NG, Dykman LA. Optical properties and biomedical applications of plasmonic nanoparticles. J Quant Spectrosc Radiat Transf. 2010;111:1-35
11. Halas N. Playing with plasmons: tuning the optical resonant properties of metallic nanoshells. MRS Bull. 2005;30:362-367
12. Long Y-T, Jing C. In Localized Surface Plasmon Resonance Based Nanobiosensors. Springer. 2014
13. Wang Z. Plasmon—resonant gold nanoparticles for cancer optical imaging. Sci China-Phys Mech Astron. 2013;56:506-513
14. Huang X, El-Sayed IH, Qian W. et al. Cancer cell imaging and photothermal therapy in the near-infrared region by using gold nanorods. J Am Chem Soc. 2006;128:2115-2120
15. Khlebtsov N, Bogatyrev V, Dykman L. et al. Analytical and theranostic applications of gold nanoparticles and multifunctional nanocomposites. Theranostics. 2013;3:167-180
16. Han G, Ghosh P, Rotello VM. Functionalized gold nanoparticles for drug delivery. Nanomedicine (Lond). 2007;2:113-123
17. Giljohann DA, Seferos DS, Daniel W L. et al. Gold nanoparticles for biology and medicine. Angew Chem Int Ed Engl. 2010;49:3280-3294
18. Willets KA, Van Duyne RP. Localized surface plasmon resonance spectroscopy and sensing. Annu Rev Phys Chem. 2007;58:267-297
19. Yu MK, Park J, Jon S. Targeting strategies for multifunctional nanoparticles in cancer imaging and therapy. Theranostics. 2012;2:3-44
20. Liu Q, Jing C, Zheng X. et al. Nanoplasmonic detection of adenosine triphosphate by aptamer regulated self-catalytic growth of single gold nanoparticles. Chem Commun (Camb). 2012;48:9574-9576
21. El-Sayed I H, Huang X, El-Sayed M A Surface plasmon resonance scattering, absorption of anti-EGFR antibody conjugated gold nanoparticles in cancer diagnostics. applications in oral cancer. Nano Lett. 2005;5:829-834
22. Huang P, Rong P, Lin J. et al. Triphase Interface Synthesis of Plasmonic Gold Bellflowers as Near-infrared Light Mediated Acoustic/Thermal Theranostics. J Am Chem Soc. 2014;136:8307-8313
23. Huang P, Lin J, Li W. et al. Biodegradable gold nanovesicles with an ultrastrong plasmonic coupling effect for photoacoustic imaging and photothermal therapy. Angew Chem Int Ed Engl. 2013;52:13958-13964
24. Deng H, Zhong Y, Du M. et al. Theranostic Self-Assembly Structure of Gold Nanoparticles for NIR Photothermal Therapy and X-Ray Computed Tomography Imaging. Theranostics. 2014;4:904-918
25. Sönnichsen C, Geier S, Hecker N. et al. Spectroscopy of single metallic nanoparticles using total internal reflection microscopy. Appl Phys Lett. 2000;77:2949-2951
26. Schultz S, Smith D R, Mock J J. et al. Single-target molecule detection with nonbleaching multicolor optical immunolabels. Proc Natl Acad Sci U S A. 2000;97:996-1001
27. Zhang L, Li Y, Li D W. et al. Single Gold Nanoparticles as Real-Time Optical Probes for the Detection of NADH-Dependent Intracellular Metabolic Enzymatic Pathways. Angew Chem Int Ed Engl. 2011;50:6789-6792
28. Shi L, Jing C, Ma W. et al. Plasmon Resonance Scattering Spectroscopy at the Single-Nanoparticle Level: Real-Time Monitoring of a Click Reaction. Angew Chem Int Ed Engl. 2013;52:6011-6014
29. Zheng X, Liu Q, Jing C. et al. Catalytic gold nanoparticles for nanoplasmonic detection of DNA hybridization. Angew Chem Int Ed Engl. 2011;50:11994-11998
30. Xiao L, Wei L, Cheng X. et al. Noise-free dual-wavelength difference imaging of plasmonic resonant nanoparticles in living cells. Anal Chem. 2011;83:7340-7347
31. Jing C, Gu Z, Ying Y-L. et al. Chrominance to dimension: A real-time method for measuring the size of single gold nanoparticles. Anal Chem. 2012;84:4284-4291
32. Ma L, Staunton RC. A modified fuzzy C-means image segmentation algorithm for use with uneven illumination patterns. Pattern Recognit. 2007;40:3005-3011
33. Ahmed MN, Yamany SM, Mohamed N. et al. A modified fuzzy c-means algorithm for bias field estimation and segmentation of MRI data. IEEE Trans Med Imaging. 2002;21:193-199
34. Otsu N. A threshold selection method from gray-level histograms. Automatica (Oxf). 1975;11:23-27
35. Yang H, Ahuja N. Automatic segmentation of granular objects in images: Combining local density clustering and gradient-barrier watershed. Pattern Recognit. 2014;47:2266-2279
Author contact
![]() Corresponding authors: E-mail address: ytlongedu.cn, pgheecnu.edu.cn.
Corresponding authors: E-mail address: ytlongedu.cn, pgheecnu.edu.cn.