Impact Factor
- Issue 14; 2026
- Issue 13; 2026
- Issue 12; 2026
- Issue 11; 2026
- Issue 10; 2026
- Volume 16; 2026
- Advance Articles
- Past Issues
- Cover Images
- Cover Suggestion
- Index & Coverage
- Special Issues
Introduction
Methods and Materials
Results
Discussion
Supplementary Material
Abbreviations
Acknowledgements
References
International Journal of Biological Sciences
International Journal of Medical Sciences
 Global reach, higher impact

Theranostics 2015; 5(10):1098-1114. doi:10.7150/thno.11679 This issue Cite
Research Paper
Direct Imaging of Cerebral Thromboemboli Using Computed Tomography and Fibrin-targeted Gold Nanoparticles
Jeong-Yeon Kim1*, Ju Hee Ryu2*, Dawid Schellingerhout3, In-Cheol Sun2, Su-Kyoung Lee1, Sangmin Jeon2, Jiwon Kim1, Ick Chan Kwon2, Matthias Nahrendorf4, Cheol-Hee Ahn5, Kwangmeyung Kim2 ![]() , Dong-Eog Kim1
, Dong-Eog Kim1 ![]()
1. Molecular Imaging and Neurovascular Research Laboratory, Dongguk University College of Medicine, Goyang, South Korea;
2. Biomedical Research Institute, Korea Institute of Science and Technology, Seoul, Republic of Korea;
3. Departments of Radiology and Experimental Diagnostic Imaging, University of Texas M. D. Anderson Cancer Center, Houston, TX;
4. Center for Systems Biology, Massachusetts General Hospital and Harvard Medical School, Boston, MA;
5. Research Institute of Advanced Materials, Department of Materials Science and Engineering, Seoul National University, Seoul, Republic of Korea.
*These authors contributed equally to this work.
Received 2015-1-24; Accepted 2015-6-2; Published 2015-7-2
Abstract

Computed tomography (CT) is the current standard for time-critical decision-making in stroke patients, informing decisions on thrombolytic therapy with tissue plasminogen activator (tPA), which has a narrow therapeutic index. We aimed to develop a CT-based method to directly visualize cerebrovascular thrombi and guide thrombolytic therapy. Glycol-chitosan-coated gold nanoparticles (GC-AuNPs) were synthesized and conjugated to fibrin-targeting peptides, forming fib-GC-AuNP. This targeted imaging agent and non-targeted control agent were characterized in vitro and in vivo in C57Bl/6 mice (n = 107) with FeCl3-induced carotid thrombosis and/or embolic ischemic stroke. Fibrin-binding capacity was superior with fib-GC-AuNPs compared to GC-AuNPs, with thrombi visualized as high density on microCT (mCT). mCT imaging using fib-GC-AuNP allowed the prompt detection and quantification of cerebral thrombi, and monitoring of tPA-mediated thrombolytic effect, which reflected histological stroke outcome. Furthermore, recurrent thrombosis could be diagnosed by mCT without further nanoparticle administration for up to 3 weeks. fib-GC-AuNP-based direct cerebral thrombus imaging greatly enhance the value and information obtainable by regular CT, has multiple uses in basic / translational vascular research, and will likely allow personalized thrombolytic therapy in clinic by a) optimizing tPA-dosing to match thrombus burden, b) enabling the rational triage of patients to more radical therapies such as endovascular clot-retrieval, and c) potentially serving as a theranostic platform for targeted delivery of concurrent thrombolysis.
Keywords: direct thrombus imaging, gold nanoparticles, computed tomography, cerebral infarction, molecular imaging
Introduction
Thromboemboli cause the majority of ischemic strokes, which is a leading cause of death and disability. Administering tissue plasminogen activator (tPA) to lyse the offending thrombus is the only FDA-approved therapy for acute ischemic stroke.[1]
There is a real need for an imaging tool to assess the presence and amount of cerebral thrombus in individual patients.[2, 3] With such information, tPA dosing could be individualized, and titrated to success. Without such information, tPA dosing unfortunately often is either insufficient or excessive, leading to either low rates of thrombolysis or high rates of hemorrhagic complications.[4] About 60% of stroke patients who receive intravenous tPA die or become dependent despite treatment,[5] suggesting that there is ample room for improvement in our current treatment regimens. An imaging agent that could provide critical information on the size, distribution, and nature of thrombi might allow us to advance to personalized thrombolytic therapy and produce better outcomes.[2]
We previously showed that direct thrombus imaging with a Cy5.5 near-infrared fluorescent (NIRF) probe could characterize the highly heterogeneous nature of a mouse embolic stroke model by enabling the visualization of cerebral thrombus burden and distribution.[3] This is an excellent research method. However, it has the following shortcomings: a) ex vivo on post mortem brains only, b) single time point only, c) no translation potential to humans. A clinically suitable imaging modality would be computed tomography (CT), because CT remains the most widely used imaging technique in the diagnosis of hyperacute stroke.[6] In an effort to start ischemic stroke treatment earlier, some 'specialized stroke ambulances' have even begun to carry portable CT scanners.[7]
Current CT-based thrombus imaging involves the use of iodinated intravenous contrast to opacify the blood pool and indirectly demonstrate thrombi as filling defects in the vessels.[8] This method has many shortcomings, the principal problem being the inability to serially track cerebral thromboemboli in vivo. There are also difficulties in distinguishing between thrombus and underlying atherosclerotic plaque, both of which could contribute to stenosis or occlusion.
Considering that: a) a fibrin-specific gadolinium-based magnetic resonance imaging agent[9] was successful in visualizing thrombus in vivo[10] and b) fibrin is a main component of thrombus,[11] we hypothesized that fibrin-targeted gold nanoparticles with a high X-ray absorption coefficient[12] would be superior to non-targeted ones in the CT-based imaging of thrombi. We further hypothesized that a fibrin-targeted gold nanoparticle agent would be able to not only demonstrate in situ carotid thrombosis[4] but also cerebral thromboembolism.
Here, we report, for the first time, the generation and characterization of a nanoprobe for CT-based direct cerebral thrombus imaging suitable for live real-time imaging. We show the utility of the new CT contrast agent by performing non-invasive in vivo microCT (mCT) imaging studies to 1) detect thrombotic disease, 2) quantify the thrombus burden, and 3) serially monitor the thrombolytic effect of tPA.
Methods and Materials
This study was approved by the institutional animal care and use committee, and all experiments were conducted in accordance with the institutional guideline on humane care and use of laboratory animals.
Gold(III) chloride trihydrate (HAuCl4·3H2O, 99%), glycol chitosan (GC, degree of deacetylation = 82.7%; molecular weight = 250 kDa), 1-Ethyl-3-(3-dimethylaminopropyl) carbodiimide hydrochloride, N-hydroxy succinimide (NHS; 98%), and fibrinogen from human plasma were purchased from Sigma-Aldrich (St. Lous, MO). Fibrin-targeting peptides (tyrosine-D-glutamine-cysteine-hydroxyproline-L-3-chlorotyrosine-glysine-leucine-cysteine-tyrosine-isoleucine-glutamine) and activated coagulation factor XIII (FXIIIa) substrate peptides (glycine-asparagine-alanine-glutamate-glutamine-valine-serine-proline-leucine-threonine-leucine-leucine-lysine-tryptophan) were purchased from Peptron (Daejeon, Korea). Human thrombin was purchased from Hematologic Technologies (Essex Junction, VT). Fibrin polymerization was performed in Tris-buffered saline (TBS, pH 7.4; Dako, Glostrup, Denmark) containing 10 mmol/L of tris(hydroxymethyl) aminomethane. Water used in the experiment was double-distilled, and all other chemicals were used as received without any purification.
For the first set of in vivo experiments, male C57Bl/6 mice (n = 110, 11-13 weeks) were purchased (Orient Bio, Seongnam, Korea) and maintained in a controlled environment of 23 ± 0.2oC and 54 ± 0.4% humidity, with 12 hours of light per 24 hour period. Nine mice were excluded because of violation of experimental protocols (n = 3), or poor data quality (n = 6). Thus, 101 animals were included in the final analysis.
In the second set of in vivo experiments, six C57Bl/6 mice were additionally used for the assessments of systemic and neurobehavioral toxicity.
Synthesis of fibrin-targeted GC-coated gold nanoparticles (fib-GC-AuNPs)
GC (300 mg) was dissolved in 300 mL of water (0.1 wt/wt %) and stirred for over 24 hours. The GC solution was filtered with 0.2 μm disposable syringe filter (DISMIC-25cs; Advantec, Tokyo, Japan) and boiled to 70oC before 100 mL of HAuCl4·3H2O solution (1 mM) was added quickly. The solution was kept at 70oC under stirring until the color of solution changed from light yellow to deep red in 8 hours. After another 16 hours, the heat source was removed and the GC-AuNP colloidal solution was cooled down to room temperature. Then, fibrin-targeting peptides used in the EP-2104R[11] (3.5 mg) were dissolved in 0.4 mL dimethyl sulfoxide (Sigma-Aldrich) with 1-ethyl-3-(3-dimethylaminopropyl) carbodi carbodiimide hydrochloride (Sigma-Aldrich, 0.5 mg) and n-hydroxy succinimide (0.5 mg; GE Healthcare, Piscataway, NJ), while being vigorously stirred for 30 minutes. After 15 minutes, the peptide solution was mixed with 15 mL of GC-AuNP colloid (3 mg Au per mL), and stirred for 4 hours. Then, fib-GC-AuNPs were centrifuged (9000 rpm, 45 minutes) and washed three times with water to remove remnants of the peptide.
Synthesis of the C15 NIRF thrombus marker
C15 NIRF imaging probes,[5] which fluorescently label clots through binding to the fibrin matrix by the crosslinking activity of the FXIIIa coagulation enzyme,[15] were synthesized as we previously reported.[5] To obtain Cy5.5-maleimide, Cy5.5-NHS (1 mg, excitation / emission = 675 nm / 695 nm; GE Healthcare) dissolved in phosphate buffered saline (PBS, 400 μL, pH 7.0; Sigma-Aldrich) mixed with N-[β-maleimidopropionic acid] hydrazide, trifluoroacetic acid salt (3 mg; Thermo Fisher Scientific, Waltham, MA), and EDC (2 mg; Sigma-Aldrich) dissolved in DMSO (100 μL) for 4 hours. The product was purified by C18 semi-preparative reversed-phase high-performance liquid chromatography (RP-HPLC): 40% to 70% acetonitrile vs. 0.1 M triethylammonium acetate over 20 minutes at a flow rate of 4.0 mL/minutes. Purity (> 95%) was confirmed by RP-HPLC. Cy5.5-maleimide fractions were collected and lyophilized. For site-specific conjugation of Cy5.5 to the thiol of the cysteine adjacent to the recognition sequence of FXIIIa substrate peptides, the peptides (2.5 μM) were reacted with Cy5.5-maleimide (2.5 μM) in PBS (100 μL, pH 7.0) for 4 hours. The product was further purified by C18 semi-preparative reversed-phase RP-HPLC: 40% to 70% acetonitrile vs. 0.1 M triethylammonium acetate over 20 minutes at a flow rate of 4.0 mL/minutes. Purity (> 95%) was confirmed by RP-HPLC and matrix-assisted laser desorption / ionization (MALDI) - time of flight mass spectrometry, and C15 NIRF imaging probe fractions were collected and lyophilized.
In vitro characterization of fib-GC-AuNPs
Transmission electron microscopy studies were performed by using JEM-3010 (JEM-1400; JEOL, Tokyo, Japan) to characterize the physicochemical properties of fib-GC-AuNPs. Samples were prepared on the carbon-coated 200-mesh copper grids by pipetting 10 μL of nanoparticle colloid onto them, followed by removing extra solution and drying in a vacuum oven for 24 hours. Ultraviolet visible (UV-Vis) absorption spectra were recorded by using UV-1650PC (Shimadzu, Kyoto, Japan), which scanned over the range of 300-700 nm. The zeta-potential and average particle size and distribution in water were measured by using photon correlation spectroscopy (Malvern Nano-ZS; Malvern, Worcestershire, UK) at 25°C. Polydispersity index (PDI) was calculated from the square of the standard deviation / mean diameter. In addition, the stability of fib-GC-AuNPs was assessed by measuring UV-Vis absorption spectra and size distribution of nanoparticles in PBS buffer at 0 and 48 hours.
To assess cytotoxicity of fib-GC-AuNPs (12.5, 25, 50, and 100 μg/mL), HeLa cells (2 × 10⁴ cells / well) were seeded on a 96-well plate and allowed to adhere in Dulbecco's modification of Eagle's medium containing 10% (v/v) fetal bovine serum and streptomycin (100 μg/mL) / penicillin G (100 U/mL) at 37ºC, 5% CO2. HeLa cells were exposed to the different concentrations of fib-GC-AuNPs, while being incubated for 24 hours. Cell Counting Kit-8 (Dojindo Laboratories, Kumamoto, Japan) was used to measure cell viability, which was expressed as a percentage of viable cells compared to the control cells.
X-ray attenuation properties of fib-GC-AuNPs at different concentrations (0.08, 0.16, 0.31, 0.63, 1.25, 2.5, 5, and 10 mg Au / mL) was studied using a clinical positron emission tomography / CT scanner (Gemini; Philips Medical Systems, Cleveland, OH; values in Hounsfield Unit) as well as an mCT scanner (NFR Polaris-G90; NanoFocusRay, Jeonju, Korea; values in arbitrary unit).
Then, experiments to test the binding of fib-GC-AuNPs (vs. GC-AuNPs) to fibrin clot were performed in TBS (pH 7.4) containing 50 mM Tris·HCl and 150 mM NaCl (pH 7.4). Fibrin clot was formed with fibrinogen (6 mg), FXIIIa (0.45 mg), CaCl2 (6.6 mg), and thrombin (0.5 U) in 1.5 mL of TBS. Then, the preformed clot was immersed in AuNP colloids (0.1 mg Au / mL), and the mixture was shaken for 2 hours to assess the interaction between fibrin and AuNPs. In another sample, fibrin clot was made in situ in the presence of AuNPs; fibrinogen, FXIIIa, CaCl2 were dissolved in AuNP colloids with TBS (0.1 mg Au / mL), and thrombin was added to the mixture, which was then shaken for 2 hours.
Experimental values were the average of 3 different formulations.
Mouse in situ thrombotic model
Mice were anaesthetized, and carotid thrombi were formed as previously reported[4] by applying strips of 1 × 1 mm2 filter paper (grade 42; Whatman, Oxon, UK) soaked in 10% FeCl3 to the exposed common carotid artery (CCA) for 5 minutes. FeCl3 triggers vascular injury that causes denudation of the endothelium and acute in situ thrombosis, which has been widely used for cardiovascular research.[16]
Mouse embolic stroke model
An embolic stroke model was generated to mimic human stroke, as previously reported,[3] by injecting preformed fluorescently-marked clots into the middle cerebral artery-anterior cerebral artery (MCA-ACA) bifurcation area of the distal internal carotid artery, using a catheter that was placed in the distal CCA after being inserted through the hole made on the external carotid artery (ECA) in the surgically opened neck. First, exogenously formed clot was labeled with Cy5.5 fluorescent marker, C15 probe that we had synthesized. Then, mice were anesthetized with 2% isoflurane using an inhalation mask, and cerebral blood flow was monitored (Supplementary Material: Figure S1) using a laser-Doppler flowmeter (Omegawave, Tokyo, Japan). A homeothermic blanket (Panlab, Barcelona, Spain) was used to keep body temperature at 36.5°C. The left CCA, ECA, and internal carotid artery (ICA) were exposed through a midline neck incision and dissection of the peri-vascular tissue. The ECA was ligated with coagulation of the origin of the superior thyroid artery. The CCA was clamped using a microvascular clip (S&T AG, Neuhausen, Switzerland), and then the ICA was clamped after separating it from the adjacent vagus nerve. An arteriotomy was made in the ECA proximal to the point at which it was tied. A tapered PE-45 catheter containing the clot (diameter, 0.15 mm; length, 15 mm) was inserted via the arteriotomy, then turned toward the ICA. Immediately after the microvascular clip clamping the ICA was removed, the catheter was advanced about 9 mm toward the MCA-ACA bifurcation area. After the thrombus was injected, the catheter was carefully removed, followed by the ligation of the ECA stump and declamping of the CCA.
In vivo characterization of fib-GC-AuNPs
For in vivo experiments, concentrations of nanoparticles are reported as 'mg Au / kg of animal'.
For in situ carotid thrombosis model experiments, thrombi were induced (n = 12 mice) as described above. Thirty minutes after thrombus formation, either GC-AuNPs (20 or 2 mg/kg, 200 μL) or fib-GC-AuNPs (20 or 2 mg/kg, 200 μL) were injected, and the animals (n = 3 per each group) were imaged by using mCT (see below).
For thromboembolic model experiments, embolic stroke was induced (n = 76 mice) as described above. One hour later, mCT images were acquired 5 minutes after intravenous (penile vein) administration of 300 μL AuNPs. In 56 of the 76 animals, GC-AuNPs (120 mg/kg for 23 mice and 12 mg/kg for 5 mice) or fib-GC-AuNPs (120 mg/kg for 23 mice and 12 mg/kg for 5 mice) were administered, and mCT images were compared. Thereafter, the brains were imaged ex vivo using a NIRF imager (see below) to use the area of thrombus-related fluorescent signal as a reference value to be compared with the area of hyperdense marked thrombus on mCT. In randomly selected 12 (six from the 120 mg/kg GC-AuNP group and six from the 120 mg/kg fib-GC-AuNP group) of the 56 mice, to further confirm that mCT signal correlated with cerebral thrombus, 10 μm thick cryosections containing thrombosed MCAs were carefully prepared for NIRF microscopic imaging (Olympus-BX61, Olympus Tokyo, Japan; excitation / emission, 675 nm / 690 nm; 1 second acquisition), followed by hematoxylin and eosin (H&E) staining and fibrin immunostaining. In addition, transmission electron microscopy imaging of 144 sections (60 nm thickness) from other six (three from the 120 mg/kg GC-AuNP group and three from the 120 mg/kg fib-GC-AuNP group) of the 56 animals was performed at various magnifications to confirm the presence of AuNPs in thrombi.
In 14 (of the 76) animals, a cross-over study was performed with the initial mCT imaging using GC-AuNPs followed by an additional mCT imaging using fib-GC-AuNPs (n = 7; 120 mg/kg and 300 μL for both probes), or in the reverse order (fib-GC-AuNPs and then GC AuNPs, n = 7).
The other 6 (of the 76) animals were injected with 120 mg/kg fib-GC-AuNPs and baseline mCT images were acquired at 1 hour after stroke. Then, these animals were treated with intravenous 1 mg/mL tPA (24 mg/kg, 600 μL; n = 3) or saline (600 μL; n = 3) bolus injection (10%), which was followed by continuous infusion (90%) for 30 minutes. Three and 24 hours after the end of saline or tPA infusion, follow-up mCT images were acquired. At the completion of the scheduled imaging sessions, brains were harvested and 2,3,5-triphenyl-tetrazolium chloride (TTC) staining was performed to delineate infarcted areas.
Lastly in the remaining 13 mice, after either cerebral thromboembolism and imaging (n = 10; five with GC-AuNPs and five with fib-GC-AuNPs; 120 mg/kg, 300 μL) or carotid thrombosis and imaging (n = 3 with fib-GC-AuNPs; 20 mg/kg, 200 μL) at baseline, recurrent carotid thromboses were induced by applying 1 × 1 mm2 FeCl3 pledgets sequentially on either two or three more different locations (left distal / left proximal / right distal CCA) at different times in the same animals (at 6 and 24 hours in the two sets of 10 animals and at 1, 2, and 3 weeks in the 3 animals). Without additional administrations of AuNPs, serial mCT imaging was performed 30 minutes after each site of thrombosis was induced.
In vivo mCT imaging and quantitative image analysis
In vivo mCT imaging was performed under the following protocol: 65 kVp, 60 μA, 26.7 × 26.7 mm field of view, 0.053 × 0.053 × 0.054 mm3 voxel size, 500 milliseconds per frame, 360 views, 512 × 512 reconstruction matrix, and 600 slices. mCT data were converted to the Digital Imaging and Communications in Medicine (DICOM) format to make 3-dimensionally rendered imaging using a software package (Lucion; MeviSYS, Seoul, Korea).
Carotid mCT images were analyzed as previously reported[4] by S-K.L. blinded to the kind of AuNPs used, treatment groups, and imaging time. In each animal, a representative longitudinal section image (0.053 mm thickness) was reconstructed to cover the full length of carotid thrombus. In those animals that underwent serial imaging, follow-up images were prepared in the same manner as for the corresponding baseline images by selecting DICOM files in the same orientation and position, with reference to near-by bony structures.
Cerebral mCT images were analyzed by J.-Y.K. and S.-K.L., blinded to the kind of AuNPs used, treatment groups, and imaging time. For every imaging session in each animal, two sets of reconstructed images were prepared: 1) one axial image corresponding to the 2 mm thick basal brain region containing the full length of circle of Willis (COW) thrombi and 2) six 2 mm thick coronal images (corresponding to the TTC-stained brain sections at 2.96, 0.98, -1.06, -3.08, -4.60, -6.36 mm distance from the bregma) for the assessment of thromboemboli that were located above the level of COW in the bottom of the brain. The first brain slice and the last two brain slices (frontal cerebral tip and occipital lobe / cerebellum, respectively) were not included for quantitative analyses. Follow-up images were prepared in the same orientation and position, with a reference to near-by bony structures.
The final reconstructed carotid or cerebral image files were imported to Photoshop CS3-Extended (Adobe Systems, San Jose, CA), and background subtraction was done using a square region of interest (width 40 pixels, height 40 pixels) drawn on an area of the brain parenchyma without thrombus-related hyperdense lesions. In addition, the mCT images were normalized by using the 'Curves adjustment' tool in Photoshop to fix the background grayscale intensity values of the brain parenchyma and skull as 0 (black) and 255 (white), respectively, taking care to preserve linearity. Then, thrombus-related hyperdense lesions were segmented by using the 'Wand' tool, which automatically finds the edge of an object and traces its shape. Thereafter, the area and mean AuNP-mCT density of the thrombus could be measured.
Ex vivo NIRF imaging of cerebral thrombus and image analysis
After the last in vivo mCT imaging, the animals were euthanized and the brains were removed and imaged using a NIRF imager with a charge-coupled device camera (CoolSnap-EZ, Roper-Scientific, Tucson, AZ). Fresh whole brain tissues or 2 mm thick coronal sections were used for obtaining white light and Cy5.5 NIRF-channel (excitation / emission, 675 nm / 694 nm; 1 second acquisition) images. After background subtraction and normalization of ex vivo NIRF images, quantification of thrombus-related Cy5.5 fluorescent areas were performed as previously reported[3] using Photoshop CS3-Extended.
Histology
Brains were embedded in optimal cutting temperature compound (OCT; Sakura Finetek, Tokyo, Japan) and stored at -70ºC. Fresh frozen sections (10 μm thickness) were stained with H&E. For fibrin immunostaining, sections were rinsed using TBS with Tween 20 (Dako) and treated with 1% of H2O2 to block endogenous peroxidase activity. Then, the sections were incubated with rabbit anti-fibrinogen antibody (7.5 μg/mL; Abcam, Cambridge, UK) for 1 hour at room temperature. After the sections were washed in PBS, they were incubated with FITC conjugated goat anti-rabbit secondary antibody (1:1000; Abcam) for 45 minutes, and washed in PBS.
For transmission electron microscopy studies, cerebral arteries were fixed overnight in a mixture of cold 5% glutaraldehyde in 0.1 mol/L phosphate buffer (pH 7.2) and 2% paraformaldehyde in 0.1 M phosphate or cacodylate buffer (pH 7.2). These tissues were postfixed for 1.5 hours in 2% osmium tetroxide in 0.1 mol/L phosphate or cacodylate buffer for 1.5 hours at room temperature. The samples were then washed briefly with deuterated H2O2, dehydrated in a graded series of ethanol (50%, 60%, 70%, 80%, 90%, 95%, and 100%), infiltrated by using propylene oxide and EPON epoxy resin (Embed 812, Nadic methyl anhydride, poly Bed 812, dodecenylsuccinic anhydride, dimethylaminomethyl phenol; Polysciences, Warrington, PA), and finally embedded with only epoxy resin. The epoxy resin-mixed samples were loaded into capsules and polymerized at 38°C for 12 hours and 60°C for 48 hours. Sections for light microscopy were cut at 1.0 nm and stained with 1% toluidine blue for 45 seconds on a hot plate at 80°C. Ultrathin sections (60 nm) were obtained using an ultramicrotome (RMC MT-XL; Boeckler Instruments, Tucson, AZ) and collected on copper grid. The sections were stained with saturated 4% uranyl acetate and 4% lead citrate before examination with a transmission electron microscope (JEM-1400) at 80 kV.
Quantitative measurement of brain infarct size
Four representative 2 mm thick forebrain slices (at 0.98, -1.06, -3.08, and -4.60 mm distance from the bregma) had the most extensive infarct involvement on TTC staining, and were used for infarct size quantification. As previously reported,[3, 14] whitish / pale infarct areas were segmented and final forebrain infarct size was measured.
Assessments of neurobehavioral and systemic toxicity of fib-GC-AuNP in vivo
Six animals were injected with fib-GC-AuNPs (120 mg Au / kg of mouse), and neurotoxicity of the imaging agent was assessed for three weeks by using a battery of neurobehavioral tests (body position, touch escape, finger approach, tail pinch, tail elevation, abdominal tone, grip strength, ataxic gait, tremors, palpebral closure, lacrimation, skin color, and acute death), as previously reported.[17] Then, systemic toxicity was assessed by means of the following blood assays: liver function test and complete blood count with differential.
Statistics
Data are presented as mean ± SEM. Inter-group differences were assessed using Student's t-test or ANOVA with post-hoc Mann-Whitney tests. Paired t-tests were used to compare the difference between related samples. In addition, Pearson correlation analysis was performed to examine a linear relationship between variables. All statistical analyses were conducted using a software package (SPSS 18.0, Chicago, IL). A probability value < 0.05 was considered statistically significant.
Results
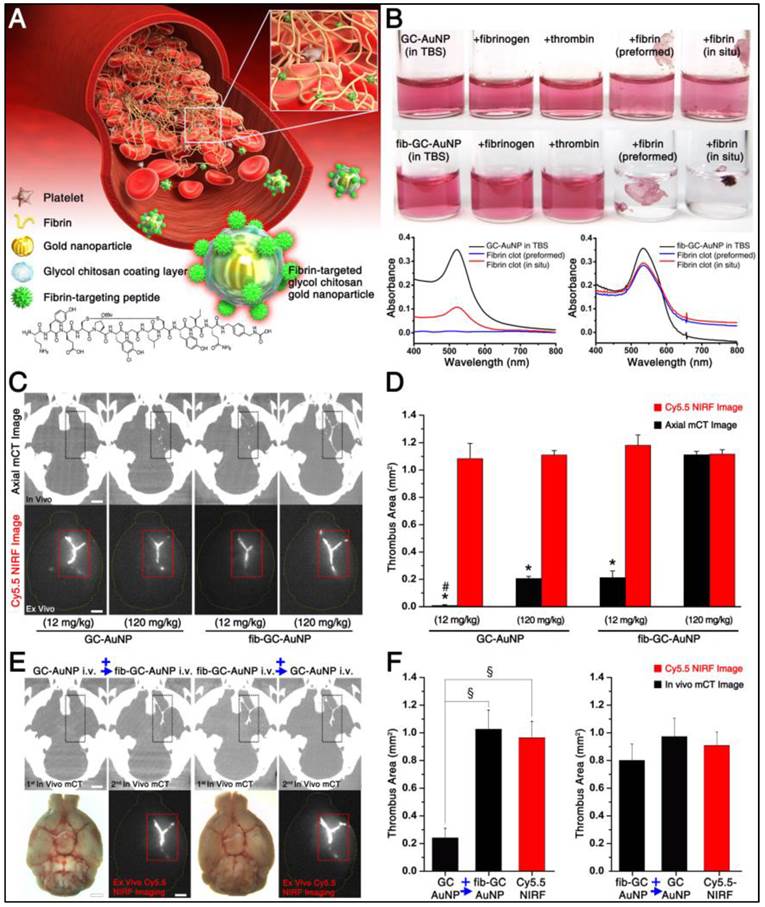
We synthesized GC-AuNPs and conjugated them with fibrin-targeting peptides[9] in order to generate fib-GC-AuNPs (Figure 1A). Both the non-targeted and targeted imaging agents were first characterized in vitro, showing that fibrin-binding capacity was superior with fib-GC-AuNPs compared to untargeted GC-AuNPs. Then, in vivo studies were performed using C57Bl/6 mice (n = 101) with FeCl3-induced carotid thrombosis and/or focal ischemic stroke that was induced by injecting preformed fluorescently-marked thrombi up, via the carotid artery, into the MCA-ACA bifurcation.[3] Pilot experiments (n = 6) demonstrated that without intravenous injection of AuNPs, either carotid thrombus or cerebral thrombus was never visualized on mCT images (data not shown).
Targeted fib-GC-AuNPs are superior to non-targeted GC-AuNPs in fibrin-binding and mCT imaging of cerebral thromboemboli. A, Schematic diagram of fibrin-targeted gold nanoparticles. B, In vitro experiments to show a higher fibrin-binding capacity of fib-GC-AuNPs vs. GC-AuNPs. When either fibrinogen or thrombin was added to GC-AuNP colloid (upper row) or fib-GC-AuNP colloid (middle row), the red coloring caused by dissolute colloids did not change. In contrast, when either preformed fibrin clot was immersed in the fib-GC-AuNP colloid (upper row) or if fibrin clot was formed in situ in the fib-GC-AuNP colloid (middle row), the redness (upper and middle rows) and UV absorbance (lower row) caused by the nanoparticle colloids was decreased and the clots formed were stained a red color. These changes suggest that both non-targeted GC-AuNPs and fibrin-targeted fib-GC-AuNPs have bound to the clot, reducing the amount of colloid in free solution. Considering the relatively weak changes in the color and UV absorbance of the non-targeted GC-AuNP colloid as well as in the color of the preformed and in situ clots, the fibrin-binding capacity of GC-AuNPs is substantially lower than that of fib-GC-AuNPs. TBS denotes Tris-buffered saline. C and D, representative mCT thrombus images / Cy5.5 near-infrared fluorescent (NIRF) thrombus images of C57Bl/6 mice with embolic stroke (C) and grouped quantification data for the areas of embolic clots in the black and red dotted squares (D). Embolic stroke was induced by injecting Cy5.5-fluorescently labeled clot into the bifurcation area of the left distal internal carotid artery of mice (n = 56). One hour later, mCT thrombus images (upper row in C) were acquired 5 minutes after intravenous injection of 300 μL GC-AuNPs or fib-GC-AuNPs of either a low (12 mg/kg; n = 5 / group) or high concentration (120 mg/kg; n = 23 / group). After each animal was sacrificed and the brain was collected, ex vivo optical imaging was performed to obtain a Cy5.5 NIRF thrombus image (lower row in C), which served as a exogenously labeled standard for the purposes of comparing to the corresponding mCT image. At both the high and low concentrations, targeted fib-GC-AuNPs visualize the Y-shape cerebral thrombi better than non-targeted GC-AuNPs (black dotted squares in C). Note how the fluorescent embolic thrombus (red dotted squares in C) is similar for all animals, but how the same thrombi are much better visualized with targeted vs. non-targeted nanoparticles by CT (black dotted squares in C). Regardless of the type of imaging agent, the high concentration is superior to the low concentration in the CT visualization of cerebral thrombi. The above imaging findings from the representative animals (C) are corroborated by the quantification data for all 56 animals (D); the visualized thrombus area ratio (mCT/NIRF) is the highest in the high concentration fib-GC-AuNP group, followed by the high concentration GC-AuNP group, the low concentration fib-GC-AuNP group, and last the lowest in the low concentration GC-AuNP group. E and F, mCT visualization (E) and quantification (F) of cerebral thromboemboli after sequential administrations (blue colored +→) of first non-targeted GC-AuNP and then targeted fib-GC-AuNP, and vice versa. After intravenous (i.v.) injection of GC-AuNPs (120 mg/kg, 300 μL) 50 minutes after embolic stroke, there is very weak parenchymal mCT hyperdensity in the circle of Willis (black dotted square in the 1st column of the upper row). A subsequent mCT image at 60 minutes, obtained after administering fib-GC-AuNPs (120 mg/kg, 300 μL), clearly visualizes cerebral thrombus (black dotted square in the 2nd column of the upper row), which co-localizes to thrombus-marking Cy5.5 signal on the ex vivo NIRF image (red dotted square in the second column of the lower row). When the order of injecting the two types of imaging agent was reversed, mCT visualization of cerebral thrombus by using fib-GC-AuNPs is not further improved by additionally using GC-AuNPs (black dotted squares in the 3rd and 4th columns of the upper row), despite the presence of thrombus-marking Cy5.5 signal on the ex vivo NIRF image (red dotted square in the 4th column of the lower row). These findings from the representative animals are corroborated by quantified data (the areas of embolic clots in the black and red dotted squares) for all 14 animals (F; n = 7 / group). Graphs show mean ± SEM. *P < 0.01 from paired t-tests between mCT vs. corresponding NIRF lesion areas; #P < 0.01 (vs. 120 mg/kg GC-AuNP and both 12 mg/kg and 120 mg/kg fib-GC-AuNP groups) from Student's t-tests; §P < 0.01 from paired t-tests. Concentrations of nanoparticles are reported as 'mg Au / kg of animal'. Scale Bars = 2 mm.
Physicochemical properties and biocompatibility of fib-GC-AuNPs
UV-Vis absorption spectroscopy of non-targeted GC-AuNPs and fibrin-targeted fib-GC-AuNPs showed a surface plasmon resonance peak at about 519 nm (Supplementary Material: Figure S2A), which indicates that fib-GC-AuNPs were stable without aggregation after the conjugation of fibrin-targeting peptides. The hydrodynamic diameter of GC-AuNPs and fib-GC-AuNPs measured in aqueous condition with dynamic light scattering were 119.9 ± 2.8 nm (PDI 0.0005) and 127.4 ± 2.7 nm (PDI 0.0004), respectively (Supplementary Material: Figure S2B and S2C). Transmission electron microscopic images of fib-GC-AuNPs showed that the diameter in a desiccated state was approximately 30 nm (Supplementary Material: Figure S2D and S2E). A uniform GC coating layer (~5 mm thickness) was observed on the surface of the nanoparticles. fib-GC-AuNPs had a spherical shape, and they were uniformly dispersed. Zeta(ζ)-potential data also supported the existence of the fibrin-targeting peptides on the surface of the nanoparticles. Because of primary amine groups of GC, GC-AuNPs showed positive ζ- potential value (16 ± 0.3 mV). On the other hand, fib-GC-AuNPs showed an increased value after the conjugation of the fibrin-targeting peptides (34 ± 0.2 mV).
fib-GC-AuNPs were highly stable in PBS; fib-GC-AuNPs maintained their size and distinctive UV-Vis absorption spectra in PBS for 2 days. Furthermore, the surface plasmon resonance peak of fib-GC-AuNPs was not changed at about 525 nm for 2 days (Supplementary Material: Figure S2F). The size of fib-GC-AuNPs at 48 hours after storage in PBS was 124.8 ± 3.2 nm, which was similar to the size of freshly synthesized fib-GC-AuNPs (127.4 ± 2.7 nm). When HeLa cells were incubated with fib-GC-AuNPs for 24 hours, cytotoxic effects were not observed at AuNP concentrations up to 50 µg/mL. At 100 µg/mL, cell viability was still higher than 75% (Supplementary Material: Figure S2G). In addition to the physicochemical stability and biocompatibility, the X-ray attenuation property of fib-GC-AuNPs (Supplementary Material: Figure S3) indicates the ability of the nano-agent to act as a contrast dye for imaging with a small animal mCT scanner or a human CT scanner.
In vitro fibrin binding capacity of fib-GC-AuNPs
When either TBS, fibrinogen, or thrombin + CaCl2 was added to the red-colored fib-GC-AuNP colloid, there was no noticeable aggregation, precipitation, or color change (Figure 1B). This indicates the stability or inertness of fib-GC-AuNPs in response to these chemicals. When a fibrin clot, preformed by mixing fibrinogen, thrombin, CaCl2, and FXIIIa in TBS, was immerged into the fib-GC-AuNP colloid, the solution decolorized and the clot was stained a light-red color. These changes suggest that fib-GC-AuNPs were bound to the fibrin clot. When a clot was formed within the fib-GC-AuNP colloid by adding fibrinogen, thrombin, and CaCl2 to the solution, the solution again decolorized and a clot formed, which was stained a dark-red color. The stronger staining of this clot compared with that of the preformed clot suggests that fib-GC-AuNPs had better access to the multiple binding sites in the in situ formed clot (including the inner core) compared to the more limited access in the preformed clot. Control experiments using the non-targeted GC-AuNP colloid and UV-Vis absorption spectroscopy experiments demonstrated that fibrin-targeted fib-GC-AuNPs have a substantially higher fibrin-binding capacity than GC-AuNPs.
Cerebral thromboemboli are clearly visualized in vivo at high resolution by mCT after intravenous administration of fib-GC-AuNPs, not non-targeted GC-AuNPs
One hour after the injection of fluorescently-marked thrombus into the MCA-ACA bifurcation, and 5 minutes after intravenous injection of 300 μL GC-AuNPs (120 mg/kg), only some subregions of cerebral thrombus could be visualized in 23 animals treated this way (Figure 1C and 1D). However, in all 23 animals injected with fib-GC-AuNPs, strong mCT attenuation was noted at the site of cerebral thrombosis, indicating superior thrombus seeking behavior for the targeted agent. At a lower dose (12 mg/kg), despite similar thrombus-related Cy5.5 fluorescent areas on ex vivo NIRF images of the brains, hyperdense thrombus areas on in vivo mCT images were relatively low in both groups (n = 5 / group), particularly in the GC-AuNP-injected mice, indicating a dose dependence for successful thrombus visualization. In three of the five GC-AuNP group animals, no part of the cerebral thrombus was visible. In a switch-over paradigm study (Figure 1E and 1F), the more effective mCT visualization of cerebral thromboemboli by fib-GC-AuNPs was confirmed by sequentially administering GC-AuNP and then fib-GC-AuNP, and vice versa.
mCT visualization of carotid thrombus is also superior with fib-GC-AuNPs, compared to GC-AuNPs
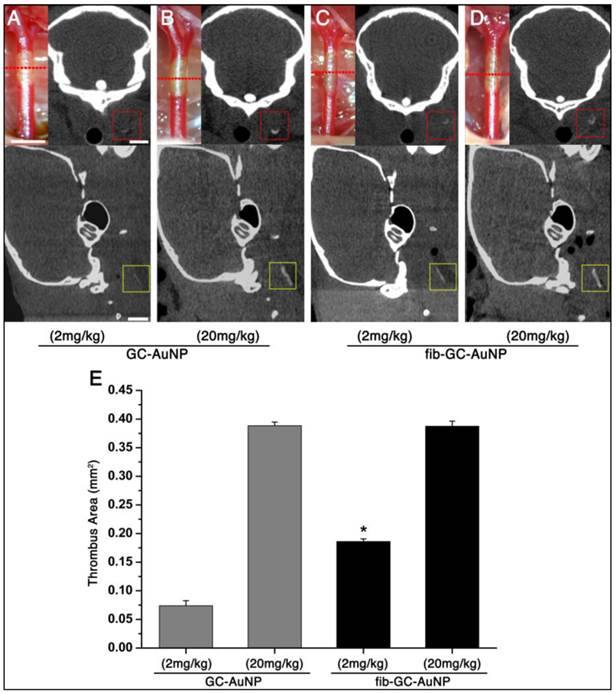
Carotid thrombi were induced using FeCl3 pledgets on the exposed vessel for 5 minutes, followed by intravenous injection of 200 μL GC-AuNPs or fib-GC-AuNPs, both of which contained either 2.5 mg/mL or 0.25 mg/mL Au. Imaging was done 5 minutes after injection. All six animals in both groups showed similarly strong mCT attenuation localized to the site of carotid thrombosis (Figure 2). At a lower dose (2 mg/kg, 200 μL injected volume; n = 3 / group) however, the same thrombotic insult resulted in much less thrombus visualization. The areas were measured to be relatively low in both groups, particularly in the non-targeted GC-AuNP-injected mice. In one of the three low-dose GC-AuNP group animals, carotid thrombus could not be identified at all. The low dose targeted agent had equivalent performance to the high dose (20 mg/kg, 200 μL injected volume) non-targeted agent. For each given dose level, targeted agent outperformed non-targeted agent, and for each agent, higher dose outperformed lower dose.
Targeted fib-GC-AuNPs are superior to non-targeted GC-AuNPs in mCT imaging of in situ carotid thrombus. A-D, Representative mCT imaging of in situ carotid thrombosis. Thrombi were formed in C57Bl/6 mice by applying stripes of filter paper (1 × 1 mm2) soaked in 10% FeCl3 to the left distal carotid artery (photographs, upper row). Thirty minutes later, mCT thrombus images (upper row, coronal view; lower row, sagittal view) were acquired 5 minutes after intravenous injection of 200 μL GC-AuNPs (A and B) or fib-GC-AuNPs (C and D) of either a low (2 mg/kg; A-C) or high (20 mg/kg; B and D) concentration. At the low administered doses, fib-GC-AuNPs (D) outperforms GC-AuNPs (C), by more clearly marking the carotid thrombus. The “larger” thrombus in (C) vs. (A) reflects better clot visualization due to more avid binding of the targeted compound. At high administered doses, the areas of thrombus-related hyperdense lesions look similar between the animals injected with either GC-AuNPs (B) or fib-GC-AuNPs (D). E, Grouped quantification data. The above mCT imaging findings from the representative animals are corroborated by the quantification data for all 12 animals (n = 3 / group). At a higher dose (20 mg/kg), both fib-GC-AuNPs and non-targeted GC-AuNPs detected carotid thrombus with equal efficacy. At a lower dose (2 mg/kg) however, fib-GC-AuNPs and GC-AuNPs could mark approximately half and a quarter of thrombus area, respectively, as compared to the best thrombus marking result. Graphs show mean ± SEM. *P < 0.05 vs. GC-AuNP (both 2 mg/kg and 20 mg/kg) and fib-GC-AuNP (20 mg/kg) groups (ANOVA with post-hoc Mann-Whitney tests). Concentrations of nanoparticles are reported as 'mg Au / kg of animal'. Scale bars = 1 mm.
Imaging-histology correlation: cerebral thrombus imaging (in vivo / ex vivo mCT imaging and ex vivo NIRF imaging) is closely matched by thrombus histology (H&E / fibrin staining and electron microscopy of intra-thrombus fib-GC-AuNPs)
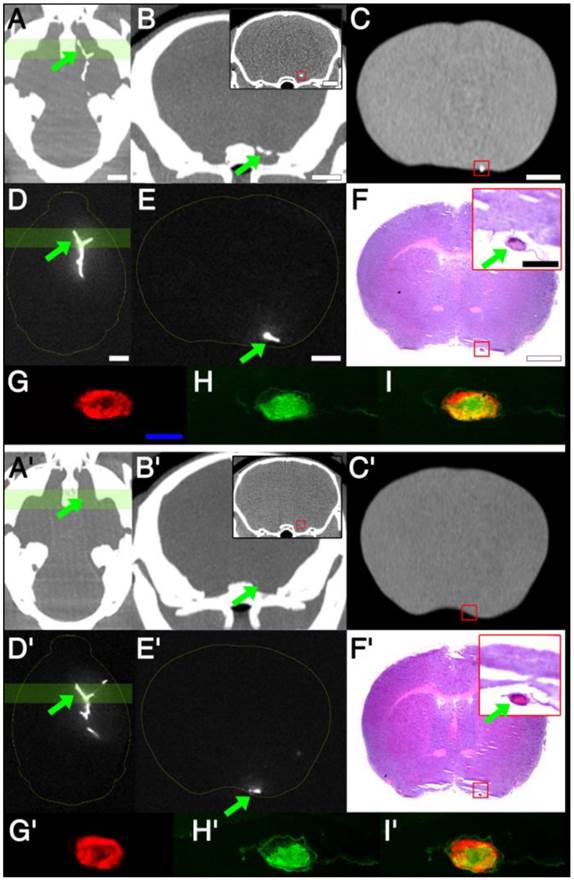
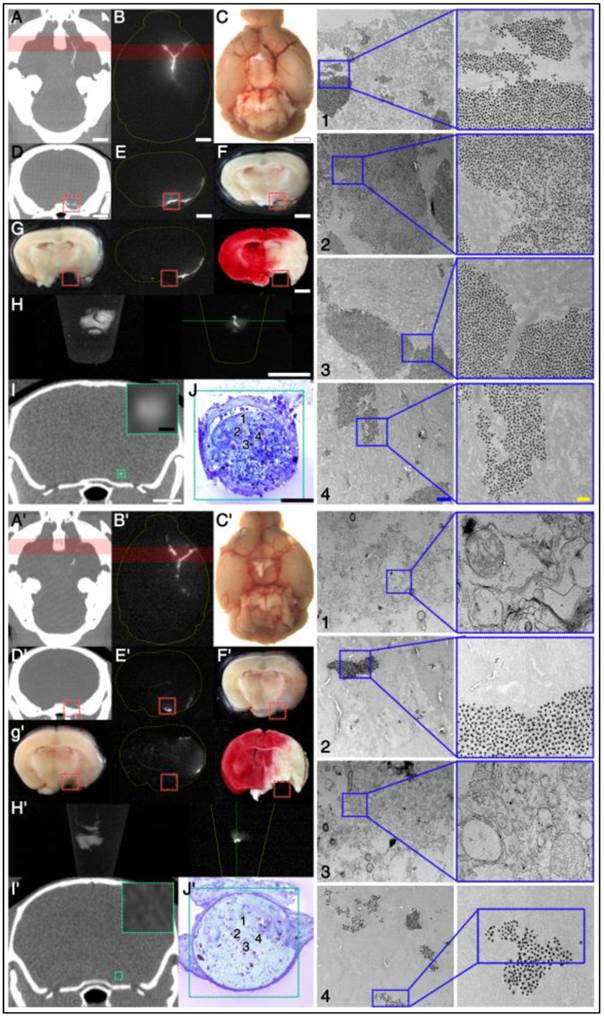
There was a clear difference between targeted and non-targeted nanoparticles on cerebral CT imaging (Figure 3), with excellent thrombus demonstration on CT with targeted nanoparticles, and excellent matching to corresponding histological findings, while CT demonstration failed for non-targeted nanoparticles, even though thrombi were clearly present on histology. After intravenous administration of fib-GC-AuNPs in mice with embolic stroke, in vivo mCT imaging detected hyperdense lesions in the brain, and these lesions co-localized with Cy5.5 fluorescent thromboemboli on ex vivo NIRF images of the whole brain tissue and 2 mm thick sections (Figure 3 and Supplementary Material: Figure S4). NIRF microscopic imaging of 10 μm thick cryosections of the tissue confirmed thrombi filling in cerebral arteries (Figure 3). However, non-targeted GC-AuNPs could not always visualize cerebral thrombus in the COW, even when these thrombi could be clearly imaged by ex vivo NIRF imaging of the brain tissues and NIRF microscopic imaging of the brain sections. Histological findings clearly showed that mCT signal corresponded to cerebral arterial thrombi on H&E-stained or fibrin immune-stained brain sections. Electron microscopy studies confirmed that numerous fib-GC-AuNPs were scattered within the thrombi, whereas GC-AuNPs were only sparsely observed (Figure 4). Target-specific and localized accumulation of fib-GC-AuNPs in millimeter-sized carotid or cerebral thrombi may have allowed successful mCT demonstration of the thrombi even at the low doses administered (2 or 12 mg/kg vs. 20 or 120 mg/kg, respectively).
Correlation between imaging and histology: targeted fib-GC-AuNPs vs. non-targeted GC-AuNPs. A-C, mCT thrombus images in representative C57Bl/6 mice with embolic stroke that was induced by injecting Cy5.5-fluorescently labeled clot into the bifurcation area of the distal internal carotid artery. One hour later, and 5 minutes after intravenous injection of 300 μL (120 mg/kg) fib-GC-AuNPs, cerebral thrombus is visualized on the in vivo mCT images: a reconstructed 2 mm thick horizontal view at the level of the circle of Willis (COW) shows the thrombus in the bifurcation as a Y-shaped hyperdensity (arrow) (A). A 2 mm thick coronal view that corresponds to the green-colored brain region in A also shows the thrombus as dotted hyperdensity in the vessel (arrow) (B), which is corroborated by 50 μm thick coronal view that corresponds to the middle of the green-colored brain region of A (inset of B with a red-square containing the thrombus-related hyperdense lesion). Ex vivo mCT imaging of a 2 mm thick brain section (C), corresponding to the location for the in vivo mCT image displayed in the inset of B, also shows the cerebral thrombus (red-square). D, An ex vivo optical image of the excised whole brain: visualization of thrombus-related fluorescent signal in the COW (arrow), corresponding to a similar viewpoint as in A (D). E, An ex vivo optical image of a 2 mm thick coronal section with thrombus (arrow), which corresponds to the viewpoint in B and C (= coronal views of the green-colored brain region of A and D). Please note that fluorescent and mCT visualizations of the thrombus are nearly equivalent. F, Hematoxylin-eosin staining of a thin section (10 μm thickness) from the 2 mm tissue slab used in C. This shows the cerebral thrombus (arrow in the inset) that co-localizes with the hyperdense mCT lesion observed earlier (inset of B as well as in C). G-I, Microscopic fluorescent images. A magnified view of the thrombosed site (arrow) in F and near-infrared fluorescent microscopy image of the same area (G) demonstrate that Cy5.5 fluorescent thrombus is located within the cerebral artery. Fibrin immunostaining of the same section (H, FITC channel) and Cy5.5 - FITC merged image (I) shows that the major thrombus component is fibrin, which is the target for fib-GC-AuNPs. A'-I' shows the same data for an animal injected with non-targeted GC-AuNPs. Please note that there is no mCT density (A'-C') associated with the clot (D'-I') for the GC-AuNP compound, although a thrombus is clearly present on histology and fluorescent imaging, indicating the specificity of fib-GC-AuNP over non-targeted GC-AuNP. Concentrations of nanoparticles are reported as 'mg Au / kg of animal'. Scale Bars = 2 mm (A-F, inset of B); 500 μm (inset of F); 200 μm (G).
Electron microscopy study demonstrates that targeted fib-GC-AuNPs are more densely clustered in cerebral thrombus than the non-targeted equivalent, correlating well with the more sensitive mCT visualization of thrombus by the targeted compound. A-J, Axial mCT image (A; 2 mm thickness), ex vivo Cy5.5 near-infrared fluorescent (NIRF) thrombus image (B) and visible light image (C) of a representative C57Bl/6 mouse brain with the Y-shape embolic clot at the left distal internal carotid artery bifurcation area after injection with fib-GC-AuNP. (D-F) Coronal reformations of the mCT (D) in the same plane as sectioned (at red-colored brain regions in A and B) brain (2mm thickness) imaged optically for Cy5.5 (E), and gross brain digitally photographed (F). Red reticles in D-F contain the anteromedial portion of the Y-shape embolic clot, overlaid by the red-color bars in A and B. (G) The gross brain photographed after removing the red reticle area in D-F (left), Cy5.5 NIRF thrombus image of the brain section (middle), and 2,3,5-triphenyl-tetrazolium chloride (TTC)-stained brain section (right). (H) Autofluorescent green channel image of the removed (red reticle area) brain tissue (left) and Cy5.5 NIRF thrombus image (right). (I) Coronal mCT image (0.053 mm thickness) that corresponds to the green line crossing the removed thrombotic area in H. The inset shows a magnified view of the green-squared thrombotic area. (J) Electron microscopy images captured in the 60 nm thick toluidine blue-stained section of the removed tissue (J1-4), which corresponds to the green-squared area of I and has cerebral thrombus occluding the left middle cerebral artery. Please note that fib-GC-AuNPs are clustered within the thrombus; and most of the nanoparticles are not aggregated, suggesting that they individually diffused into the clot and were captured. A'-J', The same data for an animal injected with non-targeted GC-AuNPs. Please note that non-targeted GC-AuNPs are much less dense in the cerebral thrombus (J'1-4). mCT images show correspondingly weak (A') or absent (D' and I') thrombus-related hyperdense lesions. Scale bars = 2 mm (A-I); 100 μm (insets of I, J); 1 μm (J1-4, left panel); 0.2 μm (J1-4, right panel).
fib-GC-AuNP mCT imaging allows the assessment of the location, amount, and tPA-mediated dissolution of cerebral thromboemboli
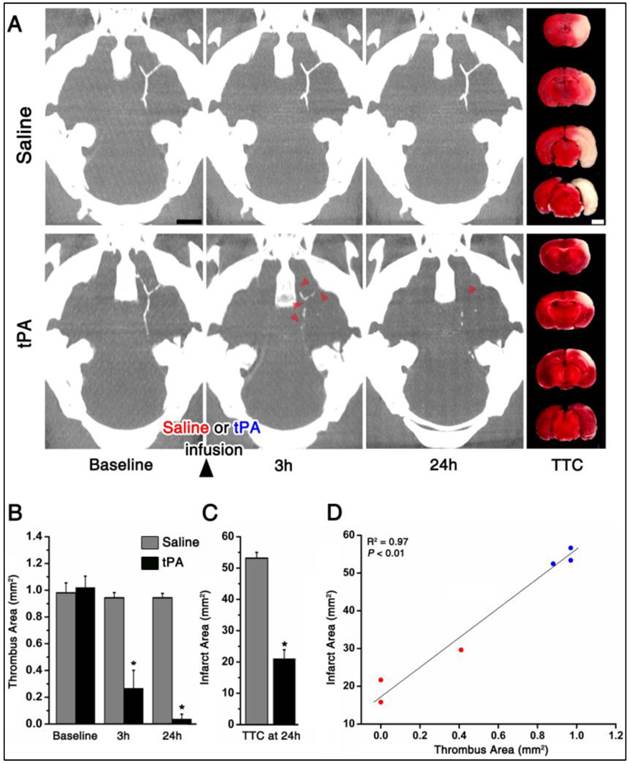
As shown in the representative mice, one hour after embolic stroke and 5 minutes after intravenous injection of fib-GC-AuNPs, mCT thrombus imaging allows the localization and quantification of cerebral thromboemboli (Figure 5). In contrast to saline treatment (n = 3), tPA treatment (n = 3) reduced thrombus area significantly at 3 and 24 hours. This was significant in terms of biological outcomes, as shown by TTC staining-measured final infarct size at 24 hours: smaller in the tPA group animals than for the saline group animals. Furthermore, thrombus areas at 24 hours showed a significant linear correlation with the final infarct size (P < 0.01, R2 = 0.97).
Targeted fib-GC-AuNP mCT imaging allows a prompt and quantitative assessment of the location, amount, and tissue plasminogen activator-mediated lysis of cerebral thromboemboli. A and B, Representative serial mCT thrombus images acquired at baseline (5 minutes after intravenous injection of fib-GC-AuNPs and 1 hour after the embolic stroke), and 3 and 24 hours after tissue plasminogen activator (tPA) treatment. Direct thrombus imaging permits the localization and quantification of cerebral thrombi in the circle of Willis. Follow-up mCT imaging shows no change in the thrombus with saline treatment. However, treatment with tPA, which was initiated after the baseline imaging (total dose of 24 mg/kg tPA administered as a 60 μL bolus injection followed by 540 μL continuous infusion over 30 minutes), shows the dissolution of the thrombus (arrow-heads on B) at 3 and 24 hours. This demonstrates that thrombus marking can allow therapeutic monitoring of thrombolysis. Infarct size on 2,3,5-triphenyl-tetrazolium chloride (TTC) staining (rightmost panels of A and B), performed after the last imaging session, shows a corresponding reduction in the amount of brain infarcted. C, Grouped quantification data for all animals (n = 3 / group). D, A strong correlation between the thrombus areas at 24 hours and the final infarct size at 24 hours. Bar graphs show mean ± SEM. *P < 0.05, repeated measures ANOVA with post-hoc Mann-Whitney tests (vs. baseline) in B, and Mann-Whiney test between the saline and tPA groups in C. Pearson correlation analysis was used to calculate the R2 and P value in D. Scale Bars = 2 mm.
fib-GC-AuNP mCT thrombus imaging allows the visualization of recurrent and persistent thrombosis
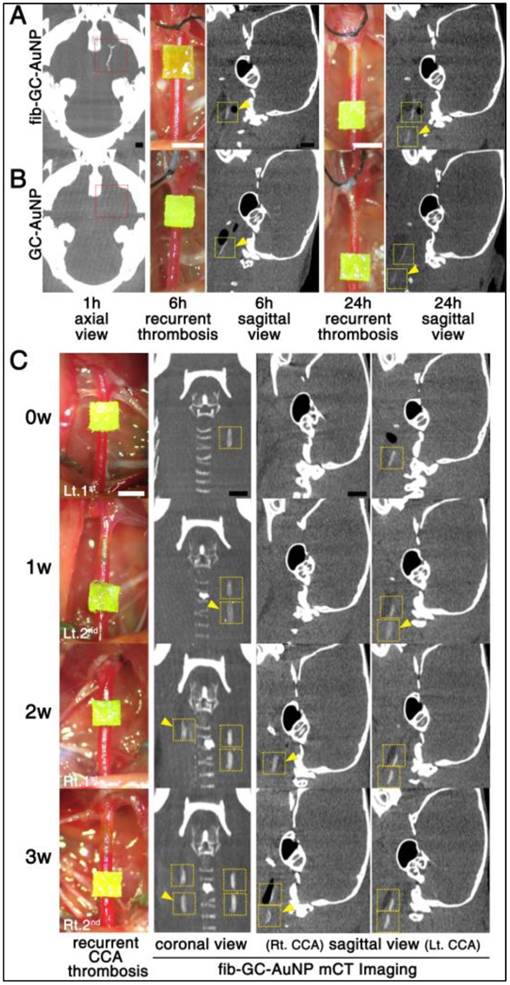
After either cerebral thrombus (n = 5) or carotid thrombus (n = 3) was visualized with fib-AuNP-mCT imaging, two or three (respectively) additional thrombi were formed in the carotid arteries during the following 24 hour or 3 week period, respectively, using FeCl3 pledgets, similar to the technique used to induce in situ thrombosis. These new thrombi, modeling recurrent or ongoing thrombosis, could be clearly detected in all animals without additional injection of fib-GC-AuNPs (Figure 6). This worked, even in animals receiving non-targeted agent. Although cerebral thrombus could not be imaged well with GC-AuNPs (n = 5), recurred carotid thrombi were visualized without additional injection.
A single-dose targeted fib-GC-AuNP injection and repeated mCT imaging capture both the initial episode of acute cerebral thrombosis and subsequent recurrent episodes of carotid artery thromboses. A and B, Repeat mCT imaging to visualize recurrent thrombosis over 24 hours. mCT imaging at baseline (leftmost axial images) permitted the visualization of cerebral thrombi (red reticles) at 1 hour after embolic stroke and 5 minutes after intravenous injection of targeted fib-GC-AuNPs (A, a representative of n = 5 experiments). However, non-targeted GC-AuNPs failed to visualize this thrombus (B, a representative of n = 5 experiments). Then, to model recurrent thromboses, FeCl3 pledgets (1 × 1 mm2) were applied on two different locations of the left common carotid artery (CCA) at different times, ranging from 1 to 24 hours after the initial insult in the same animals (digital photographs). Regardless of the type of imaging agent, recurrent carotid thrombi (yellow arrow-heads) could be detected by circulating nanoparticles without additional injection of AuNPs (6 hours and 24 hours sagittal view images). C, Repeat mCT imaging to visualize recurrent thrombosis over 3 weeks (w). After a single-dose injection of fib-GC-AuNPs, baseline (0 w) and recurrent (yellow arrow-heads) CCA thromboses are visualized over 3 weeks (a representative of n = 3 experiments). Yellow reticles are placed on the CCA areas with FeCl3-induced thrombosis. Scale Bars = 1 mm. Lt. and Rt. denote left and right, respectively.
fib-GC-AuNPs did not show noticeable neurobehavioral or systemic toxicity
In the second set of experimental animals (n = 6), neurobehavioral toxicity was not observed during the 3 weeks after intravenous administration of fib-GC-AuNPs (Supplementary Material: Table S1). In addition, hematologic studies showed no noticeable systemic toxicity, although hemoglobin levels and hematocrit percentages were slightly low (10.9 ± 0.2 g/dL and 33.4 ± 1.3 %, respectively), and mean platelet volumes and monocyte percentages were relatively high (28.5 ± 0.3 fL and 15.2 ± 2.7 %), compared with the reference values (Supplementary Material: Table S2).
Discussion
This is the first study to demonstrate a novel CT-based fibrin-targeted nanoparticle imaging agent (fib-GC-AuNPs) for direct imaging of cerebral thromboembolism as well as carotid thrombosis. We compare and contrast this targeted agent with an equivalent but non-targeted nanoparticle agent (GC-AuNPs), and demonstrate the superiority of the targeted agent, both in vitro, and in vivo in models of in situ thrombosis, embolic infarction, and therapeutic thrombolysis. Using the targeted agent, we were highly successful at detecting thrombi, quantifying the amount of thrombus present, and determining the success of thrombolytic therapy. Post-tPA residual thrombus burden at 24 hours was highly correlated with the final infarct size at 24 hours.
To assess the success of the nanoparticle agent at detecting and quantifying thromboemboli, we needed a suitable standard. We chose to fluorescently label exogenously formed thrombus, using the FXIIIa-sensing C15 probe we previously described.[3] Thus, there were two independent methods of thrombus visualization that could be compared: fluorescent imaging (FXIIIa-mediated fibrin-crosslinking-related, and serving as a standard) and mCT imaging (fibrin-binding nanoparticle, to be correlated to the standard). Thus, the area of thrombus-related fluorescent signal on ex vivo NIRF imaging served as a reference value to be compared with the area of hyperdense mCT lesion in vivo. The cerebral thrombus areas that were visualized in vivo using fib-GC-AuNP (120 mg Au / kg of animal, 300 μL injected volume) and mCT did not significantly differ from those visualized ex vivo using the NIRF imaging method. Therefore, the new in vivo mCT cerebral thrombus imaging is as sensitive as the ex vivo NIRF cerebral thrombus imaging, but can be done in intact living animals at multiple time-points, and has human translation potential. Co-localization studies showed that there was a much better correspondence between fluorescence (exogenous thrombus marker) and mCT-density (endogenous thrombus marker) for cerebral thrombi imaged with the targeted agent than with non-targeted agent.
For the detection of cerebral thromboemboli in 35 patients with clinical suspicion of stroke, susceptibility-weighted magnetic resonance imaging (MRI) was shown to be superior (sensitivity / specificity: 85% / 100%) to fluid attenuation inversion recovery MRI (61% / 98%) and CT (52% / 93%), and complementary to MR angiography and catheter angiography.[18] In our study using CT, the most widely used imaging modality in the current management of hyperacute stroke, high dose fib-GC-AuNPs (120 mg/kg, 300 μL) could visualize nearly the entire area of cerebral thrombus in all 20 animals, while GC-AuNPs could detect less than 20% of the thrombus area. The superior capacity of fib-GC-AuNPs vs. GC-AuNPs with mCT detection of cerebral thrombus was further confirmed by double-agent cross-over experiments, in which we sequentially administered non-targeted GC-AuNPs followed by targeted fib-GC-AuNPs, or vice versa, to each of six animals. fib-GC-AuNPs clearly visualized the entire area of cerebral thrombus, while GC-AuNPs either did not image the thrombus at all or imaged it partly and very faintly. GC-AuNP did not visualize additional areas of thrombus beyond what fib-GC-AuNP had been able to show.
Multiple factors could influence the movement of fib-GC-AuNPs (vs. GC-AuNPs) into / within / out of a clot, and thus determine the (equilibrium) distribution of the imaging agents within the thrombus vs. blood compartments.[15, 19] These factors may include the presence or absence of targeting peptides on AuNPs and physicochemical clot properties such as fibrin or platelet content, porosity-related and arterial flow pressure-driven permeability to AuNPs, and AuNP concentration gradient-dependent diffusibility. Our work suggests that targeting nanoparticles with a fibrin-binding peptide strongly increases the amount of nanoparticle that localizes to thrombus.
The presence of residual thrombus and/or distal embolization were shown to influence clinical outcomes in ST-segment elevation myocardial infarction.[20] It is well known that residual thrombus is of itself highly thrombogenic, and capable of restarting the thrombotic cascade leading to vascular re-occlusion. Thus, it is widely suspected that such residual thrombus might be a reason for treatment failure, but up to now, the tools to demonstrate such residual disease were not available. Our work suggests a way to assess for such recurrent or residual thrombi, and guide therapy to treat to completion.
Acute stroke itself as well as post-treatment residual thrombus increases the risk of recurrent thrombosis, presumably by markedly increasing monocyte recruitment to atheromas and thus rendering them prone to rupture and thrombosis.[21] Thus, the post-stroke period has a higher risk of having additional thrombotic events, a fact well recognized by the “stuttering” course of many infarcts,[22] and the universal use of anti-platelet therapies in post-infarct patients. Nanoparticle based CT imaging would be very useful in detecting both acute and subacute thrombotic recurrences without additional administrations of fib-GC-AuNPs or GC-AuNPs.
Conventional techniques for thrombus imaging are very different from direct thrombus imaging with targeted nanoparticle agents. MR or CT angiography visualizes flowing blood within the vessel lumen rather than the clot itself.[8] These techniques confirm the presence of obstruction rather than the size of obstructing thrombus, and cannot easily distinguish between components such as thrombus and underlying atherosclerotic plaque which might both contribute to stenosis or occlusion.
Hyperacute CT-based direct thrombus imaging is the missing element that will allow us to identify and triage patients for thrombolysis,[4] and the feedback loop that will allow us to rapidly and effectively adapt therapy for individual cases. Thrombi resistant to dissolution with tPA could either receive higher doses, or be moved to mechanical thrombolysis.[2] CT, already available in most emergency departments worldwide and is usually the first imaging modality that patients are subjected to in the evaluation of stroke.[6] CT is ready to, and would be greatly augmented by direct thrombus imaging. Direct thrombus imaging should not add much time to the time-urgent clinical situation in most of these patients, in contrast to modalities like MR, where considerable time needs to be invested to get information in critically ill patients with a narrow treatment window.
Our study has several limitations. First, targeted fib-GC-AuNPs may also have been nonspecifically attached to thrombus, given that even non-targeted nanoparticles target thrombus, though relatively weakly.
Second, further study is required to clarify how recurrent thrombi could be demonstrated late (1 ~ 3 weeks after injection of fib-GC-AuNPs) at contrast levels similar to baseline imaging, with no further nanoparticle injection. This is surprising, and as yet, unexplained finding, and will be pursued with further studies.
Third, effects of clot age and composition on the effectiveness of clot marking by fib-GC-AuNPs are not known. Clot composition may differ depending on source of origin, site of occlusion, time to reperfusion, and other individual patient factors.[23] Thrombi that are resistant to tPA might be highly organized and (crosslinked) fibrin-rich, or platelet-rich, or a combination of these.[24, 25] Thus, clot characterization in a prompt manner, possibly by using a CT-based targeted direct thrombus imaging agent such as fib-GC-AuNPs, may have to be considered in weighing the risks and benefits of potential treatment options and in determining whether to use intravenous thrombolysis and/or intra-arterial thrombolysis or selecting specific endovascular therapies.
Fourth, we did not investigate if the direct thrombus imaging actually improves the safety and efficacy of recanalization therapy by allowing tailored dose titration to individual animal receiving intravenous tPA and/or guide intraarterial intervention. Such work needs to be done in future, and likely in humans. We hope that such efforts, enabled by the data we present here, will eventually lead to a personalized thrombolytic therapy by a) optimizing tPA dosing to match thrombus burden, and b) enabling the rational triage of patients to more radical therapies such as endovascular clot retrieval. The individualized therapy will permit a more accurate balance between tissue reperfusion and avoiding hemorrhagic complications.
Lastly, there are translational differences between large and small animals, and microCT and clinical CT. For example, the soft tissue resolution in human CT is often sufficient to distinguish clot from the background blood pool (such as the “dense MCA sign”).[26] We have never observed clot related hyperdensity with microCT in small animals, but might be able to observe such signs in larger animals using clinical CT. Dual- or multi-energy CT could be useful in distinguishing the dense artery sign (for red blood cell-rich clots[27]) and fib-GC-AuNP-related thrombus marking (for fibrin-rich clots), based on their differences in attenuation properties at different X-ray energies.[28] In addition, it would be interesting to see if AuNPs and flat-panel CT that has relatively low contrast sensitivity, performed during intra-arterial recanalization therapy, can track the evolution of thrombi and scattering of emboli, and guide the recanalization therapy in near-real time. Furthermore, fib-GC-AuNPs could potentially serve as a theranostic platform[29] for thrombus-specific delivery of clot busters along with the direct imaging of thrombi. Future studies will be needed to gather data to explore these issues as well as toxicity of the imaging agent in larger species.
To summarize, our study demonstrates that fib-GC-AuNPs allow high-resolution in vivo mCT imaging of in situ carotid thrombosis and cerebral thromboembolism in a sensitive and quantitative manner. When translated into the clinic and utilized in the critical decision making process, fib-GC-AuNP and CT-based cerebral thrombus imaging technique will serve as a potentially very useful tool to move beyond the current time window criteria for tPA administration and provide the opportunity for individually tailored thrombolytic therapy, to greater numbers of patients, and/or the appropriate withholding of unnecessary or dangerous therapies from others who don't need them. For example, fib-GC-AuNPs may allow us to personalize acute stroke management by enabling us to monitor thrombolytic therapy and informing us if tPA dosing is too low (persistent ischemia) or too high (hemorrhagic risk). In addition to the potential clinical implications, the advanced imaging will likely have multiple uses in current basic / translational vascular research and theranostic nanomedicine research.
Supplementary Material
Figures S1-S4, Tables S1-S2.
Abbreviations
tPA: tissue plasminogen activator; NIRF: near- infrared fluorescent; CT: computed tomography; GC: glycol chitosan; FXIIIa: activated coagulation factor XIII; UV-Vis: Ultraviolet visible; PDI: Polydispersity index; MCA: middle cerebral artery; ACA: anterior cerebral artery; CCA: common carotid artery; ECA: external carotid artery; ICA: internal carotid artery; mCT: microCT; fib-GC-AuNP: fibrin-targeted glycol-chitosan coated gold nanoparticles; TTC: 2,3,5-triphenyl-tetrazolium chloride; DICOM: digital imaging and communications in medicine; COW: circle of Willis; MRI: magnetic resonance imaging
Acknowledgements
The authors thank Jin-Yong Park and Dr. Wi-Sun Ryu for their valuable comments on this study. This research was supported by the Bio & Medical Technology Development Program of the National Research Foundation (2010-0019862) and the Korea Healthcare Technology R&D Project, Ministry of Health and Welfare (A120099, A121996), funded by the Korean government.
Competing Interests
The authors have no competing interests.
References
1. Tissue plasminogen activator for acute ischemic stroke. The National Institute of Neurological Disorders and Stroke rt-PA Stroke Study Group. N Engl J Med. 1995;333:1581-7
2. Lee DK, Nahrendorf M, Schellingerhout D. et al. Will molecular optical imaging have clinically important roles in stroke management, and how? J Clin Neurol. 2010;6:10-8
3. Kim DE, Kim JY, Nahrendorf M. et al. Direct thrombus imaging as a means to control the variability of mouse embolic infarct models: the role of optical molecular imaging. Stroke. 2011;42:3566-73
4. Kim DE, Kim JY, Sun IC. et al. Hyperacute direct thrombus imaging using computed tomography and gold nanoparticles. Ann Neurol. 2013;73:617-25
5. Kirmani JF, Alkawi A, Panezai S. et al. Advances in thrombolytics for treatment of acute ischemic stroke. Neurology. 2012;79:S119-25
6. Wintermark M, Sanelli PC, Albers GW. et al. Imaging recommendations for acute stroke and transient ischemic attack patients: a joint statement by the American Society of Neuroradiology, the American College of Radiology and the Society of NeuroInterventional Surgery. J Am Coll Radiol. 2013;10:828-32
7. Walter S, Kostpopoulos P, Haass A. et al. Bringing the hospital to the patient: first treatment of stroke patients at the emergency site. PLoS One. 2010;5:e13758
8. Jaberi A, Lum C, Stefanski P. et al. Computed tomography angiography intraluminal filling defect is predictive of internal carotid artery free-floating thrombus. Neuroradiology. 2014;56:15-23
9. Overoye-Chan K, Koerner S, Looby RJ. et al. EP-2104R: a fibrin-specific gadolinium-Based MRI contrast agent for detection of thrombus. J Am Chem Soc. 2008;130:6025-39
10. Uppal R, Ay I, Dai G. et al. Molecular MRI of intracranial thrombus in a rat ischemic stroke model. Stroke. 2010;41:1271-7
11. Furie B, Furie BC. Mechanisms of thrombus formation. N Engl J Med. 2008;359:938-49
12. Hainfeld JF, Slatkin DN, Focella TM. et al. Gold nanoparticles: a new X-ray contrast agent. Br J Radiol. 2006;79:248-53
13. Pisano JJ, Finlayson JS, Peyton MP. [Cross-link in fibrin polymerized by factor 13: epsilon-(gamma-glutamyl)lysine]. Science. 1968;160:892-3
14. Park JY, Lee SK, Kim JY. et al. A New microCT-based high-resolution blood-brain barrier imaging technique to study ischemic stroke. Stroke. 2014;45:2480-4
15. Diamond SL. Engineering design of optimal strategies for blood clot dissolution. Annu Rev Biomed Eng. 1999;1:427-62
16. Sachs UJ, Nieswandt B. In vivo thrombus formation in murine models. Circ Res. 2007;100:979-91
17. Shon SM, Cho YD, Kim JY. et al. Photodynamic therapy using a protease-mediated theranostic agent reduces cathepsin-B activity in mouse atheromata in vivo. Aterioscler Thromb Vasc Biol. 2013;33:1360-5
18. Mamlouk MD, Tsai FY, Drachman D. et al. Cerebral thromboembolism: value of susceptibility-weighted imaging in the initial diagnosis of acute infarction. Neuroradiol J. 2012;25:45-56
19. Diamond SL, Anand S. Inner clot diffusion and permeation during fibrinolysis. Biophys J. 1993;65:2622-43
20. Applegate RJ. Optimal therapy for ST-segment elevation myocardial infarction: the role of residual thrombus. J Am Coll Cardiol. 2011;57:1874-6
21. Dutta P, Courties G, Wei Y. et al. Myocardial infarction accelerates atherosclerosis. Nature. 2012;487:325-9
22. Kim BJ, Park JM, Kang K. et al. Case chacteristics, hyperacute treatment, and outcome information from the clinical research center for stroke-fifth division regisgry in South Korea. J Stroke. 2015;17:38-53
23. Mehta BP, Nogueira RG. Should clot composition affect choice of endovascular therapy? Neurology. 2012;79:S63-7
24. Jang IK, Gold HK, Ziskind AA. et al. Differential sensitivity of erythrocyte-rich and platelet-rich arterial thrombi to lysis with recombinant tissue-type plasminogen activator. A possible explanation for resistance to coronary thrombolysis. Circulation. 1989;79:920-8
25. Reed GL, Houng AK. The contribution of activated factor XIII to fibrinolytic resistance in experimental pulmonary embolism. Circulation. 1999;99:299-304
26. Jha B, Kothari M. Pearls & oy-sters: hyperdense or pseudohyperdense MCA sign: a Damocles sword? Neurology. 2009;72:e116-7
27. Liebeskind DS, Sanossian N, Yong WH. et al. CT and MRI early vessel signs reflect clot composition in acute stroke. Stroke. 2011;42:1237-43
28. Anderson NG, Butler AP, Scott NJ. et al. Spectroscopic (multi-energy) CT distinguishes iodine and barium contrast material in MICE. Eur Radiol. 2010;20:2126-34
29. Kodiha M, Wang YM, Hutter E. et al. Off to the organelles - killing cancer cells with targeted gold nanoparticles. Theranostics. 2015;5:357-70
Author contact
![]() Corresponding authors: Dong-Eog Kim (kdongeogorg), Molecular Imaging and Neurovascular Research Laboratory, Dongguk University Ilsan Hospital, 814 Siksa-dong, Goyang, South Korea. (Tel +82-31-961-7211; Fax +82-31-961-7212) or Kwangmeyung Kim (kimre.kr), Biomedical Research Center, Korea Institute of Science and Technology, 5 Hwarang-ro, Seoul, South Korea.
Corresponding authors: Dong-Eog Kim (kdongeogorg), Molecular Imaging and Neurovascular Research Laboratory, Dongguk University Ilsan Hospital, 814 Siksa-dong, Goyang, South Korea. (Tel +82-31-961-7211; Fax +82-31-961-7212) or Kwangmeyung Kim (kimre.kr), Biomedical Research Center, Korea Institute of Science and Technology, 5 Hwarang-ro, Seoul, South Korea.